
The Interaction between Anesthetic Isoflurane and Model-Biomembrane Monolayer Using Simultaneous Quartz Crystal Microbalance (QCM) and Quartz Crystal Impedance (QCI) Methods
 and
and
Abstract
:1. Introduction
2. Experimental
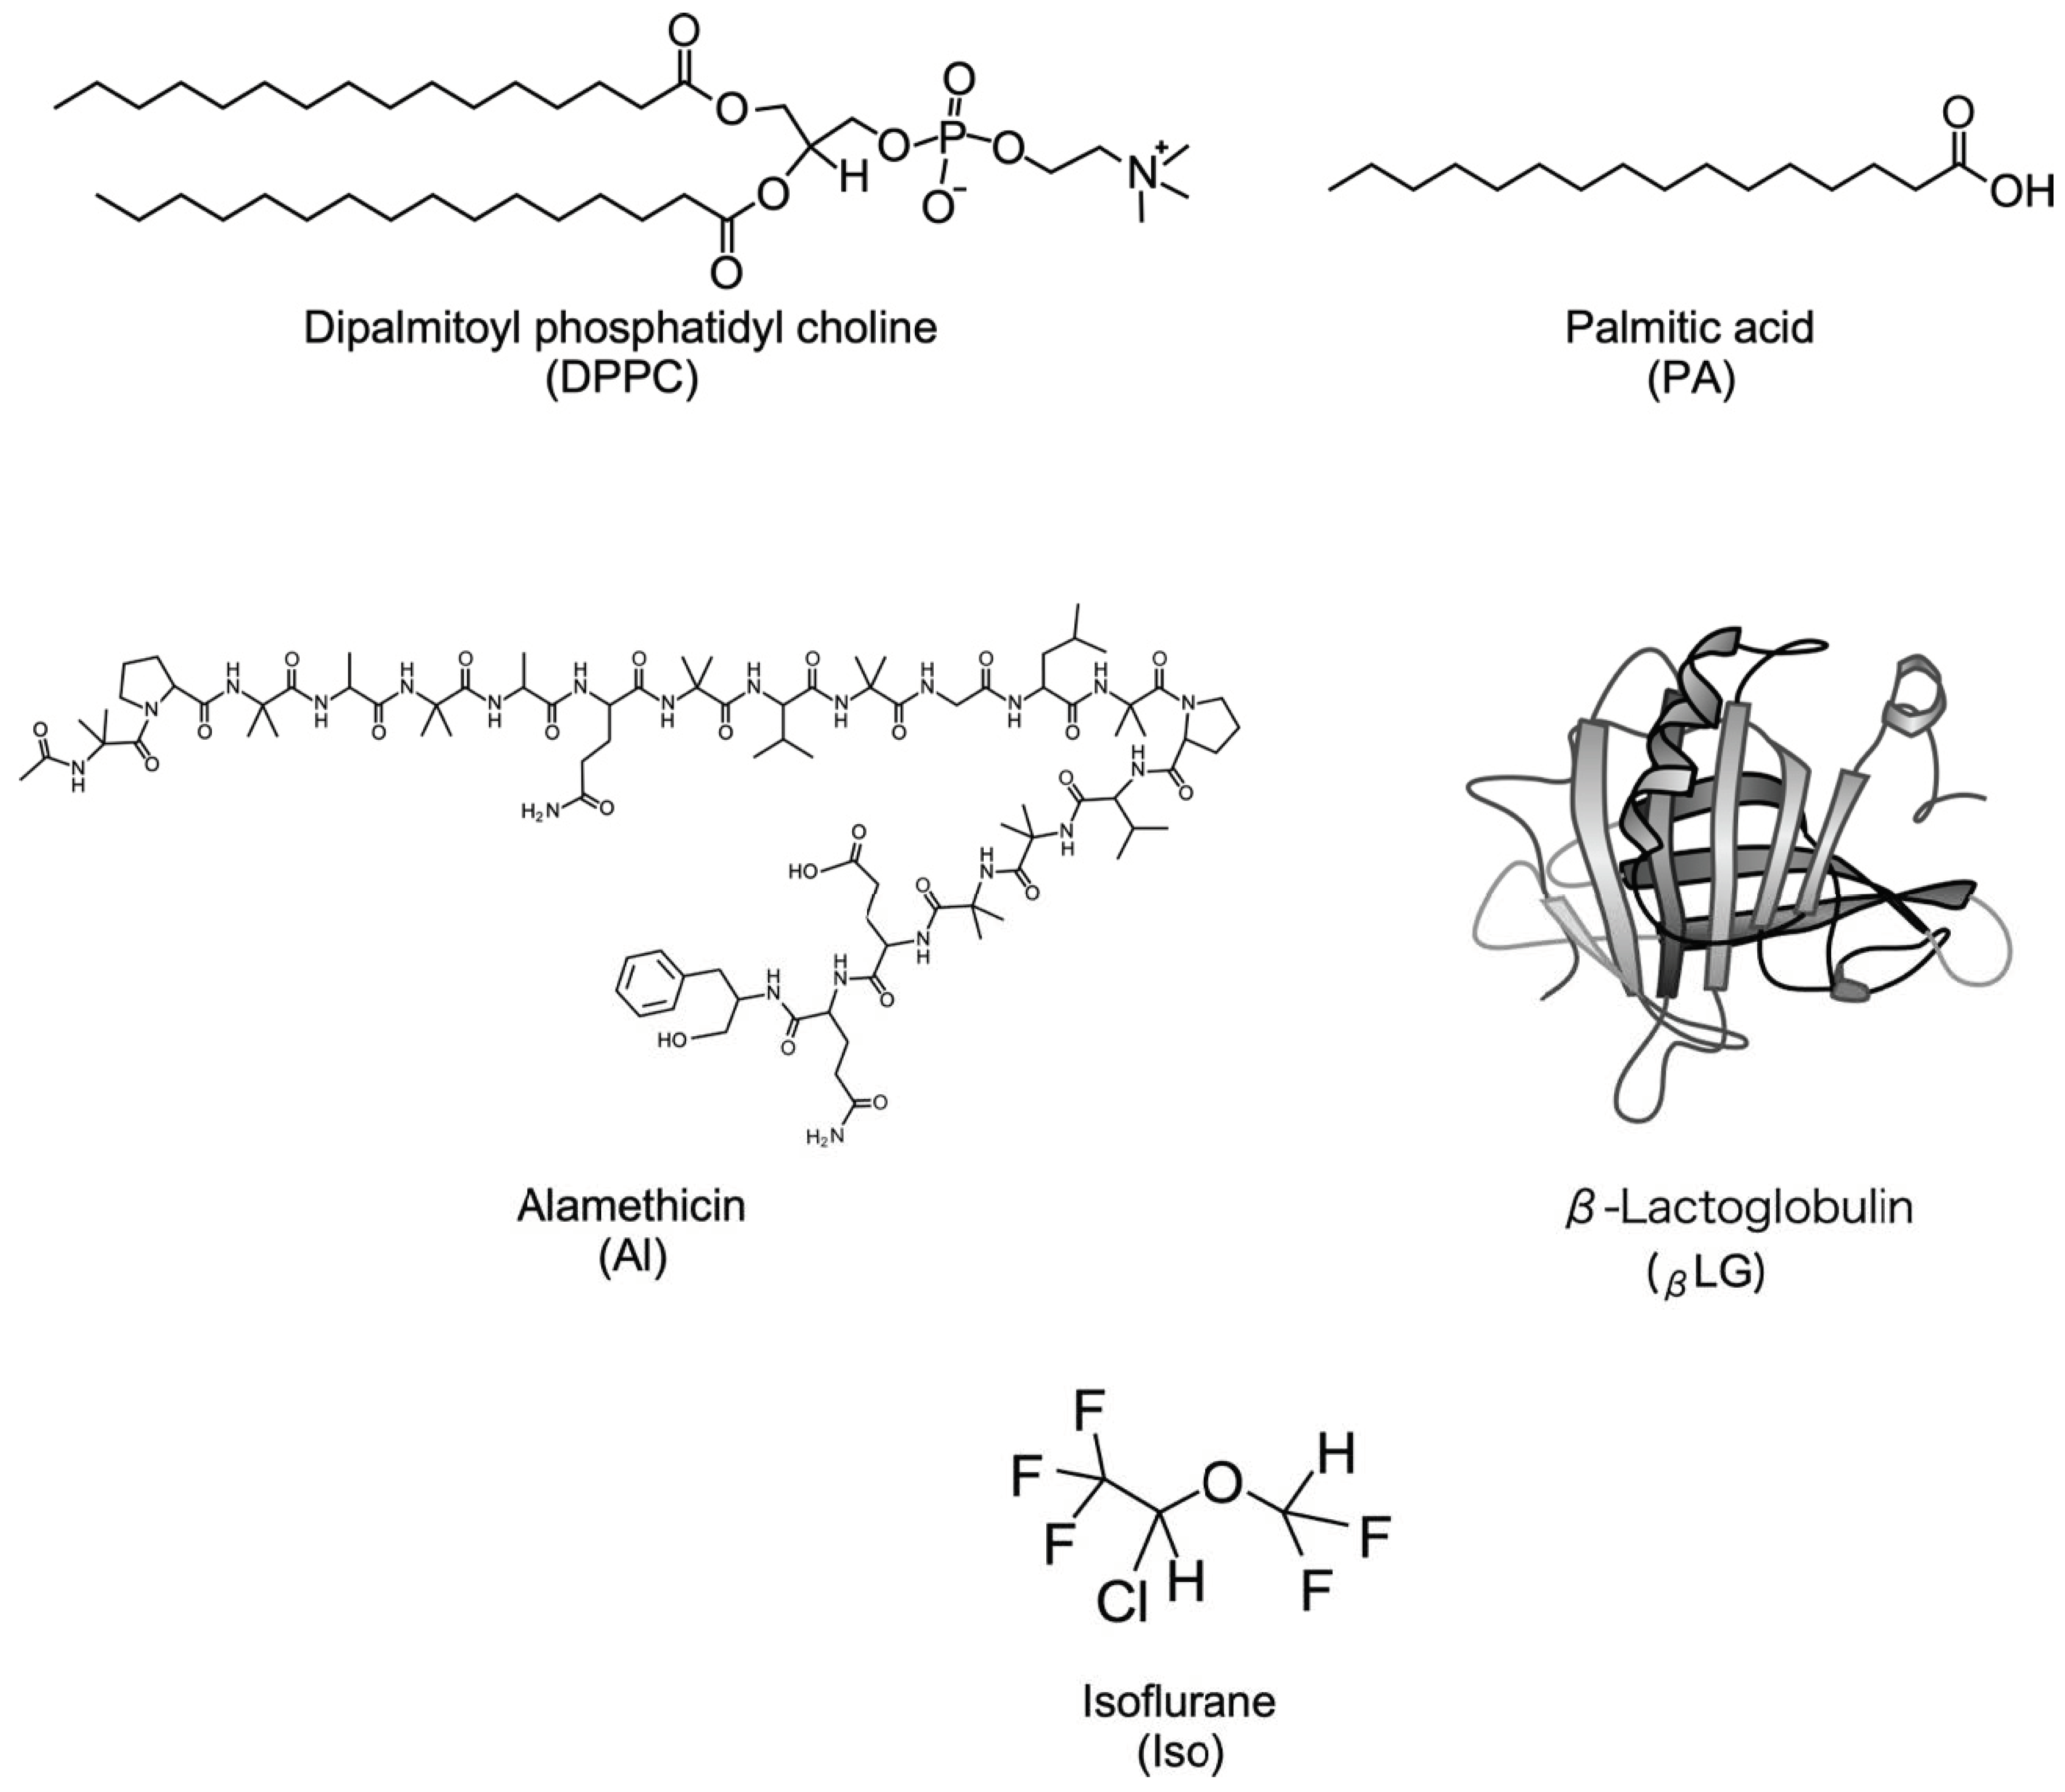
2.1. Materials
2.2. Monolayer Formation
2.3. Methods
2.3.1. Surface Tension Measurement (STm) and Apparatus
2.3.2. Quartz Crystal Oscillator (QCO) Method and Apparatus
3. Results and Discussion
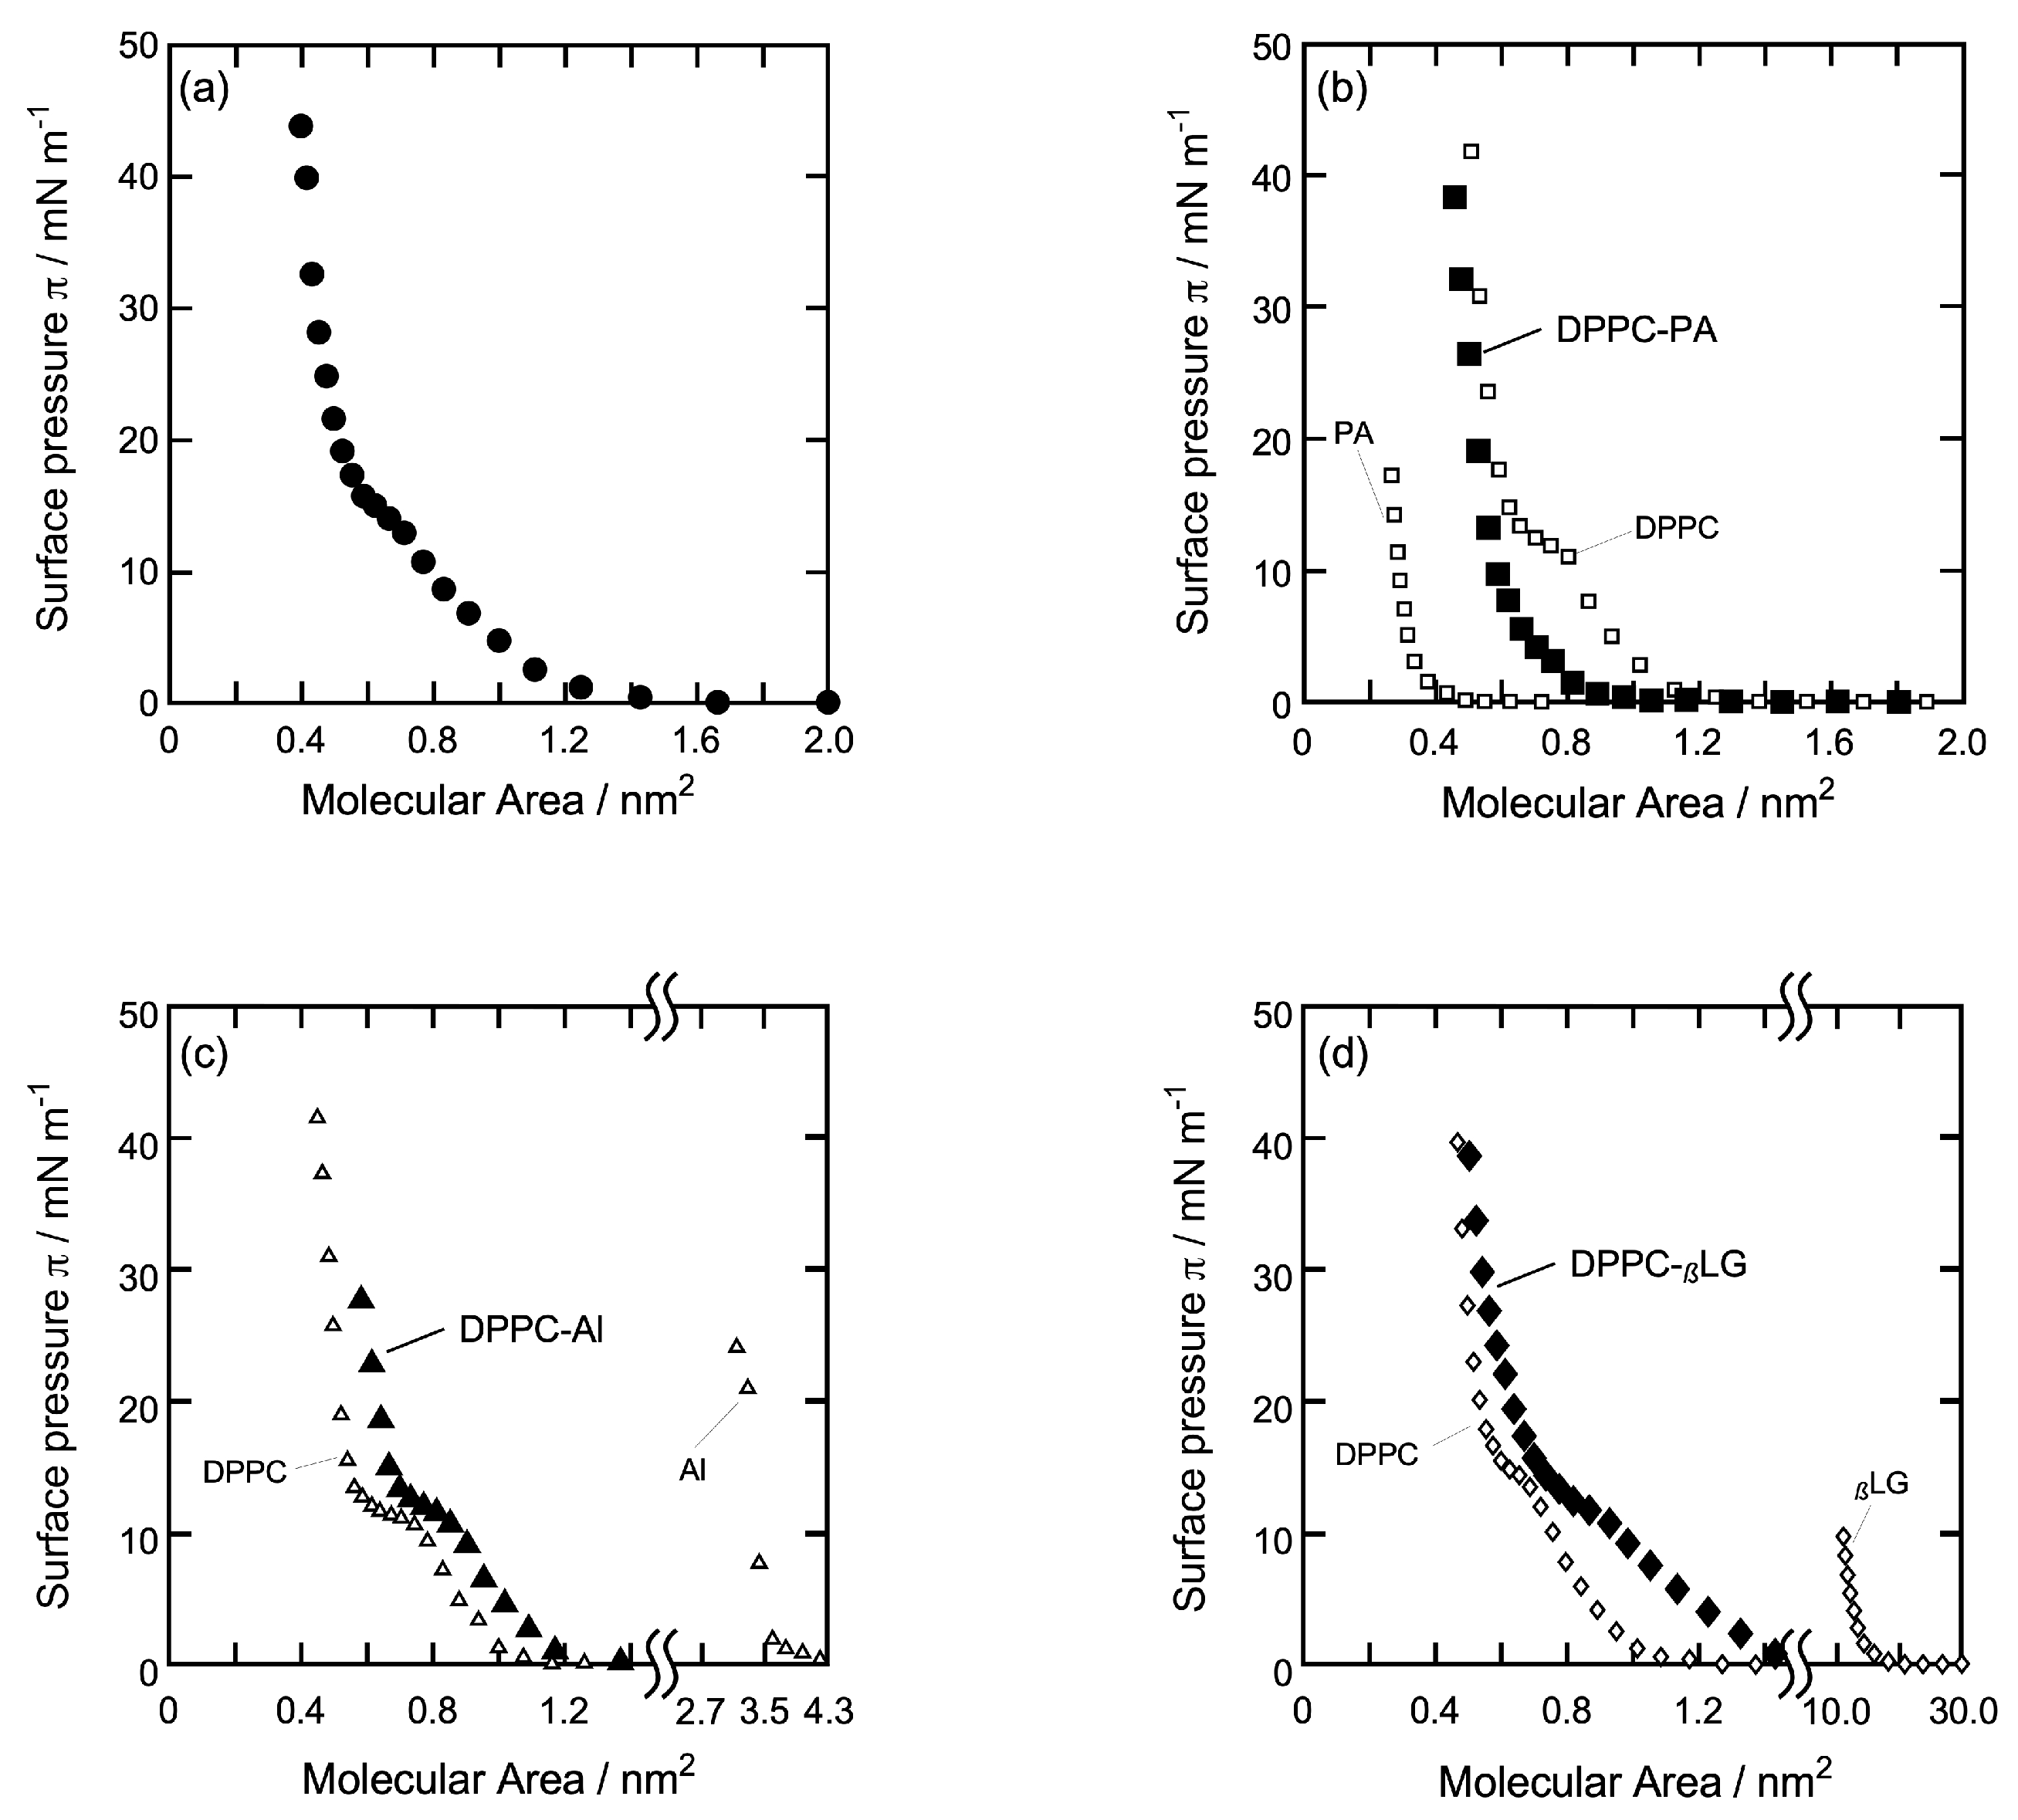
3.1. π-A Isotherm Curve of Each Monolayer
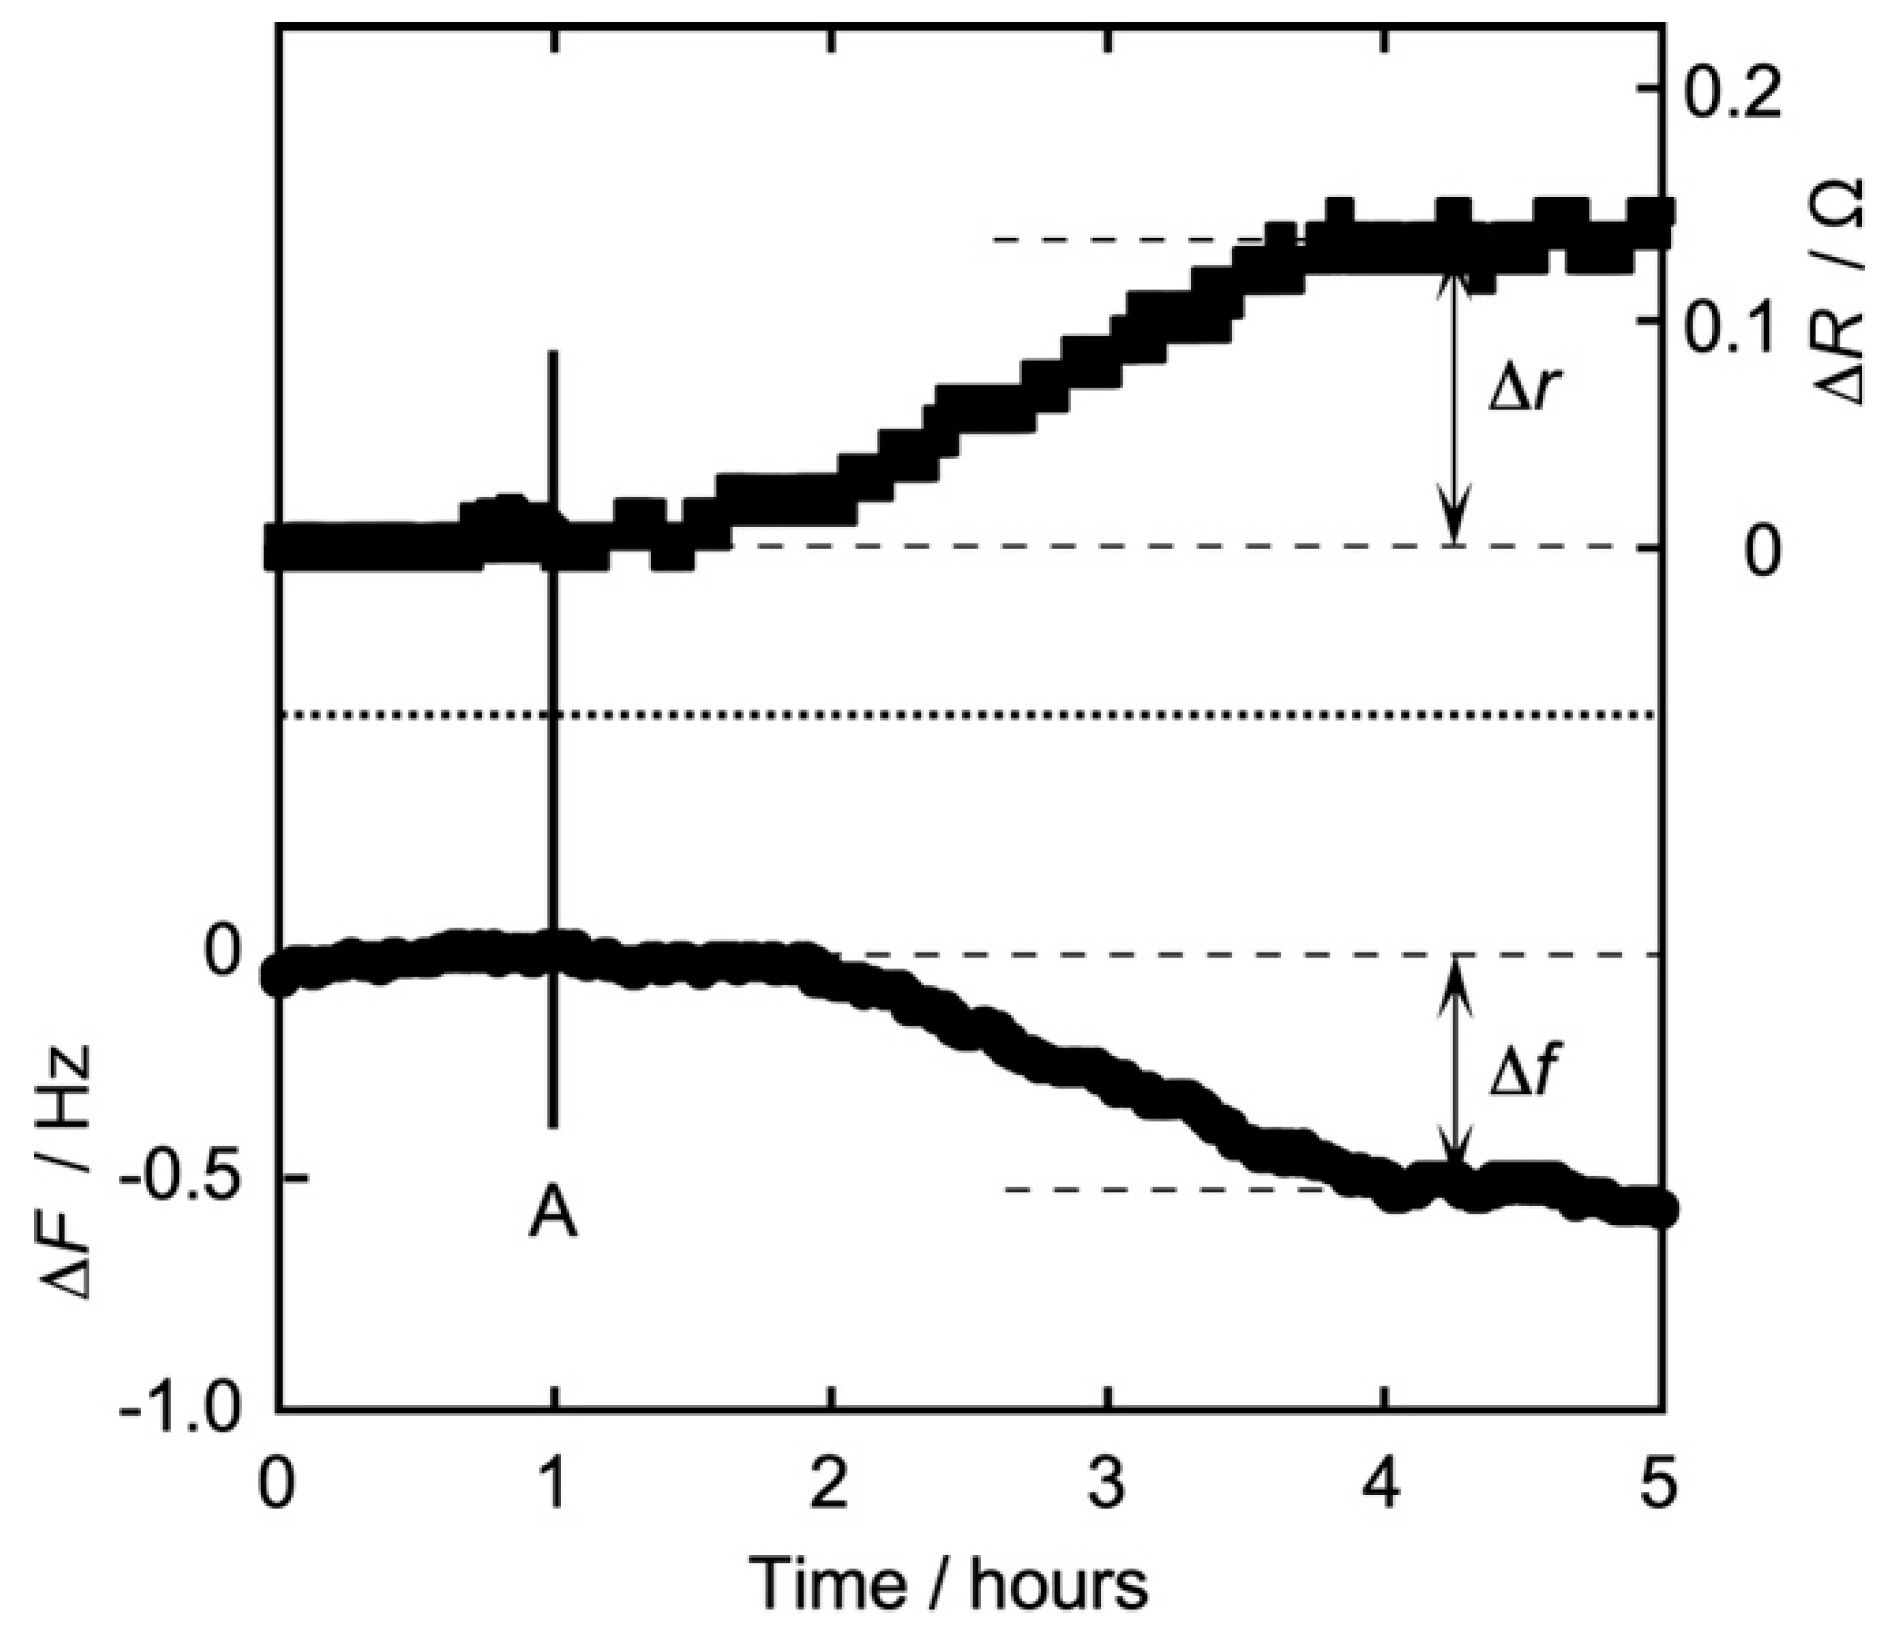
3.2. Time Dependence of Frequency (QCM) and Resistance (QCI) on the Action of Iso on the DPPC Monolayer
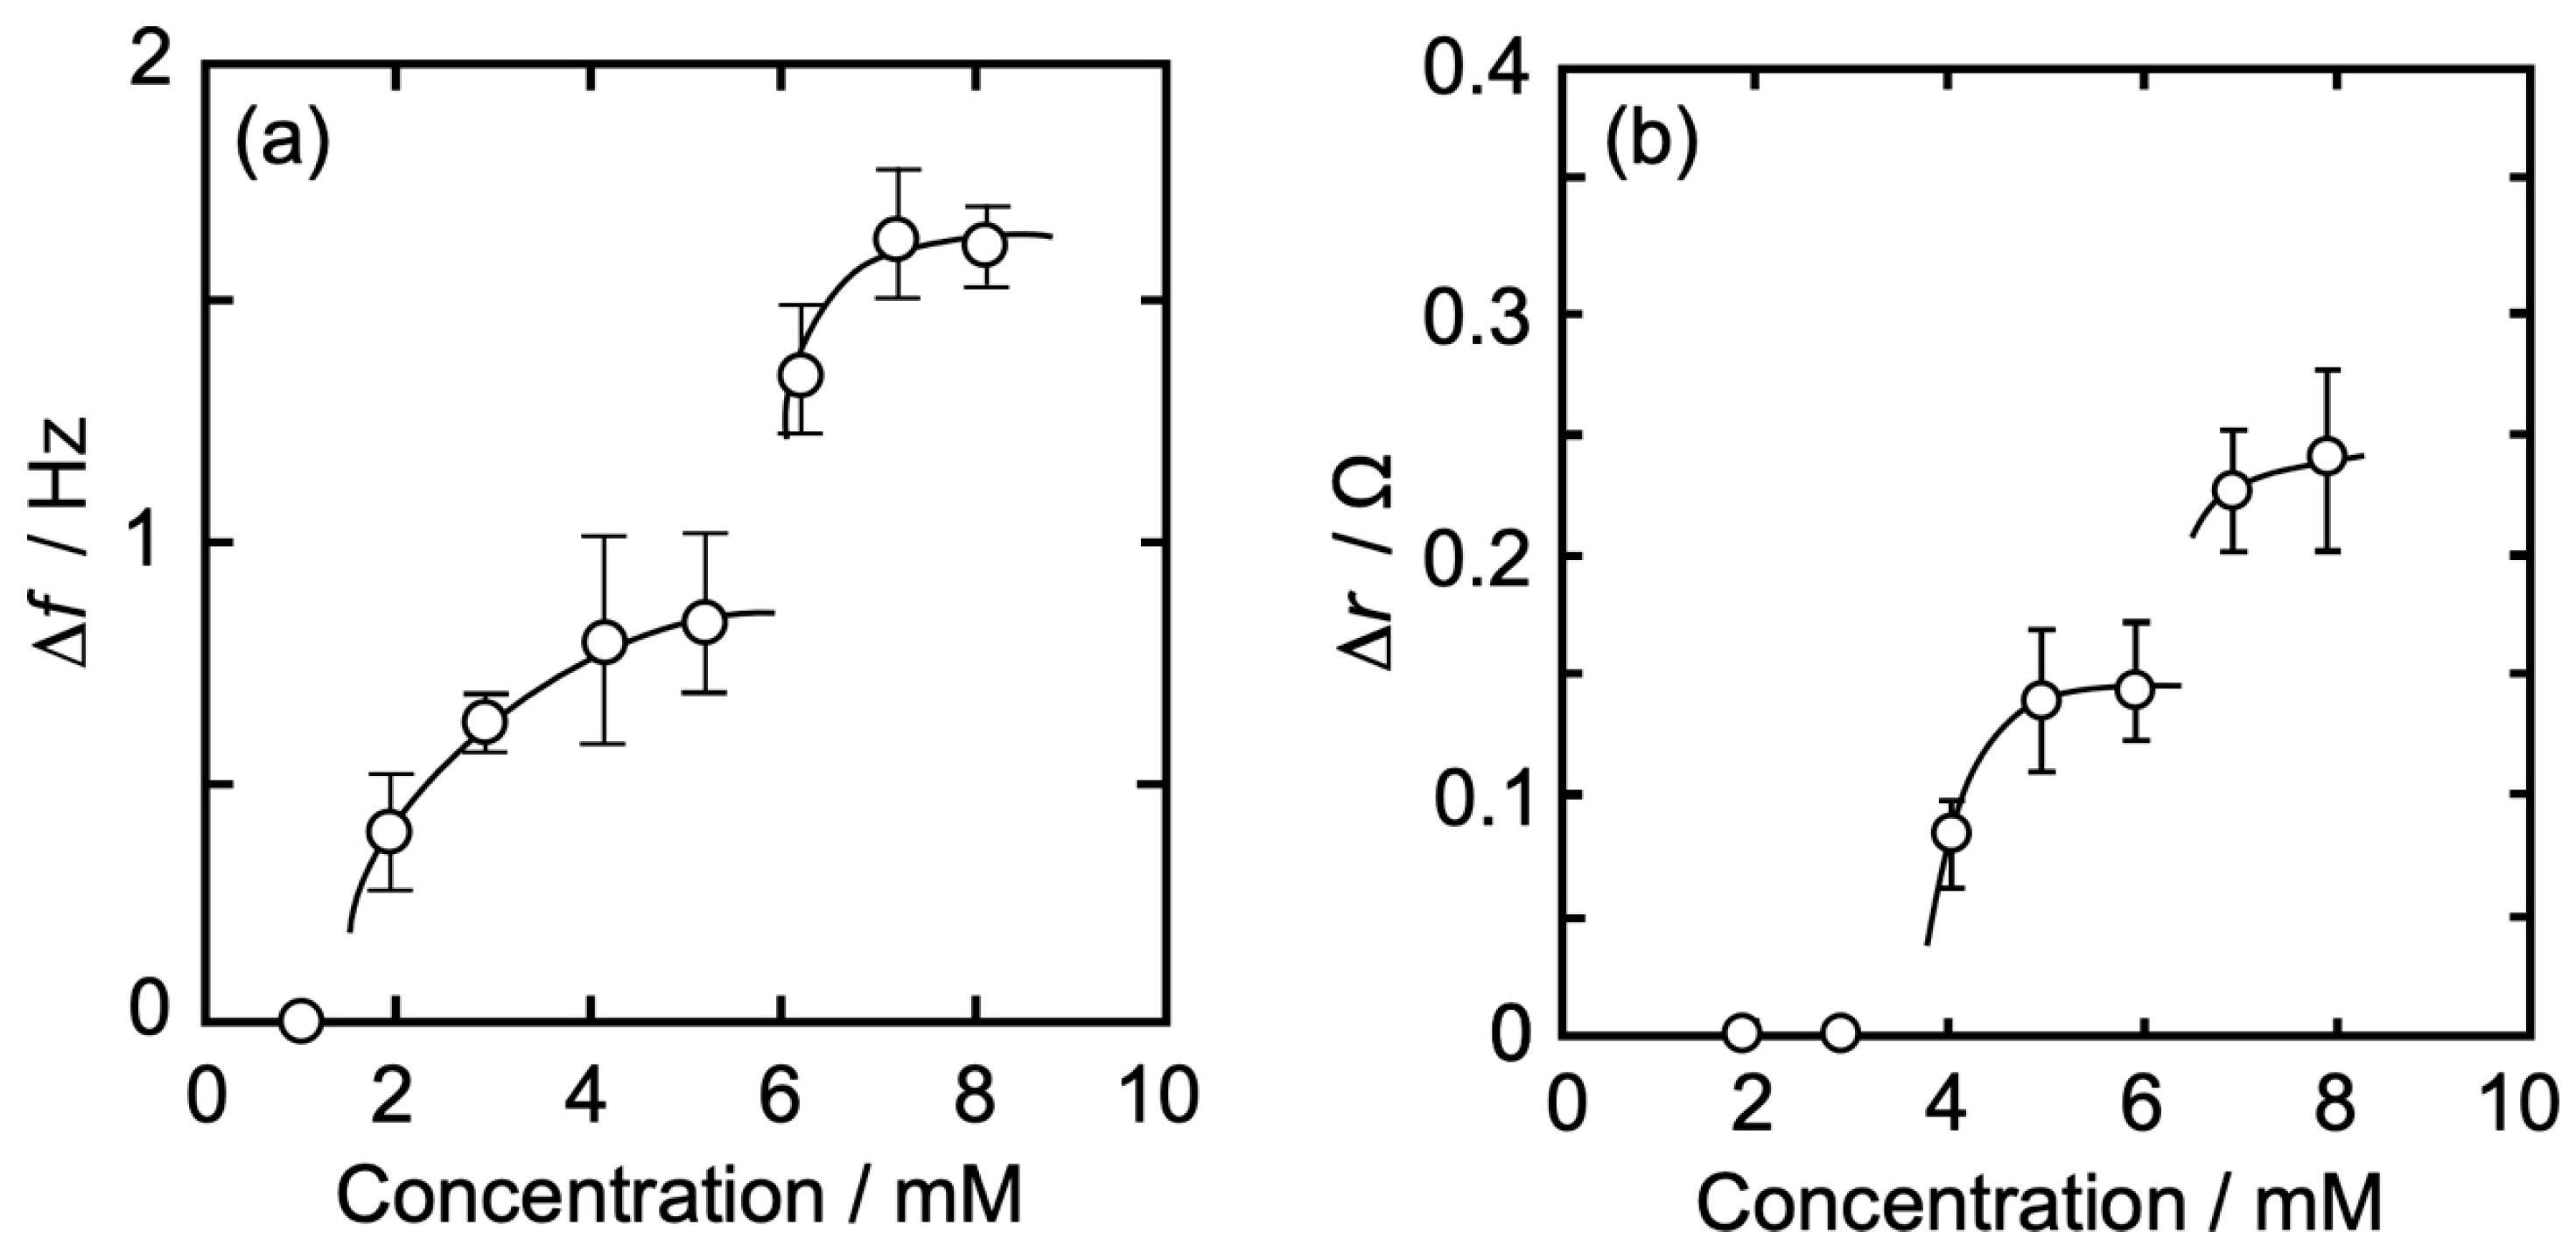
3.3. Concentration Dependence of Δf and Δr on the Action of Iso to Each Monolayer
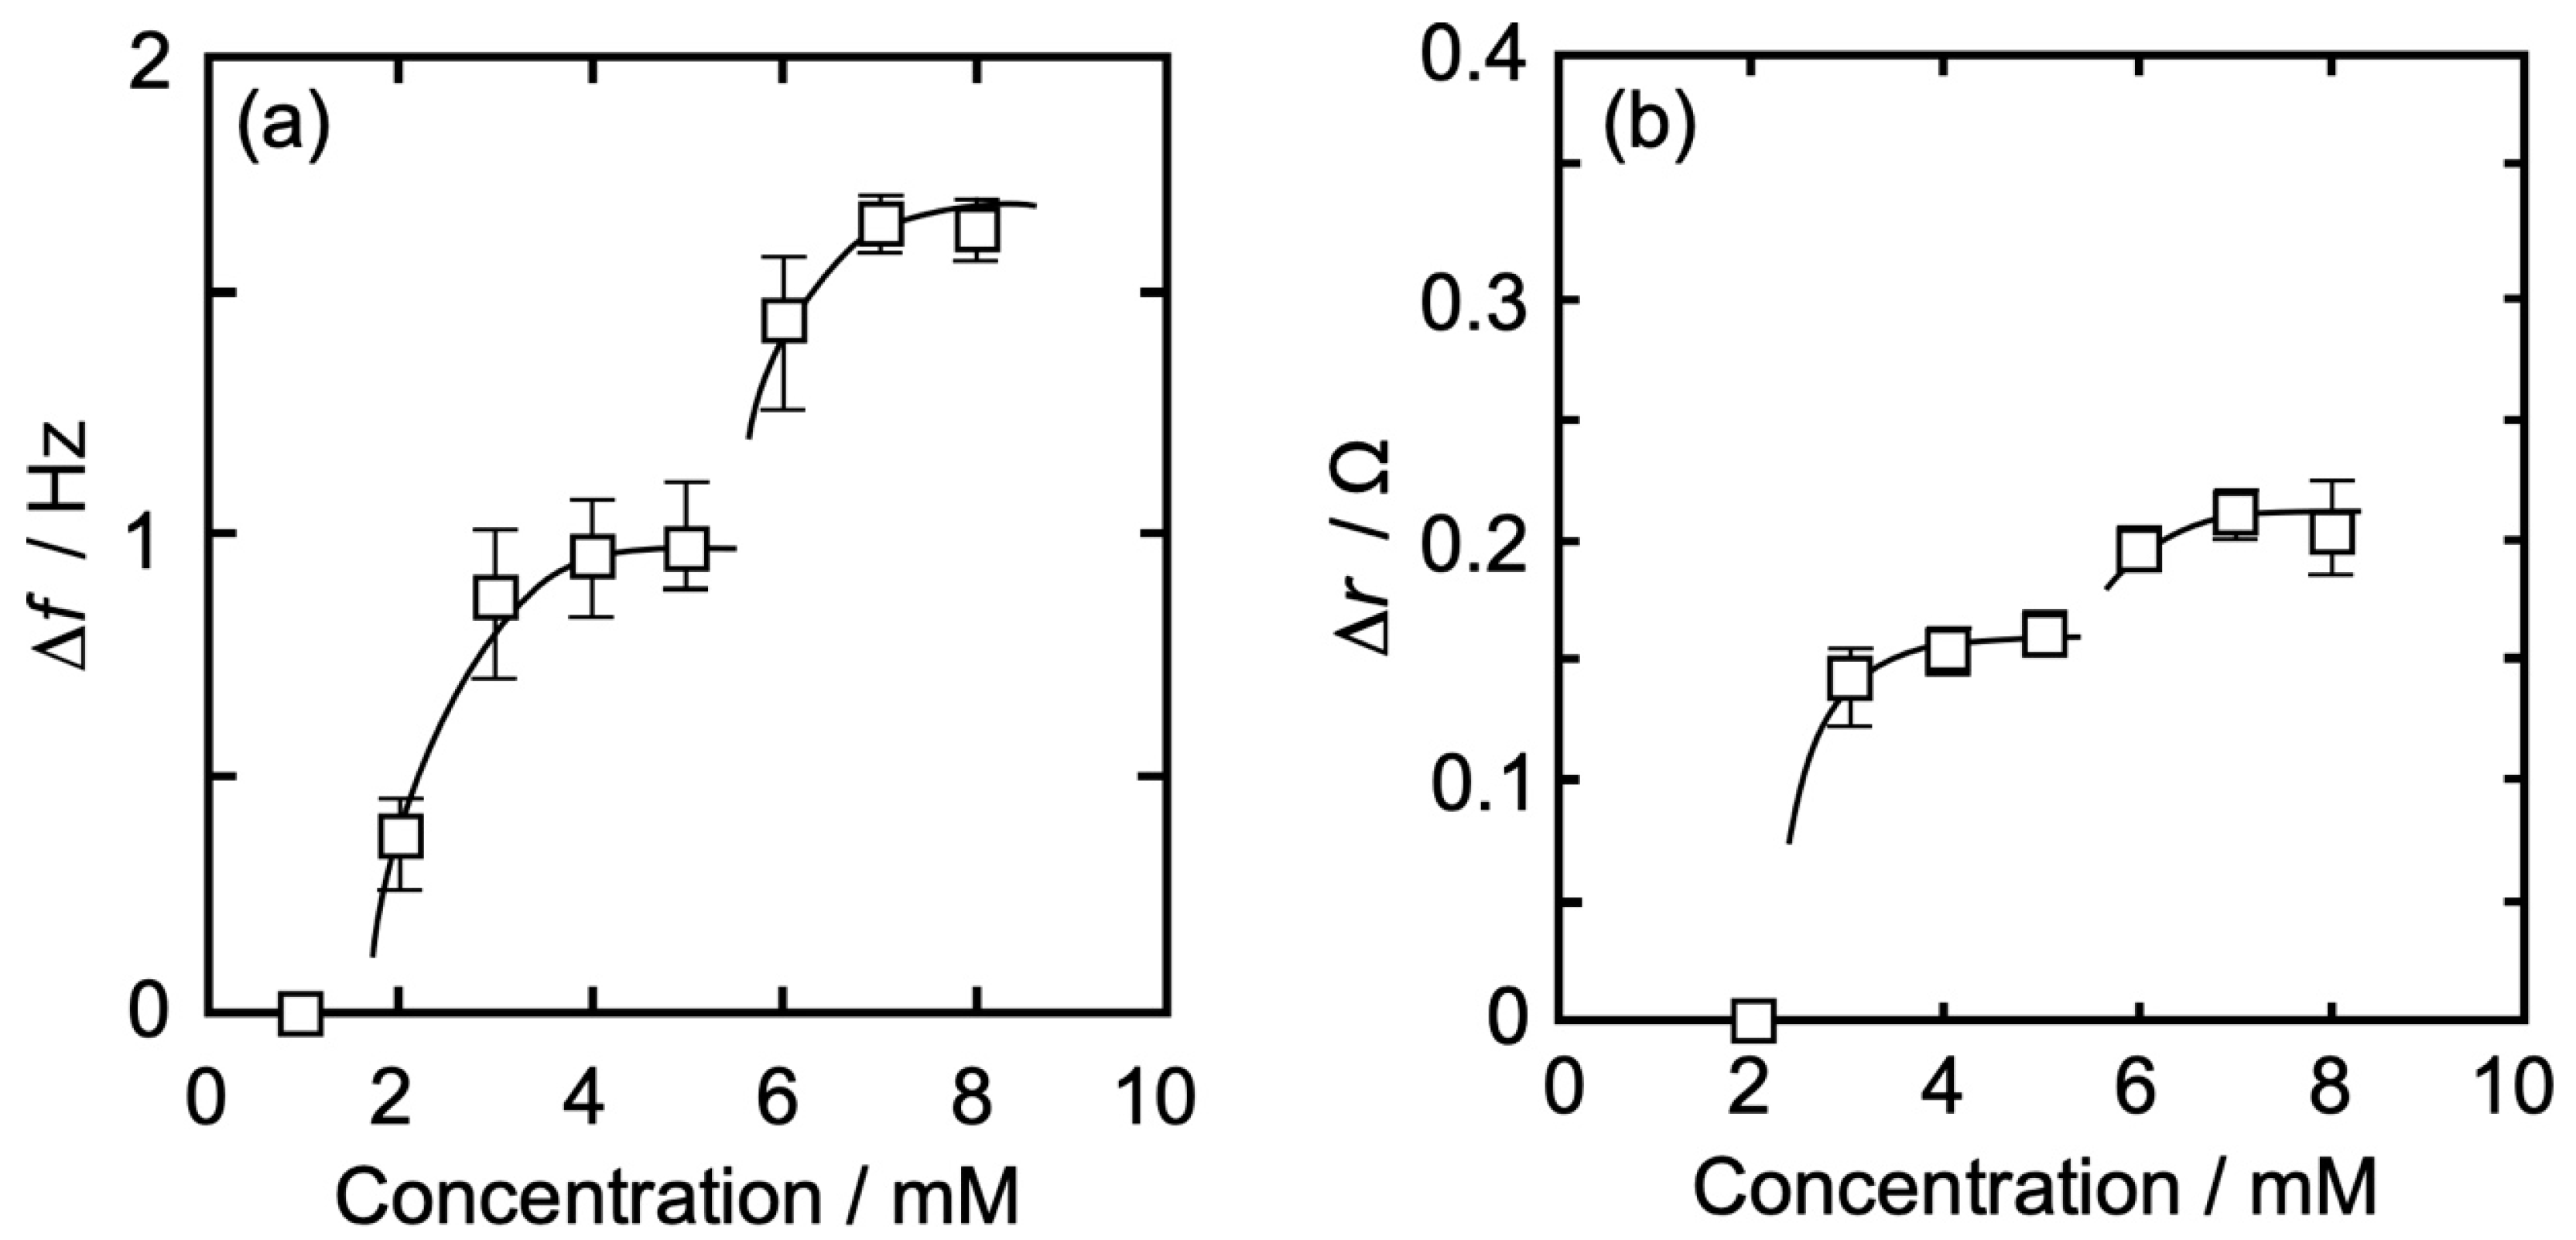
3.3.1. DPPC Monolayer
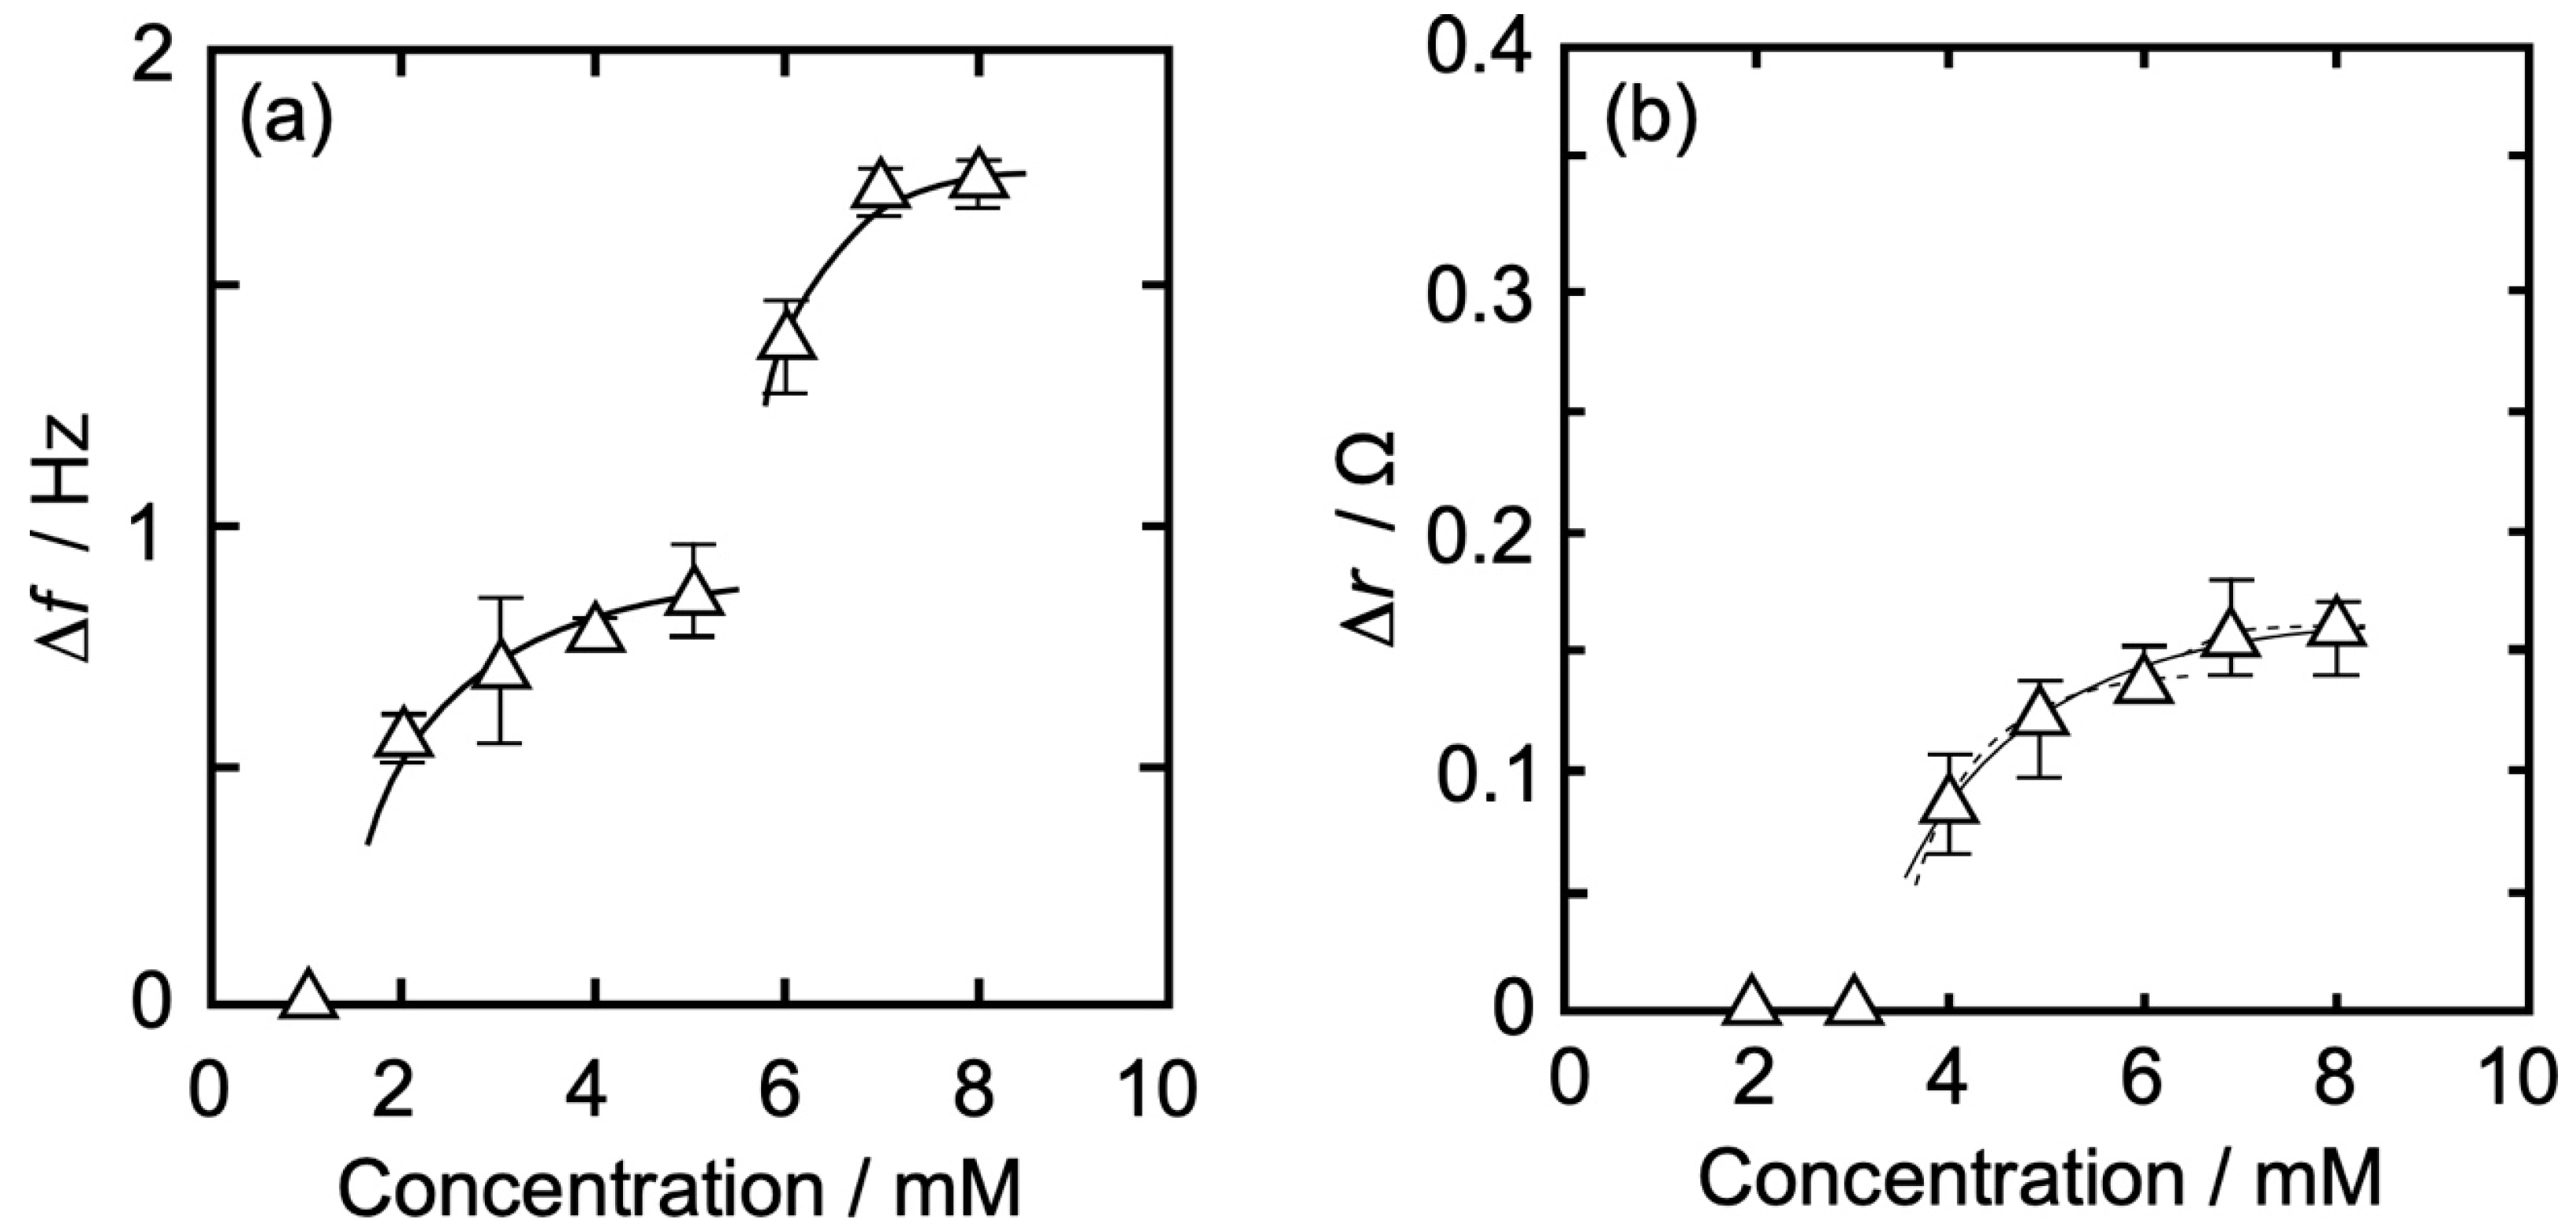
3.3.2. DPPC-PA Mixed Monolayer
3.3.3. DPPC-Al Mixed Monolayer
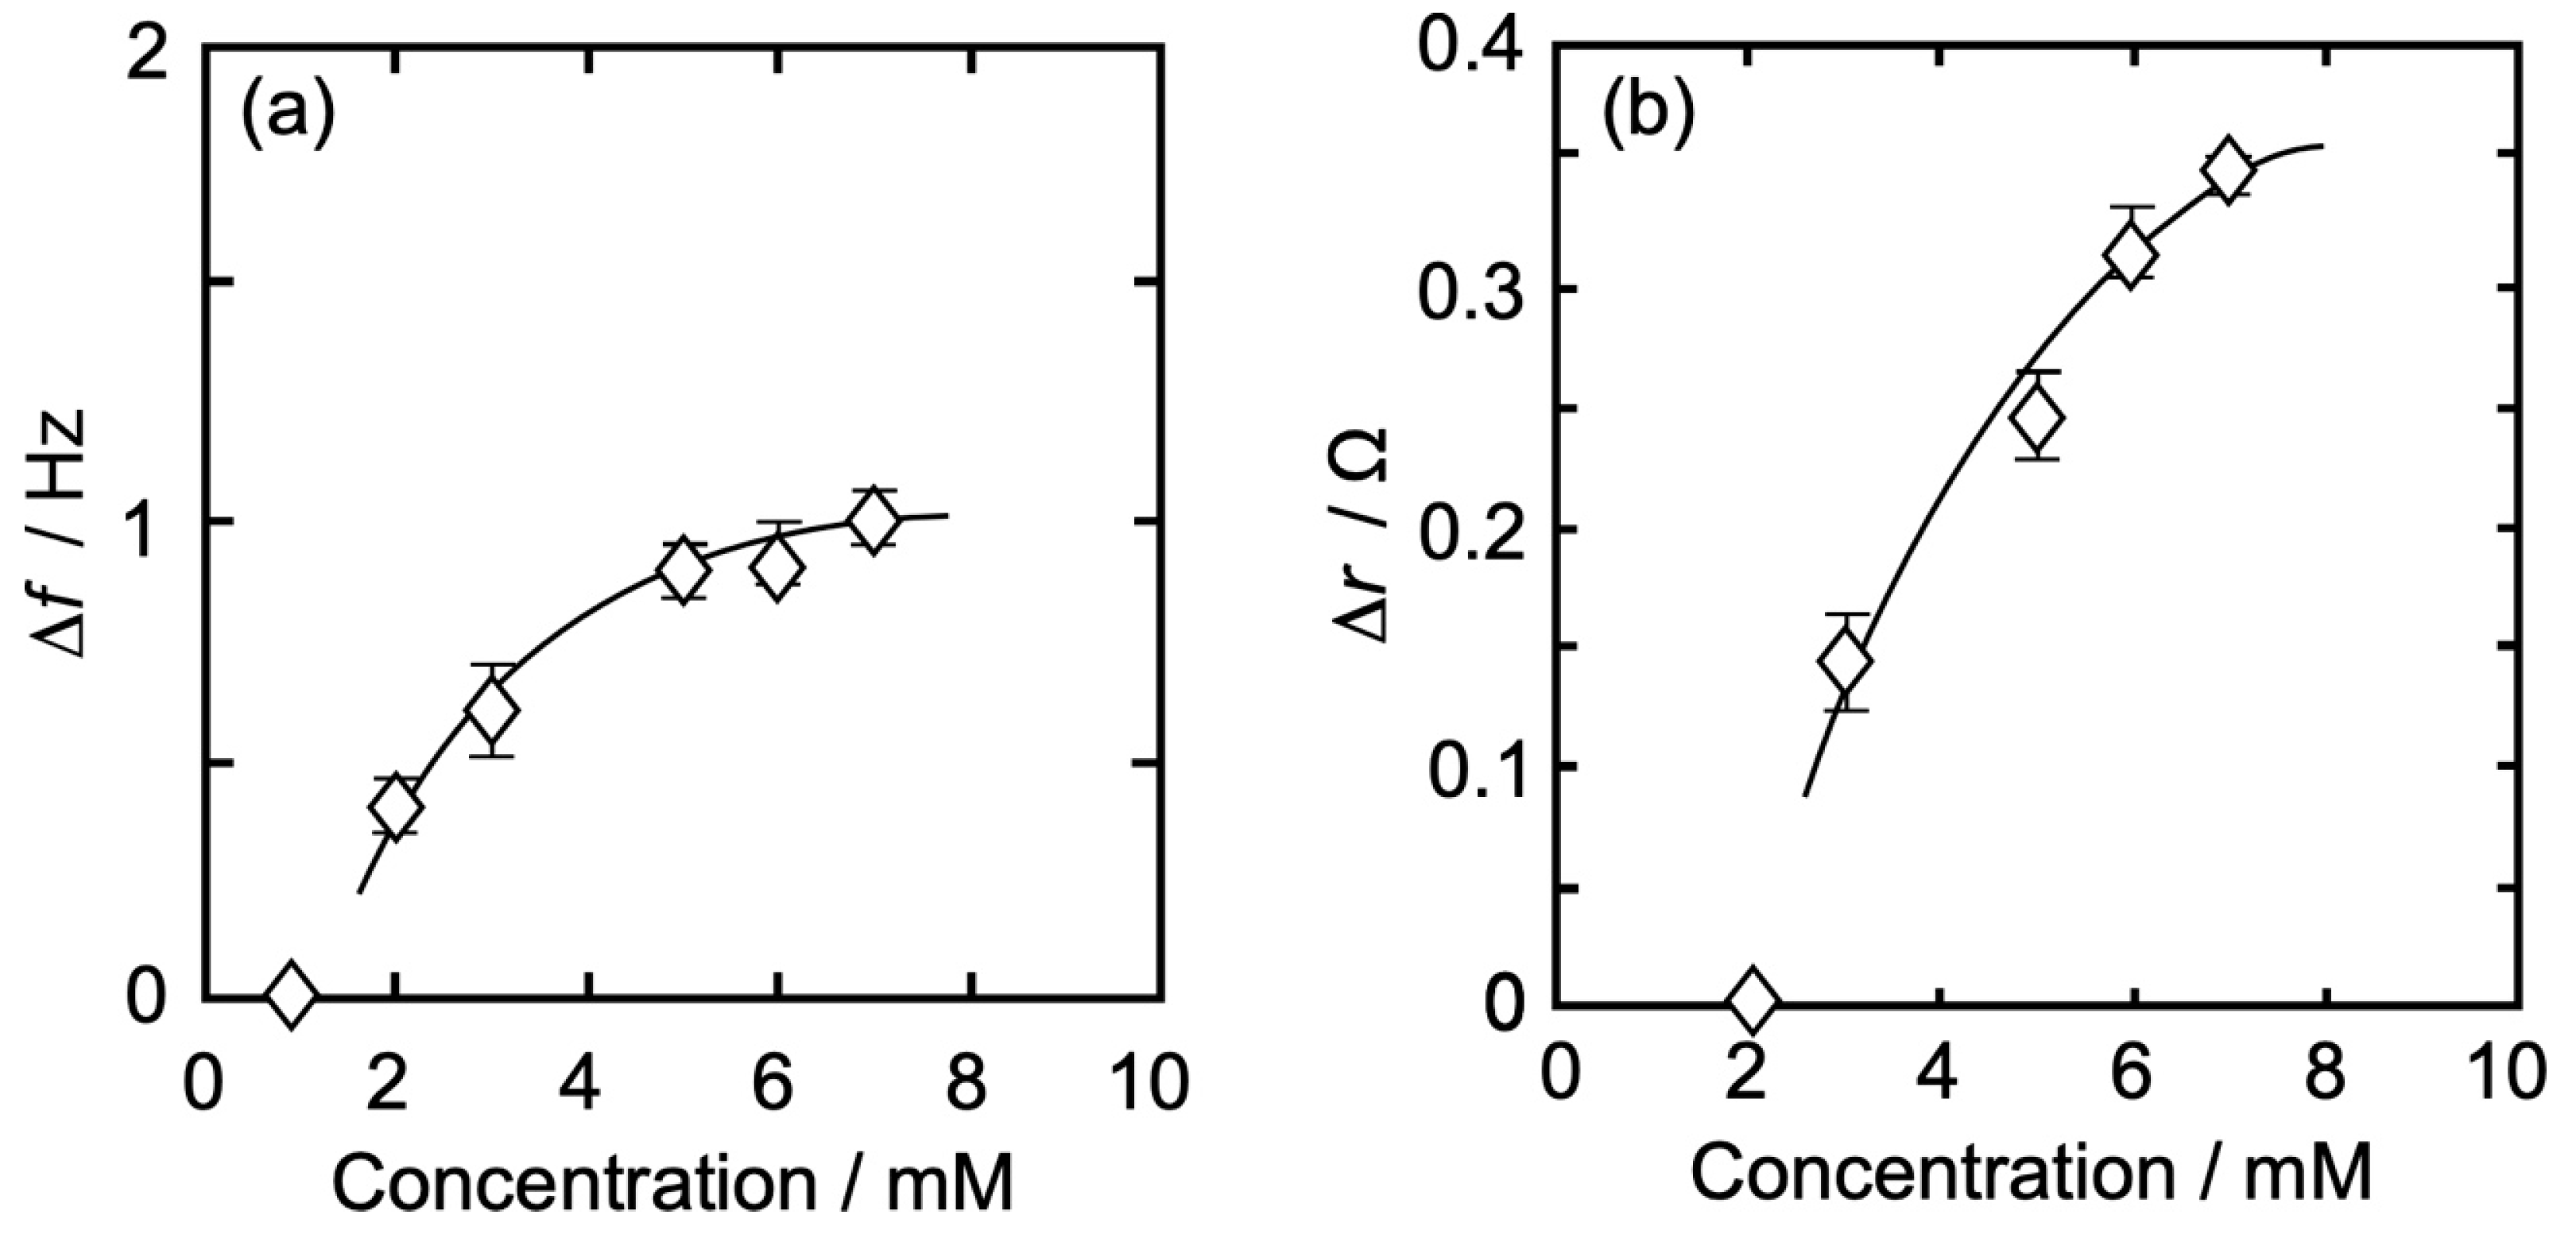
3.3.4. DPPC-βLG Mixed Monolayer
3.4. Interaction between Isoflurane and Each Monolayer
3.4.1. DPPC Monolayer
3.4.2. DPPC-PA Mixed Monolayer
3.4.3. DPPC-Al Mixed Monolayer
3.4.4. DPPC-βLG Mixed Monolayer
4. Conclusions
Author Contributions
Funding
Data Availability Statement
Conflicts of Interest
References
- Meyer, H.H. Therories der alkoholnarkose. Naunyn-Schmiedeberg’s Arch. Exp. Athol. Pharmakol. 1899, 42, 109–118. [Google Scholar] [CrossRef]
- Overton, E. Studien uber Die Narkose: Zugleich ein Beitrag zur Allgemeinen Pharmakologie; Verlag von Gustav Fischer: Jena, Germany, 1901. [Google Scholar]
- Arai, T. Lectures for Anesthesia and Resuscitation; Kokuseido Co. Ltd.: Tokyo, Japan, 2001. [Google Scholar]
- Yoshimura, N. Standard Anesthesia Science; Igaku-Shoin Ltd.: Tokyo, Japan, 2002. [Google Scholar]
- Hyodo, M. Anesthesiology 11 Rev; Kinpodo Inc.: Kyoto, Japan, 2006. [Google Scholar]
- Miller, P.S.; Aricescu, A.R. Crystal structure of a human GABAA receptor. Nature 2014, 512, 270–275. [Google Scholar] [CrossRef] [PubMed]
- Pavel, M.A.; Petersen, E.N.; Wang, H.; Lerner, R.A.; Hansen, S.B. Studies on the mechanism of general anesthesia. Proc. Natl. Acad. Sci. USA 2020, 117, 13757–13766. [Google Scholar] [CrossRef] [PubMed]
- Spector, A.A.; Yorek, M.A. Membrane lipid composition and cellular function. J. Lipid. Res. 1985, 26, 1015–1035. [Google Scholar] [CrossRef] [PubMed]
- Takahashi, H.; Yasue, T.; Ohki, K.; Hatta, I. Structure and phase behaviour of dimyristoylphosphatidic acid/poly(L-lysine) systems. Mol. Membr. Biol. 1996, 13, 233–240. [Google Scholar] [CrossRef] [PubMed]
- Gellman, S.H. Introduction: Molecular recognition. Chem. Rev. 1997, 97, 1231–1232. [Google Scholar] [CrossRef] [PubMed]
- Okamura, Y.; Nakamura, M. NMR study directly determining drug delivery sites in phospholipid bilayer membranes. J. Phys. Chem. B 1999, 103, 3505–3509. [Google Scholar] [CrossRef]
- Schramm, L.L.; Stasiuk, E.N.; Marangoni, D.G. Surfactants and their applications. Annu. Rep. Prog. Chem. Sect. C Phys. Chem. 2003, 99, 3–48. [Google Scholar] [CrossRef]
- Suezaki, Y. Physics of Lipid Membrane; Kyusyu University Press: Fukuoka, Japan, 2007. [Google Scholar]
- Meer, V.M.; Voelker, D.R.; Feigenson, G.W. Membrane lipids: Where they are and how they behave. Nat. Rev. Mol. Cell. Biol. 2008, 9, 112–124. [Google Scholar] [CrossRef]
- Nelson, D.L.; Cox, M.M. Lehninger Principles of Biochemistry, 7th ed.; WH Freeman: New York, NY, USA, 2017. [Google Scholar]
- Yamamoto, Y.; Taga, K. Lipid monolayer and interaction with anesthetics. In Encyclopedia of Biocolloid and Biointerface Science 2V Set; Wiley: Hoboken, NJ, USA, 2016; Volume 1. [Google Scholar]
- Shimabayashi, S.; Terada, H.; Okabayashi, H. Seitai Colloid; Hirokawa Pub. Co.: Tokyo, Japan, 1990. [Google Scholar]
- Lin, Z.; Ward, M.D. The Role of Longitudinal Waves in Quartz Crystal Microbalance Applications in Liquids. Anal. Chem. 1995, 67, 685–693. [Google Scholar] [CrossRef]
- Furlong, D.N. Modern Characterization Methods of Surfactant Systems; Marcel Dekker: New York, NY, USA, 1999. [Google Scholar]
- Sauerbrey, G. Verwendung von schwingquarzen zur wung dner schichten und zur mikrowung. Zeit. Phys. 1959, 155, 206–222. [Google Scholar] [CrossRef]
- Nomura, T.; Minemura, A. Behavior of a Piezoelectric Quartz Crystal in an Aqueous Solution and the Application to the Determination of Minute Amount of Cyanide. Chem. Soc. Jpn. 1980, 10, 1621–1625. [Google Scholar]
- Bruckenstein, S.; Shay, M. An in Situ Weighing Study of the Mechanism for the Formation of the Adsorbed Oxygen Monolayer at a Gold Electrode. J. Electroanal. Chem. 1985, 188, 131–136. [Google Scholar] [CrossRef]
- Aoki, K.; Miyamoto, T.; Ohsawa, Y. The Determination of the Selectivity Coefficient of Na+ versus Li+ on Prussian Blue Thin Film in Propylene Carbon-Ate by Means of a Quartz Crystal Microbalance. Bull. Chem. Soc. Jpn. 1989, 62, 1658–1659. [Google Scholar] [CrossRef]
- Ebara, Y.; Okahata, Y. A Kinetic Study of Concanavalin: A Binding to Glycolipid Monolayers by Using a Quartz Crystal Microbalance. J. Am. Chem. Soc. 1994, 116, 11209–11212. [Google Scholar] [CrossRef]
- Sato, T.; Serizawa, T.; Ohtake, F.; Nakamura, M.; Terabayashi, T.; Kawanishi, Y.; Okahata, Y. Quantitative Measurements of the Interaction between Monosialoganglioside Monolayers and Wheat Germ Agglutinin (WGA) by a Quartz Crystal Microbalance. Biochim. Biophys. Acta 1998, 1380, 82–92. [Google Scholar] [CrossRef]
- Matsuno, H.; Furusawa, H.; Okahata, Y. Kinetic Studies of DNA Cleavage Reactions Catalyzed by an ATP-Dependent Deoxyribonuclease on a 27-MHz Quartz-Crystal Microbalance. Biochemistry 2005, 44, 2262–2270. [Google Scholar] [CrossRef] [PubMed]
- Buttry, D.A.; Ward, M.D. Measurement of Interfacial Processes at Electrode Surfaces with the Electrochemical Quartz Crystal Microbalance. Chem. Rev. 1992, 92, 1355–1379. [Google Scholar] [CrossRef]
- Tatsuma, T.; Oyama, N. Suishoushindousi niyoru kotaihyoumen no kyarakutarizetion to sono DNA ken-syutu heno ouyou. Tyou. TECH. 1993, 5, 33–36. [Google Scholar]
- Muramatsu, H.; Kimura, K. Quartz Crystal Detector for Microrheological Study and Its Application to Phase Transition Phenomena of Langmuir-Blodgett Films. Anal. Chem. 1992, 64, 2502–2507. [Google Scholar] [CrossRef]
- Yuan, Y.; Cai, Y.; Zie, Q.; Yao, S. Piezoelectric Quartz Crystal Impedance Study of the Pb2+-Induced Precipitation of Bovine Serum Albumin and Its Dissolution with EDTA in an Aqueous Solution. Anal. Sci. 2002, 18, 767–771. [Google Scholar] [CrossRef]
- Xie, Q.; Xiang, C.; Zhang, Y.; Yuan, Y.; Liu, M.; Nie, L.; Yao, S. In Situ Monitoring of Gold-Surface Adsorption and Acidic Denaturation of Human Serum Albumin by an Isolation-Capacitance-Adopted Electrochemical Quartz Crystal Impedance System. Anal. Chim. Acta 2002, 464, 65–77. [Google Scholar] [CrossRef]
- Mingotaud, A.F.; Mingotaud, C.; Patterson, L.K. Handbook of Monolayers; Academic Press: San Diego, CA, USA, 1993; Volumes 1 and 2. [Google Scholar]
- Gennis, R.B. Biomembrane, Molecular Structure and Function; Springer: New York, NY, USA, 1990. [Google Scholar]
- Nagano, T.; Mishima, D.; Javkhlantugs, N.; Wang, J.; Ishioka, D.; Yokota, K.; Norisada, K.; Kawamura, I.; Ueda, K.; Naito, A. Structure and orientation of antibiotic peptide Alamethicin in phospholipid bilayers as revealed by chemical shift oscillation analysis of solid state nuclear magnetic resonance and molecular dynamics simulation. Biochim. Biophys. Acta 2015, 1848, 2789–2798. [Google Scholar] [CrossRef]
- Kontopidis, G.; Holt, C.; Sawyer, L. β-Lactoglobulin: Binding Properties, Structure, and Function. J. Dairy Sci. 2004, 87, 785–796. [Google Scholar] [CrossRef] [PubMed]
- Jost, R. Functional characteristics of dairy proteins. Trends Food Sci. Technol. 1993, 4, 283–288. [Google Scholar] [CrossRef]
- Yoshida, D.; Yokoyama, T.; Shimoaki, T.; Tomita, T.; Yoshida, T.; Yamamoto, Y.; Taga, K.; Sumino, A.; Dewa, T.; Nango, M.; et al. Morphology observation of dipalmitoyl phosphatidyl choline (DPPC) monolayer on water surface by dropping method. J. Biophys. Chem. 2013, 4, 115–121. [Google Scholar] [CrossRef]
- Bijay, K.S.; Sarathi, K. Behaviour of protein (BSA)-lipid (DMPA) mixed monolayer on the spreading order of the individual component. Chem. Phys. Lip. 2019, 225, 104810. [Google Scholar]
- Yamamoto, Y.; Taga, K.; Yoshida, T.; Kamaya, H.; Ueda, I. Action Mechanism of Water Soluble Ethanol on Phospholipid Monolayers Using a Quartz Crystal Oscillator. J. Colloid Interface Sci. 2006, 298, 529–534. [Google Scholar] [CrossRef] [PubMed]
- Yamamoto, Y.; Ando, T.; Takayama, M.; Egami, T.; Ohtsu, Y.; Sakurai, A.; Yoshida, T.; Taga, K.; Kamaya, H.; Ueda, I. Interaction between Phospholipid Monolayer and Volatile Anesthetics Using Quartz Crystal Oscillator Methods. Colloids Surf. A Physicochem. Eng. Asp. 2008, 317, 568–575. [Google Scholar] [CrossRef]
- Yamamoto, Y.; Shervani, Z.; Shimoaki, T.; Yokoyama, T.; Ando, T.; Somekawa, A.; Takayama, M.; Tamaoki, K.; Yoshida, T.; Taga, K.; et al. Physisorption Behavior of Enflurane on the Dipalmitoyl Phosphatidyl Choline (DPPC) Monolayer Using High Sensitive Quartz Crystal Oscillator Method. Colloids Surf. A Physicochem. Eng. Asp. 2010, 367, 47–51. [Google Scholar] [CrossRef]
- Sato, T.; Serizawa, T.; Okahata, Y. Recognition of Monosialoganglioside (GM3) Reconstituted in Sphingomyerin and Glucosylceramide Membranes against Wheat Germ Agglutinin: Quantitative Analyses by a Quartz Crystal Microbalance. Biochem. Biophys. Res. Commun. 1994, 204, 551–556. [Google Scholar] [CrossRef]
- Ebara, Y.; Itakura, K.; Okahata, Y. Kinetic Studies of Molecular Recognition Based on Hydrogen Bonding at the Air-Water Interface by Using a Highly Sensitive Quartz-Crystal Microbalance. Langmuir 1996, 12, 5165–5170. [Google Scholar] [CrossRef]
- Okahata, Y.; Furusawa, H. Gravimetry of Biomolecules at the Water-Substrate Interface Quartz Crystal Microbalance. J. Surf. Sci. Soc. Jpn. 2004, 25, 131–138. [Google Scholar] [CrossRef]
- Singer, S.J.; Nicolson, G.L. The Fluid Mosaic Model of the Structure of Cell Membranes. Science 1972, 175, 720–731. [Google Scholar] [CrossRef]
- Makino, M.; Yoshikawa, K.; Ishii, S. Linear and nonlinear responses of model biomembrane under non-equilibrium conditions Change in membrane properties caused by local anesthetics. Pharm. Tech. Jpn. 1997, 13, 2011–2019. [Google Scholar]
- Ohe, C.; Sasaki, T.; Noi, M.; Goto, Y.; Itoh, K. Sum frequency generation spectroscopic study of the condensation effect of cholesterol on a lipid monolayer. Anal. Bioanal. Chem. 2007, 388, 73–79. [Google Scholar] [CrossRef]
- Daillant, J.; Bosio, L.; Benattar, J.J. X-Ray Reflectivity Study of the Liquid-Expanded Liquid-Condensed Phase Transition. Europhys. Lett. 1990, 12, 715–720. [Google Scholar] [CrossRef]
- Volinsky, R.; Kolusheva, S.; Berman, A.; Jelinek, R. Investigations of antimicrobial peptides in planar film systems. Biochim. Biophys. Acta 2006, 1758, 1393–1407. [Google Scholar] [CrossRef] [PubMed]
- Ye, S.; Nguyen, K.T.; Chen, Z. Interactions of Alamethicin with Model Cell Membranes Investigated Using Sum Frequency Generation Vibrational Spectroscopy in Real Time in Situ. J. Phys. Chem. B 2010, 114, 3334–3340. [Google Scholar] [CrossRef] [PubMed]
- Asada, Y.; Tanaka, S.; Nagano, H.; Noguchi, H.; Yoshino, A.; Taga, K.; Yamamoto, Y.; Shervani, Z. Morphology Observation of Two-dimensional Monolayers of Antimicrobial Peptide on the Water Surface Using the Dropping Method. Bioengineering, 2024; submitted. [Google Scholar]
- Keller, S.L.; Gruner, S.M.; Gawrisch, K. Small concentrations of alamethicin induce a cubic phase in bulk phosphatidyl-ethanolamine mixtures. Biochim. Biophys. Acta 1996, 1278, 241–246. [Google Scholar] [CrossRef]
- Jameson, G.B.; Adams, J.J.; Creamer, L.K. Flexibility, Functionality and Hydrophobicity of Bovine β-lactoglobulin. Int. Dairy J. 2002, 12, 319–329. [Google Scholar] [CrossRef]
- Lenin, D.R.; Elizabeth, D.M.R.; Paulina, C.H.; Mariano, G.G.; Judith, J.G. β-Lactoglobulin’s conformational requirements for ligand binding at the calyx and the dimer interphase: A flexible docking study. PLoS ONE 2013, 8, e79530. [Google Scholar]
- Loch, J.I.; Bonarek, P.; Lewinski, K. Conformational flexibility and ligand binding properties of ovine β-lactoglobulin. Acta Biochim. Polon. 2019, 66, 577–584. [Google Scholar] [CrossRef]
- Ebara, Y.; Mizutani, K.; Okahata, Y. DNA Hybridization at the Air-Water Interface. Langmuir 2000, 16, 2416–2418. [Google Scholar] [CrossRef]
- Yamamoto, Y.; Yokoyama, T.; Yoshida, D.; Mori, H.; Sekiguchi, K.; Shimoaki, T.; Yoshino, A.; Taga, K.; Shervani, Z.; Yamamoto, M. Interactions between Phospholipid Monolayers (DPPC and DMPC) and Anesthetic Isoflurane Observed by Quartz Crystal Oscillator. J. Biophys Chem. 2015, 6, 42–53. [Google Scholar] [CrossRef]
- Ebara, Y.; Okahata, Y. In situ surface-detecting technique by using a quartz-crystal microbalance. Interaction behaviors of proteins onto a phospholipid monolayer at the air-water interface. Langmuir 1993, 9, 574–576. [Google Scholar] [CrossRef]
- Matsuura, N.; Elliot, D.J.; Frulong, D.N.; Grieser, F. In-situ measurement of lead(II) ion binding to an arachidic acid Langmuir monolayer using a quartz crystal microbalance. Colloids Surf. A Physicochem. Eng. Asp. 1997, 126, 189–195. [Google Scholar] [CrossRef]
- Seto, N.; Mashimo, T.; Yoshiya, I.; Taniguchi, Y. Kyunyumasuiyaku no youkaido-Masuikikoukenkyuu no tameni. Anesth. Resusc. 1991, 27, 321–324. [Google Scholar]
- Bergadano, A.; Lauber, R.; Zbinden, A.; Schatzmann, U.; Moens, Y. Blood/Gas Partition Coefficients of Halothane, Isoflurane and Sevoflurane in Horse Blood. Brit. J. Anaest. 2003, 91, 276–278. [Google Scholar] [CrossRef]
- Yamamoto, Y.; Taga, K.; Yoshida, T.; Kamaya, H.; Ueda, I. Temperature Dependence of Thermodynamic Activity in Volatile Anesthetics: Correlation between Anesthetic Potency and Activity. J. Colloid Int. Sci. 2006, 301, 488–492. [Google Scholar] [CrossRef] [PubMed]
- Yoshino, A.; Yoshida, T.; Takahashi, K. 2H NMR study of the behaviour of water in a reversed micellar system. Hydrogen bond breaking and clathrate formation by an inhalation anaesthetic. Magn. Reson. Chem. 1989, 27, 344–347. [Google Scholar] [CrossRef]
- Yokono, S.; Shieh, D.D.; Ueda, I. Interfacial preference of anesthetic action upon the phase transition of phospholipid bilayers and partition equilibrium of inhalation anesthetics between membrane and deuterium oxide. Biochim. Biophys. Acta 1981, 645, 237–242. [Google Scholar] [CrossRef]
- Yoshida, T.; Takahashi, K.; Kamaya, H.; Ueda, I. 19F-NMR Study on Micellar Solubilization of a Volatile Anesthetic Halothane: Dose-Related Biphasic Interaction. J. Colloid Int. Sci. 1988, 124, 177–185. [Google Scholar] [CrossRef]
- Yoshida, T.; Takahashi, K.; Ueda, I. Molecular Orientation of Volatile Anesthetics at the Binding Surface: 1H- and 19F-NMR Studies of Submolecular Affinity. Biochim. Biophys. Acta 1989, 985, 331–333. [Google Scholar] [CrossRef]
- Yamamoto, Y.; Shervani, Z.; Shimoaki, T.; Yoshida, D.; Yokoyama, T.; Yoshida, T.; Taga, K.; Kamaya, H.; Ueda, I. Study of Physisorption of Volatile Anesthetics on Phospholipid Monolayers Using a Highly Sensitive Quartz Crystal Microbalace (HS-QCM). J. Biophys. Chem. 2011, 2, 68–74. [Google Scholar] [CrossRef]
- Frisch, M.J.; Trucks, G.W.; Schlegel, H.B.; Scuseria, G.E.; Robb, M.A.; Cheeseman, J.R.; Scalmani, G.; Barone, V.; Mennucci, B.; Petersson, G.A.; et al. Gaussian 09. Revision D.01; Gaussian, Inc.: Wallingford, CT, USA, 2009. [Google Scholar]
- Yoshida, T.; Okabayashi, H.; Kamaya, H.; Ueda, I. Stable and Unstable Binding of a Volatile Anesthetic Enflurane with Model Lipid Vesicle Membranes. Biochim. Biophys. Acta 1989, 979, 287–293. [Google Scholar] [CrossRef]
- Watanabe, Y.; Uchida, D.; Akatsuka, H.; Yoshino, A.; Taga, K.; Yamamoto, Y.; Shervani, Z.; Yamamoto, M. Morphological Behavior of DPPC-DMPC Two-dimensional Mixed Monolayer on Water Surface by Dropping Method. Eur. J. Adv. Chem. Res. 2022, 3, 52–63. [Google Scholar] [CrossRef]
- Jones, M.N. Surfactant Interactions with Biomembranes and Proteins. Chem. Soc. Rev. 1992, 2, 127–136. [Google Scholar] [CrossRef]
- Creamer, L.K. Effect of Sodium Dodecyl Sulfate and Palmitic Acid on the Equilibrium Unfolding of Bovine β-Lactroglobulin. Biochemistry 1995, 34, 7170–7176. [Google Scholar] [CrossRef] [PubMed]
- Zhang, X.; Keiderling, T.A. Lipid-Induced Conformational Transitions of β-Lactroglobulin. Biochemistry 2006, 45, 8444–8452. [Google Scholar] [CrossRef] [PubMed]
- Mashimo, T.; Ogli, K.; Uchida., I. Basic and Systemic Mechanisms of Anesthesia; Elsevier: Amsterdam, The Netherlands, 2005. [Google Scholar]
- Rózsa, Z.B.; Hantal, G.; Szőri, M.; Balázs Fábián, B.; Jedlovszky, P. Understanding the Molecular Mechanism of Anesthesia: Effect of General Anesthetics and Structurally Similar Non-Anesthetics on the Properties of Lipid Membranes. J. Phys. Chem. B 2023, 127, 6078–6090. [Google Scholar] [CrossRef] [PubMed]
- Shieh, D.D.; Ueda, I.; Lin, H.C.; Ering, H. Nuclear magnetic resonance studies of the interaction of general anesthetics with 1,2-dihexadecyl-sn-glycero-3-phosphorylcholine bilayer. Proc. Natl. Acad. Sci. USA 1976, 73, 3999–4002. [Google Scholar] [CrossRef] [PubMed]
- Kaneshina, S.; Lin, H.; Ueda, I. Unisotropic solubilization of an inhalation anesthetic, methoxyflurane, into the interfacial region of cationic surfactant micelles. Biochim. Biophys. Acta 1981, 647, 223–226. [Google Scholar] [CrossRef]
- Ueda, I.; Suzuki, A. Is There a Specific Receptor for Anesthetics? Contrary Effects of Alcohols and Fatty Acids on Phase Transition and Bioluminescence of Firefly Luciferase. Biophys. J. 1998, 75, 1052–1057. [Google Scholar] [CrossRef]
- Matsuki, H.; Ueda, I. Are There Any Specific Receptors for Anesthetics? Contradiction in Temperature Dependence of Anesthetic Action. Seibutsu Butsuri 2001, 41, 4–8. [Google Scholar] [CrossRef]


| Isoflurane Concentration | 2 | 3 | 4 | 5 | 6 | 7 | 8 | |
|---|---|---|---|---|---|---|---|---|
| (mM) | ||||||||
| DPPC | |Δf| (Hz) | 0.43 | 0.63 | 0.78 | 0.84 | 1.38 | 1.63 | 1.61 |
| Δr (Ω) | 0.00 | 0.00 | 0.10 | 0.14 | 0.15 | 0.23 | 0.25 | |
| DPPC-PA | |Δf| (Hz) | 0.36 | 0.85 | 0.94 | 0.96 | 1.45 | 1.75 | 1.75 |
| Δr (Ω) | 0.00 | 0.14 | 0.15 | 0.16 | 0.20 | 0.21 | 0.20 | |
| DPPC-Al | |Δf| (Hz) | 0.62 | 0.70 | 0.79 | 0.89 | 1.41 | 1.73 | 1.74 |
| Δr (Ω) | 0.00 | 0.00 | 0.09 | 0.13 | 0.15 | 0.16 | 0.17 | |
| DPPC-βLG | |Δf| (Hz) | 0.41 | 0.60 | - | 0.90 | 0.90 | 1.00 | - |
| Δr (Ω) | 0.00 | 0.14 | - | 0.24 | 0.30 | 0.35 | - | |
Disclaimer/Publisher’s Note: The statements, opinions and data contained in all publications are solely those of the individual author(s) and contributor(s) and not of MDPI and/or the editor(s). MDPI and/or the editor(s) disclaim responsibility for any injury to people or property resulting from any ideas, methods, instructions or products referred to in the content. |
© 2024 by the authors. Licensee MDPI, Basel, Switzerland. This article is an open access article distributed under the terms and conditions of the Creative Commons Attribution (CC BY) license (https://creativecommons.org/licenses/by/4.0/).
Share and Cite
Yamamoto, Y.; Ito, D.; Akatsuka, H.; Noguchi, H.; Matsushita, A.; Kinekawa, H.; Nagano, H.; Yoshino, A.; Taga, K.; Shervani, Z.; et al. The Interaction between Anesthetic Isoflurane and Model-Biomembrane Monolayer Using Simultaneous Quartz Crystal Microbalance (QCM) and Quartz Crystal Impedance (QCI) Methods. Membranes 2024, 14, 62. https://doi.org/10.3390/membranes14030062
Yamamoto Y, Ito D, Akatsuka H, Noguchi H, Matsushita A, Kinekawa H, Nagano H, Yoshino A, Taga K, Shervani Z, et al. The Interaction between Anesthetic Isoflurane and Model-Biomembrane Monolayer Using Simultaneous Quartz Crystal Microbalance (QCM) and Quartz Crystal Impedance (QCI) Methods. Membranes. 2024; 14(3):62. https://doi.org/10.3390/membranes14030062
Chicago/Turabian StyleYamamoto, Yasushi, Daiki Ito, Honoka Akatsuka, Hiroki Noguchi, Arisa Matsushita, Hyuga Kinekawa, Hirotaka Nagano, Akihiro Yoshino, Keijiro Taga, Zameer Shervani, and et al. 2024. "The Interaction between Anesthetic Isoflurane and Model-Biomembrane Monolayer Using Simultaneous Quartz Crystal Microbalance (QCM) and Quartz Crystal Impedance (QCI) Methods" Membranes 14, no. 3: 62. https://doi.org/10.3390/membranes14030062