
Treatment of the Bleaching Effluent from Sulfite Pulp Production by Ceramic Membrane Filtration


Abstract
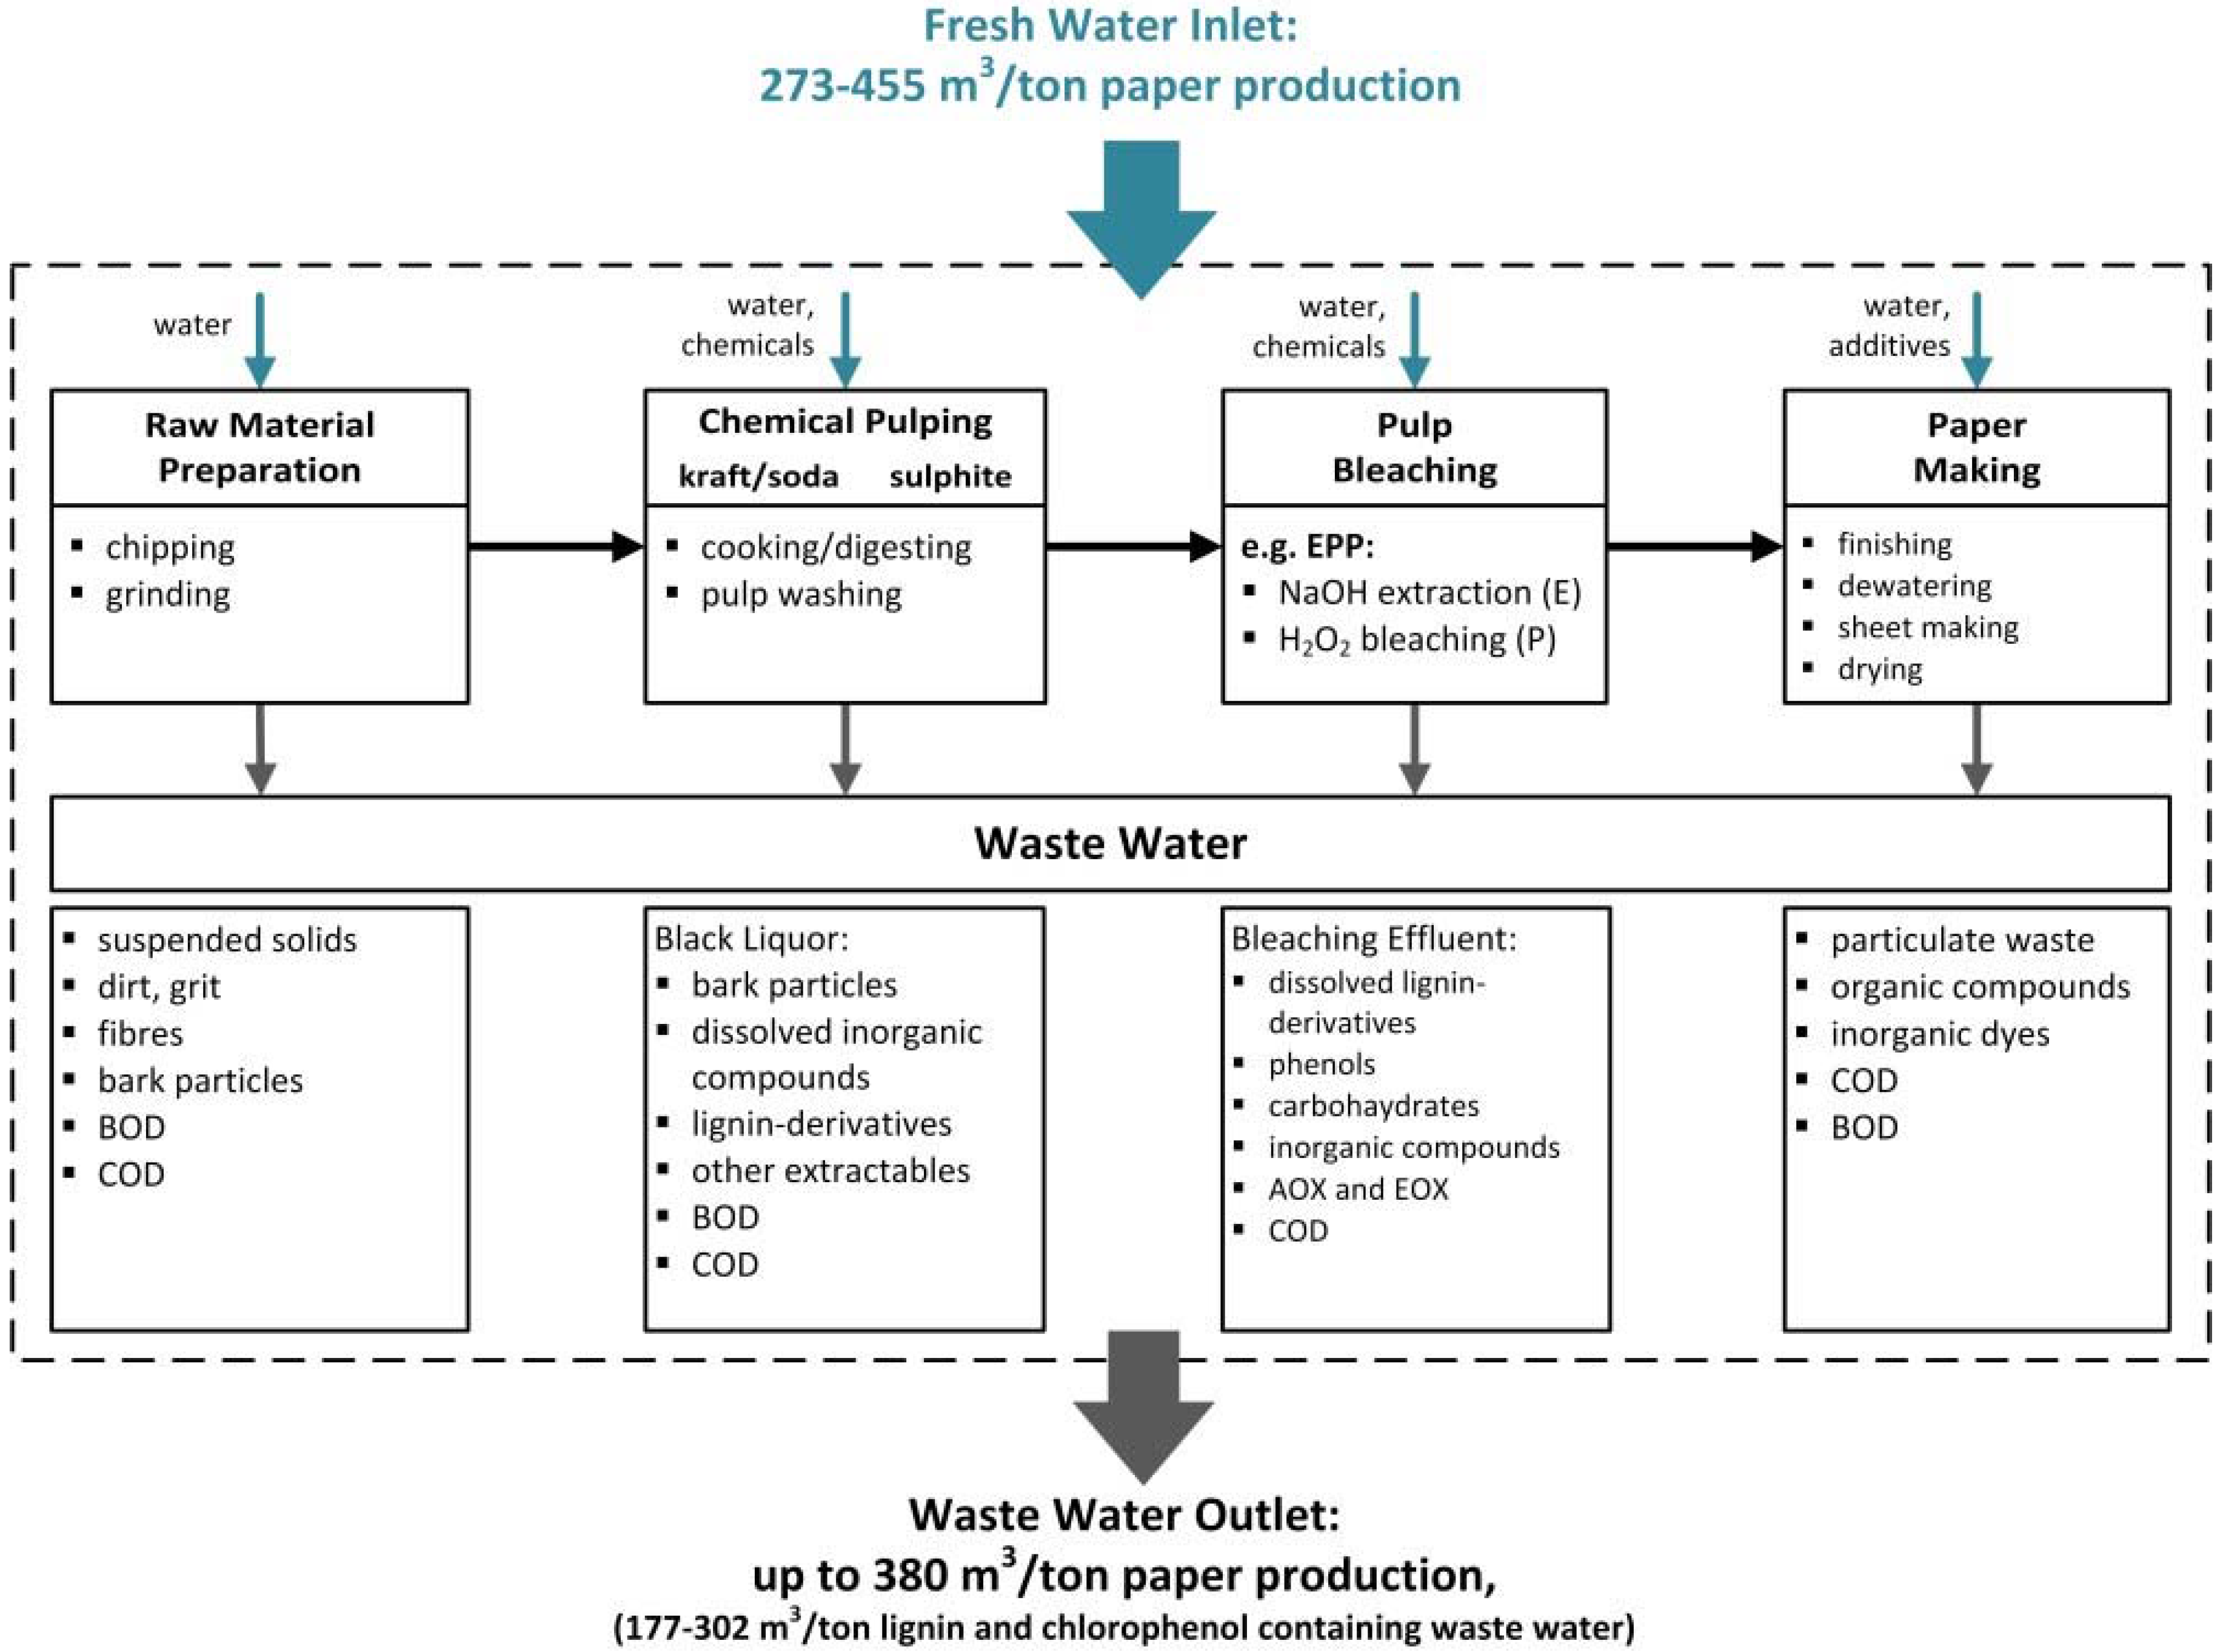
:1. Introduction


| Process | Source | Membrane type | Reference |
|---|---|---|---|
| RO | Kraft black liquor | Spiral-wound | [22] |
| RO | Bleaching effluent | Spiral-wound | [34] |
| NF | Kraft black liquor | Tubular ceramic membranes | [15,21,35] |
| NF | Bleaching effluent | Spiral-wound | [34] |
| NF | Kraft black liquor | Tubular polymeric membranes | [15,22] |
| UF/NF | Hardwood black liquor | Tubular ceramic membranes | [28] |
| UF | Kraft black liquor | Rotating disc module using cellulose triacetate | [32] |
| UF | Kraft black liquor | Tubular polymeric membranes | [18,25] |
| UF | Kraft black liquor | Polymeric flat membranes | [33] |
| UF | Bleaching effluent | Spiral-wound | [34] |
| UF | Cooking liquor | Tubular ceramic membranes | [23,25] |
| UF | Kraft black liquor | Tubular ceramic membranes | [15,16,19,20,21,23,24,25,27,28,29,30,35] |
| UF | Kraft black liquor | Tubular polymeric membranes | [18,25] |
| UF | Acidic white water, acidic clear filtrate | Cross rotational filter | [17] |
| MF | Tubular polymeric | [17] | |
| MF | Kraft black liquor | Polymeric flat membranes | [33] |
| MF | Kraft black liquor | Tubular ceramic membranes | [16,22,31,33] |
2. Materials and Methods
2.1. Materials

| Membrane | MF | UF | NF | NF |
|---|---|---|---|---|
| Material | Al2O3/Al2O3 | Al2O3/TiO2 | TiO2 | TiO2/TiO2 |
| Cutoff | 0.1 µm, 0.14 µm, 0.2 µm | 5 kDa, 20 kDa, 0.05 µm | 1000 Da | 1000 Da |
| pH | 0–14 | 0–14 | 0–14 | 0–14 |
| Temp. Max. | 121 °C | 121 °C | 150 °C | 121 °C |
| Parameter | Unit | Bleaching effluent | Variation Range |
|---|---|---|---|
| COD | mg·L−1 | 10,400 | 10,300–12,000 |
| pH value | 10.65 | 10.0–11.0 | |
| Temperature | °C | 60 | 60–70 |
| Conductivity | mS·cm−1 | 8.0 | 8.0–10 |
| Viscosity | pas | 6.0 | 5.85–6.08 |
| TOC | mg·L−1 | 4000 | 3500–4500 |
| Na | mg·L−1 | 2430 | 1800–3300 |
2.2. Water Quality Assessment
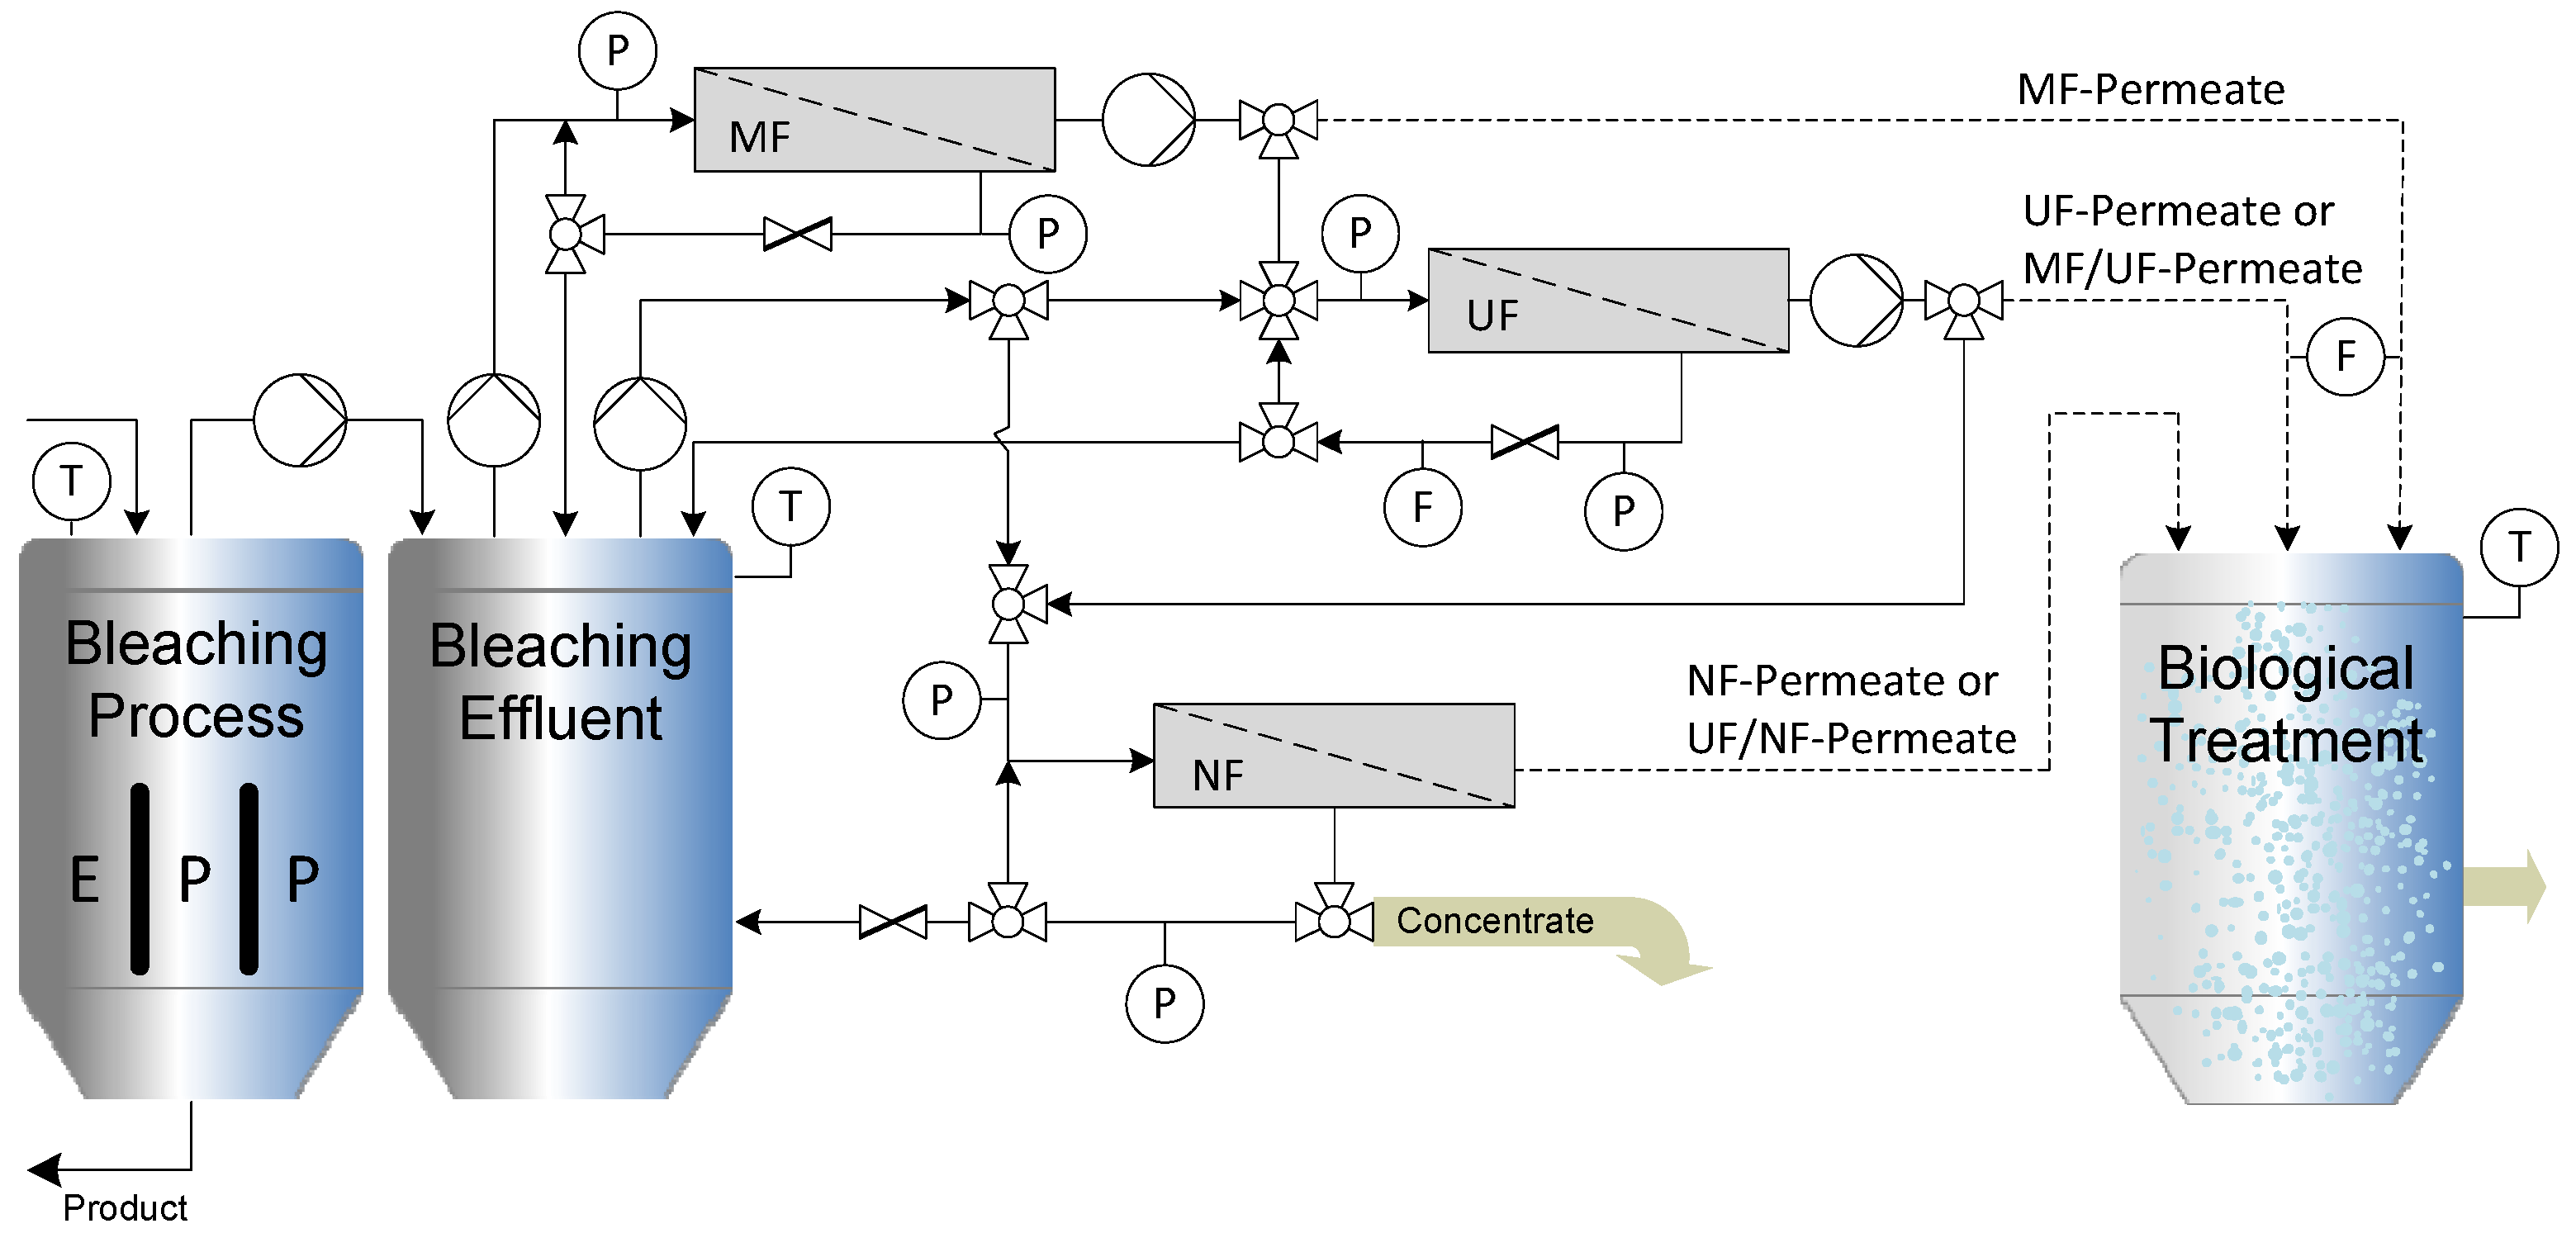
2.3. Experimental Setup

2.4. Membrane Cleaning
3. Results and Discussion
3.1. Multi-Stage Separation Membrane Processes

3.2. Two-Stage Membrane Filtration Process (MF➔UF)
| Membrane | TMP | CFV | Re | COD Removal | Lignin Removal | |
|---|---|---|---|---|---|---|
| Cut-off | Channel configuration | (bar) | (m·s−1) | (%) | (%) | |
| 0.1 µm | Mono-channel | 2.0 | 0.25 | 9549 | 27.81 | 20.0 |
| 0.1 µm | Mono-channel | 1.0 | 0.37 | 8639 | 34.09 | n. a. |
| 0.1 µm | Mono-channel | 2.0 | 5.6 | 150,000 | 28.04 | 42.1 |
| 0.1 µm | Seven-channel | 1.0 | 0.26 | 16,370 | 21.28 | 31.0 |
| 0.14 µm | Eight-channel | 2.0 | 0.15 | 15,302 | 37.96 | n. a. |
| 0.2 µm | Seven-channel | 2.0 | 0.51 | 34,210 | 23.16 | 29.2 |
| 0.2 µm | Nineteen-channel | 2.0 | 0.26 | 19,108 | 19.65 | 28.0 |
| 0.2 µm | Mono-channel | 2.0 | 0.24 | 9549 | 32.83 | n. a. |
| 0.2 µm | Mono-channel | 2.0 | 0.27 | 9549 | 37.51 | n. a. |
| 0.2 µm | Mono-channel | 2.0 | 0.29 | 9549 | 32.81 | n. a. |


| Membrane Process | CFV | Re | TMP | COD Removal | Lignin Removal | pHt0 | pHend |
|---|---|---|---|---|---|---|---|
| MF, 0.1 μm | 5.6 m·s−1 | 150,000 | 2.0 bar | 28%–30% | 40%–50% | 11.2 | 10.1 |
| UF, 20 kDa | 4.0 m·s−1 | 41,000 | 2.0 bar | 20%–30% | 30%–40% | 10.1 | 9.2 |
| Total removal | 35%–45% | 60%–73% |
| Membrane | TMP (bar) | CFV (m·s−1) | COD removal (%) |
|---|---|---|---|
| UF, 20 kDa | 2.0 | 4.10 | 20.32 |
| UF, 20 kDa | 2.0 | 4.00 | 24.23 |
| UF, 20 kDa | 2.0 | 4.10 | 28.40 |
| UF, 20 kDa | 1.0 | 0.43 | 42.30 |
| UF, 20 kDa | 1.0 | 0.46 | 40.20 |
| UF, 20 kDa | 1.0 | 0.46 | 37.33 |
3.3. The Effect of Back Flushing on MF Performance

3.4. Two-Stage Membrane Filtration Process (UF➔NF)


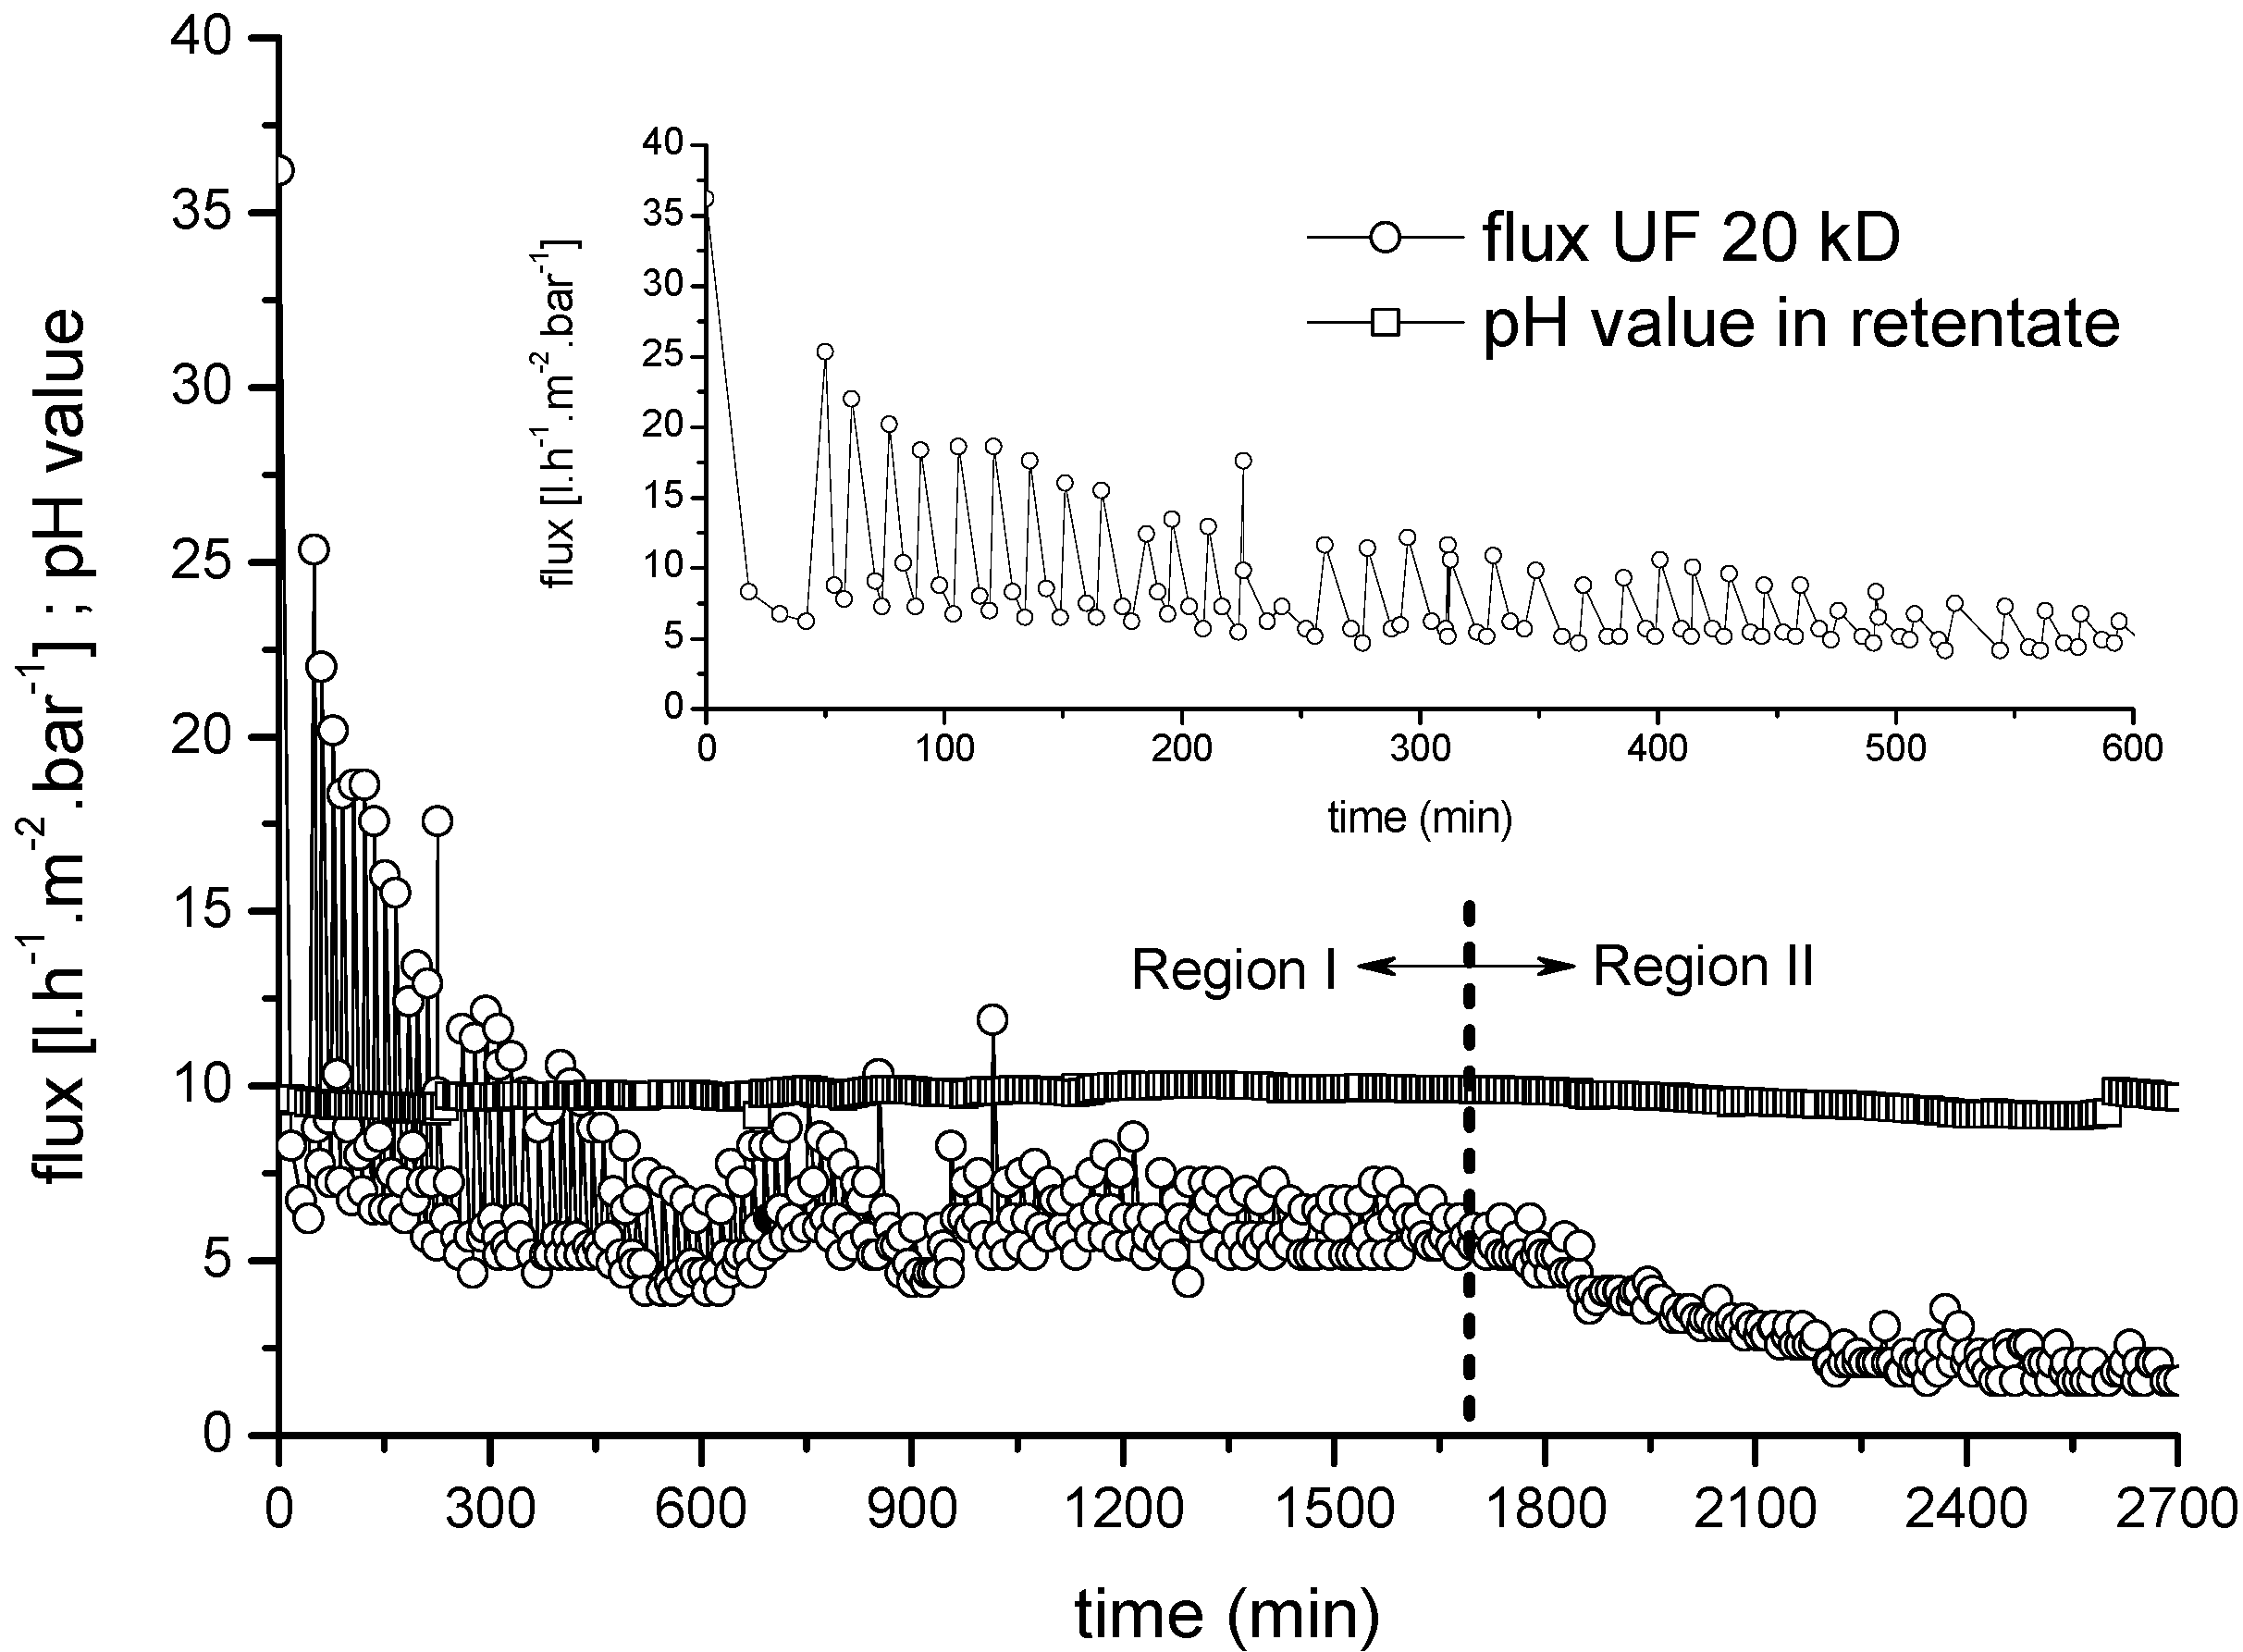
3.5. The Effect of Back Flushing on UF Performance


| Membrane Process | TMP | COD Removal | Lignin Removal | pHt0 | pHend |
|---|---|---|---|---|---|
| UF, 20 kDa | 2.0 bar | 30%–35% | 45%–50% | 11.2 | 9.2 |
| NF, 1 kDa | 2.0 bar | 20%–27% | 30%–40% | 9.2 | 8.2 |
| Total removal | 35%–40% | 45%–66% |
3.6. Clean Water Flux and the Efficiency of Membrane Chemical Cleaning


4. Conclusions
Acknowledgements
Author Contributions
Conflicts of Interest
References
- Michael-Kordatou, I.; Michael, C.; Duan, X.; He, X.; Dionysiou, D.D.; Mills, M.A.; Fatta-Kassinos, D. Dissolved effluent organic matter: Characteristics and potential implications in wastewater treatment and reuse applications. Water Res. 2015, 77, 213–248. [Google Scholar] [CrossRef] [PubMed]
- Haddaway, A. Pulp & Paper: A Look at Wastewater Treatment Trends and Technologies. Available online: http://www.waterworld.com/articles/iww/print/volume-14/issue-1/features/pulp-paper-a-look-at-wastewater-treatment-trends-and-technologies.html (accessed on 24 December 2015).
- Badar, S.; Farooqi, I.H. Pulp and Paper Industry—Manufacturing Process, Wastewater Generation and Treatment. In Environmental Protection Strategies for Sustainable Development; Malik, A., Grohmann, E., Eds.; Springer: Dordrecht, The Netherlands, 2012; pp. 397–436. [Google Scholar]
- Thompson, G.; Swain, J.; Kay, M.; Forster, C.F. The treatment of pulp and paper mill effluent: A review. Bioresour. Technol. 2001, 77, 275–286. [Google Scholar] [CrossRef]
- Kamali, M.; Khodaparast, Z. Review on recent developments on pulp and paper mill wastewater treatment. Ecotoxicol. Environ. Saf. 2015, 114, 326–342. [Google Scholar] [CrossRef] [PubMed]
- Sridhar, R.; Sivakumar, V.; Prince Immanuel, V.; Prakash Maran, J. Treatment of pulp and paper industry bleaching effluent by electrocoagulant process. J. Hazard. Mater. 2011, 186, 1495–1502. [Google Scholar] [CrossRef] [PubMed]
- Bajpai, P. Biopulping. In Biotechnology for Pulp and Paper Processing; Springer US: Boston, MA, USA, 2012; pp. 67–92. [Google Scholar]
- Huber, P.; Burnet, A.; Petit-Conil, M. Scale deposits in kraft pulp bleach plants with reduced water consumption: A review. J. Environ. Manag. 2014, 141, 36–50. [Google Scholar] [CrossRef] [PubMed]
- Tewari, P.K.; Batra, V.S.; Balakrishnan, M. Efficient water use in industries: cases from the Indian agro-based pulp and paper mills. J. Environ. Manag. 2009, 90, 265–273. [Google Scholar] [CrossRef] [PubMed]
- Van der Bruggen, B. Fundamentals of Membrane Solvent Separation and Pervaporation. In Membrane Operations; Wiley-VCH Verlag GmbH & Co. KGaA: Hoboken, NJ, USA, 2009; pp. 45–61. [Google Scholar]
- Ebrahimi, M.; Kerker, S.; Daume, S.; Geile, M.; Ehlen, F.; Unger, I.; Schütz, S.; Czermak, P. Innovative ceramic hollow fiber membranes for recycling/reuse of oilfield produced water. Desalination Water Treat. 2014, 55, 3554–3567. [Google Scholar] [CrossRef]
- Holladay, J.; White, J.; Bozell, J.; Johnson, D. Top Value-Added Chemicals from Biomass: Volume II—Results of Screening for Potential Candidates from Biorefinery Lignin; Pacific Northwest National Laboratory: Richland, WA, USA, 2007; p. 87. [Google Scholar]
- Ali, M.; Sreekrishnan, T.R. Aquatic toxicity from pulp and paper mill effluents: A review. Adv. Environ. Res. 2001, 5, 175–196. [Google Scholar] [CrossRef]
- Pokhrel, D.; Viraraghavan, T. Treatment of pulp and paper mill wastewater—A review. Sci. Total Environ. 2004, 333, 37–58. [Google Scholar] [CrossRef]
- Arkell, A.; Olsson, J.; Wallberg, O. Process performance in lignin separation from soft wood black liquor by membrane filtration. Chem. Eng. Res. Des. 2014, 92, 1792–1800. [Google Scholar] [CrossRef]
- Ziesig, R.; Tomani, P.; Theiliander, H. Production of a pure lignin product Part 2: Separation of lignin from membrane filtration Permeates of black liquor. Cellul. Chem. Technol. 2014, 48, 805–811. [Google Scholar]
- Nuortila-Jokinen, J.; Nyström, M. Comparison of membrane separation processes in the internal purification of paper mill water. J. Membr. Sci. 1996, 119, 99–115. [Google Scholar] [CrossRef]
- Wallberg, O.; Jönsson, A.S.; Wimmerstedt, R. Fractionation and concentration of kraft black liquor lignin with ultrafiltration. Desalination 2003, 154, 187–199. [Google Scholar] [CrossRef]
- Wallberg, O.; Jönsson, A.S. Influence of the membrane cut-off during Ultrafiltration of kraft black liquor with ceramic membranes. Chem. Eng. Res. Des. 2003, 81, 1379–1384. [Google Scholar] [CrossRef]
- Wallberg, O.; Jönsson, A.S.; Wimmerstedt, R. Ultrafiltration of kraft black liquor with a ceramic membrane. Desalination 2003, 156, 145–153. [Google Scholar] [CrossRef]
- Dafinov, A.; Font, J.; Garcia-Valls, R. Processing of black liquors by UF/NF ceramic membranes. Desalination 2005, 173, 83–90. [Google Scholar] [CrossRef]
- Pizzichini, M.; Russo, C.; Di Meo, C. Purification of pulp and paper wastewater, with membrane technology, for water reuse in a closed loop. Desalination 2005, 178, 351–359. [Google Scholar] [CrossRef]
- Holmqvist, A.; Wallberg, O.; Jönsson, A.S. Ultrafiltration of kraft black liquor from two swedish pulp mills. Chem. Eng. Res. Des. 2005, 83, 994–999. [Google Scholar] [CrossRef]
- Wallberg, O.; Holmqvist, A.; Jönsson, A.S. Ultrafiltration of kraft cooking liquors from a continuous cooking process. Desalination 2005, 180, 109–118. [Google Scholar] [CrossRef]
- Wallberg, O.; Linde, M.; Jönsson, A.S. Extraction of lignin and hemicelluloses from kraft black liquor. Desalination 2006, 199, 413–414. [Google Scholar] [CrossRef]
- Wallberg, O.; Jönsson, A.S. Separation of lignin in kraft cooking liquor from a continuous digester by ultrafiltration at temperatures above 100 °C. Desalination 2006, 195, 187–200. [Google Scholar] [CrossRef]
- Zabkovà, M.; Borges da Silva, E.A.; Rodrigues, A.E. Recovery of vanillin from lignin/vanillin mixture by using tubular ceramic ultrafiltration membranes. J. Membr. Sci. 2007, 301, 221–237. [Google Scholar] [CrossRef]
- Jönsson, A.S.; Nordin, A.K.; Wallberg, O. Concentration and purification of lignin in hardwood kraft pulping liquor by ultrafiltration and nanofiltration. Chem. Eng. Res. Des. 2008, 86, 1271–1280. [Google Scholar] [CrossRef]
- Toledano, A.; Serrano, L.; Garcia, A.; Mondragon, I.; Labidi, J. Comparative study of lignin fractionation by ultrafiltration and selective precipitation. Chem. Eng. J. 2010, 157, 93–99. [Google Scholar] [CrossRef]
- Toledano, A.; García, A.; Mondragon, I.; Labidi, J. Lignin separation and fractionation by ultrafiltration. Sep. Purif. Technol. 2010, 71, 38–43. [Google Scholar] [CrossRef]
- Ziesig, R.; Tomani, P.; Theliander, H. Production of a pure lignin product Part 2: Separation of lignin from membrane filtration Permeates of black liquor. Cellul. Chem. Technol. 2014, 48, 805–811. [Google Scholar]
- Bhattacharjee, S.; Datta, S.; Bhattacharjee, C. Performance study during ultrafiltration of Kraft black liquor using rotating disk membrane module. J. Clean. Prod. 2006, 14, 497–504. [Google Scholar] [CrossRef]
- Liua, G.; Liu, Y.; Ni, J.; Shi, H.; Qian, Y. Treatability of kraft spent liquor by microfiltration and ultrafiltration. Desalination 2004, 160, 131–141. [Google Scholar] [CrossRef]
- Kumar Shukla, S.; Kumar, V.; Bansal, M.C. Treatment of combined bleaching effluent by membrane filtration technology for system closure in paper industry. Desalination Water Treat. 2010, 13, 464–470. [Google Scholar] [CrossRef]
- Keyoumu, A.; Sjödahl, R.; Henriksson, G.; Ek, M.; Gellerstedt, G.; Lindström, M.E. Continuous nano- and ultrafiltration of kraft pulping black liquor with ceramic filters: A method for lowering the load on the recovery boiler while generating valuable side-products. Ind. Crop. Prod. 2004, 20, 143–150. [Google Scholar] [CrossRef]
- Peña, N.; Gallego, S.; del Vigo, F.; Chesters, S.P. Evaluating impact of fouling on reverse osmosis membranes performance. Desalination Water Treat. 2012, 51, 958–968. [Google Scholar] [CrossRef]
- Li, N.N.; Fane, A.G.; Winston Ho, W.S.; Matsuura, T. Advanced Membrane Technology and Applications; Wiley: Hoboken, NJ, USA, 2008. [Google Scholar]
- Olsen, O. Membrane technology in the pulp and paper industry. Desalination 1980, 35, 291–302. [Google Scholar] [CrossRef]
© 2015 by the authors; licensee MDPI, Basel, Switzerland. This article is an open access article distributed under the terms and conditions of the Creative Commons by Attribution (CC-BY) license (http://creativecommons.org/licenses/by/4.0/).
Share and Cite
Ebrahimi, M.; Busse, N.; Kerker, S.; Schmitz, O.; Hilpert, M.; Czermak, P. Treatment of the Bleaching Effluent from Sulfite Pulp Production by Ceramic Membrane Filtration. Membranes 2016, 6, 7. https://doi.org/10.3390/membranes6010007
Ebrahimi M, Busse N, Kerker S, Schmitz O, Hilpert M, Czermak P. Treatment of the Bleaching Effluent from Sulfite Pulp Production by Ceramic Membrane Filtration. Membranes. 2016; 6(1):7. https://doi.org/10.3390/membranes6010007
Chicago/Turabian StyleEbrahimi, Mehrdad, Nadine Busse, Steffen Kerker, Oliver Schmitz, Markus Hilpert, and Peter Czermak. 2016. "Treatment of the Bleaching Effluent from Sulfite Pulp Production by Ceramic Membrane Filtration" Membranes 6, no. 1: 7. https://doi.org/10.3390/membranes6010007