

The Association of Dry Eye Disease with Functional Visual Acuity and Quality of Life

Abstract
:1. Introduction
2. Materials and Methods
2.1. Study Population
2.2. Study Outcomes
2.3. Study Procedures
2.3.1. FVA
2.3.2. QOL Questionnaire
2.3.3. Tear Break-Up Time
2.3.4. Corneal Fluorescein Staining
2.3.5. Standard Patient Evaluation of Eye Dryness (SPEED)
2.3.6. Schirmer’s I Test
2.3.7. Meibomian Gland Dysfunction (MGD) Examination
2.4. Statistical Analysis
3. Results
3.1. Participants’ Characteristics
3.2. Assessment of Dry Eye
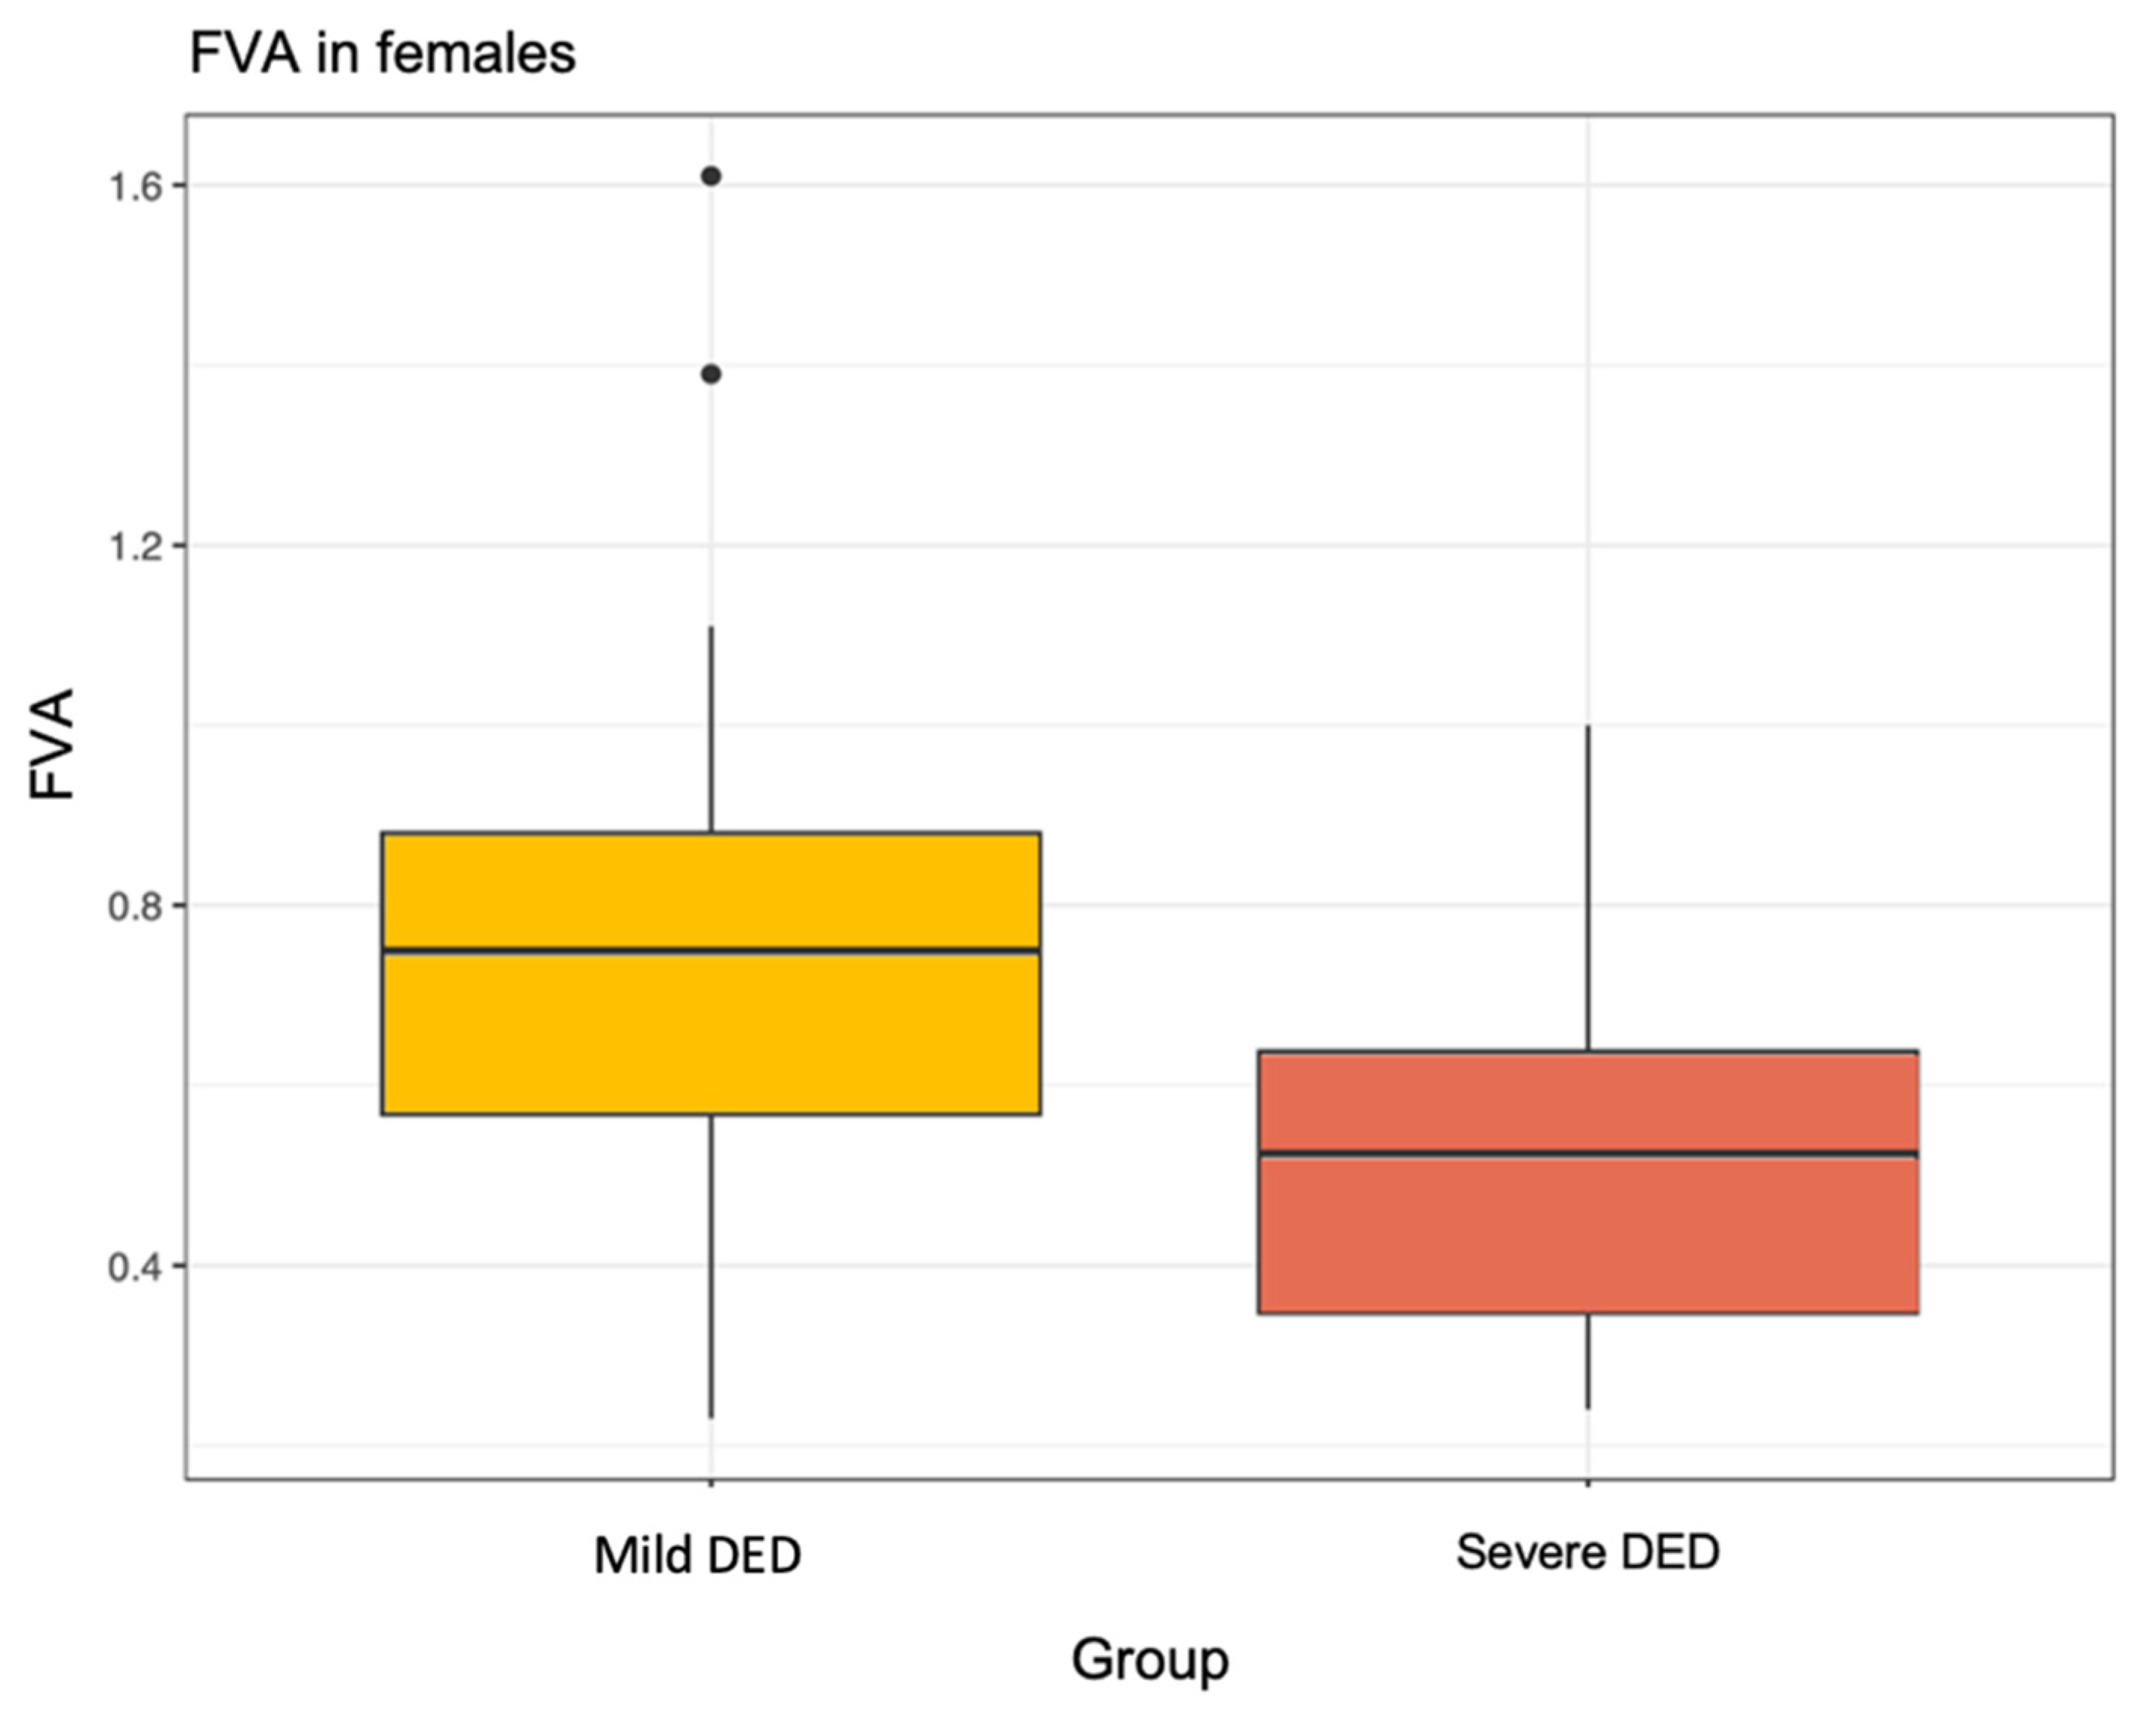
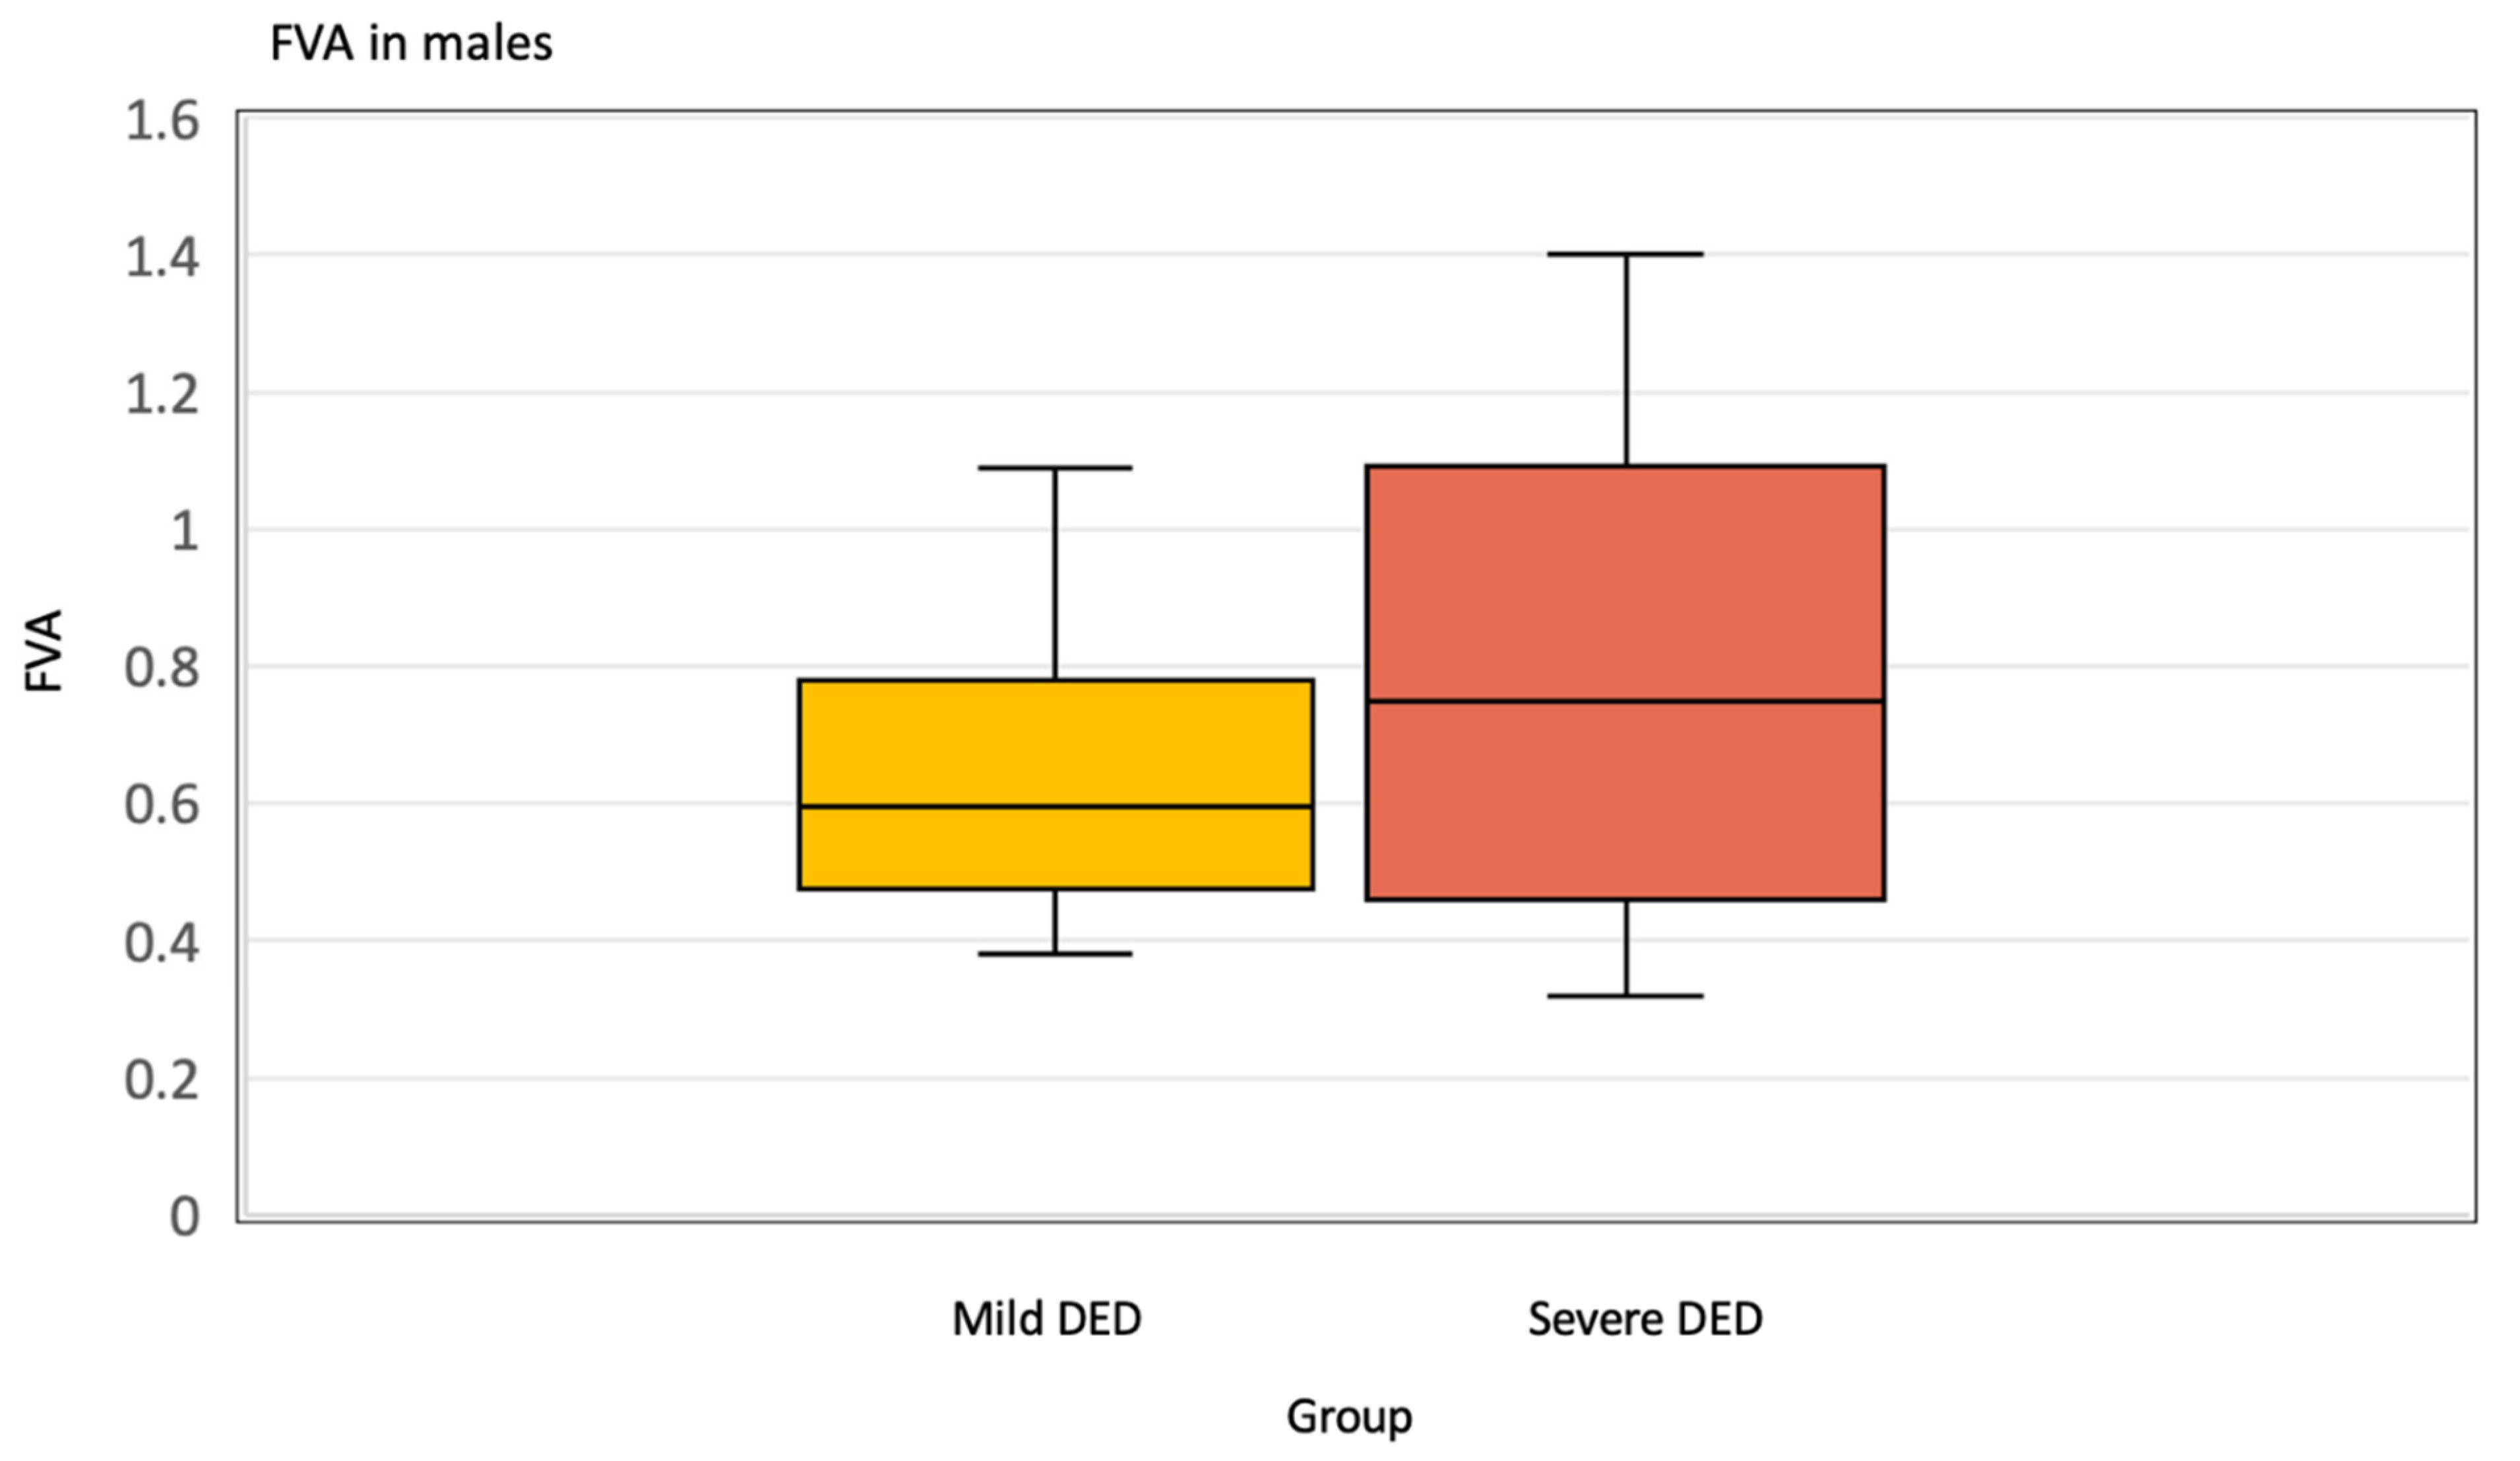
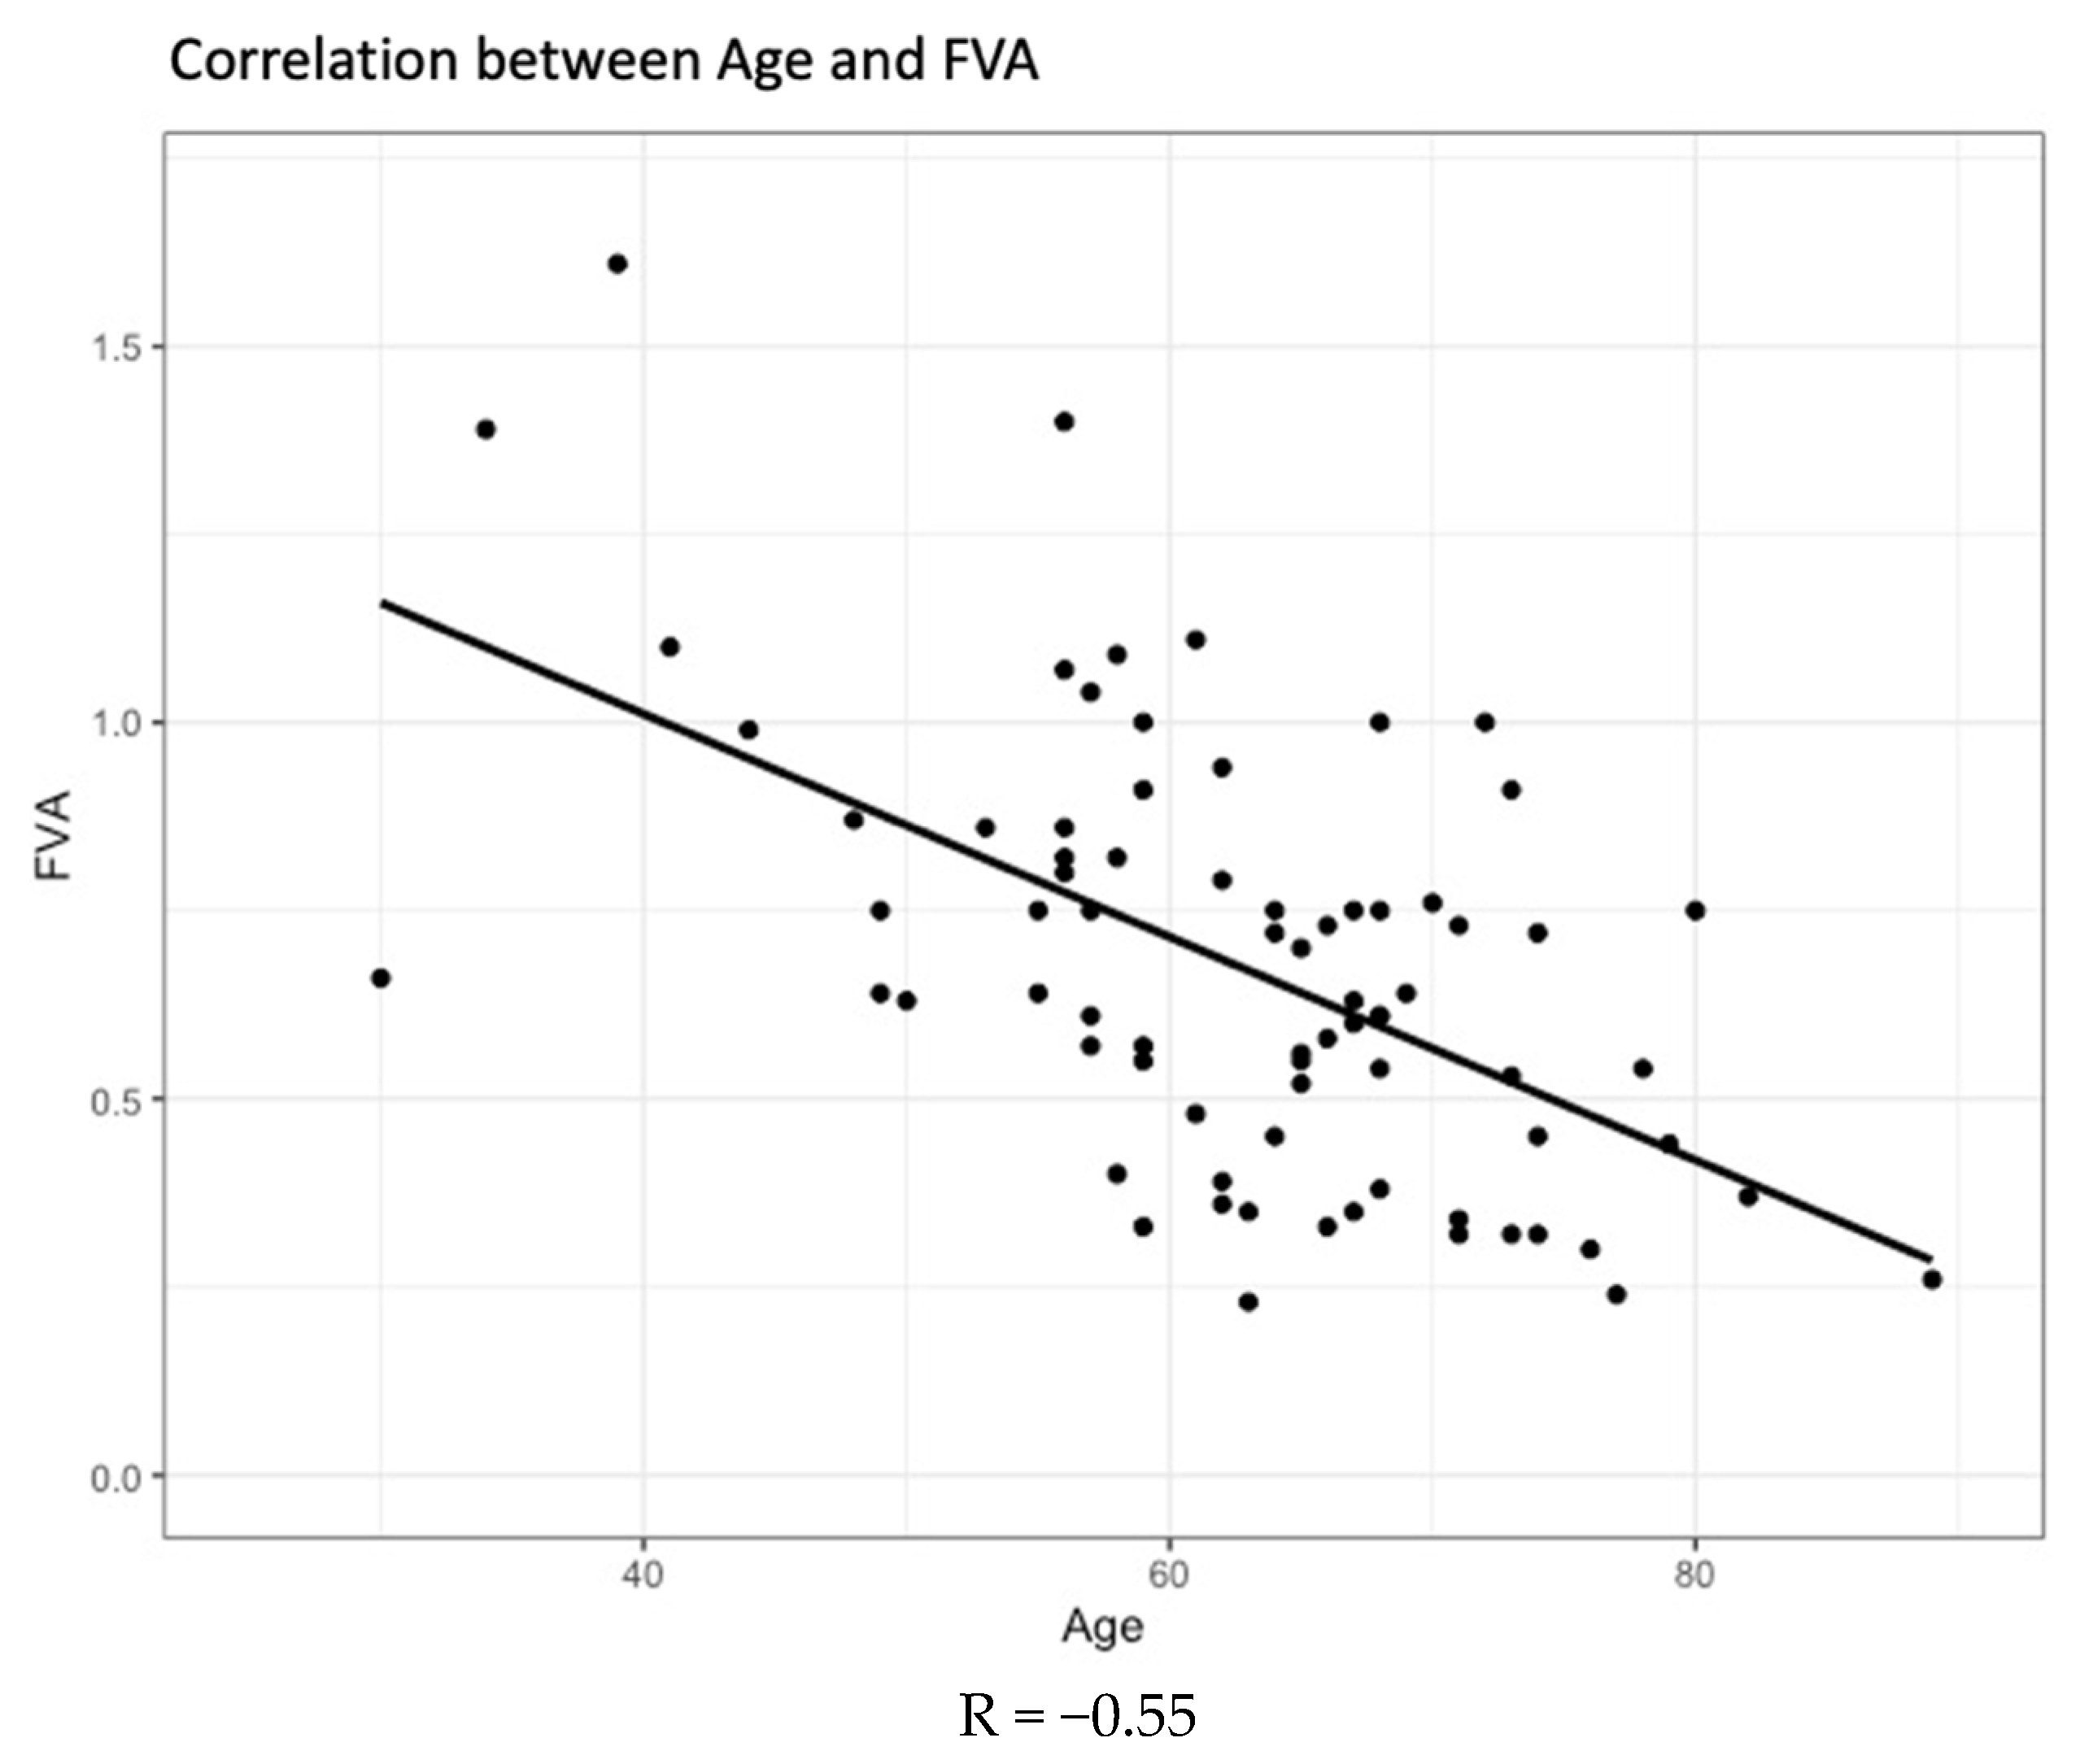
3.3. Functional Visual Acuity (FVA)
4. Discussion
4.1. Summary of Significant Findings and Comparison with Literature
4.2. Strengths and Weaknesses
5. Conclusions
Author Contributions
Funding
Institutional Review Board Statement
Informed Consent Statement
Data Availability Statement
Acknowledgments
Conflicts of Interest
References
- Jie, Y.; Xu, L.; Wu, Y.Y.; Jonas, J.B. Prevalence of dry eye among adult Chinese in the Beijing Eye Study. Eye 2009, 23, 688–693. [Google Scholar] [CrossRef] [PubMed]
- Stapleton, F.; Alves, M.; Bunya, V.Y.; Jalbert, I.; Lekhanont, K.; Malet, F.; Na, K.-S.; Schaumberg, D.; Uchino, M.; Vehof, J.; et al. TFOS DEWS II Epidemiology Report. Ocul. Surf. 2017, 15, 334–365. [Google Scholar] [CrossRef] [PubMed]
- Tian, Y.-J.; Liu, Y.; Zou, H.-D. Epidemiologic study of dry eye in populations equal or over 20 years old in Jiangning Dis-trict of Shanghai. Zhonghua Yan Ke Za Zhi 2009, 45, 486–491. [Google Scholar] [PubMed]
- Tong, L.; Saw, S.-M.; Lamoureux, E.L. A Questionnaire-Based Assessment of Symptoms Associated with Tear Film Dys-function and Lid Margin Disease in an Asian Population. Ophthalmic Epidemiol. 2009, 16, 31–37. [Google Scholar] [CrossRef] [PubMed]
- Viso, E.; Rodriguez-Ares, M.T.; Gude, F. Prevalence of and associated factors for dry eye in a Spanish adult population (the Salnes Eye Study). Ophthalmic Epidemiol. 2009, 16, 15–21. [Google Scholar] [CrossRef]
- Le, Q.; Zhou, X.; Ge, L.; Wu, L.; Hong, J.; Xu, J. Impact of Dry Eye Syndrome on Vision-Related Quality of Life in a Non-Clinic-Based General Population. BMC Ophthalmol. 2012, 12, 22. [Google Scholar] [CrossRef]
- Sayegh, R.R.; Yu, Y.; Farrar, F.J.T.; Kuklinski, E.J.; Shtein, R.M.; Asbell, P.A.; Maguire, M.G. Ocular Discomfort and Quality of Life Among Patients in the Dry Eye Assessment and Management (DREAM) Study. Cornea 2021, 40, 869. [Google Scholar] [CrossRef]
- Paulsen, A.J.; Cruickshanks, K.J.; Fischer, M.E.; Huang, G.-H.; Klein, B.E.; Klein, R.; Dalton, D.S. Dry eye in the beaver dam offspring study: Prevalence, risk factors, and health-related quality of life. Am. J. Ophthalmol. 2014, 157, 799–806. [Google Scholar] [CrossRef]
- Goto, E.; Yagi, Y.; Matsumoto, Y.; Tsubota, K. Impaired functional visual acuity of dry eye patients. Am. J. Ophthalmol. 2002, 133, 181–186. [Google Scholar] [CrossRef]
- Miljanović, B.; Dana, R.; Sullivan, D.A.; Schaumberg, D.A. Impact of dry eye syndrome on vision-related quality of life. Am. J. Ophthalmol. 2007, 143, 409–415. [Google Scholar] [CrossRef]
- Tong, L.; Waduthantri, S.; Wong, T.Y.; Saw, S.M.; Wang, J.J.; Rosman, M.; Lamoureux, E. Impact of symptomatic dry eye on vision-related daily activities: The Singapore Malay Eye Study. Eye 2010, 24, 1486–1491. [Google Scholar] [CrossRef] [PubMed]
- Ding, J.; Sullivan, D.A. Aging and dry eye disease. Exp. Gerontol. 2012, 47, 483–490. [Google Scholar] [CrossRef] [PubMed]
- Schaumberg, D.A.; Nichols, J.J.; Papas, E.B.; Tong, L.; Uchino, M.; Nichols, K.K. The international workshop on meibomian gland dysfunction: Report of the subcommittee on the epidemiology of, and associated risk factors for, MGD. Investig. Ophthalmol. Vis. Sci. 2011, 52, 1994–2005. [Google Scholar] [CrossRef] [PubMed]
- Wolffsohn, J.S.; Arita, R.; Chalmers, R.; Djalilian, A.; Dogru, M.; Dumbleton, K.; Gupta, P.K.; Karpecki, P.; Lazreg, S.; Pult, H.; et al. TFOS DEWS II Diagnostic Methodology report. Ocul. Surf. 2017, 15, 539–574. [Google Scholar] [CrossRef] [PubMed]
- Tsubota, K. Tear dynamics and dry eye. Prog. Retin. Eye Res. 1998, 17, 565–596. [Google Scholar] [CrossRef]
- Garcia-Queiruga, J.; Pena-Verdeal, H.; Sabucedo-Villamarin, B.; Giraldez, M.J.; Garcia-Resua, C.; Yebra-Pimentel, E. A cross-sectional study of non-modifiable and modifiable risk factors of dry eye disease states. Cont. Lens Anterior Eye 2023, 46, 101800. [Google Scholar] [CrossRef]
- Wolffsohn, J.S.; Wang, M.T.; Vidal-Rohr, M.; Menduni, F.; Dhallu, S.; Ipek, T.; Acar, D.; Recchioni, A.; France, A.; Kingsnorth, A.; et al. Demographic and lifestyle risk factors of dry eye disease subtypes: A cross-sectional study. Ocul. Surf. 2021, 21, 58–63. [Google Scholar] [CrossRef]
- Savini, G.; Prabhawasat, P.; Kojima, T.; Grueterich, M.; Espana, E.; Goto, E. The challenge of dry eye diagnosis. Clin. Ophthalmol. 2008, 2, 31–55. [Google Scholar] [CrossRef]
- Tutt, R.; Bradley, A.; Begley, C.; Thibos, L.N. Optical and visual impact of tear break-up in human eyes. Investig. Ophthalmol. Vis. Sci. 2000, 41, 4117–4123. [Google Scholar]
- Pflugfelder, S.C. Tear dysfunction and the cornea: LXVIII Edward Jackson Memorial Lecture. Am. J. Ophthalmol. 2011, 152, 900–909.e1. [Google Scholar] [CrossRef]
- Spadea, L.; Maraone, G.; Verboschi, F.; Vingolo, E.M.; Tognetto, D. Effect of corneal light scatter on vision: A review of the literature. Int. J. Ophthalmol. 2016, 9, 459–464. [Google Scholar] [CrossRef] [PubMed]
- Koh, S.; Maeda, N.; Ikeda, C.; Asonuma, S.; Mitamura, H.; Oie, Y.; Soma, T.; Tsujikawa, M.; Kawasaki, S.; Nishida, K. Ocular forward light scattering and corneal backward light scattering in patients with dry eye. Investig. Ophthalmol. Vis. Sci. 2014, 55, 6601. [Google Scholar] [CrossRef] [PubMed]
- Prause, J.U.; Norn, M. Relation between blink frequency and break-up time? Acta Ophthalmol. 1987, 65, 19–22. [Google Scholar] [CrossRef] [PubMed]
- Okumura, Y.; Inomata, T.; Midorikawa-Inomata, A.; Sung, J.; Fujio, K.; Akasaki, Y.; Nakamura, M.; Iwagami, M.; Fujimoto, K.; Eguchi, A.; et al. DryEyeRhythm: A reliable and valid smartphone application for the diagnosis assistance of dry eye. Ocul. Surf. 2022, 25, 19–25. [Google Scholar] [CrossRef] [PubMed]
- Uchino, M.; Kawashima, M.; Uchino, Y.; Suzuki, N.; Mitamura, H.; Mizuno, M.; Hori, Y.; Yokoi, N.; Tsubota, K. The evaluation of dry eye mobile apps for screening of dry eye disease and educational tear event in Japan. Ocul. Surf. 2018, 16, 430–435. [Google Scholar] [CrossRef] [PubMed]
- Singh, S.; Srivastav, S.; Modiwala, Z.; Ali, M.H.; Basu, S. Repeatability, reproducibility and agreement between three different diagnostic imaging platforms for tear film evaluation of normal and dry eye disease. Eye 2023, 37, 2042–2047. [Google Scholar] [CrossRef] [PubMed]
- Samra, K. The eye and visual system in pregnancy, what to expect? An in-depth review. Oman J. Ophthalmol. 2013, 6, 87. [Google Scholar] [CrossRef]
- Tomita, Y.; Nagai, N.; Suzuki, M.; Shinoda, H.; Uchida, A.; Mochimaru, H.; Izumi-Nagai, K.; Sasaki, M.; Tsubota, K.; Ozawa, Y. Functional visual acuity in age-related macular degeneration. Optom. Vis. Sci. 2016, 93, 70–76. [Google Scholar] [CrossRef]
- Taylor, S.R.J.; Lightman, S.L.; Sugar, E.A.; Jaffe, G.J.; Freeman, W.R.; Altaweel, M.M.; Kozak, I.; Holbrook, J.T.; Jabs, D.A.; Kempen, J.H. The impact of macular edema on visual function in intermediate, posterior, and panuveitis. Ocul. Immunol. Inflamm. 2012, 20, 171–181. [Google Scholar] [CrossRef]
- Alves, M.; Asbell, P.; Dogru, M.; Giannaccare, G.; Grau, A.; Gregory, D.; Kim, D.H.; Marini, M.C.; Ngo, W.; Nowinska, A.; et al. TFOS Lifestyle Report: Impact of environmental conditions on the ocular surface. Ocul. Surf. 2023, 29, 1–52. [Google Scholar] [CrossRef]
- Gomes, J.A.P.; Azar, D.T.; Baudouin, C.; Bitton, E.; Chen, W.; Hafezi, F.; Hamrah, P.; Hogg, R.E.; Horwath-Winter, J.; Kontadakis, G.A.; et al. TFOS Lifestyle: Impact of elective medications and procedures on the ocular surface. Ocul. Surf. 2023, 29, 331–385. [Google Scholar] [CrossRef] [PubMed]
- Finger, R.P.; Tellis, B.; Crewe, J.; Keeffe, J.E.; Ayton, L.N.; Guymer, R.H. Developing the impact of Vision Impairment-Very Low Vision (IVI-VLV) questionnaire as part of the LoVADA protocol. Investig. Ophthalmol. Vis. Sci. 2014, 55, 6150–6158. [Google Scholar] [CrossRef] [PubMed]
- Lamoureux, E.L.; Pallant, J.F.; Pesudovs, K.; Rees, G.; Hassell, J.B.; Keeffe, J.E. The impact of vision impairment questionnaire: An assessment of its domain structure using confirmatory factor analysis and rasch analysis. Investig. Ophthalmol. Vis. Sci. 2007, 48, 1001–1006. [Google Scholar] [CrossRef]
- Finger, R.P.; Fenwick, E.; Marella, M.; Dirani, M.; Holz, F.G.; Chiang, P.P.-C.; Lamoureux, E.L. The impact of vision impairment on vision-specific quality of life in Germany. Investig. Ophthalmol. Vis. Sci. 2011, 52, 3613–3619. [Google Scholar] [CrossRef]
- Ratanasukon, M.; Tongsomboon, J.; Bhurayanontachai, P.; Jirarattanasopa, P. The Impact of Vision Impairment (IVI) Questionnaire; Validation of the Thai-Version and the Implementation on Vision-Related Quality of Life in Thai Rural Community. PLoS ONE 2016, 11, e0155509. [Google Scholar] [CrossRef]
- Cochrane, G.M.; Marella, M.; Keeffe, J.E.; Lamoureux, E.L. The Impact of Vision Impairment for Children (IVI_C): Validation of a vision-specific pediatric quality-of-life questionnaire using Rasch analysis. Investig. Ophthalmol. Vis. Sci. 2011, 52, 1632–1640. [Google Scholar] [CrossRef] [PubMed]
- Cochrane, G.; Lamoureux, E.; Keeffe, J. Defining the content for a new quality of life questionnaire for students with low vision (the Impact of Vision Impairment on Children: IVI_C). Ophthalmic Epidemiol. 2008, 15, 114–120. [Google Scholar] [CrossRef] [PubMed]
- Woods, J.; Varikooty, J.; Fonn, D.; Jones, L.W. A novel scale for describing corneal staining. Clin. Ophthalmol. 2018, 12, 2369–2375. [Google Scholar] [CrossRef]
- Ngo, W.; Situ, P.; Keir, N.; Korb, D.; Blackie, C.; Simpson, T. Psychometric properties and validation of the standard patient evaluation of eye dryness questionnaire. Cornea 2013, 32, 1204–1210. [Google Scholar] [CrossRef]
- Singh, S.; Donthineni, P.R.; Srivastav, S.; Jacobi, C.; Basu, S.; Paulsen, F. Lacrimal and meibomian gland evaluation in dry eye disease: A mini-review. Indian J. Ophthalmol. 2023, 71, 1090–1098. [Google Scholar] [CrossRef]
- Arita, R.; Itoh, K.; Maeda, S.; Maeda, K.; Furuta, A.; Fukuoka, S.; Tomidokoro, A.; Amano, S. Proposed diagnostic criteria for obstructive meibomian gland dysfunction. Ophthalmology 2009, 116, 2058–2063.e1. [Google Scholar] [CrossRef] [PubMed]
- Woods, J.; Hutchings, N.; Srinivasan, S.; Jones, L. Geographic distribution of corneal staining in symptomatic dry eye. Ocul. Surf. 2020, 18, 258–266. [Google Scholar] [CrossRef] [PubMed]
- Teo, C.H.Y.; Ong, H.S.; Liu, Y.-C.; Tong, L. Meibomian gland dysfunction is the primary determinant of dry eye symptoms: Analysis of 2346 patients. Ocul. Surf. 2020, 18, 604–612. [Google Scholar] [CrossRef] [PubMed]
- Chhadva, P.; Goldhardt, R.; Galor, A. Meibomian gland disease. Ophthalmology 2017, 124, S20–S26. [Google Scholar] [CrossRef]
- Tsubota, K.; Hata, S.; Okusawa, Y.; Egami, F.; Ohtsuki, T.; Nakamori, K. Quantitative videographic analysis of blinking in normal subjects and patients with dry eye. Arch. Ophthalmol. 1996, 114, 715–720. [Google Scholar] [CrossRef]
- Evinger, C.; Bao, J.-B.; Powers, A.S.; Kassem, I.S.; Schicatano, E.J.; Henriquez, V.M.; Peshori, K.R. Dry eye, blinking, and blepharospasm. Mov. Disord. 2002, 17 (Suppl. S2), S75–S78. [Google Scholar] [CrossRef]
- Tseng, S.C.; Tsubota, K. Important concepts for treating ocular surface and tear disorders. Am. J. Ophthalmol. 1997, 124, 825–835. [Google Scholar] [CrossRef]
- Rolando, M.; Refojo, M.F. Tear evaporimeter for measuring water evaporation rate from the tear film under controlled conditions in humans. Exp. Eye Res. 1983, 36, 25–33. [Google Scholar] [CrossRef]
- Ridder, W.H., 3rd; Tomlinson, A.; Huang, J.-F.; Li, J. Impaired visual performance in patients with dry eye. Ocul. Surf. 2011, 9, 42–55. [Google Scholar] [CrossRef]
- Goto, E.; Ishida, R.; Kaido, M.; Dogru, M.; Matsumoto, Y.; Kojima, T.; Tsubota, K. Optical aberrations and visual disturbances associated with dry eye. Ocul. Surf. 2006, 4, 207–213. [Google Scholar] [CrossRef]
- Schlote, T.; Kadner, G.; Freudenthaler, N. Marked reduction and distinct patterns of eye blinking in patients with moderately dry eyes during video display terminal use. Graefes Arch. Clin. Exp. Ophthalmol. 2004, 242, 306–312. [Google Scholar] [CrossRef] [PubMed]
- Yeo, S.; Tong, L. Coping with dry eyes: A qualitative approach. BMC Ophthalmol. 2018, 18, 8. [Google Scholar] [CrossRef]
- Tong, L.; Tan, J.; Thumboo, J.; Seow, G. Dry eye. BMJ 2012, 345, e7533. [Google Scholar] [CrossRef] [PubMed]
- Deschamps, N.; Ricaud, X.; Rabut, G.; Labbé, A.; Baudouin, C.; Denoyer, A. The impact of dry eye disease on visual performance while driving. Am. J. Ophthalmol. 2013, 156, 184–189.e3. [Google Scholar] [CrossRef] [PubMed]
- Uchino, M.; Uchino, Y.; Dogru, M.; Kawashima, M.; Yokoi, N.; Komuro, A.; Sonomura, Y.; Kato, H.; Kinoshita, S.; Schaumberg, D.A.; et al. Dry eye disease and work productivity loss in visual display users: The Osaka study. Am. J. Ophthalmol. 2014, 157, 294–300. [Google Scholar] [CrossRef] [PubMed]
- Yamada, M.; Mizuno, Y.; Shigeyasu, C. Impact of dry eye on work productivity. Clin. Outcomes Res. 2012, 4, 307–312. [Google Scholar] [CrossRef] [PubMed]
- Reddy, P.; Grad, O.; Rajagopalan, K. The economic burden of dry eye: A conceptual framework and preliminary assessment. Cornea 2004, 23, 751–761. [Google Scholar] [CrossRef] [PubMed]
- Uchino, M.; Schaumberg, D.A. Dry Eye Disease: Impact on Quality of Life and Vision. Curr. Ophthalmol. Rep. 2013, 1, 51–57. [Google Scholar] [CrossRef]
- Galor, A.; Britten-Jones, A.C.; Feng, Y.; Ferrari, G.; Goldblum, D.; Gupta, P.K.; Merayo-Lloves, J.; Na, K.-S.; Naroo, S.A.; Nichols, K.K.; et al. TFOS Lifestyle: Impact of lifestyle challenges on the ocular surface. Ocul. Surf. 2023, 28, 262–303. [Google Scholar] [CrossRef]
- Liyue, H.; Chiang, P.P.-C.; Sung, S.C.; Tong, L. Dry Eye-Related Visual Blurring and Irritative Symptoms and Their Association with Depression and Anxiety in Eye Clinic Patients. Curr. Eye Res. 2016, 41, 590–599. [Google Scholar] [CrossRef]
- Morthen, M.K.; Magno, M.S.; Utheim, T.P.; Snieder, H.; Hammond, C.J.; Vehof, J. The physical and mental burden of dry eye disease: A large population-based study investigating the relationship with health-related quality of life and its determinants. Ocul. Surf. 2021, 21, 107–117. [Google Scholar] [CrossRef] [PubMed]
- Schein, O.D.; Muñoz, B.; Tielsch, J.M.; Bandeen-Roche, K.; West, S. Prevalence of dry eye among the elderly. Am. J. Ophthalmol. 1997, 124, 723–728. [Google Scholar] [CrossRef] [PubMed]
- Moss, S.E.; Klein, R.; Klein, B.E. Prevalence of and risk factors for dry eye syndrome. Arch. Ophthalmol. 2000, 118, 1264–1268. [Google Scholar] [CrossRef] [PubMed]
- McCarty, C.A.; Bansal, A.K.; Livingston, P.M.; Stanislavsky, Y.L.; Taylor, H.R. The epidemiology of dry eye in Melbourne, Australia. Ophthalmology 1998, 105, 1114–1119. [Google Scholar] [CrossRef] [PubMed]
- Den, S.; Shimizu, K.; Ikeda, T.; Tsubota, K.; Shimmura, S.; Shimazaki, J. Association between meibomian gland changes and aging, sex, or tear function. Cornea 2006, 25, 651–655. [Google Scholar] [CrossRef] [PubMed]
- Hykin, P.G.; Bron, A.J. Age-related morphological changes in lid margin and meibomian gland anatomy. Cornea 1992, 11, 334–342. [Google Scholar] [CrossRef] [PubMed]
- Schaumberg, D.A.; Dana, R.; Buring, J.E.; Sullivan, D.A. Prevalence of dry eye disease among US men: Estimates from the Physicians’ Health Studies. Arch. Ophthalmol. 2009, 127, 763–768. [Google Scholar] [CrossRef]
- Schaumberg, D.A.; Sullivan, D.A.; Buring, J.E.; Dana, M.R. Prevalence of dry eye syndrome among US women. Am. J. Ophthalmol. 2003, 136, 318–326. [Google Scholar] [CrossRef]
- Sullivan, B.D.; Evans, J.E.; Dana, M.R.; Sullivan, D.A. Influence of aging on the polar and neutral lipid profiles in human meibomian gland secretions. Arch. Ophthalmol. 2006, 124, 1286–1292. [Google Scholar] [CrossRef]
- Norn, M. Expressibility of meibomian secretion. Relation to age, lipid precorneal film, scales, foam, hair and pigmentation. Acta Ophthalmol. 1987, 65, 137–142. [Google Scholar] [CrossRef]
- Arita, R.; Itoh, K.; Inoue, K.; Amano, S. Noncontact infrared meibography to document age-related changes of the meibomian glands in a normal population. Ophthalmology 2008, 115, 911–915. [Google Scholar] [CrossRef] [PubMed]
- Sirigu, P.; Shen, R.L.; Pinto da Silva, P. Human meibomian glands: The ultrastructure of acinar cells as viewed by thin section and freeze-fracture transmission electron microscopies. Investig. Ophthalmol. Vis. Sci. 1992, 33, 2284–2292. [Google Scholar]
- Obata, H.; Horiuchi, H.; Miyata, K.; Tsuru, T.; Machinami, R. Histopathological study of the meibomian glands in 72 autopsy cases. Nihon Ganka Gakkai Zasshi 1994, 98, 765–771. [Google Scholar] [PubMed]
- Obata, H. Anatomy and histopathology of human meibomian gland. Cornea 2002, 21 (Suppl. S7), S70–S74. [Google Scholar] [CrossRef] [PubMed]
- Lane, J.; Zimmerman, M.; Mathers, W. Tear film changes associated with normal aging. Am. J. Ophthalmol. 1996, 122, 290. [Google Scholar] [CrossRef]
- Nien, C.J.; Massei, S.; Lin, G.; Nabavi, C.; Tao, J.; Brown, D.J.; Paugh, J.R.; Jester, J.V. Effects of age and dysfunction on human meibomian glands. Arch. Ophthalmol. 2011, 129, 462–469. [Google Scholar] [CrossRef]
- Kaido, M.; Ishida, R.; Dogru, M.; Tsubota, K. The relation of functional visual acuity measurement methodology to tear functions and ocular surface status. Jpn. J. Ophthalmol. 2011, 55, 451–459. [Google Scholar] [CrossRef]
- Tsubota, K.; Yokoi, N.; Shimazaki, J.; Watanabe, H.; Dogru, M.; Yamada, M.; Kinoshita, S.; Kim, H.-M.; Tchah, H.-W.; Hyon, J.Y.; et al. New Perspectives on Dry Eye Definition and Diagnosis: A Consensus Report by the Asia Dry Eye Society. Ocul. Surf. 2017, 15, 65–76. [Google Scholar] [CrossRef]


| Overall | Severe DED | Mild DED | p-Value | |
|---|---|---|---|---|
| Overall N (%) | 78 (100) | 30 (38.5) | 48 (61.5) | |
| Gender N (%) | ||||
| Male | 20 (25.6) | 8 (40) | 12 (60) | 1.00 |
| Female | 58 (74.4) | 22 (37.9) | 36 (62.1) | |
| Age | ||||
| Mean (SD) | 63.1 (10.7) | 63.9 (11.2) | 62.7 (10.4) | 0.63 |
| <50 years | 9 | 3 | 6 | 1.00 |
| ≥50 years | 69 | 27 | 42 | |
| Overall (n = 78) | Severe DED (n = 30) | Mild DED (n = 48) | p-Value | |
|---|---|---|---|---|
| Allergies (Eczema, sinusitis, childhood asthma) | ||||
| Present | 23 | 10 | 13 | 0.62 |
| Absent | 55 | 20 | 35 | |
| Dry mouth | ||||
| Present | 20 | 9 | 11 | 0.60 |
| Absent | 58 | 21 | 37 | |
| Contact lens | ||||
| Wearer | 4 | 2 | 2 | 0.64 |
| Non-wearer | 74 | 28 | 46 | |
| Systemic diseases | ||||
| Rheumatoid Arthritis | 3 | 2 | 1 | 0.56 |
| Thyroid disease | 7 | 3 | 4 | 1.00 |
| Sjogren’s syndrome | 4 | 3 | 1 | 0.29 |
| Diabetes Mellitus Type I | 7 | 3 | 4 | 1.00 |
| Diabetes Mellitus Type II | 2 | 0 | 2 | 0.52 |
| Diet-controlled or Impaired glucose tolerance | 1 | 0 | 1 | 1.00 |
| None of the above | 58 | 21 | 37 | |
| Medications | ||||
| Oral contraceptives | 0 | 0 | 0 | 1.00 |
| Antihistamine | 8 | 1 | 7 | 0.14 |
| Anti-hypertensive | 19 | 7 | 12 | 1.00 |
| Antidepressants | 0 | 0 | 0 | 1.00 |
| Anti-Parkinson’s | 0 | 0 | 0 | 1.00 |
| Lomotil | 0 | 0 | 0 | 1.00 |
| Immunosuppressant (Prednisolone, cyclosporine, SMF, tacrolimus) | 2 | 1 | 1 | 1.00 |
| None of the above | 51 | 22 | 29 | |
| History of Ocular surgery | ||||
| LASIK | ||||
| R eye | 2 | 1 | 1 | 1.00 |
| L eye | 0 | 0 | 0 | 1.00 |
| Bilateral | 4 | 1 | 3 | 1.00 |
| Cataract 1 | ||||
| R eye | 1 | 1 | 0 | 0.39 |
| L eye | 2 | 0 | 2 | 0.52 |
| Bilateral | 22 | 12 | 10 | 0.077 |
| Others 2 | 6 | 3 | 3 | 0.67 |
| Smoking | 0 | 0 | 0 | 1.00 |
| Overall (n = 78) | Severe DED (n = 30) | Mild DED (n = 48) | p-Value | |
|---|---|---|---|---|
| NIBUT (%) R eye | ||||
| <3 s n (%) | 11 (14.1) | 2 (18.2) | 9 (81.8) | 0.19 |
| > or =3 s n (%) | 67 (85.9) | 28 (41.8) | 39 (58.2) | |
| NIBUT (%) L eye | ||||
| <3 s n (%) | 12 (15.4) | 8 (66.7) | 4 (33.3) | 0.050 |
| > or =3 s n (%) | 66 (84.6) | 22 (33.3) | 44 (66.7) | |
| NIBUT (s) | ||||
| Mean (SD) | 8.29 (6.35) | 6.89 (5.46) | 9.15 (6.73) | 0.13 |
| Staining grade (superior) R eye | ||||
| Mean (SD) | 0.22 (0.66) | 0.55 (0.97) | 0.02 (0.14) | <0.001 |
| Staining grade (inferior) R eye | ||||
| Mean (SD) | 1.18 (1.41) | 2.45 (1.35) | 0.39 (0.67) | <0.001 |
| Staining grade (nasal) R eye | ||||
| Mean (SD) | 0.83 (1.32) | 1.97 (1.50) | 0.13 (0.38) | <0.001 |
| Staining grade (temporal) R eye | ||||
| Mean (SD) | 0.64 (1.11) | 1.52 (1.32) | 0.09 (0.41) | <0.001 |
| Staining grade (central) R eye | ||||
| Mean (SD) | 0.63 (1.12) | 1.65 (1.27) | 0 (0) | <0.001 |
| Staining grade (total) R eye | ||||
| Mean (SD) | 3.51 (4.88) | 8.13 (5.05) | 0.63 (1.07) | <0.001 |
| Staining grade (superior) L eye | ||||
| Mean (SD) | 0.46 (0.83) | 1.03 (1.02) | 0.10 (0.37) | <0.001 |
| Staining grade (inferior) L eye | ||||
| Mean (SD) | 1.21 (1.48) | 2.57 (1.40) | 0.35 (0.68) | <0.001 |
| Staining grade (nasal) L eye | ||||
| Mean (SD) | 1.12 (1.45) | 2.55 (1.33) | 0.23 (0.47) | <0.001 |
| Staining grade (temporal) L eye | ||||
| Mean (SD) | 0.81 (1.37) | 2.05 (1.53) | 0.04 (0.20) | <0.001 |
| Staining grade (central) L eye | ||||
| Mean (SD) | 0.79 (1.32) | 2.07 (1.38) | 0 (0) | <0.001 |
| Staining grade (total) L eye | ||||
| Mean (SD) | 4.40 (5.70) | 10.3 (5.19) | 0.73 (0.99) | <0.001 |
| SPEED | ||||
| Mean (SD) | 6.40 (6.32) | 8.17 (6.64) | 5.29 (5.92) | 0.050 |
| Overall (n = 77) | Severe DED (n = 30) | Mild DED (n = 47 1) | p-Value | |
|---|---|---|---|---|
| Schirmer reading (R eye) | ||||
| Mean (SD) | 6.56 (8.70) | 3.53 (5.54) | 8.49 (9.80) | 0.014 |
| Schirmer reading (R eye) | ||||
| Normal (>15 mm) | 10 | 1 | 9 | 0.079 |
| Low normal (11–15 mm) | 6 | 2 | 4 | 1.00 |
| Borderline (6–10 mm) | 11 | 4 | 7 | 1.00 |
| Abnormal (<6 mm) | 50 | 23 | 27 | 0.094 |
| Schirmer reading (L eye) | ||||
| Mean (SD) | 6.14 (8.53) | 4.1 (7.10) | 7.45 (9.17) | 0.093 |
| Schirmer reading (L eye) | ||||
| Normal (>15 mm) | 9 | 1 | 8 | 0.082 |
| Low normal (10–15 mm) | 5 | 3 | 2 | 0.37 |
| Borderline (6–10 mm) | 13 | 4 | 9 | 0.76 |
| Abnormal (<6 mm) | 50 | 22 | 28 | 0.23 |
| Overall (n = 78) | Severe DED (n = 30) | Mild DED (n = 48) | p-Value | |
|---|---|---|---|---|
| Number of Meibomian glands expressed (R eye) | ||||
| Mean (SD) | 2.14 (1.86) | 2.03 (1.75) | 2.21 (1.93) | 0.69 |
| Median (Range) | 2 (0–8) | 2 (0–6) | 2 (0–8) | |
| Meibomian gland expression character (R eye) | ||||
| Liquid | 53 | 16 | 37 | 0.045 |
| Viscous | 18 | 10 | 8 | 0.11 |
| Not expressible | 7 | 4 | 3 | 0.42 |
| Number of Meibomian glands expressed (L eye) | ||||
| Mean (SD) | 2.76 (2.34) | 2.57 (2.03) | 2.88 (2.53) | 0.58 |
| Median (Range) | 3 (0–10) | 2 (0–8) | 3 (0–10) | |
| Meibomian gland expression character (L eye) | ||||
| Liquid | 53 | 15 | 38 | 0.012 |
| Viscous | 19 | 11 | 8 | 0.060 |
| Not expressible | 6 | 4 | 2 | 0.20 |
| Overall | Severe DED 1 | Mild DED | p-Value | |
|---|---|---|---|---|
| Mean (SD) | 0.67 (0.28) | 0.60 (0.28) | 0.71 (0.28) | 0.096 |
| N | 76 | 28 | 48 | |
| Gender | ||||
| Male | ||||
| Mean (SD) | 0.72 (0.29) | 0.80 (0.37) | 0.66 (0.22) | 0.29 |
| N | 20 | 8 | 12 | |
| Female | ||||
| Mean (SD) | 0.66 (0.28) | 0.52 (0.20) | 0.73 (0.30) | 0.006 |
| N | 56 | 20 | 36 | |
| Age | ||||
| ≤50 years | ||||
| Mean (SD) | 0.96 (0.35) | 0.84 (0.23) | 1.02 (0.40) | 0.49 |
| N | 9 | 3 | 6 | |
| >50 years | ||||
| Mean (SD) | 0.63 (0.25) | 0.57 (0.28) | 0.67 (0.23) | 0.13 |
| N | 67 | 25 | 42 | |
| Overall (n = 76) | FVA ≤ 0.6 (n = 32) | FVA > 0.6 (n = 44) | p-Value | |
|---|---|---|---|---|
| Gender N (%) | ||||
| Male | 20 | 8 (40) | 12 (60) | 1.00 |
| Female | 56 | 24 (42.9) | 32 (57.1) | |
| Age | ||||
| Mean (SD) | 62.8 (10.6) | 68.2 (7.68) | 58.9 (10.7) | <0.001 |
| Staining Grade (total) | ||||
| Mean (SD) | 3.67 (5.08) | 4.42 (5.10) | 3.13 (5.02) | 0.28 |
| NIBUT (s) 1 | ||||
| Mean (SD) | 8.39 (6.39) | 7.26 (5.50) | 9.22 (6.89) | 0.19 |
| Schirmer 2 | ||||
| Mean (SD) | 6.45 (8.66) | 3.15 (3.69) | 8.78 (10.3) | 0.005 |
| Number of Meibomian glands expressed | ||||
| Mean (SD) | 2.46 (2.14) | 2.17 (2.18) | 2.67 (2.10) | 0.32 |
| Median (Range) | 2 (0–10) | 2 (0–10) | 3 (0–9) | |
| SPEED 3 | ||||
| Mean (SD) | 6.43 (6.35) | 6.03 (7.01) | 6.73 (5.88) | 0.64 |
| Overall (n = 78) | Severe DED (n = 30) | Comparison (n = 48) | p-Value | |
|---|---|---|---|---|
| IVI (Total) | ||||
| Mean (SD) | 75.9 (12.5) | 75.2 (11.1) | 76.3 (13.3) | 0.7 |
| Median (Range) | 82 (13–82) | 82 (39–82) | 82 (13–82) | |
| Gender | ||||
| Male | ||||
| Mean (SD) | 73.8 (12.4) | 69 (12.0) | 76.9 (12.2) | 0.17 |
| Median (Range) | 82 (45–82) | 68 (52–82) | 82 (45–82) | |
| N | 20 | 8 | 12 | |
| Female | ||||
| Mean (SD) | 76.6 (12.5) | 77.4 (10.1) | 76.1 (13.8) | 0.7 |
| Median (Range) | 82 (13–82) | 82 (39–82) | 82 (13–82) | |
| N | 58 | 22 | 36 | |
| Age | ||||
| ≤50 years | ||||
| Mean (SD) | 74.4 (12.5) | 74.3 (7.09) | 74.5 (15.1) | 0.99 |
| Median (Range) | 81 (44–82) | 73 (68–82) | 81.5 (44–82) | |
| N | 9 | 3 | 6 | |
| >50 years | ||||
| Mean (SD) | 76.0 (12.5) | 75.3 (11.6) | 76.5 (13.2) | 0.68 |
| Median (Range) | 82 (13–82) | 82 (39–82) | 82 (13–82) | |
| N | 69 | 27 | 42 | |
| IVI Q1 In the past month, how much has your eyesight interfered with your ability to see and enjoy TV? | ||||
| A lot, a fair amount, a little of the time | 12 | 6 | 6 | 0.52 |
| Not at all | 65 | 24 | 41 | |
| Don’t do this for other reasons | 1 | 0 | 1 | |
| IVI Q2 In the past month, how much has your eyesight interfered with taking part in recreational activities such as bowling, walking or golf? | ||||
| A lot, a fair amount, a little of the time | 5 | 1 | 4 | 0.65 |
| Not at all | 70 | 27 | 43 | |
| Don’t do this for other reasons | 3 | 2 | 1 | |
| IVI Q3 In the past month, how much has your eyesight interfered with shopping (finding what you want and paying for it)? | ||||
| A lot, a fair amount, a little of the time | 10 | 3 | 7 | 0.73 |
| Not at all | 67 | 26 | 41 | |
| Don’t do this for other reasons | 1 | 1 | 0 | |
| IVI Q4 In the past month, how much has your eyesight interfered with visiting friends or family? | ||||
| A lot, a fair amount, a little of the time | 6 | 2 | 4 | 1 |
| Not at all | 71 | 27 | 44 | |
| Don’t do this for other reasons | 1 | 1 | 0 | |
| IVI Q5 In the past month, how much has your eyesight interfered with recognising or meeting people? | ||||
| A lot, a fair amount, a little of the time | 7 | 5 | 2 | 0.1 |
| Not at all | 71 | 25 | 46 | |
| Don’t do this for other reasons | 0 | 0 | 0 | |
| IVI Q6 In the past month, how much has your eyesight interfered with generally looking after your appearance (face, hair, clothing, etc.)? | ||||
| A lot, a fair amount, a little of the time | 4 | 1 | 3 | 1 |
| Not at all | 74 | 29 | 45 | |
| Don’t do this for other reasons | 0 | 0 | 0 | |
| IVI Q7 In the past month, how much has your eyesight interfered with opening packaging (for example, around food, medicines)? | ||||
| A lot, a fair amount, a little of the time | 4 | 1 | 3 | 1 |
| Not at all | 74 | 29 | 45 | |
| Don’t do this for other reasons | 0 | 0 | 0 | |
| IVI Q8 In the past month, how much has your eyesight interfered with reading labels or instructions on medicines? | ||||
| A lot, a fair amount, a little of the time | 10 | 3 | 7 | 0.73 |
| Not at all | 68 | 27 | 41 | |
| Don’t do this for other reasons | 0 | 0 | 0 | |
| IVI Q9 In the past month, how much has your eyesight interfered with operating household appliances and the telephone? | ||||
| A lot, a fair amount, a little of the time | 4 | 0 | 4 | 0.16 |
| Not at all | 74 | 30 | 44 | |
| Don’t do this for other reasons | 0 | 0 | 0 | |
| IVI Q10 How much has your eyesight interfered with moving about outdoors (on the pavement or crossing the street)? | ||||
| A lot, a fair amount, a little of the time | 8 | 3 | 5 | 1 |
| Not at all | 70 | 27 | 43 | |
| Don’t do this for other reasons | 0 | 0 | 0 | |
| IVI Q11 In the past month, how much has your eyesight made you move carefully to avoid falling or tripping? | ||||
| A lot, a fair amount, a little of the time | 10 | 4 | 6 | 1 |
| Not at all | 66 | 25 | 41 | |
| Don’t do this for other reasons | 2 | 1 | 1 | |
| IVI Q12 In general, how much has your eyesight interfered with travelling or using transport (bus and train)? | ||||
| A lot, a fair amount, a little of the time | 10 | 6 | 4 | 0.18 |
| Not at all | 67 | 24 | 43 | |
| Don’t do this for other reasons | 1 | 0 | 1 | |
| IVI Q13 In the past month, how much has your eyesight interfered with going down steps, stairs or curbs? | ||||
| A lot, a fair amount, a little of the time | 13 | 8 | 5 | 0.12 |
| Not at all | 65 | 22 | 43 | |
| Don’t do this for other reasons | 0 | 0 | 0 | |
| IVI Q14 In the past month, how much has your eyesight interfered with reading ordinary size print (for example, newspapers)? | ||||
| A lot, a fair amount | 13 | 4 | 9 | 0.76 |
| Not at all | 64 | 26 | 38 | |
| Don’t do this for other reasons | 1 | 0 | 1 | |
| IVI Q15 In the past month, how much has your eyesight interfered with getting information that you need? | ||||
| A lot, a fair amount | 12 | 5 | 7 | 1 |
| Not at all | 66 | 25 | 41 | |
| Don’t do this for other reasons | 0 | 0 | 0 | |
| IVI Q16 In the past month, how much has your eyesight made you concerned or worried about your general safety at home? | ||||
| A lot, a fair amount, a little of the time | 6 | 3 | 3 | 0.67 |
| Not at all | 72 | 27 | 45 | |
| IVI Q17 In the past month, how much has your eyesight made you concerned or worried about spilling or breaking things? | ||||
| A lot, a fair amount, a little of the time | 4 | 1 | 3 | 1 |
| Not at all | 74 | 29 | 45 | |
| IVI Q18 In the past month, how much has your eyesight made you concerned or worried about your general safety when out of your home? | ||||
| A lot, a fair amount, a little of the time | 8 | 5 | 3 | 0.25 |
| Not at all | 70 | 25 | 45 | |
| IVI Q19 In the past month, how often has your eyesight stopped you from doing the things you want to do? | ||||
| A lot, a fair amount, a little of the time | 12 | 6 | 6 | 0.52 |
| Not at all | 66 | 24 | 42 | |
| IVI Q20 In the past month, how often have you needed help from other people because of your eyesight? | ||||
| A lot, a fair amount, a little of the time | 8 | 5 | 3 | 0.25 |
| Not at all | 70 | 25 | 45 | |
| IVI Q21 Have you felt embarrassed because of your eyesight? | ||||
| A lot, a fair amount, a little of the time | 5 | 3 | 2 | 0.37 |
| Not at all | 73 | 27 | 46 | |
| IVI Q22 Have you felt frustrated or annoyed because of your eyesight? | ||||
| A lot, a fair amount, a little of the time | 17 | 6 | 11 | 1 |
| Not at all | 61 | 24 | 37 | |
| IVI Q23 Have you felt lonely or isolated because of your eyesight? | ||||
| A lot, a fair amount, a little of the time | 4 | 2 | 2 | 0.64 |
| Not at all | 74 | 28 | 46 | |
| IVI Q24 Have you ever felt sad or low because of your eyesight? | ||||
| A lot, a fair amount, a little of the time | 11 | 6 | 5 | 0.32 |
| Not at all | 67 | 24 | 43 | |
| IVI Q25 In the past month, how often have you worried about your eyesight getting worse? | ||||
| A lot, a fair amount, a little of the time | 22 | 10 | 12 | 0.45 |
| Not at all | 56 | 20 | 36 | |
| IVI Q26 In the past month, how often has your eyesight made you concerned or worried about coping with everyday life? | ||||
| A lot, a fair amount, a little of the time | 17 | 10 | 7 | 0.089 |
| Not at all | 61 | 20 | 41 | |
| IVI Q27 Have you felt like a nuisance or a burden because of your eyesight? | ||||
| A lot, a fair amount, a little of the time | 8 | 4 | 4 | 0.48 |
| Not at all | 70 | 26 | 44 | |
| IVI Q28 In the past month, how much has your eyesight interfered with your life in general? | ||||
| A lot, a fair amount, a little of the time | 17 | 10 | 7 | 0.089 |
| Not at all | 61 | 20 | 41 | |
| Parameter | Model 1 † Odds Ratio (95% Confidence Interval) | Model 2 †† Odds Ratio (95% Confidence Interval) | Model 3 ††† Odds Ratio (95% Confidence Interval) |
|---|---|---|---|
| Dry eye status | 3.25 (1.07, 9.91) * | 3.79 (1.19, 12.07) * | 3.34 (1.02, 10.95) * |
| Parameter | Model 1 † Odds Ratio (95% Confidence Interval) | Model 2 †† Odds Ratio (95% Confidence Interval) | Model 3 ††† Odds Ratio (95% Confidence Interval) |
|---|---|---|---|
| Dry eye status | 3.25 (1.07, 9.91) * | 4.12 (1.23, 13.84) * | 3.84 (1.12, 13.2) * |
| Overall (n = 76) | FVA ≤ 0.6 (n = 32) | FVA > 0.6 (n = 44) | p-Value | |
|---|---|---|---|---|
| IVI (Total) | ||||
| Mean (SD) | 75.7 (12.6) | 73.8 (15.9) | 77.0 (9.43) | 0.28 |
| Median (Range) | 82 (13–82) | 82 (13–82) | 82 (44–82) | |
| IVI Q1 In the past month, how much has your eyesight interfered with your ability to see and enjoy TV? | ||||
| A lot, a fair amount, a little of the time | 12 | 4 | 8 | 0.54 |
| Not at all | 63 | 28 | 35 | |
| Don’t do this for other reasons | 1 | 0 | 1 | |
| IVI Q2 In the past month, how much has your eyesight interfered with taking part in recreational activities such as bowling, walking or golf? | ||||
| A lot, a fair amount, a little of the time | 5 | 2 | 3 | 1 |
| Not at all | 68 | 27 | 41 | |
| Don’t do this for other reasons | 3 | 3 | 0 | |
| IVI Q3 In the past month, how much has your eyesight interfered with shopping (finding what you want and paying for it)? | ||||
| A lot, a fair amount, a little of the time | 10 | 4 | 6 | 1 |
| Not at all | 65 | 27 | 38 | |
| Don’t do this for other reasons | 1 | 1 | 0 | |
| IVI Q4 In the past month, how much has your eyesight interfered with visiting friends or family? | ||||
| A lot, a fair amount, a little of the time | 6 | 4 | 2 | 0.39 |
| Not at all | 69 | 28 | 41 | |
| Don’t do this for other reasons | 1 | 0 | 1 | |
| IVI Q5 In the past month, how much has your eyesight interfered with recognising or meeting people? | ||||
| A lot, a fair amount, a little of the time | 7 | 4 | 3 | 0.45 |
| Not at all | 69 | 28 | 41 | |
| Don’t do this for other reasons | 0 | 0 | 0 | |
| IVI Q6 In the past month, how much has your eyesight interfered with generally looking after your appearance (face, hair, clothing, etc.)? | ||||
| A lot, a fair amount, a little of the time | 4 | 1 | 3 | 0.63 |
| Not at all | 72 | 31 | 41 | |
| Don’t do this for other reasons | 0 | 0 | 0 | |
| IVI Q7 In the past month, how much has your eyesight interfered with opening packaging (for example, around food, medicines)? | ||||
| A lot, a fair amount, a little of the time | 4 | 2 | 2 | 1 |
| Not at all | 72 | 30 | 42 | |
| Don’t do this for other reasons | 0 | 0 | 0 | |
| IVI Q8 In the past month, how much has your eyesight interfered with reading labels or instructions on medicines? | ||||
| A lot, a fair amount, a little of the time | 10 | 2 | 8 | 0.18 |
| Not at all | 66 | 30 | 36 | |
| Don’t do this for other reasons | 0 | 0 | 0 | |
| IVI Q9 In the past month, how much has your eyesight interfered with operating household appliances and the telephone? | ||||
| A lot, a fair amount, a little of the time | 4 | 2 | 2 | 1 |
| Not at all | 72 | 30 | 42 | |
| Don’t do this for other reasons | 0 | 0 | 0 | |
| IVI Q10 How much has your eyesight interfered with moving about outdoors (on the pavement or crossing the street)? | ||||
| A lot, a fair amount, a little of the time | 8 | 3 | 5 | 1 |
| Not at all | 68 | 29 | 39 | |
| Don’t do this for other reasons | 0 | 0 | 0 | |
| IVI Q11 In the past month, how much has your eyesight made you move carefully to avoid falling or tripping? | ||||
| A lot, a fair amount, a little of the time | 10 | 5 | 5 | 0.51 |
| Not at all | 64 | 25 | 39 | |
| Don’t do this for other reasons | 2 | 2 | 0 | |
| IVI Q12 In general, how much has your eyesight interfered with travelling or using transport (bus and train)? | ||||
| A lot, a fair amount, a little of the time | 10 | 6 | 4 | 0.3 |
| Not at all | 65 | 25 | 40 | |
| Don’t do this for other reasons | 1 | 1 | 0 | |
| IVI Q13 In the past month, how much has your eyesight interfered with going down steps, stairs or curbs? | ||||
| A lot, a fair amount, a little of the time | 13 | 7 | 6 | 0.37 |
| Not at all | 63 | 25 | 38 | |
| Don’t do this for other reasons | 0 | 0 | 0 | |
| IVI Q14 In the past month, how much has your eyesight interfered with reading ordinary size print (for example, newspapers)? | ||||
| A lot, a fair amount | 13 | 5 | 8 | 1 |
| Not at all | 62 | 26 | 36 | |
| Don’t do this for other reasons | 1 | 1 | 0 | |
| IVI Q15 In the past month, how much has your eyesight interfered with getting information that you need? | ||||
| A lot, a fair amount | 12 | 4 | 8 | 0.55 |
| Not at all | 64 | 28 | 36 | |
| Don’t do this for other reasons | 0 | 0 | 0 | |
| IVI Q16 In the past month, how much has your eyesight made you concerned or worried about your general safety at home? | ||||
| A lot, a fair amount, a little of the time | 6 | 3 | 3 | 0.69 |
| Not at all | 70 | 29 | 41 | |
| IVI Q17 In the past month, how much has your eyesight made you concerned or worried about spilling or breaking things? | ||||
| A lot, a fair amount, a little of the time | 4 | 3 | 1 | 0.3 |
| Not at all | 72 | 29 | 43 | |
| IVI Q18 In the past month, how much has your eyesight made you concerned or worried about your general safety when out of your home? | ||||
| A lot, a fair amount, a little of the time | 8 | 4 | 4 | 0.71 |
| Not at all | 68 | 28 | 40 | |
| IVI Q19 In the past month, how often has your eyesight stopped you from doing the things you want to do? | ||||
| A lot, a fair amount, a little of the time | 12 | 7 | 5 | 0.34 |
| Not at all | 64 | 25 | 39 | |
| IVI Q20 In the past month, how often have you needed help from other people because of your eyesight? | ||||
| A lot, a fair amount, a little of the time | 8 | 5 | 3 | 0.27 |
| Not at all | 68 | 27 | 41 | |
| IVI Q21 Have you felt embarrassed because of your eyesight? | ||||
| A lot, a fair amount, a little of the time | 5 | 3 | 2 | 0.64 |
| Not at all | 71 | 29 | 42 | |
| IVI Q22 Have you felt frustrated or annoyed because of your eyesight? | ||||
| A lot, a fair amount, a little of the time | 17 | 7 | 10 | 1 |
| Not at all | 59 | 25 | 34 | |
| IVI Q23 Have you felt lonely or isolated because of your eyesight? | ||||
| A lot, a fair amount, a little of the time | 4 | 2 | 2 | 1 |
| Not at all | 72 | 30 | 42 | |
| IVI Q24 Have you ever felt sad or low because of your eyesight? | ||||
| A lot, a fair amount, a little of the time | 11 | 5 | 6 | 1 |
| Not at all | 65 | 27 | 38 | |
| IVI Q25 In the past month, how often have you worried about your eyesight getting worse? | ||||
| A lot, a fair amount, a little of the time | 22 | 9 | 13 | 1 |
| Not at all | 54 | 23 | 31 | |
| IVI Q26 In the past month, how often has your eyesight made you concerned or worried about coping with everyday life? | ||||
| A lot, a fair amount, a little of the time | 17 | 7 | 10 | 1 |
| Not at all | 59 | 25 | 34 | |
| IVI Q27 Have you felt like a nuisance or a burden because of your eyesight? | ||||
| A lot, a fair amount, a little of the time | 8 | 5 | 3 | 0.27 |
| Not at all | 68 | 27 | 41 | |
| IVI Q28 In the past month, how much has your eyesight interfered with your life in general? | ||||
| A lot, a fair amount, a little of the time | 17 | 6 | 11 | 0.59 |
| Not at all | 59 | 26 | 33 | |
Disclaimer/Publisher’s Note: The statements, opinions and data contained in all publications are solely those of the individual author(s) and contributor(s) and not of MDPI and/or the editor(s). MDPI and/or the editor(s) disclaim responsibility for any injury to people or property resulting from any ideas, methods, instructions or products referred to in the content. |
© 2023 by the authors. Licensee MDPI, Basel, Switzerland. This article is an open access article distributed under the terms and conditions of the Creative Commons Attribution (CC BY) license (https://creativecommons.org/licenses/by/4.0/).
Share and Cite
Tan, L.H.-P.; Tong, L. The Association of Dry Eye Disease with Functional Visual Acuity and Quality of Life. J. Clin. Med. 2023, 12, 7484. https://doi.org/10.3390/jcm12237484
Tan LH-P, Tong L. The Association of Dry Eye Disease with Functional Visual Acuity and Quality of Life. Journal of Clinical Medicine. 2023; 12(23):7484. https://doi.org/10.3390/jcm12237484
Chicago/Turabian StyleTan, Lydia Hui-Peng, and Louis Tong. 2023. "The Association of Dry Eye Disease with Functional Visual Acuity and Quality of Life" Journal of Clinical Medicine 12, no. 23: 7484. https://doi.org/10.3390/jcm12237484
APA StyleTan, L. H.-P., & Tong, L. (2023). The Association of Dry Eye Disease with Functional Visual Acuity and Quality of Life. Journal of Clinical Medicine, 12(23), 7484. https://doi.org/10.3390/jcm12237484