
Extended Preoperative Audiometry for Outcome Prediction and Risk Analysis in Patients Receiving Cochlear Implants

Abstract
:1. Introduction
- -
- To assess whether including preoperative word comprehension at 80 dBSPL with a hearing aid improved the prediction of postoperative speech comprehension with a CI. This was also considered in relation to preoperative maximum word recognition.
- -
- To investigate whether preoperative two-digit number comprehension and the four-frequency pure-tone average of the frequencies 0.5, 1, 2, 4 kHz (4FPTA) are relevant factors for postoperative outcome with CI.
- -
- To set up a multivariate model based on an extended dataset of preoperative audiometric diagnostics and thus to predict postoperative speech comprehension with a CI.
2. Materials and Methods
2.1. Patients
- -
- Unknown: no specific disease
- -
- Middle ear: cholesteatoma, surgery of the stapes, otitis media, otosclerosis
- -
- Congenital: unspecified congenital hearing loss and hypoxia at birth
- -
- Trauma: external forces, such as accident, acoustic trauma or occupationally related repeated acute exposure to damaging sound levels
- -
- MMR: mumps, measles, rubella
- -
- Genetics: family connection and/or medical diagnosis or suspicion of relevant hereditary factors
- -
- General infection: post-infection condition and temporal relationship with the onset of hearing loss
- -
- Syndromic complexes: syndromic disorders, (e.g., Mondini, Wolfram or Cogan syndrome)
- -
- Ototoxic treatments: chemotherapy, or substances such as gentamycin.
- -
- Idiopathic sudden sensorineural hearing loss identified in medical and audiological diagnosis
- -
- Meningitis
- -
- Ménière’s disease
- -
- Miscellaneous: rare individual cases including enlarged vestibular aqueduct (EVA) syndrome, cerebral haemorrhage and microcephaly.
2.2. Audiometry
- (i)
- the pure-tone audiometry under air conduction at 500, 1000, 2000, and 4000 Hz,
- (ii)
- the Freiburg monosyllabic test under air conduction without a hearing aid at speech levels 65, 80, 95, 110, and 120 dBSPL,
- (iii)
- the Freiburg monosyllabic test in free field with a hearing aid at 65 and 80 dBSPL. For the Freiburg two-digit numbers, the sound levels were adjusted individually in the range 30–120 dBSPL in 5 dBSPL steps.
2.3. Statistical Methods and Data Analysis
Univariable Analyses
2.4. Multiple Regression Models
3. Results
3.1. Aetiology
3.2. Preoperative Speech Comprehension
3.3. Merging the Predictors—Prediction via Multiple-Regression Models
4. Discussion
4.1. Speech Comprehension
4.2. Patient-Related Factors
4.3. Prediction and Risk Factors
4.4. Limitations of the Study
5. Conclusions
- -
- Good postoperative comprehension was usually associated with good preoperative comprehension.
- -
- Preoperative WRSmax and WRS80(HA) were better predictors of CI-aided comprehension than was preoperative speech comprehension at 65 dB with HA.
- -
- WRS80(HA) can serve as a useful extension to the usual test level of 65 dBSPL in future preoperative diagnostics.
- -
- A search for aetiological predictors apart from audiological measurement procedures is recommended.
- -
- Our model explained 40% of the postoperative variability under the newly introduced categorised target variable (WRS70(CI) (below the 1st quartile vs. above the 3rd quartile) in the regression model.
- -
- Preoperatively, standardised medical history forms should be used to remedy the lack of data and to reduce the number of unknown aetiologies.
- -
- Future validation of the above models, using independent cohorts, is to be recommended.
Author Contributions
Funding
Institutional Review Board Statement
Informed Consent Statement
Data Availability Statement
Conflicts of Interest
References
- Lenarz, T. Cochlear Implant—State of the art. Laryngo-Rhino-Otologie 2017, 96, S123–S151. [Google Scholar] [CrossRef] [PubMed]
- Pisoni, D.B.; Kronenberger, W.G.; Harris, M.S.; Moberly, A.C. Three challenges for future research on cochlear implants. World J. Otorhinolaryngol. - Head Neck Surg. 2017, 3, 240–254. [Google Scholar] [CrossRef] [PubMed]
- Laszig, R.; Lehnhardt, E. Eine elektronische Hörprothese. Dtsch. Arztebl. 1987, 84, 3033–3038. [Google Scholar]
- Hoppe, U.; Hocke, T.; Hast, A.; Iro, H. Maximum preimplantation monosyllabic score as predictor of cochlear implant outcome. HNO 2019, 67, 62–68. [Google Scholar] [CrossRef]
- Dalbert, A.; Huber, A.; Baumann, N.; Veraguth, D.; Roosli, C.; Pfiffner, F. Hearing preservation after cochlear implantation may improve long-term word perception in the electric-only condition. Otol. Neurotol. 2016, 37, 1314–1319. [Google Scholar] [CrossRef]
- Arndt, S.; Laszig, R.; Aschendorff, A.; Hassepass, F.; Beck, R.; Wesarg, T. Cochlear implant treatment of patients with single-sided deafness or asymmetric hearing loss. HNO 2017, 65, 98–108. [Google Scholar] [CrossRef]
- Arndt, S.; Laszig, R.; Aschendorff, A.; Beck, R.; Schild, C.; Hassepaß, F.; Ihorst, G.; Kroeger, S.; Kirchem, P.; Wesarg, T. Einseitige Taubheit und Cochlear-implantat-Versorgung. Audiologische Diagnostik und Ergebnisse. HNO 2011, 59, 437–446. [Google Scholar] [CrossRef]
- Klenzner, T.; Stecker, M.; Marangos, N.; Laszig, R. Zur Indikationserweiterung des “cochlear-implant”. HNO 1999, 47, 95–100. [Google Scholar] [CrossRef]
- Gifford, R.H.; Dorman, M.F.; Shallop, J.K.; Sydlowski, S.A. Evidence for the expansion of adult cochlear implant candidacy. Ear Hear. 2010, 31, 186–194. [Google Scholar] [CrossRef]
- Deutsche Geselschaft für Hals-Nasen-Ohren-Heilkunde, Kopf- und Hals-Chirurgie e.V. (DGHNO-KHC) (2020) S2k-Leitlinie: Cochlea-Implantat Versorgung. Available online: https://www.awmf.org/uploads/tx_szleitlinien/017-071l_S2k_Cochlea-Implantat-Versorgung-zentral-auditorische-Implantate_2020-12.pdf (accessed on 20 December 2022).
- Aschendorff, A.; Briggs, R.; Brademann, G.; Helbig, S.; Hornung, J.; Lenarz, T.; Marx, M.; Ramos, A.; Stöver, T.; Escudé, B.; et al. Clinical investigation of the nucleus slim modiolar electrode. Audiol. Neurotol. 2017, 22, 169–179. [Google Scholar] [CrossRef]
- Ernst, A.; Battmer, R.-D.; Todt, I. Cochlear Implant Heute; Springer: Berlin/Heidelberg, Germany, 2009. [Google Scholar]
- Brademann, G.; Müller-Deile, J. Technischer und operativer Fortschritt eröffnet neue Optionen. HNO Nachrichten 2010, 40, 39–43. [Google Scholar] [CrossRef]
- Venail, F.; Sicard, M.; Piron, J.P.; Levi, A.; Artieres, F.; Uziel, A.; Mondain, M. Reliability and complications of 500 consecutive cochlear implantations. Arch. Otolaryngol. Neck Surg. 2008, 134, 1276–1281. [Google Scholar] [CrossRef]
- Terry, B.; Kelt, R.E.; Jeyakumar, A. Delayed complications after cochlear implantation. JAMA Otolaryngol. Neck Surg. 2015, 141, 1012–1017. [Google Scholar] [CrossRef]
- Farinetti, A.; Ben Gharbia, D.; Mancini, J.; Roman, S.; Nicollas, R.; Triglia, J.-M. Cochlear implant complications in 403 patients: Comparative study of adults and children and review of the literature. Eur. Ann. Otorhinolaryngol. Head Neck Dis. 2014, 131, 177–182. [Google Scholar] [CrossRef]
- Hoppe, U.; Hocke, T.; Hast, A.; Iro, H. Cochlear implantation in candidates with moderate-to-severe hearing loss and poor speech perception. Laryngoscope 2020, 131, E940–E945. [Google Scholar] [CrossRef]
- Hoth, R.N.S. Der Freiburger Sprachtest: Eine Säule der Sprachaudiometrie im deutschsprachigen Raum. HNO 2016, 64, 540–548. [Google Scholar] [CrossRef]
- Hahlbrock, K.-H. Über Sprachaudiometrie und neue Wörterteste. Archiv Ohren Nasen Kehlkopfheilkunde 1953, 162, 394–431. [Google Scholar] [CrossRef]
- Baljić, I.; Hoppe, U. Der Freiburger Einsilbertest auf dem Prüfstand. HNO 2016, 64, 538–539. [Google Scholar] [CrossRef]
- Exter, M.; Winkler, A.; Holube, I. Phonemische Ausgewogenheit des Freiburger Einsilbertests. HNO 2016, 64, 557–563. [Google Scholar] [CrossRef]
- Hey, M.; Brademann, G.; Ambrosch, P. Der Freiburger Einsilbertest in der postoperativen CI-Diagnostik. HNO 2016, 64, 601–607. [Google Scholar] [CrossRef]
- Blamey, P.; Artieres, F.; Başkent, D.; Bergeron, F.; Beynon, A.; Burke, E.; Dillier, N.; Dowell, R.; Fraysse, B.; Gallégo, S.; et al. Factors affecting auditory performance of postlinguistically deaf adults using cochlear implants: An update with 2251 patients. Audiol. Neurotol. 2012, 18, 36–47. [Google Scholar] [CrossRef] [PubMed]
- Lazard, D.S.; Vincent, C.; Venail, F.; Van de Heyning, P.; Truy, E.; Sterkers, O.; Skarzynski, P.H.; Skarzynski, H.; Schauwers, K.; O'Leary, S.; et al. Pre-, per- and postoperative factors affecting performance of postlinguistically deaf adults using cochlear implants: A new conceptual model over time. PLoS ONE 2012, 7, e48739. [Google Scholar] [CrossRef] [PubMed]
- Goudey, B.; Plant, K.; Kiral, I.; Jimeno-Yepes, A.; Swan, A.; Gambhir, M.; Büchner, A.; Kludt, E.; Eikelboom, R.H.; Sucher, C.; et al. A multicenter analysis of factors associated with hearing outcome for 2,735 adults with cochlear implants. Trends Hear. 2021, 25, 23312165211037525. [Google Scholar] [CrossRef] [PubMed]
- Kraaijenga, V.; Smit, A.; Stegeman, I.; Smilde, J.; van Zanten, G.; Grolman, W. Factors that influence outcomes in cochlear implantation in adults, based on patient-related characteristics—A retrospective study. Clin. Otolaryngol. 2016, 41, 585–592. [Google Scholar] [CrossRef]
- Green, K.M.J.; Bhatt, Y.M.; Mawman, D.J.; O'Driscoll, M.P.; Saeed, S.; Ramsden, R.T.; Green, M.W. Predictors of audiological outcome following cochlear implantation in adults. Cochlear Implant. Int. 2007, 8, 1–11. [Google Scholar] [CrossRef]
- Winkler, A.; Holube, I. Was wissen wir über den Freiburger Sprachtest? Zeitschrift Audiol. 2014, 53, 146–154. [Google Scholar]
- R Core Team. R Foundation for Statistical Computing: Vienna. 2020. Available online: https://www.r-project.org/ (accessed on 31 July 2022).
- Zhang, D. rsq: R-Squared and Related Measures. 2022. Available online: https://cran.r-project.org/web/packages/rsq/index.html (accessed on 31 July 2022).
- Cameron, A.C.; Windmeijer, F.A.G. An R-squared measure of goodness of fit for some common nonlinear regression models. J. Econ. 1997, 77, 329–342. [Google Scholar] [CrossRef]
- McCullagh, P. Quasi-likelihood Functions. Ann. Stat. 1983, 11, 59–67. [Google Scholar] [CrossRef]
- Hoth, S.; Müller-Deile, J. Audiologic rehabilitation of patients with cochlear implants. HNO 2009, 57, 635–648. [Google Scholar] [CrossRef]
- Hey, M.; Neben, N.; Stöver, T.; Baumann, U.; Mewes, A.; Liebscher, T.; Schüssler, M.; Aschendorff, A.; Wesarg, T.; Büchner, A.; et al. Outcomes for a clinically representative cohort of hearing-impaired adults using the Nucleus® CI532 cochlear implant. Eur. Arch. Oto-Rhino-Laryngol. 2020, 277, 1625–1635. [Google Scholar] [CrossRef]
- Mosnier, I.; Bebear, J.-P.; Marx, M.; Fraysse, B.; Truy, E.; Lina-Granade, G.; Mondain, M.; Sterkers-Artières, F.; Bordure, P.; Robier, A.; et al. Predictive factors of cochlear implant outcomes in the elderly. Audiol. Neurotol. 2014, 19, 15–20. [Google Scholar] [CrossRef]
- Winkler, A.; Holube, I. Test-Retest-Reliabilität des Freiburger Einsilbertests. HNO 2016, 64, 564–571. [Google Scholar] [CrossRef]
- Holden, L.K.; Firszt, J.B.; Reeder, R.M.; Uchanski, R.M.; Dwyer, N.Y.; Holden, T.A. Factors affecting outcomes in cochlear implant recipients implanted with a perimodiolar electrode array located in scala tympani. Otol. Neurotol. 2016, 37, 1662–1668. [Google Scholar] [CrossRef]
- Halpin, C.; Rauch, S.D. Clinical implications of a damaged cochlea: Pure tone thresholds vs information-carrying capacity. Otolaryngol.–Head Neck Surg. 2009, 140, 473–476. [Google Scholar] [CrossRef]
- Hoppe, U.; Hesse, G. Hörgeräte: Indikationen, Technologie, Anpassung und Qualitätskontrolle. Laryngorhinootologie 2017, 96, S43–S65. [Google Scholar] [CrossRef]
- Meister, H. Sprachverstehen und kognitive Leistungen in akustisch schwierigen Situationen. HNO 2019, 68, 171–176. [Google Scholar] [CrossRef]
- Dörfler, C.; Hocke, T.; Hast, A.; Hoppe, U. Speech recognition with hearing aids for 10 standard audiograms. HNO 2020, 68, 40–47. [Google Scholar] [CrossRef]
- Hesse, G. Hörgeräte im Alter. HNO 2004, 52, 321–328. [Google Scholar] [CrossRef]
- Müller-Deile, J. Versorgung mit Cochlear Implantaten. Sprache Stimme Gehör 2004, 28, 157–170. [Google Scholar] [CrossRef]
- Holden, L.K.; Finley, C.C.; Firszt, J.B.; Holden, T.A.; Brenner, C.; Potts, L.; Gotter, B.D.; Vanderhoof, S.S.; Mispagel, K.; Heydebrand, G.; et al. Factors affecting open-set word recognition in adults with cochlear implants. Ear Hear. 2013, 34, 342–360. [Google Scholar] [CrossRef]
- Hoppe, U.; Hocke, T.; Hast, A.; Hornung, J. Langzeitergebnisse eines Screeningverfahrens für erwachsene Cohlea-Implantat-Kandidaten. Laryngo-Rhino-Otologie 2017, 96, 234–238. [Google Scholar] [CrossRef] [PubMed]
- Lehnhardt, E. Hörschwellenmessung und-wertung. In Praxis der Audiometrie; Georg Thieme Verlag KG: Stuttgart, Germany, 2009; pp. 9–11. [Google Scholar]
- von Gablenz, P.; Holube, I. Prevalence of hearing impairment in northwestern Germany: Results of an epidemiological study on hearing status (HÖRSTAT). HNO 2015, 63, 195–214. [Google Scholar] [CrossRef] [PubMed]
- Kutschmann, M.; Bender, R.; Grouven, U.; Berg, G. Aspects of sample size determination and power calculation illustrated on examples from rehabilitation research. Rehabilitation 2006, 45, 377–384. [Google Scholar] [CrossRef] [PubMed]
- Röhrig, B.; du Prel, J.-B.; Blettner, M. Studiendesign in der medizinischen forschung: Teil 2 der serie zur bewertung wisserschaftlicher publikationen. Dtsch. Arztebl. Int. 2009, 106, 184–189. [Google Scholar] [CrossRef] [PubMed]
- Röhrig, B.; du Prel, J.-B.; Wachtlin, D.; Blettner, M. Studientypen in der medizinischen Forschung—Teil 3 der Serie zur Bewertung wissenschaftlicher Publikationen. Dtsch. Arztebl. Int. 2009, 106, 262–268. [Google Scholar] [CrossRef] [PubMed]
- Zahnert, T. The differential diagnosis of hearing loss. Dtsch. Arztebl. Int. 2011, 108, 433–444. [Google Scholar] [CrossRef]
- Hoppe, U.; Hocke, T.; Hast, A.; Iro, H. Das maximale Einsilberverstehen als Prädiktor für das Sprachver-stehen mit Cochleaimplantat. HNO 2019, 67, 199–206. [Google Scholar] [CrossRef]
- Chatelin, V.; Kim, E.J.; Driscoll, C.; Larky, J.; Polite, C.; Price, L.; Lalwani, A.K. Cochlear implant outcomes in the elderly. Otol. Neurotol. 2004, 25, 298–301. [Google Scholar] [CrossRef] [PubMed]
- Deutsche Geselschaft für Hals-Nasen-Ohren-Heilkunde, Kopf- und Hals-Chirurgie e.V. (DGHNO-KHC) (2014) S2k-Leitlinie: Hörsturz. Available online: https://register.awmf.org/assets/guidelines/017-010l_S1_Hoersturz_2014-02-verlaengert.pdf (accessed on 20 December 2022).
- Deutsche Geselschaft für Hals-Nasen-Ohren-Heilkunde, Kopf- und Hals-Chirurgie e.V. (DGHNO-KHC) (2017) S2k-Leitlinie: Implantierbare Hörgeräte. Available online: https://register.awmf.org/assets/guidelines/017-073l_Implantierbare-Hoergeraete_2018-06.pdf (accessed on 20 December 2022).
- Deutsche Gesellschaft für Neurologie, e.V. (DGN) (2015), S2k-Leitlinie: Ambulant erworbene bakterielle (eitrige) Meningoenzephalitis im Erwachsenenalter. Available online: https://register.awmf.org/de/leitlinien/detail/030-089 (accessed on 20 December 2022).
- Kunstmann, E.; Hildmann, A.; Lautermann, J.; Aletsee, C.; Epplen, J.T.; Sudhoff, H. Kongenitale Schwerhörigkeit. Molekulargenetische diagnostik der connexin-gene und genetische beratung. HNO 2005, 53, 773–778. [Google Scholar] [CrossRef]
- Gesellschaft für Neonatologie und pädiatrische Intensivmedizin e.V. (GNPI) (2013) S2k-Leitlinie: Behandlung der neonatalen Asphyxie unter besonderer Berücksichtigung der therapeutischen Hypothermie. Available online: https://www.awmf.org/uploads/tx_szleitlinien/024-023l_S2k_Behandlung_der_neonatalen_Aphyxie_unter_besonderer_Berücksichtigung_der_therapeutischen_Hypothermie_2013-06-abgelaufen.pdf (accessed on 20 December 2022).
- Kim, H.; Kang, W.S.; Park, H.J.; Lee, J.Y.; Park, J.W.; Kim, Y.; Seo, J.W.; Kwak, M.Y.; Kang, B.C.; Yang, C.J.; et al. Cochlear implantation in postlingually deaf adults is time-sensitive towards positive outcome: Prediction using advanced machine learning techniques. Sci. Rep. 2018, 8, 18004. [Google Scholar] [CrossRef]
- Leung, J.; Wang, N.-Y.; Yeagle, J.D.; Chinnici, J.; Bowditch, S.; Francis, H.W.; Niparko, J.K. Predictive models for cochlear implantation in elderly candidates. Arch. Otolaryngol. Head Neck Surg. 2005, 131, 1049–1054. [Google Scholar] [CrossRef]
- Wagener, K.; Brand, T.; Kühnel, V.; Kollmeier, B. Entwicklung und Evaluation eines Satztests in deutscher Sprache I–III: Design, Optimierung und Evaluation des Oldenburger Satztests. Z. Für Audiol. 1999, 38, 86–95. [Google Scholar]
- Brand, T.; Kollmeier, B. Eignung des Göttinger und des Oldenburger Satztests für die Bestimmung von Verständlichkeitsfunktionen. Z. Audiol. 2000, 39, 40–52. [Google Scholar]
- Genther, D.J.; Betz, J.; Pratt, S.; Kritchevsky, S.B.; Martin, K.R.; Harris, T.B.; Helzner, E.; Satterfield, S.; Xue, Q.-L.; Yaffe, K.; et al. Association of hearing impairment and mortality in older adults dane. J. Gerontol. Ser. A 2014, 70, 85–90. [Google Scholar] [CrossRef]
- Lin, F.R.; Metter, E.J.; O’Brien, R.J.; Resnick, S.M.; Zonderman, A.B.; Ferrucci, L. Hearing loss and incident dementia. Arch Neurol. 2012, 68, 214–220. [Google Scholar] [CrossRef]
- Jayakody, D.M.P.; Friedland, P.L.; Eikelboom, R.H.; Martins, R.N.; Sohrabi, H.R. A novel study on association between untreated hearing loss and cognitive functions of older adults: Baseline non-verbal cognitive assessment results. Clin. Otolaryngol. 2018, 43, 182–191. [Google Scholar] [CrossRef]


| n | Median (IQR) | Mean Value | n with WRS = 0% | |
|---|---|---|---|---|
| Age at surgery [years] | 664 | 58 (42–71) | 56 | - |
| Preop. 4FPTA [dBHL] | 654 | 107.0 (93–118) | 105.1 | - |
| Preop. WRS65(HA) [%] | 635 | 0 (0–0) | 4.2 | 483 |
| Preop. WRS80(HA) [%] | 630 | 0 (0–20) | 12.0 | 335 |
| Preop. WRSmax [%] | 594 | 0 (0–20) | 11.8 | 334 |
| Preop. NRSmax [%] | 605 | 50.0 (0–70) | 42.2 | 175 |
| Preop. SRT of two-digit numbers [dBSPL] | 604 | 115.0 (97.8–130) | 111.4 | 0 |
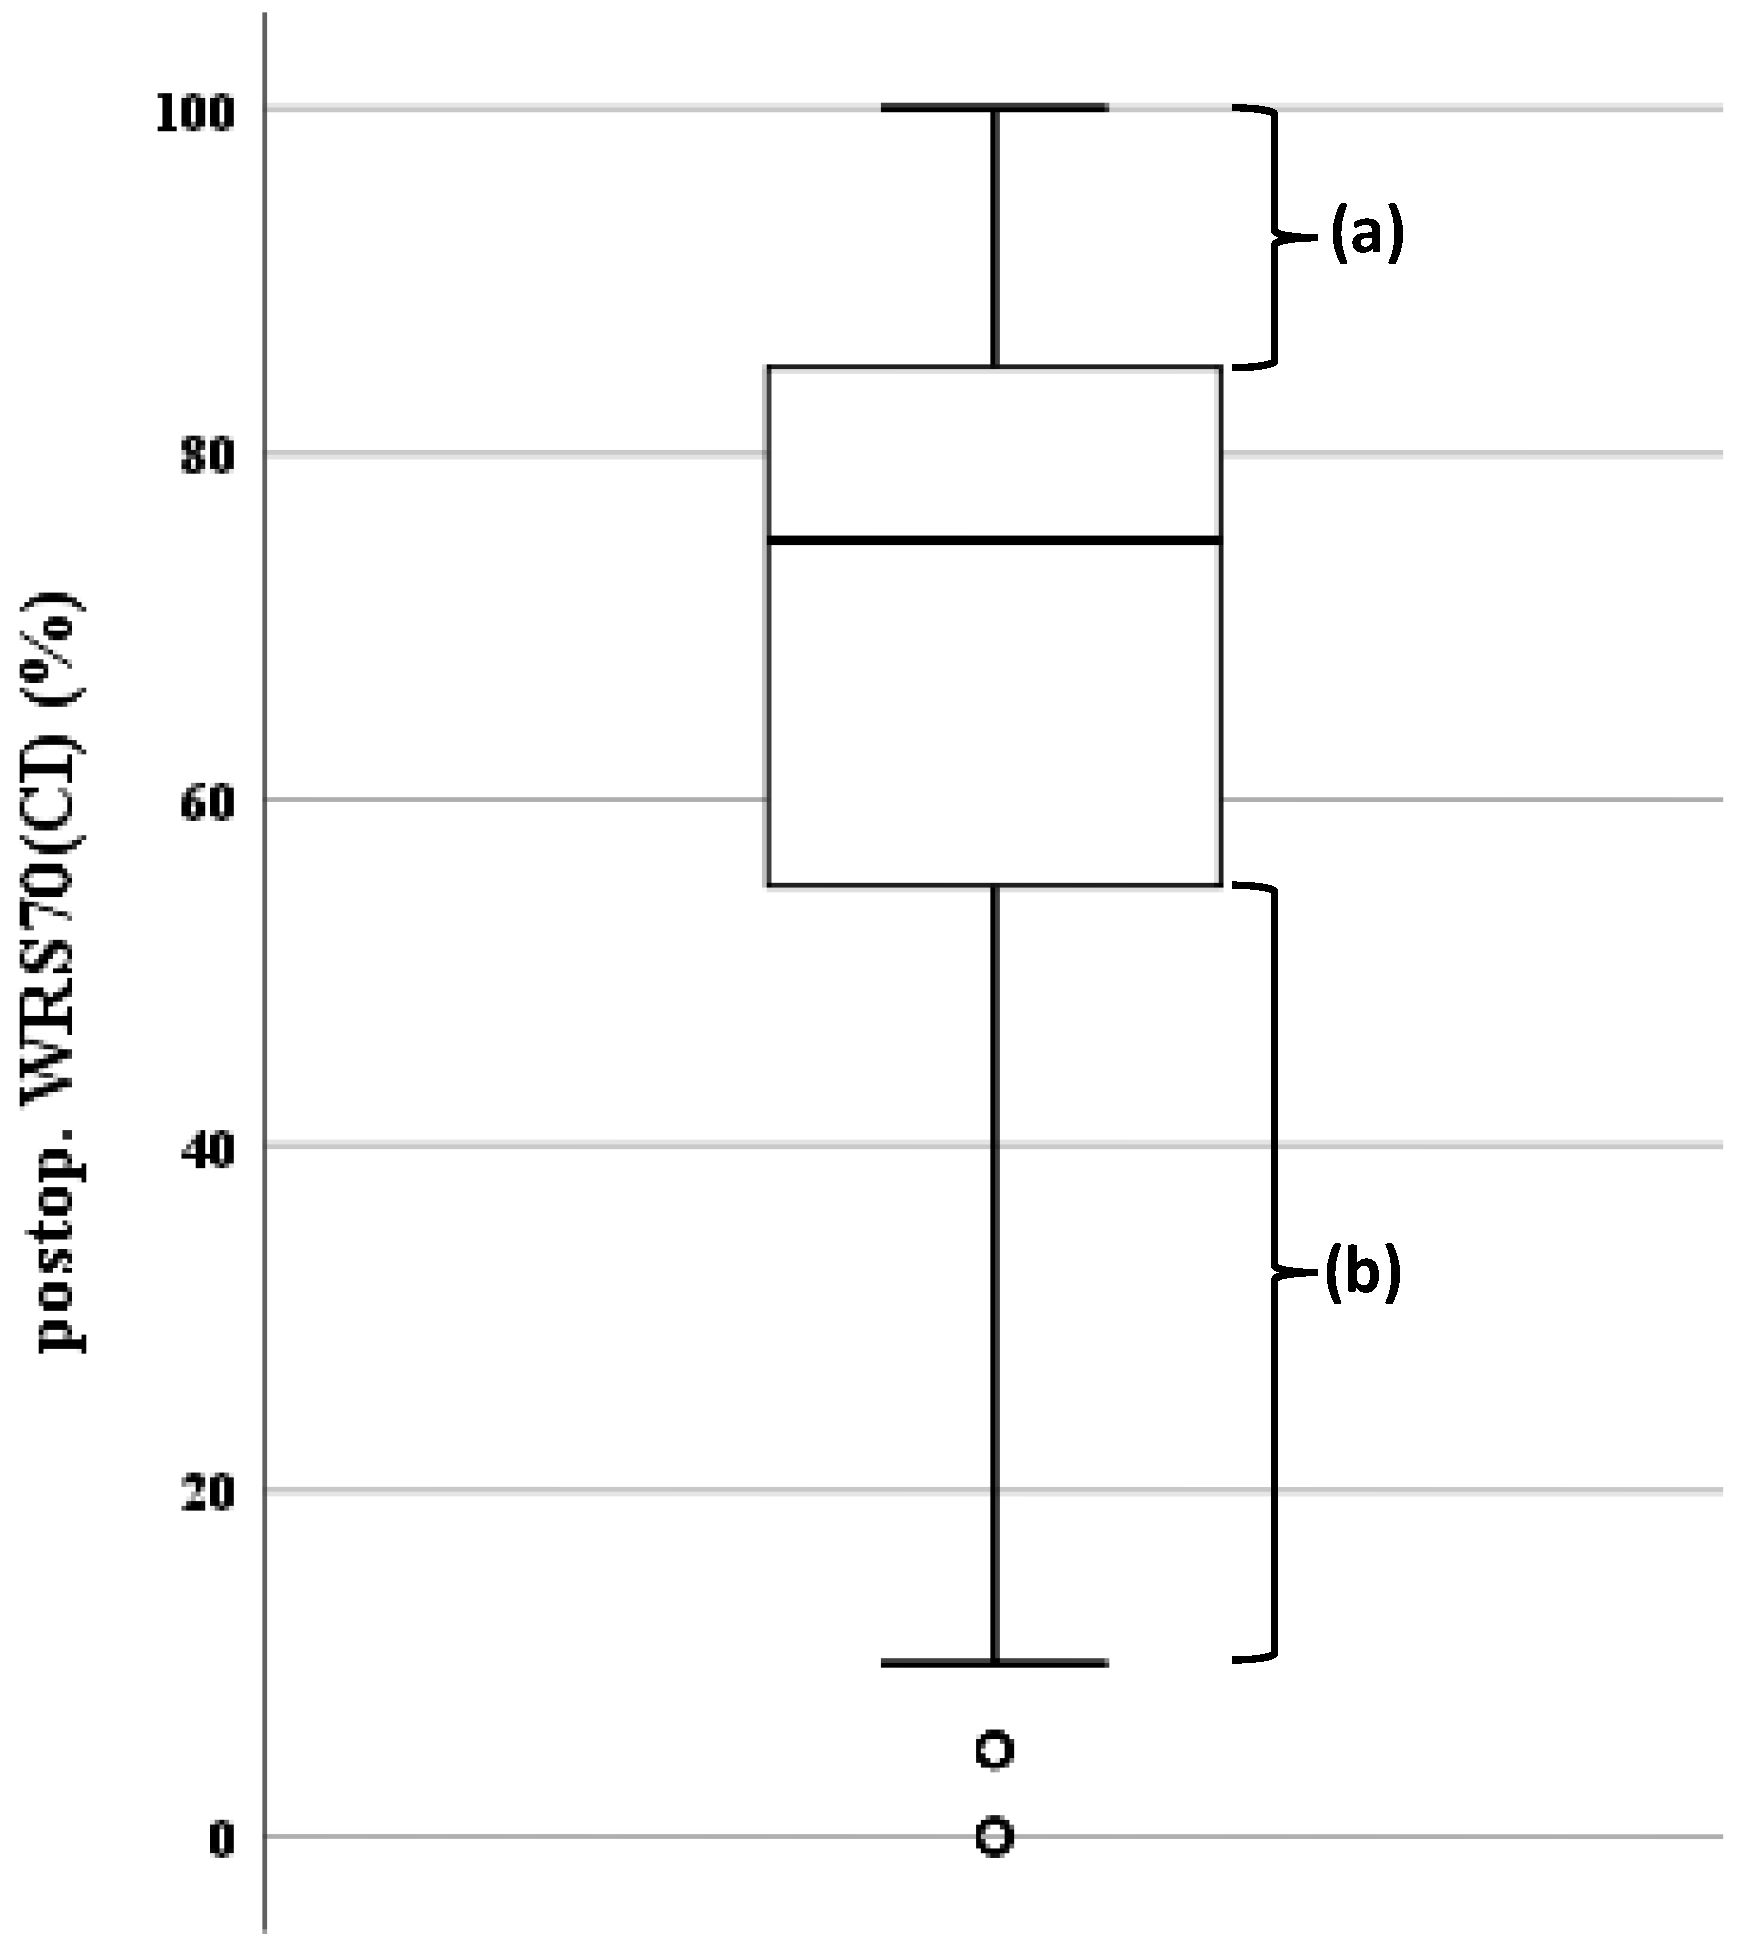
| Postop. WRS70(CI) [%] | 538 | 75.0 (55–85) | 68.0 | 7 |
| Etiology Categories | Categorical WRS70(CI) | ||
|---|---|---|---|
| Chi Square Test | |||
| X² | p Value | Cramer-V | |
| Unknown | 2.32 | 0.13 | 0.08 |
| Ménière's disease | 0.78 | 0.38 | 0.05 |
| Genetics | 4.06 | 0.04 | 0.11 |
| General infection | 0.35 | 0.55 | 0.03 |
| Syndrome complexes | 0.22 | 0.64 | 0.03 |
| ISSNHL | 8.89 | 0.003 | 0.17 |
| Meningitis | 25.33 | <0.0001 | 0.28 |
| Miscellaneous | 0.16 | 0.69 | 0.02 |
| Toxicity | 0.11 | 0.74 | 0.02 |
| Middle ear | 5.45 | 0.02 | 0.13 |
| Congenital | 23.75 | <0.0001 | 0.27 |
| MMR | 1.37 | 0.24 | 0.07 |
| Trauma | 0.11 | 0.75 | 0.02 |
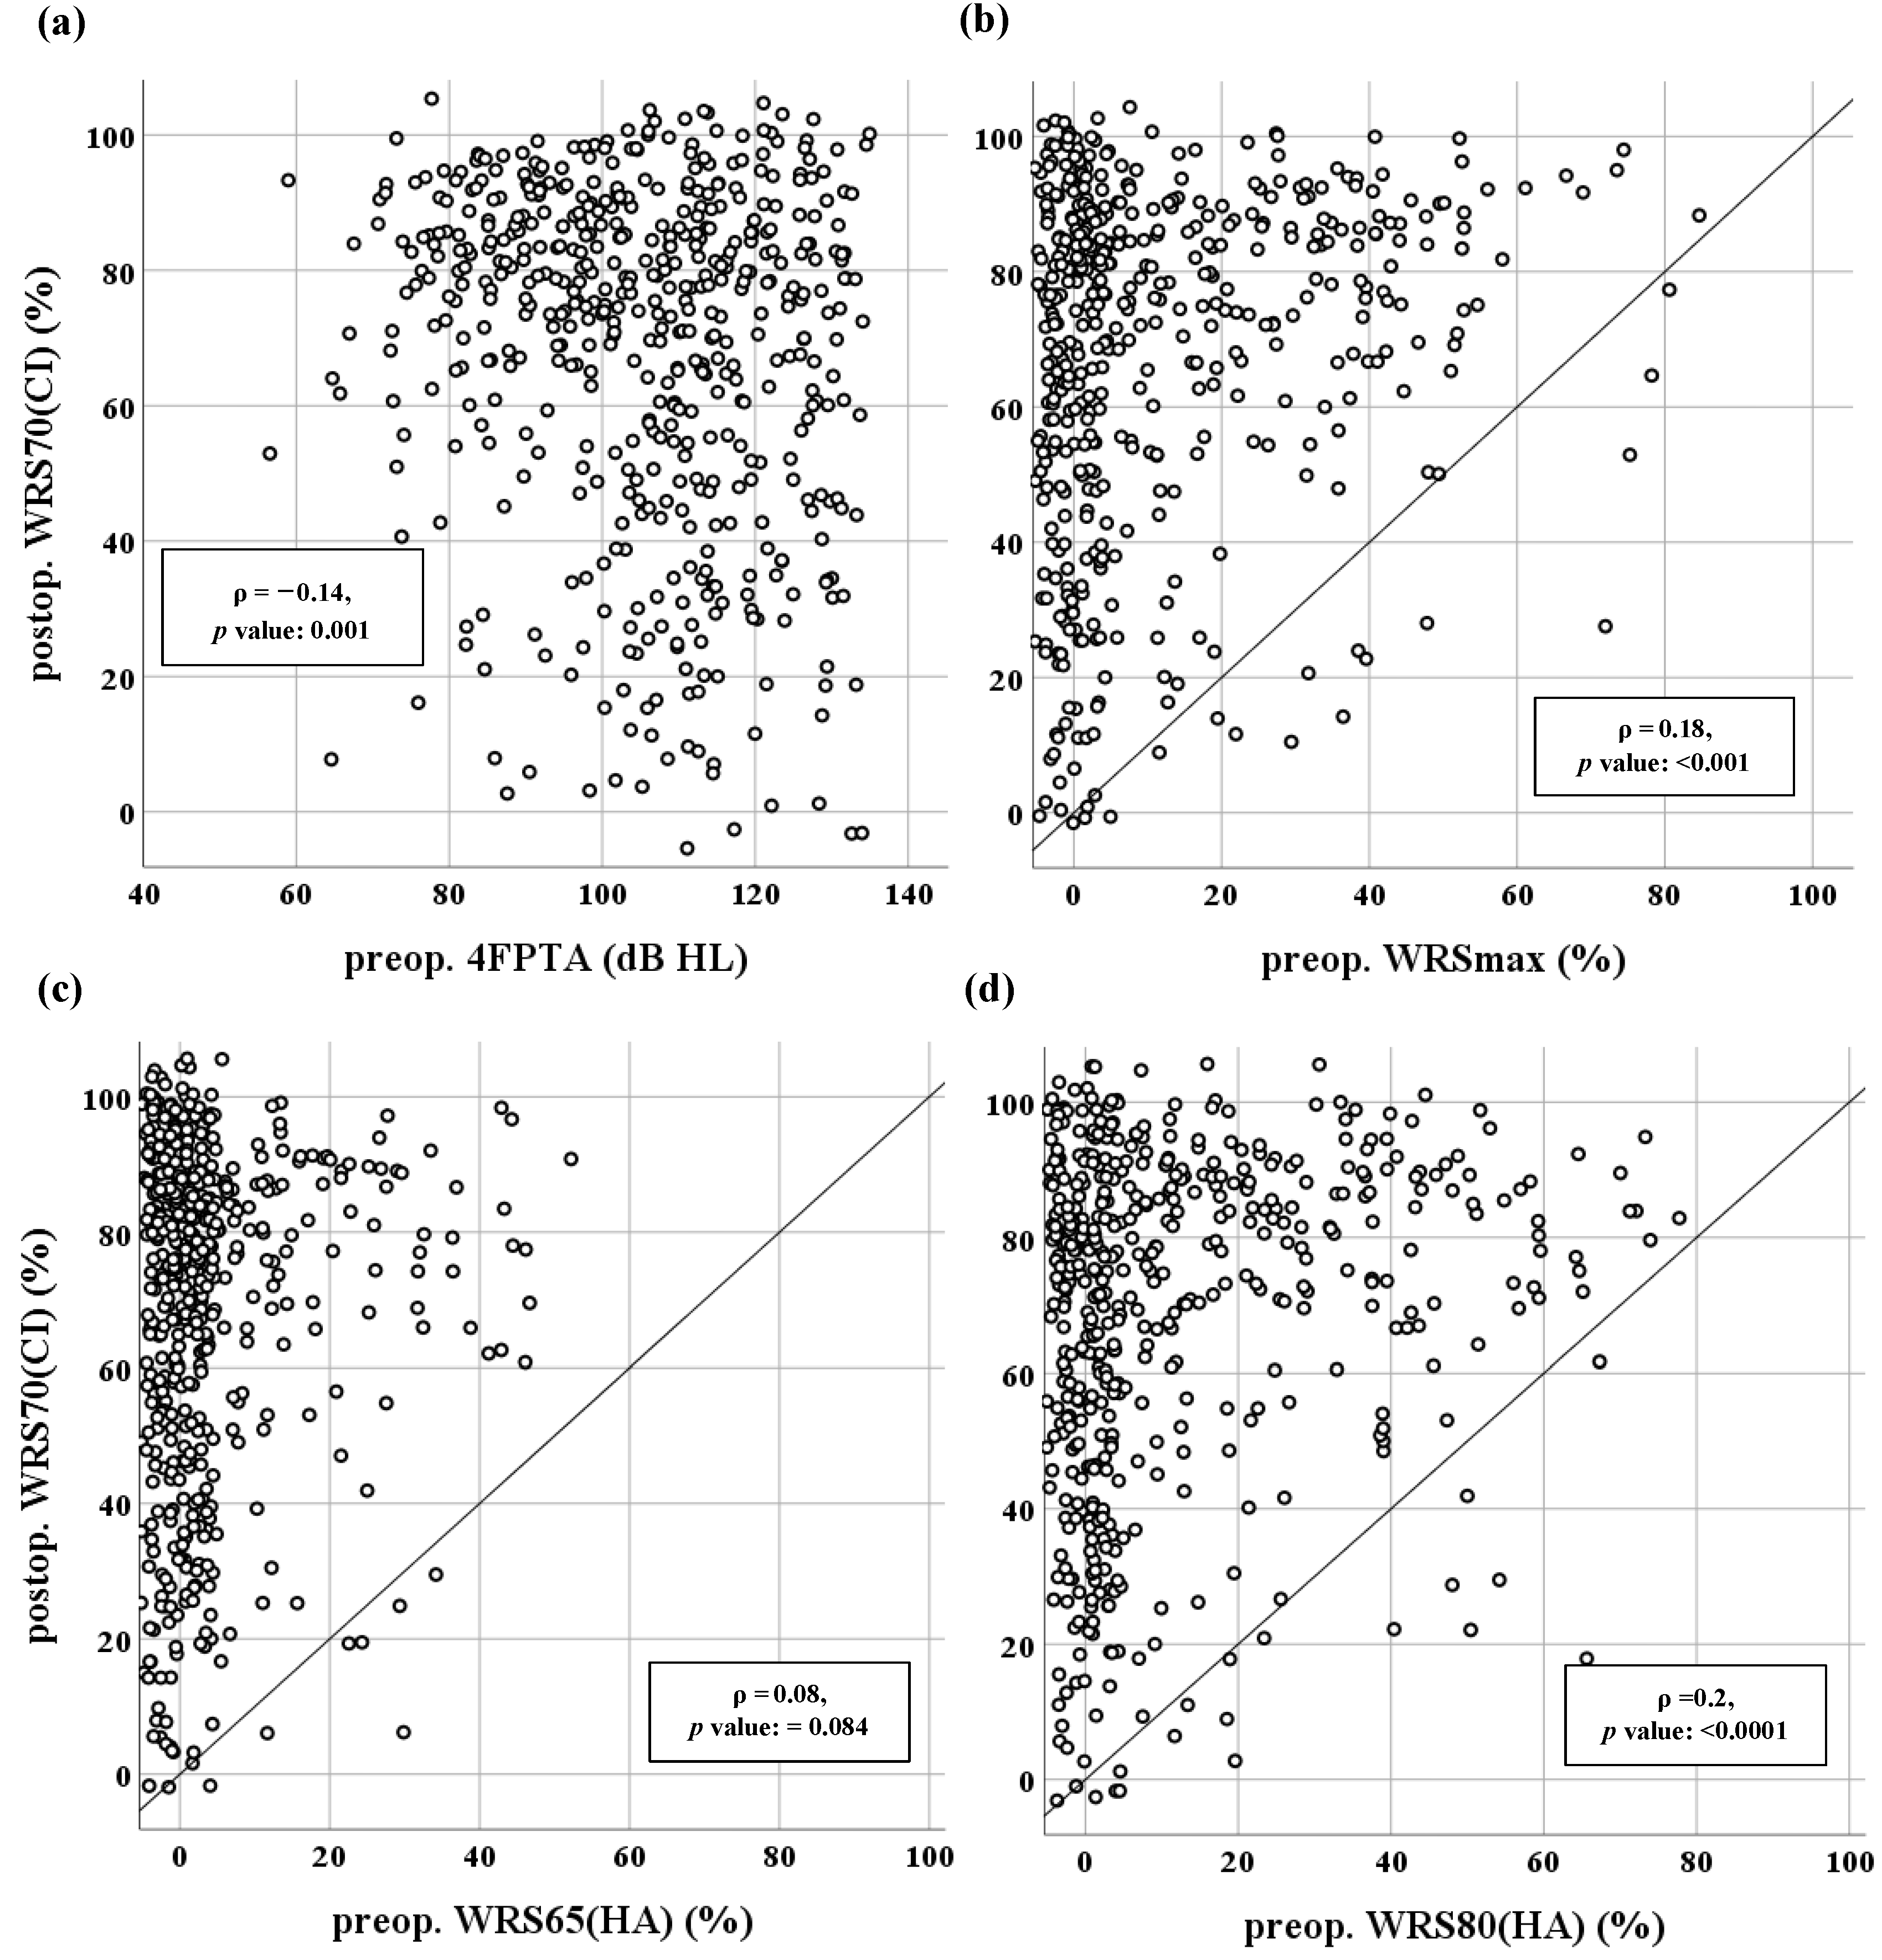
| Comparison between WRS70(CI) and: | WRS70(CI) was Equal or Higher | WRS70(CI) was Lower | WRS70(CI) was Lower after Data Review |
|---|---|---|---|
| WRSmax (Figure 4b) | 97.3% (471/484) | 2.7% (13/484) | 0.6% (3/484) |
| WRS65(HA) (Figure 4c) | 99.2% (512/516) | 0.8% (4/516) | 0.0% (0/516) |
| WRS80(HA) (Figure 4d) | 97.7% (500/512) | 2.3% (12/512) | 0.2% (1/512) |
| Influence Variable | OR (95% Confidence Interval) | p |
|---|---|---|
| (Intercept) | – | <0.001 |
| WRS80(HA) | 0.97 (0.94–0.99) | 0.005 |
| NRSmax | 0.99 (0.98–0.99) | 0.038 |
| Meningitis | 50.28 (4.71–536.29) | 0.001 |
| Congenital & hypoxia | 4.68 (1.51–14.51) | 0.007 |
| ISSNHL | 0.34 (0.11–1.02) | 0.041 |
| Age at HA provision | ||
| Below 1st quartile | 1 (reference) | |
| 1st–2nd quartile | 0.30 (0.13–0.68) | 0.004 |
| 2nd–3rd quartile | 0.24 (0.10–0.57) | 0.001 |
| Above 3rd quartile | 0.32 (0.13–0.78) | 0.012 |
| Influence Variable | Regression Coefficient | Standard Error | p |
|---|---|---|---|
| (Intercept) | –2.07 | 0.30 | <0.001 |
| WRS65(HA) | –0.02 | 0.008 | 0.014 |
| WRS80(HA) | 0.02 | 0.004 | <0.001 |
| Meningitis | –1.30 | 0.23 | <0.001 |
| Congenital & hypoxia | –0.90 | 0.18 | <0.001 |
| Age at HA provision | |||
| Below 1st quartile | Reference | ||
| 1st–2nd quartile | 0.35 | 0.14 | 0.012 |
| 2nd–3rd quartile | 0.60 | 0.16 | <0.001 |
| Above 3rd quartile | 0.69 | 0.19 | <0.001 |
| Duration of HA use | |||
| Below 1st quartile | 0.14 | 0.19 | 0.45 |
| 1st–2nd quartile | 0.19 | 0.16 | 0.23 |
| 2nd–3rd quartile | 0.54 | 0.14 | <0.001 |
| Above 3rd quartile | Reference |
Disclaimer/Publisher’s Note: The statements, opinions and data contained in all publications are solely those of the individual author(s) and contributor(s) and not of MDPI and/or the editor(s). MDPI and/or the editor(s) disclaim responsibility for any injury to people or property resulting from any ideas, methods, instructions or products referred to in the content. |
© 2023 by the authors. Licensee MDPI, Basel, Switzerland. This article is an open access article distributed under the terms and conditions of the Creative Commons Attribution (CC BY) license (https://creativecommons.org/licenses/by/4.0/).
Share and Cite
Rieck, J.-H.; Beyer, A.; Mewes, A.; Caliebe, A.; Hey, M. Extended Preoperative Audiometry for Outcome Prediction and Risk Analysis in Patients Receiving Cochlear Implants. J. Clin. Med. 2023, 12, 3262. https://doi.org/10.3390/jcm12093262
Rieck J-H, Beyer A, Mewes A, Caliebe A, Hey M. Extended Preoperative Audiometry for Outcome Prediction and Risk Analysis in Patients Receiving Cochlear Implants. Journal of Clinical Medicine. 2023; 12(9):3262. https://doi.org/10.3390/jcm12093262
Chicago/Turabian StyleRieck, Jan-Henrik, Annika Beyer, Alexander Mewes, Amke Caliebe, and Matthias Hey. 2023. "Extended Preoperative Audiometry for Outcome Prediction and Risk Analysis in Patients Receiving Cochlear Implants" Journal of Clinical Medicine 12, no. 9: 3262. https://doi.org/10.3390/jcm12093262