Article

Association between Surrogate Markers of Insulin Resistance and the Incidence of Colorectal Cancer in Korea: A Nationwide Population-Based Study

1
Department of Physiology, Dong-A University College of Medicine, Busan 49201, Republic of Korea
2
Department of Data Sciences Convergence, Dong-A University Interdisciplinary Program, Busan 49201, Republic of Korea
3
Division of Gastroenterology, Department of Internal Medicine, Dong-A University College of Medicine, Busan 49201, Republic of Korea
*
Author to whom correspondence should be addressed.
J. Clin. Med. 2024, 13(6), 1628; https://doi.org/10.3390/jcm13061628
Submission received: 19 February 2024 / Revised: 8 March 2024 / Accepted: 11 March 2024 / Published: 12 March 2024
(This article belongs to the Section Gastroenterology & Hepatopancreatobiliary Medicine)

Abstract

:
Background: Insulin resistance (IR) is assessed using surrogate markers such as the triglyceride–glucose (TyG) index, the triglyceride-to-high-density lipoprotein cholesterol (TG/HDL-C) ratio, and the metabolic score for IR (METS-IR). Limited studies investigated their association with colorectal cancer (CRC) incidence, and no research has been conducted on their association with the METS-IR. Method: This study used claims data from the Korean National Health Insurance Service, analyzing a cohort of 314,141 Koreans aged over 40 who participated in the National Health Screening Program from 2009 to 2010. The follow-up period was extended until 31 December 2019. Participants were divided into four groups based on quartiles (Q1–Q4) of the markers. Results: All surrogate markers of IR had sequentially statistically lower disease-free probabilities from Q1 to Q4. The Cox proportional hazard model demonstrated statistically significant positive associations between CRC incidence and Q3 and Q4 of the TyG index, as well as Q3 and Q4 of the TG/HDL-C ratio and Q4 of the METS-IR. The constrained cubic spline method revealed a nonlinear, positive dose–response relationship between the TyG index and the METS-IR in relation to CRC incidence. Conclusions: In conclusion, the TyG index, TG/HDL-C ratio, and METS-IR were positively correlated with CRC incidence in Koreans.

1. Introduction

Colorectal cancer (CRC) is the third most common cancer and the third leading cause of cancer-related death worldwide, affecting both men and women [1]. Approximately 60–65% of incidences of CRC occur sporadically, independent of genetic factors, and can be attributed to modifiable environmental risk factors such as obesity, physical inactivity, an unhealthy diet, alcohol consumption, and smoking [2]. Metabolic syndrome, a condition strongly associated with these environmental factors, has been identified as a cluster of metabolic abnormalities linked to various types of malignancies, including CRC [3,4].
Insulin resistance (IR) is acknowledged as a crucial mechanism in the progression of metabolic syndrome and is closely associated with obesity, malignancy, non-alcoholic fatty liver disease, cardiovascular disease, polycystic ovary syndrome, and other abnormalities [5,6,7,8]. Recent findings suggest that IR is a contributing factor to the rise in obesity-related cancers, as reported by the International Agency for Research on Cancer and the Centers for Disease Control and Prevention, which have linked being overweight and obese to heightened risks of 13 different cancers [9,10]. IR is deemed significant in the pathogenesis of 13 cancer types, with a notable emphasis on CRC [11,12,13].
The hyperinsulinemic–euglycemic glucose clamp technique is considered the primary and most direct approach for quantifying insulin sensitivity and estimating IR. However, this approach is time-consuming, costly, labor-intensive, and technically complex [14]. The homeostatic model assessment of IR (HOMA-IR) serves as a mathematical model to assess IR indirectly [15]. However, its clinical utility is somewhat limited as it requires the measurement of fasting insulin, which is not routinely assessed unless the endocrine system is specifically evaluated. As there is an increasing trend toward the utilization of IR assessments in clinical settings, the importance of relatively simple markers has been emphasized. Therefore, clinicians require a convenient surrogate marker to assess IR in routine clinical practice. Previous research has shown that the triglyceride–glucose (TyG) index is closely associated with IR and serves as a marker of IR [16]. Another surrogate marker is the triglyceride-to-high-density lipoprotein cholesterol (TG/HDL-C) ratio, a simple indicator of IR that is strongly associated with HOMA-IR [17,18]. The most recently proposed measure of IR is the metabolic score for IR (METS-IR), which has been used as a new surrogate marker for IR because of its association with the development of type 2 diabetes mellitus, cardiovascular disease, dyslipidemia, and hyperuricemia [19,20,21,22].
Because of the challenges associated with direct measurements of IR, which is considered a key process in the development of CRC, surrogate markers, such as the TyG index, TG/HDL-C ratio, and METS-IR, have been proposed. However, only a few studies have investigated their association with the incidence of CRC [23,24,25]. Furthermore, no studies have investigated the association between METS-IR and CRC incidence. Therefore, the objective of this large cohort study was to assess the association between surrogate markers of IR and the incidence of CRC in specific subgroups, including sex, age, and obesity status, and to determine whether colon or rectal cancer was present in Korean individuals who participated in the National Health Screening Program (NHSP).

2. Materials and Methods

2.1. Study Design and Population

This retrospective population-based cohort study used claims data obtained from the National Health Insurance Service—National Health Screening Cohort (NHIS-HealS) in Korea. The NHIS is a single government insurer that provides a mandatory universal insurance system for the Korean population through which a database was established encompassing population statistics, treatment claims for hospitalizations and outpatient care, prescription drugs, medical procedures, and diagnoses according to the International Classification of Diseases, 10th edition (ICD-10). Additionally, the National Health Screening Program (NHSP) is provided to all insured individuals aged over 40 years every two years. This program includes a self-report questionnaire that collects sociodemographic data, anthropometric measurements, lifestyle behaviors, and laboratory test results. The NHIS-HealS database was constructed using data from NHSP participants.
We analyzed a cohort of 362,285 Korean adults aged over 40 years who participated in the NHSP from 2009 to 2010 by utilizing data from the NHIS-HealS database. From this cohort, we excluded 5950 individuals with CRC before the index date and 23,487 individuals who were diagnosed with cancers other than CRC during the follow-up period. Furthermore, we excluded 3850 individuals with missing data and 14,857 individuals with TyG index, TG/HDL-C ratio, or METS-IR values below the 1st or above the 99th percentile. Therefore, 314,141 individuals were included in the analysis. The follow-up period was extended until 31 December 2019 and ended earlier in the event of death or CRC diagnosis (Figure 1).

2.2. Definitions of Key Variables

The equations used to quantify IR, including the TyG index, TG/HDL-C ratio, and METS-IR, were evaluated based on levels of triglyceride (TG), fasting blood glucose (FBG), and high-density lipoprotein cholesterol (HDL-C) and the body mass index (BMI). The TyG index was calculated by taking a natural logarithm (ln) using the following equation: ln [TG (mg/dL) × FBG (mg/dL)/2]. The TG/HDL-C ratio was calculated using the following equation: TG (mg/dL)/HDL-C (mg/dL). The METS-IR was calculated using the following equation: ln [(2 × FBG (mg/dL) + serum TG level (mg/dL)] × BMI (kg/m2)/ln [serum HDL-C level (mg/dL)]. Participants were divided into four groups based on quartiles (Q1, Q2, Q3, and Q4) of the TyG index, TG/HDL-C ratio, and METS-IR. To identify individuals with newly diagnosed CRC for data analysis, we utilized NHIS data with a primary focus on insurance claims. Patients with CRC were identified based on the ICD-10 diagnostic codes C18, C19, and C20.

2.3. Definitions of Covariates

The Charlson comorbidity index (CCI) was computed using comorbidities [26]. To calculate the BMI, the body weight in kilograms was divided by the square of the height in meters (kg/m2). As per guidelines provided by the World Health Organization considering the Asia–Pacific perspective, obesity was defined as a BMI of ≥25 kg/m2. The laboratory results included hemoglobin levels and glomerular filtration rate (GFR) measurements. The self-report questionnaire collected data on current smoking, alcohol consumption, and regular exercise habits. Income level was classified into four quantiles, and residence was categorized as either urban or rural. Definitions of hypertension, diabetes, and dyslipidemia are provided in Supplementary Table S1.

2.4. Statistics and Data Analysis

Variables were reported as means with standard deviations or frequencies with percentages. We present a Kaplan–Meier curve to visualize the relationship between the surrogate markers of IR and CRC. To evaluate the risk of CRC, we used a Cox proportional hazards model with adjustments for multiple covariates, including sex, age, income level, residence, hypertension, diabetes, dyslipidemia, CCI, BMI, hemoglobin level, GFR, smoking, alcohol consumption, and regular exercise status. However, for the METS-IR, the model was adjusted for the aforementioned factors except for the BMI. Hazard ratios (HRs) and their corresponding 95% confidence intervals (CIs) were calculated to determine the association between the surrogate markers of IR and CRC. The proportional hazard assumption was evaluated using the Schoenfeld residuals test with the logarithm of the cumulative hazard function based on Kaplan–Meier estimates. There was no disturbance under the assumption of a proportional hazard risk over time. Furthermore, we employed restricted cubic splines to examine HR trends, along with their 95% CIs, for CRC according to IR marker levels. We used four knots at the 5th, 35th, 65th, and 95th percentiles according to the IR marker levels, and the mean values of the IR marker levels were selected as the reference values in the restricted cubic spline. All statistical analyses were performed using SAS (version 9.4, SAS Institute Inc., Cary, NC, USA) and R 3.6.0 (R Foundation for Statistical Computing, Vienna, Austria) to ensure the accuracy and reliability of the results. Statistical significance was defined as p < 0.05.

2.5. Ethics Statement

Our research protocols were approved by an ethics committee in compliance with the Declaration of Helsinki, which outlines the ethical principles of medical research involving human subjects. Because this study fell under a certain category, formal consent was not required. The study protocol was thoroughly reviewed and approved by the Institutional Review Board of Dong-A University College of Medicine (DAUHIRB-EXP23-105).

3. Results

3.1. Baseline Characteristics

Table 1 shows the distribution of various variables, such as sex, age, income level, residence, underlying disease, BMI, blood pressure, FBG, total cholesterol, TG, HDL-C, LDL-C, hemoglobin, GFR, smoking, alcohol consumption, and regular exercise, divided into quartiles based on the TyG index. The variables were evaluated in the same manner based on the quartiles of TG/HDL-C ratio and the METS-IR. This information is presented in Supplementary Tables S2 and S3. The average value for Q4 of the TyG index was 9.4 ± 0.3, which was higher compared to the average value of 8.0 ± 0.2 for Q1. The average value for Q4 of the TG/HDL-C ratio was 5.2 ± 1.6, which was higher compared to the average value of 1.1 ± 0.2 for Q1. The average value for Q4 of the MET-IR was 42.5 ± 2.9, which was higher compared with the average value of 28.7 ± 0.1 for Q1. The Q4s of the TyG index and the TG/HDL-C ratio exhibited relatively higher BMI, blood pressure, FBG, total cholesterol, TG, LDL-C, and hemoglobin levels and proportions of smokers compared to the other groups. Conversely, the values for HDL-C and the GFR and the frequency of regular exercise were relatively lower in these groups. The METS-IR showed trends similar to those of the TyG index and TG/HDL-C ratio, but no consistent trends were observed for the proportion of smokers. These differences were statistically significant (p = 0.001).

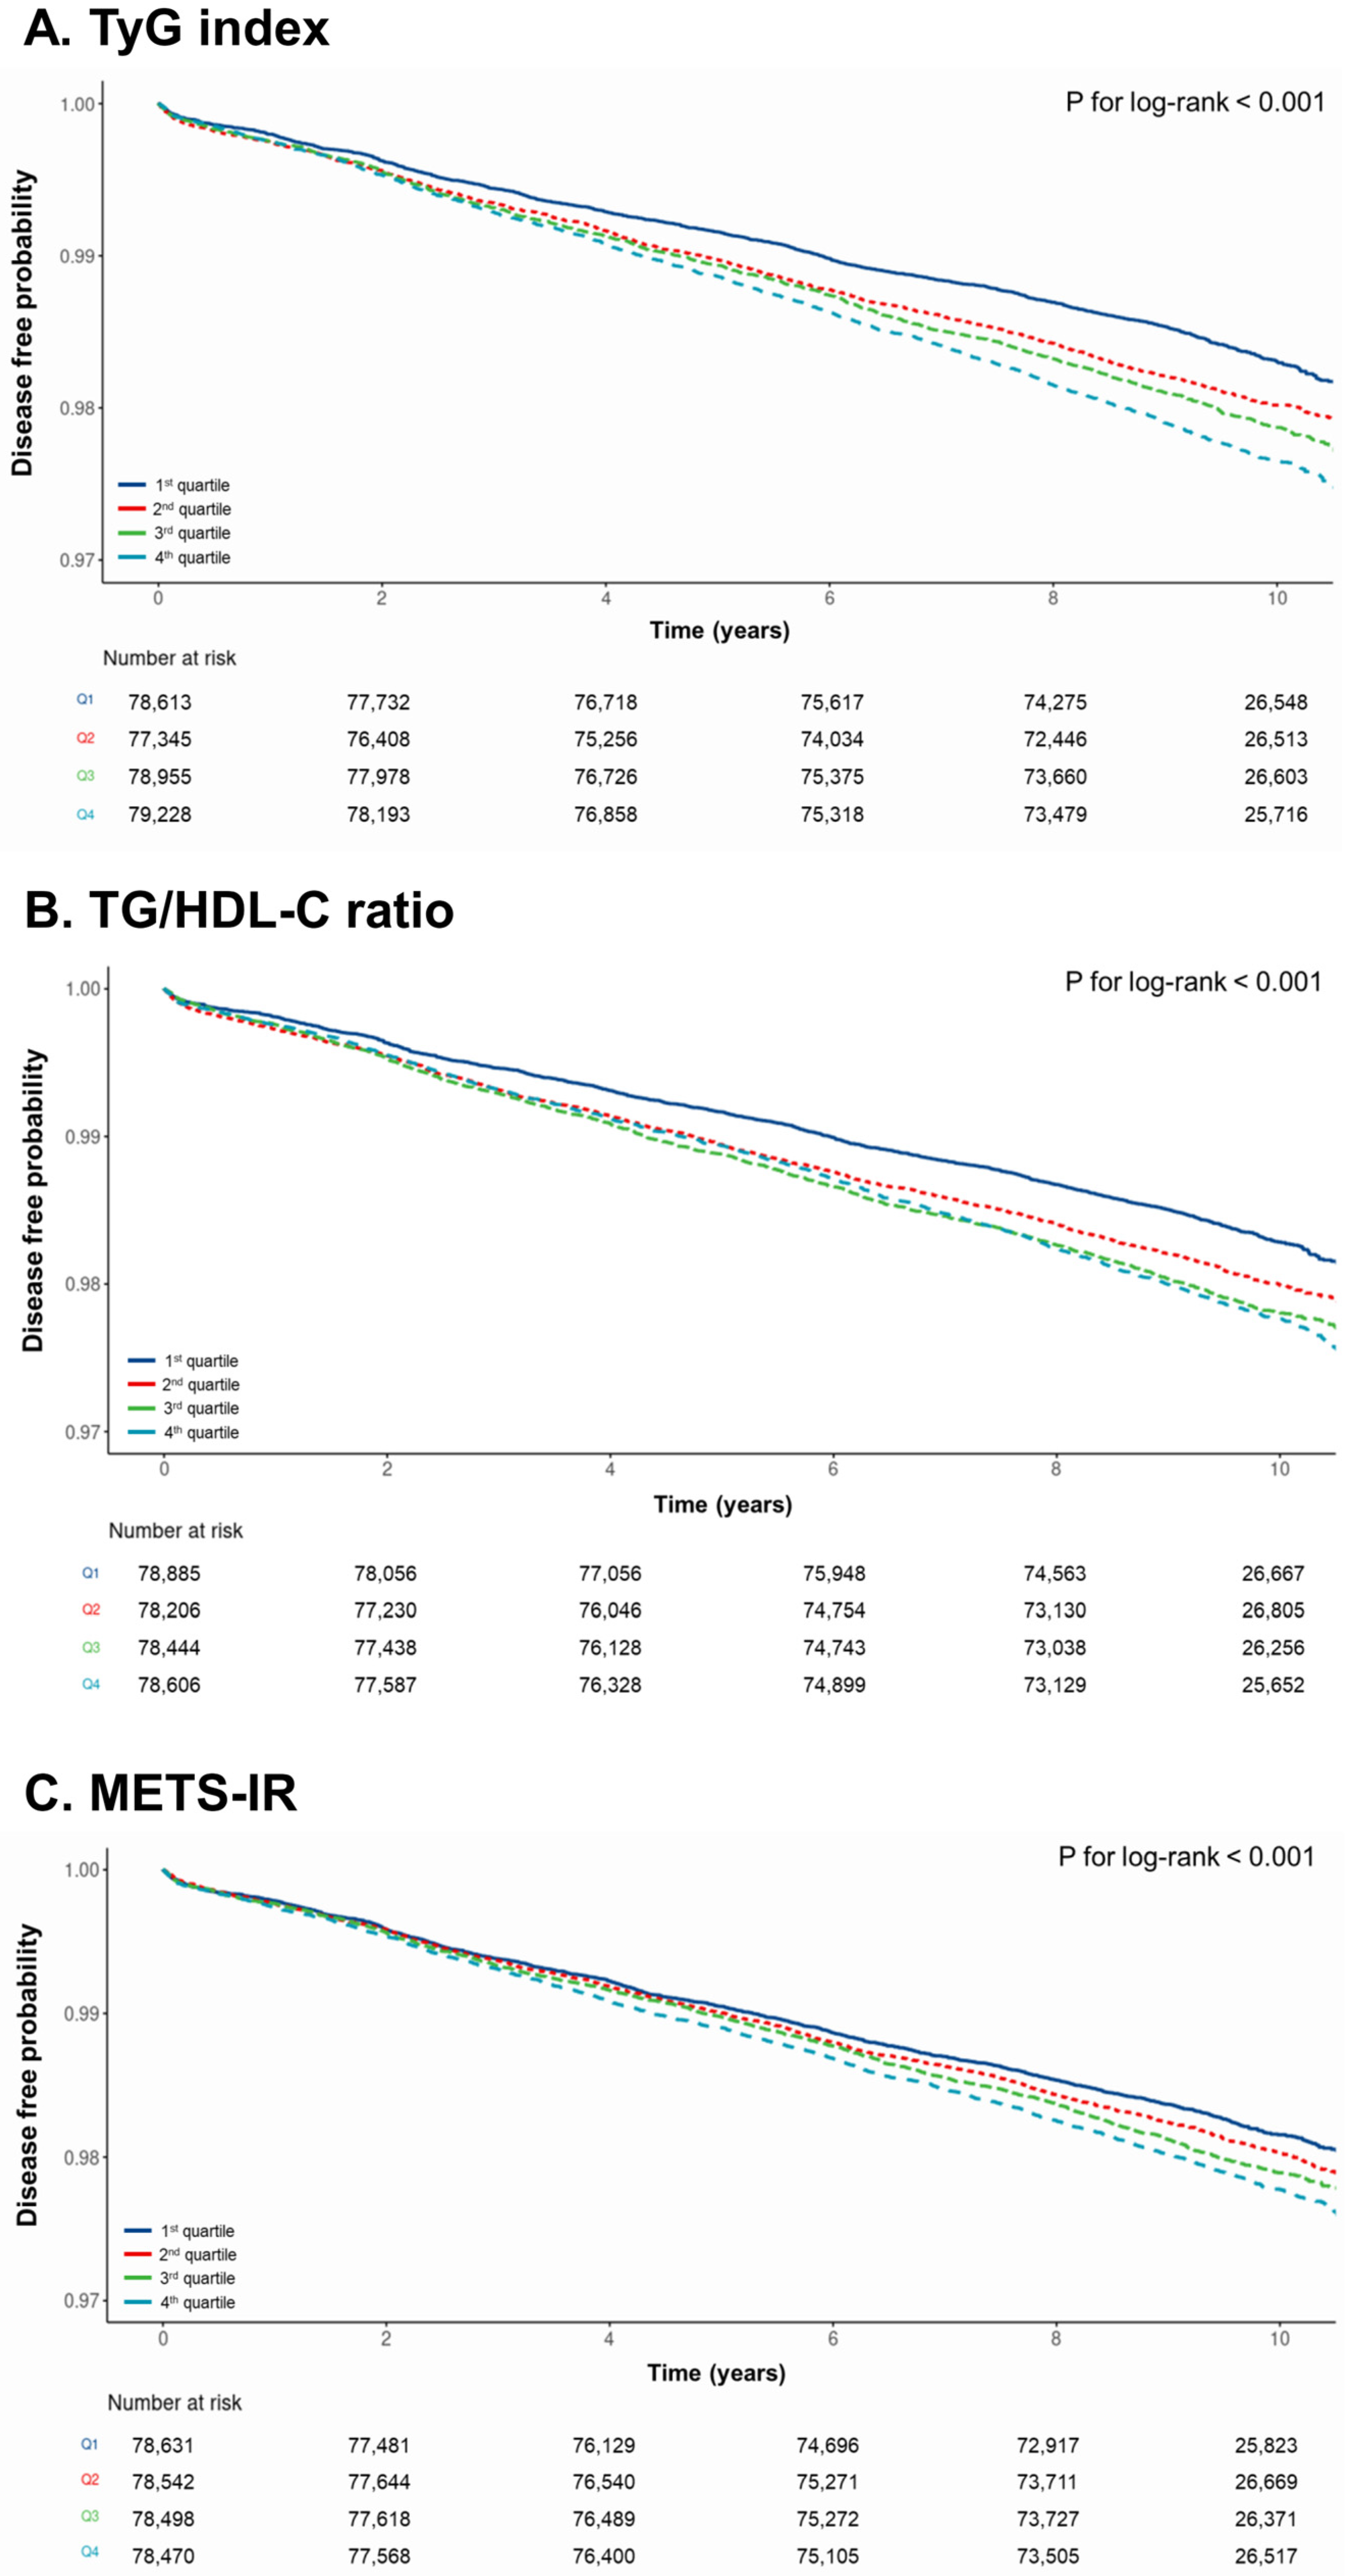
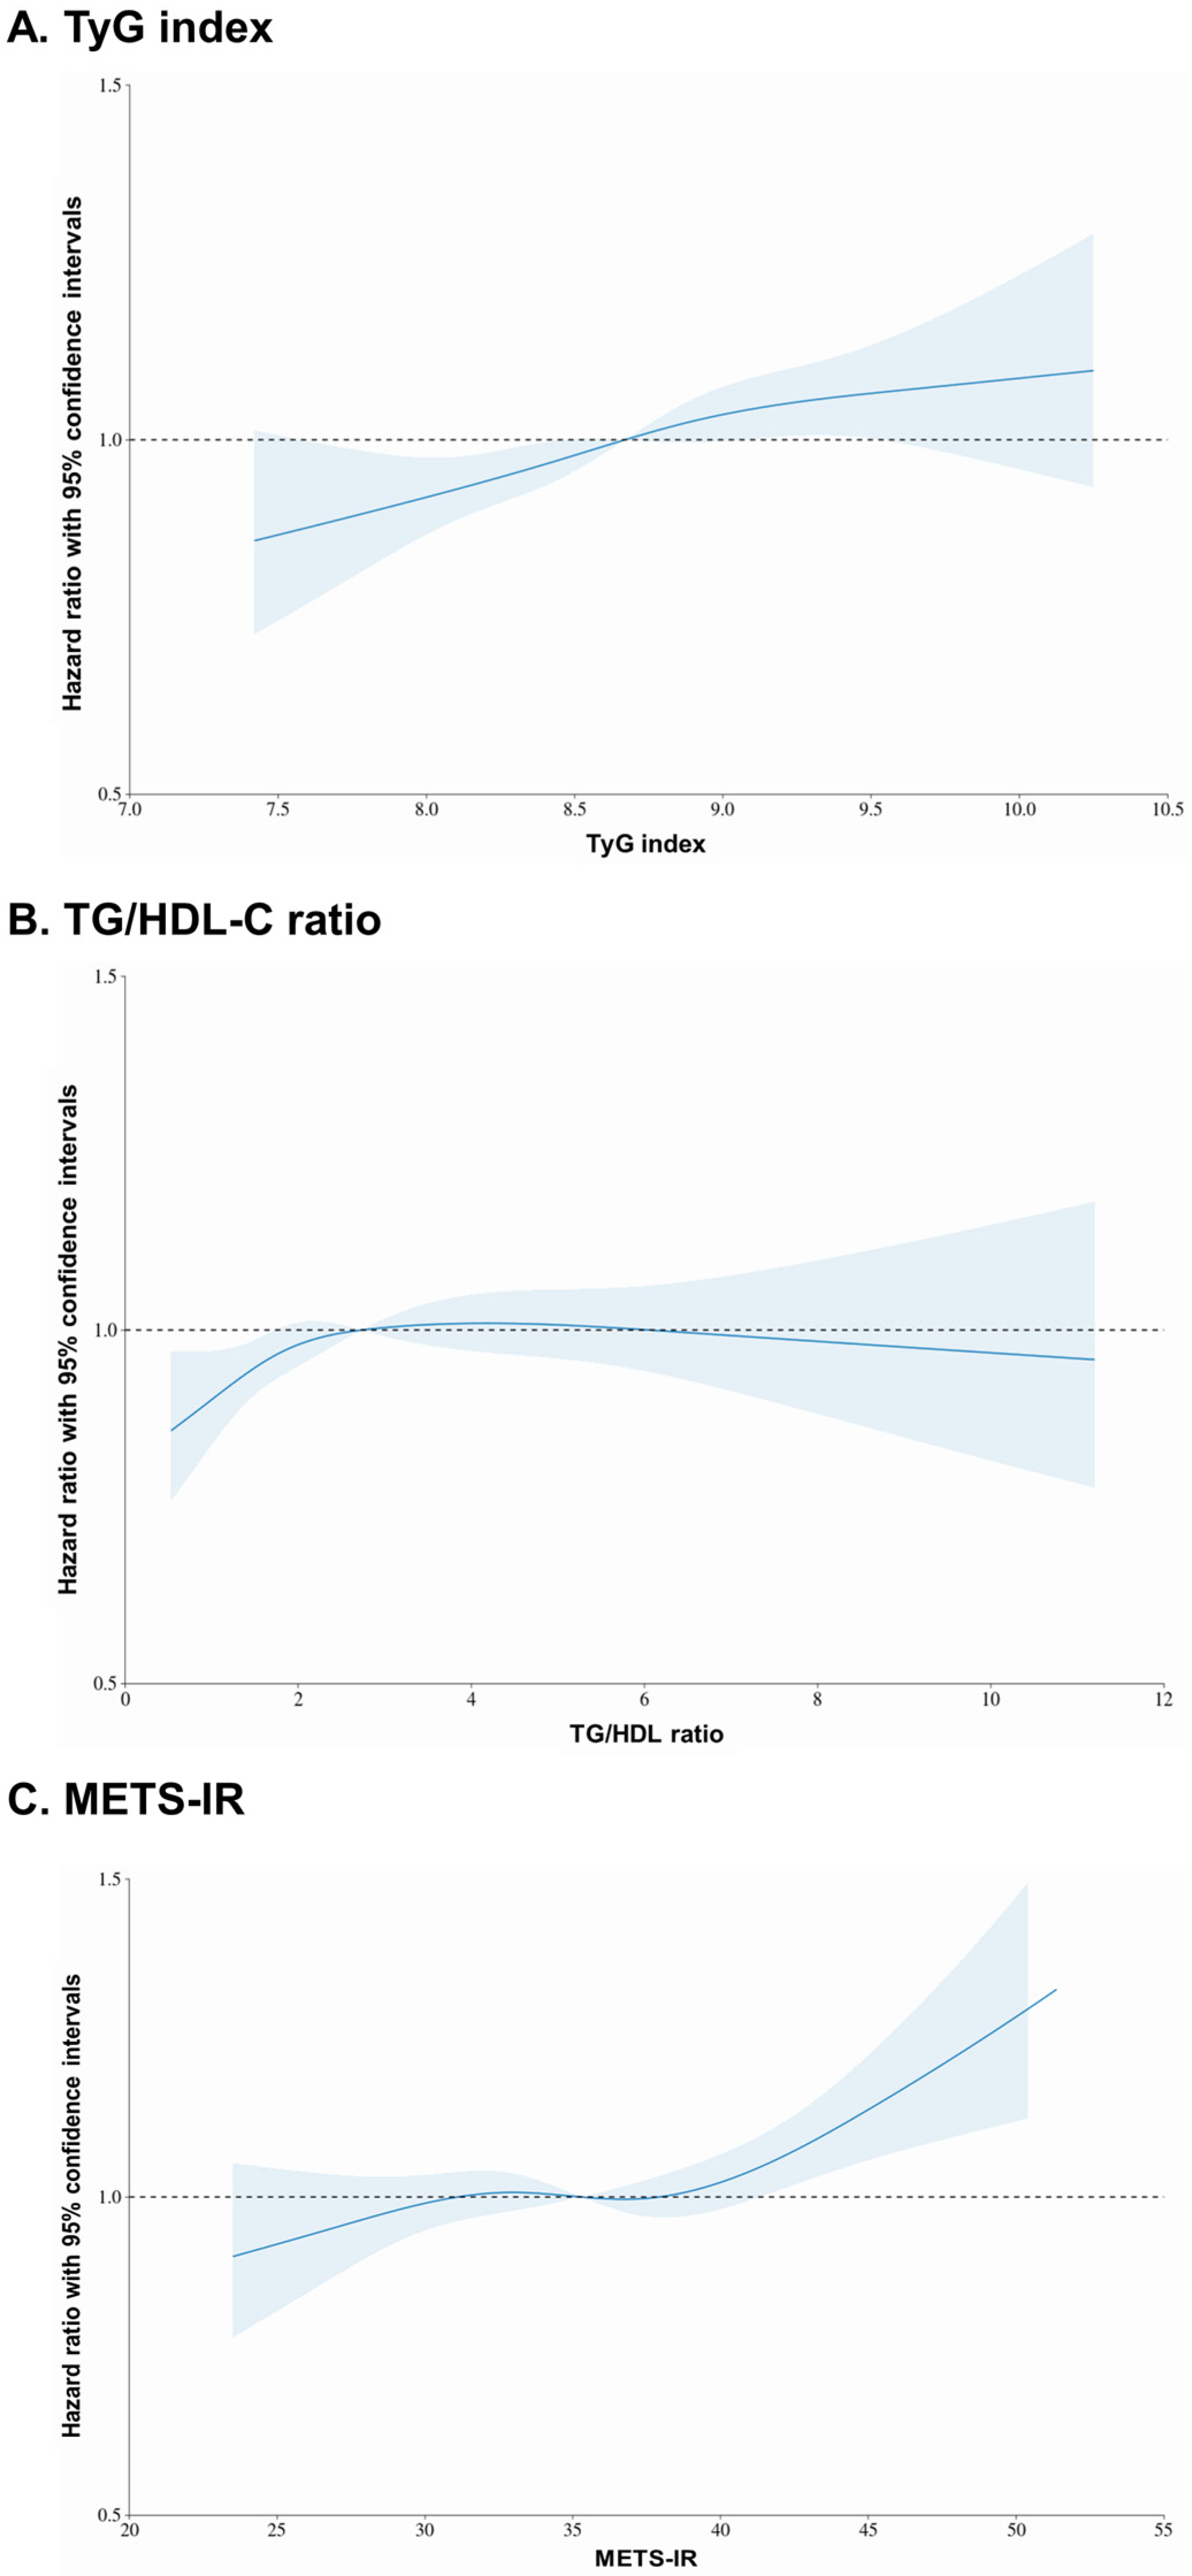
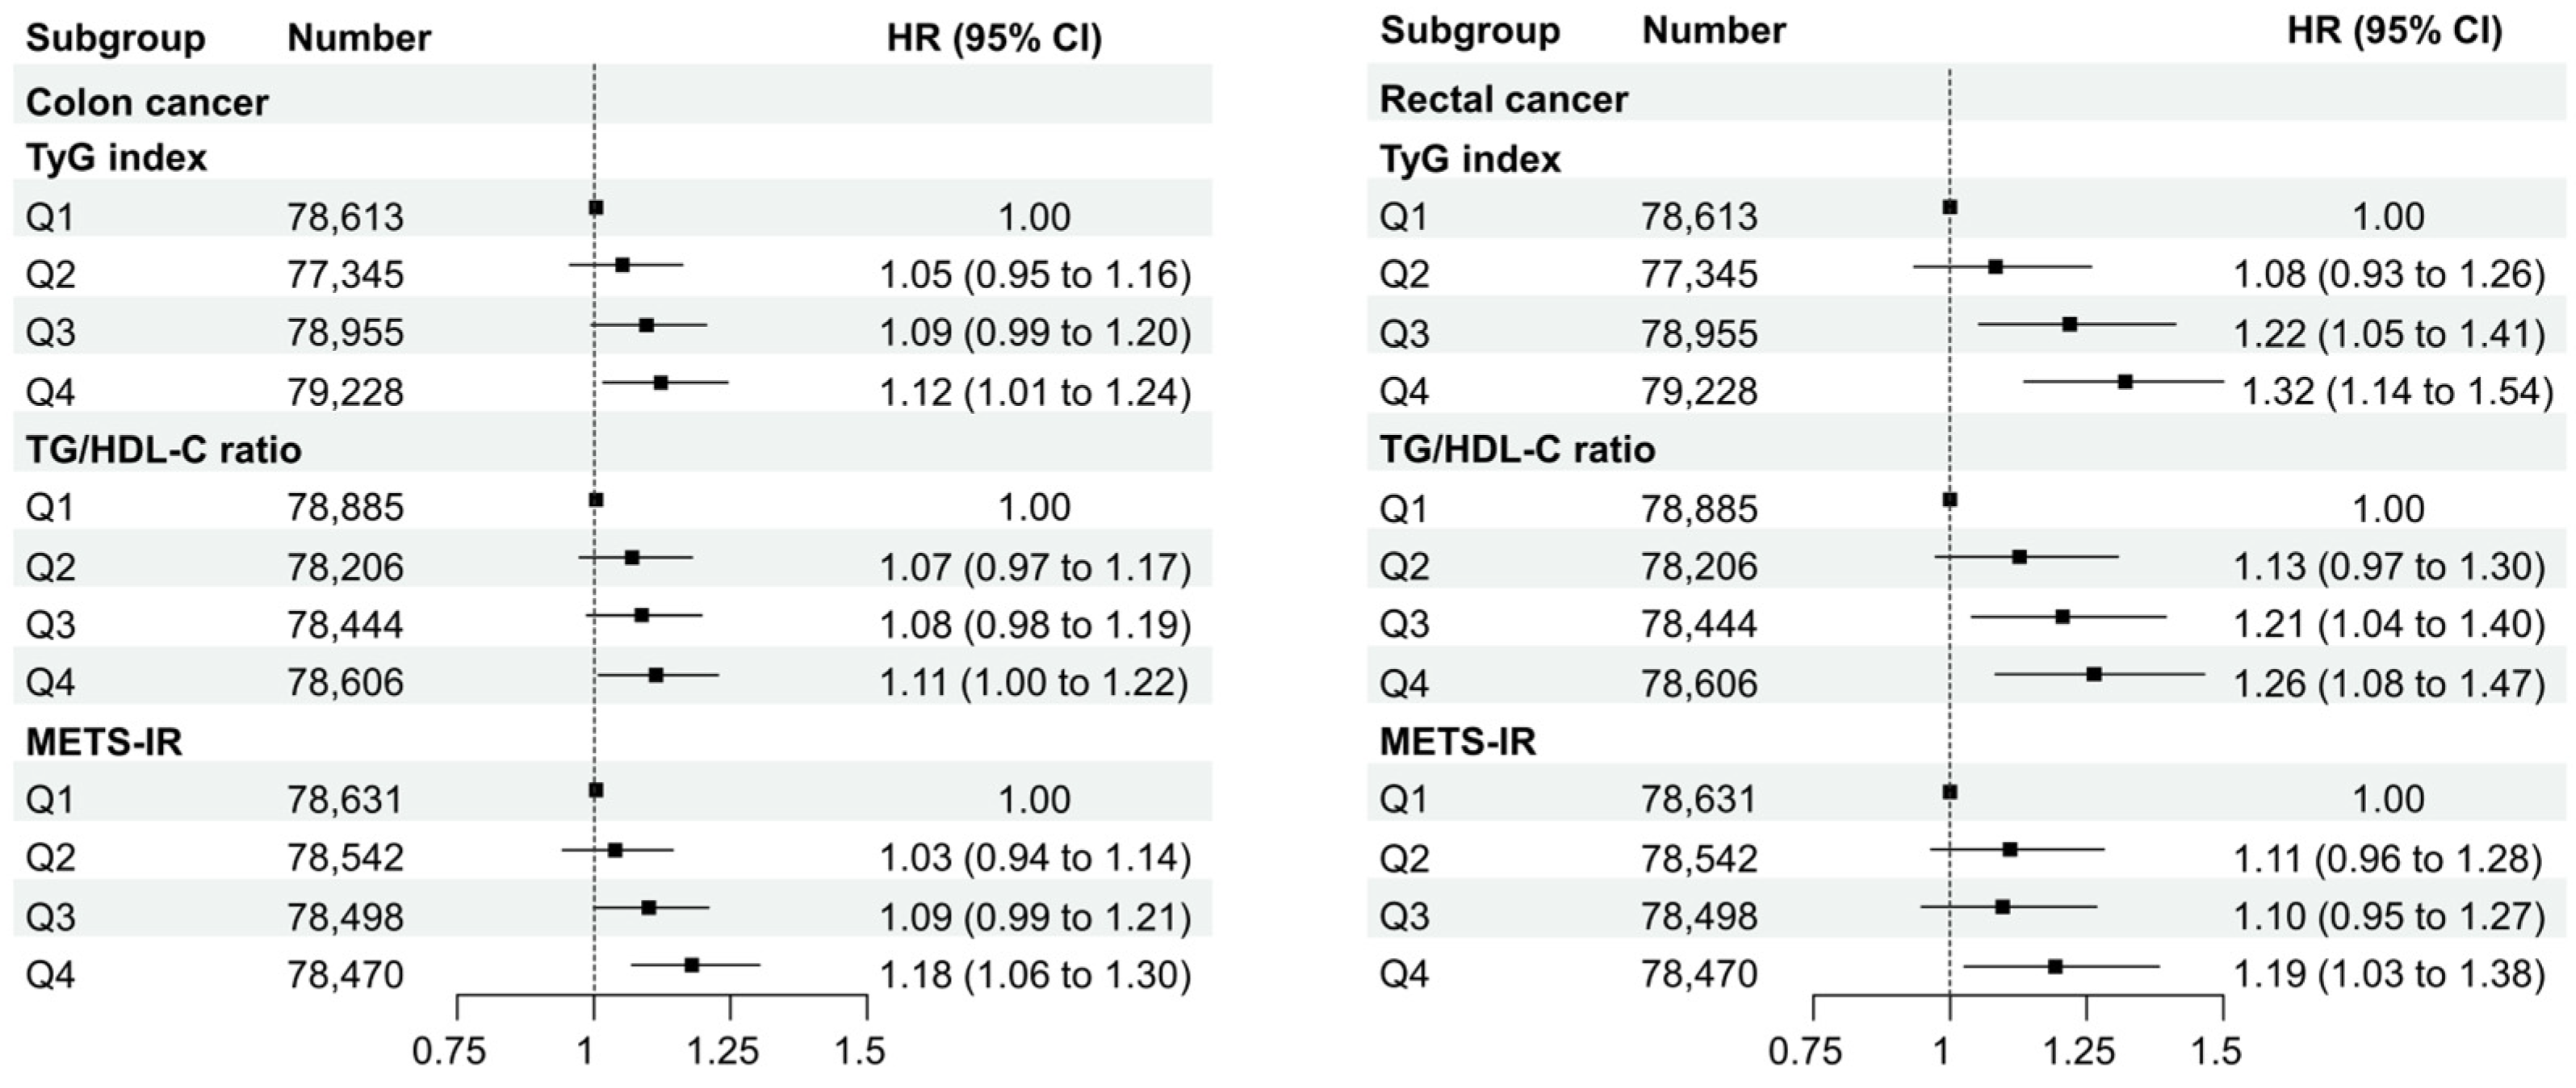
3.2. Incidence of CRC According to the TyG Index, TG/HDL-C Ratio, and METS-IR

Figure 2 illustrates a Kaplan–Meier curve demonstrating disease-free probability across the four quartiles of the TyG index, HDL-C ratio, and METS-IR. Throughout the 10-year observation period, there was a statistically significant variance in the incidence of CRC among the groups, with a sequential increase from Q1 to Q4. All surrogate markers of IR had significantly lower disease-free probabilities from Q1 to Q4 (p log-rank < 0.001).
Table 2 presents the crude and adjusted HRs with 95% CIs concerning the relationship between the quartiles of the TyG index, TG/HDL-C ratio, and METS-IR and CRC risk. In the crude model, those in Q2, Q3, and Q4 had a significantly increased risk of CRC compared with individuals in Q1 of the TyG index, TG/HDL-C ratio, and METS-IR. The corresponding adjusted HRs were 1.08 (95% CI: 1.00–1.16, p = 0.05) and 1.10 (95% CI: 1.02–1.19, p = 0.01) for Q3 and Q4 of the TyG index, respectively, which were statistically significant. Similarly, risks of CRC were observed in Q3 and Q4 of the TG/HDL-C ratio, with corresponding adjusted HRs of 1.11 (95% CI: 1.03–1.20, p = 0.005) and 1.12 (95% CI: 1.03–1.21, p = 0.006), respectively, which were statistically significant. In the adjusted model, METS-IR yielded no statistical significance, with HRs of 1.05 (95% CI: 0.97–1.13, p = 0.24), 1.03 (95% CI: 0.95–1.11, p = 0.08), and 1.06 (95% CI: 0.99–1.15, p = 0.02) for Q2 and Q3, respectively. However, statical significance was observed with an HR of 1.10 (95% CI: 1.02–1.18, p = 0.02) for Q4.
Figure 3 presents a restricted cubic spline, a mathematical function employed to model nonlinear relationships between a continuous predictor variable and an outcome variable, such as the adjusted HRs with 95% CIs. The solid line represents the HR, and the blue area represents the 95% CIs. For TyG index values ≥ 8.67, the HR value increased to values > 1, and for values ≥ 9.05, all 95% CI values exceeded 1. However, for TG/HDL-C ratio values ≥ 2.73, the HR exceeded 1, but there were no values for which all CIs exceeded 1. For METS-IR values ≥ 35.3, the HR exceeded 1, and for values ≥ 41.2, all 95% CIs exceeded 1. An analysis of the overall graph using the restricted cubic spline method showed a nonlinear, positive dose–response association between the TyG index and the METS-IR in relation to the incidence of CRC, while the relationship for the TG/HDL-C ratio was less clear.

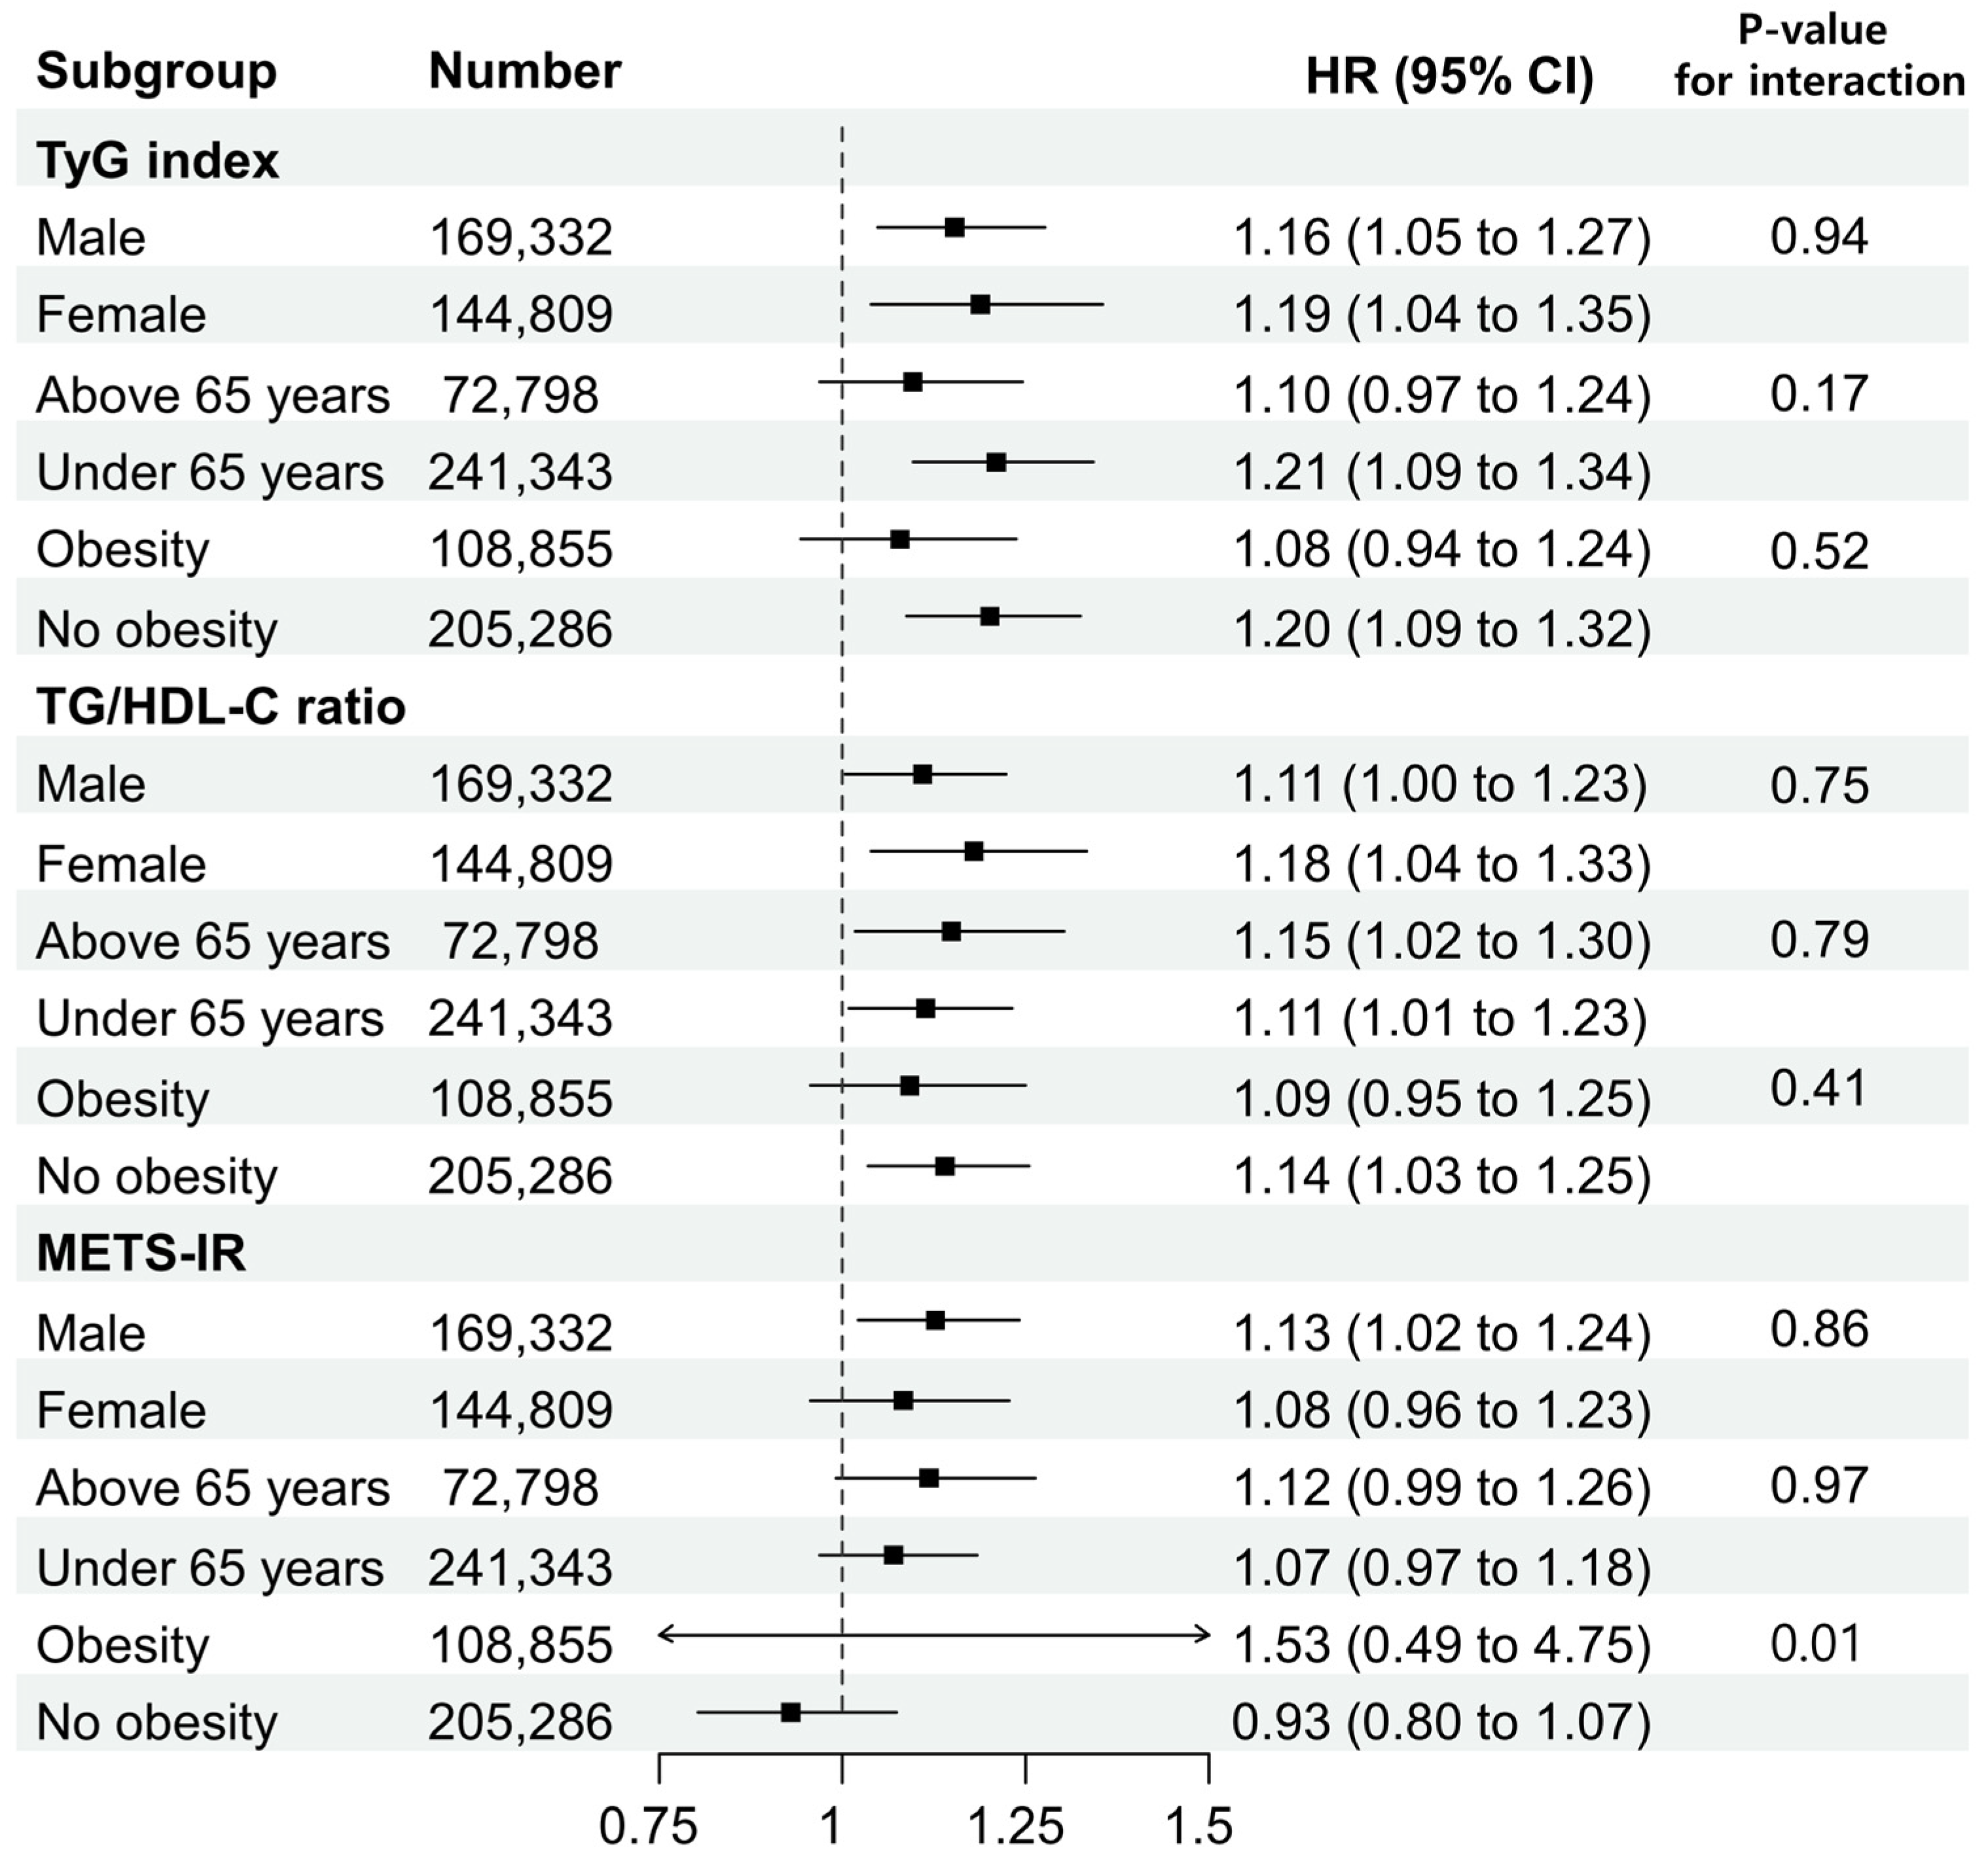
3.3. Subgroup Analysis

Figure 4 and Figure 5 display the HRs of the TyG index, TG/HDL-C ratio, and METS-IR values in Q4 compared with Q1 for subgroups based on sex, age (<65 and ≥65 years), obesity status, and cancer site (colon and rectal cancers). In the TyG index and TG/HDL-C ratio, associations according to sex, age, or obesity status did not differ significantly. However, in the METS-IR, a statistically significant association was observed in the obese group compared to the non-obese group (p-value for interaction = 0.01). Based on the location of cancer, this study divided the cases into colon and rectal cancers and compared the TyG index, TG/HDL-C ratio, and METS-IR by quantile in both cancer types. As a result, in colon cancer, Q4 of the TyG index showed a statistically significant HR of 1.12 (95% CI: 1.01–1.24), Q4 of the TG/HDL-C ratio displayed an HR of 1.11 (95% CI: 1.00–1.22), and Q4 of METS-IR was significantly associated with an HR of 1.18 (95% CI: 1.06–1.30). In rectal cancer, Q3 and Q4 of the TyG index exhibited statistically significant HRs of 1.22 (95% CI: 1.05–1.41) and 1.32 (95% CI: 1.14–1.54), respectively. Q3 and Q4 of the TG/HDL-C ratio showed statistically significant HRs of 1.21 (95% CI: 1.04–1.40) and 1.11 (95% CI: 1.08–1.47), respectively, while the METS-IR was statistically significant only in Q4 with an HR of 1.19 (95% CI: 1.03–1.38).

4. Discussion

To the best of our knowledge, this large, nationwide population-based cohort study is the first conducted to concurrently evaluate the relationship between CRC and three surrogate markers of IR: the TyG index, TG/HDL-C ratio, and METS-IR. Despite variations observed across statistical techniques, this study ultimately confirmed that the TyG index is the surrogate marker for IR most strongly associated with CRC.
A consistent positive correlation between CRC and obesity, as determined by the BMI, has been observed [27,28,29,30]. The underlying mechanisms associated with obesity are likely to share similarities with those extensively recognized in the context of metabolic syndrome. Studies exploring the relationship between metabolic syndrome and the incidence of CRC have demonstrated a positive correlation [31,32,33]. Several mechanisms are involved in this process, including chronic inflammation triggered by the release of inflammatory cytokines and adipokines from adipose tissue [13,34,35]. Moreover, changes in sex hormone and adipokine levels can affect cell growth, inflammation, and other processes associated with cancer development [36,37]. Additionally, obesity and metabolic syndrome alter the gut microbiome and play a role in these mechanisms [38,39]. In addition to the aforementioned factors, IR is a key mechanism involved in this process. IR leads to an increase in hyperinsulinemia, which in turn triggers the activation of phosphoinositide 3-kinase/protein kinase B/mammalian target of rapamycin, known as the PI3K/Akt/mTOR signaling pathway in CRC [40]. IR also plays a major role in CRC development by increasing IGF-1 levels and altering PPARγ and NF-κB signaling [41,42,43].
The hyperinsulinemic–euglycemic clamp is the standard diagnostic test for IR; however, its application is limited and challenging in clinical settings. Therefore, a need for surrogate markers has emerged. The TyG index is one of these prominent markers. This marker was first proposed by Simental-Mendia et al. [16] and has been recognized as a valuable surrogate marker associated with IR in various studies, linking it to the development of type 2 diabetes and cardiovascular and cerebrovascular diseases [44,45,46]. The TG/HDL-C ratio, or METS-IR, is another, simpler marker [17,19]. Several studies have reported associations with diseases linked to IR, similar to the TyG index [20,47,48,49]. These surrogate markers of IR do not require insulin levels, which are difficult to measure in clinical settings; instead, they can be obtained using simple formulas, thus making them easy to evaluate, especially in large-scale population studies. However, despite these advantages, there is still limited research on its association with CRC; in particular, there are no studies available on the recently proposed METS-IR.
Previous studies showed a positive association between the TyG index and CRC in a study of 510,471 individuals from six European countries and a Japanese study of 27,944 individuals [23,24]. Additionally, in a study of 93,659 Chinese individuals, the TyG index and TG/HDL-C ratio were evaluated together, and both were positively associated with CRC [25]. Similar trends were observed in the present study, which is a 10-year retrospective cohort study of 314,141 Koreans. However, this study discovered notable differences from previous studies. First, this study aimed to investigate the association between three surrogate markers of IR (the TyG index, TG/HDL-C ratio, and METS-IR) and CRC, using various statistical methods. In this study, surrogate markers of IR yielded a significant association with CRC, as observed in the Kaplan–Meier curves and the Cox proportional hazards models. Moreover, a restricted cubic spline analysis revealed that the IR markers displayed a nonlinear, positive dose–response association with the incidence of CRC. Although there was variation across statistical techniques, this study confirmed that the TyG index, TG/HDL-C ratio, and METS-IR are surrogate markers for IR that are strongly associated with CRC.
Second, this study used a large dataset to conduct subgroup analyses that included factors such as sex, age, and obesity status. Additionally, analyses were performed based on the location of the cancer. In the subgroup analyses of the TyG index and TG/HDL-C ratio, which were found to be statistically significant in the adjusted model of the Cox proportional hazard analysis, there were no differences between the groups in their associations with CRC based on sex, age, or obesity status. In the subgroup analyses of the METS-IR, statistical significance was observed between the obese and non-obese groups, while in the other groups excluding this, there was no statistical significance, similar to other markers.
Although there is some variability among studies, previous studies investigating the relationship between CRC and obesity or metabolic syndrome indicated weaker associations in females compared with males [50,51]. The observed sex differences could be attributed to variations in the prevalence and age of onset of metabolic syndrome between sexes or potentially influenced by the protective effects of estrogen, which may induce apoptosis and inhibit cell proliferation [52]. However, the TyG index, TG/HDL-C ratio, and METS-IR evaluated in this study demonstrated no significant differences in their association with CRC between males and females. Considering prior research indicating that higher amounts of visceral and hepatic adipose tissue may lead to increased IR in men compared with women and the absence of protective effects from estrogen [53], it is essential to interpret the findings of this subgroup analysis with caution. Further research is required to understand this relationship better.
This study is associated with some limitations. First, it employed a retrospective study design that utilized only measurements of TG, FBG, HDL-C, and BMI at the time of the health examination; thus, it did not consider any changes in these values during the 10-year follow-up period. Consequently, the potential impact of fluctuations in these indicators on their association with CRC could not be assessed. Second, because the data were collected from a large-scale screening program in Korea, the generalizability of the findings to other ethnic groups is limited. Third, there may be hidden covariates that cannot be extracted from the NHIS-HealS database. Factors that may influence the development of CRC include a family history of CRC, a history of colorectal polyp resection, inflammatory bowel disease, a sedentary lifestyle, an inadequate intake of fruits and vegetables, a low-fiber and high-fat diet, and excessive consumption of processed meat. However, these factors were not considered in this study.
Despite these limitations, to our knowledge, this study was the first to compare three surrogate markers of IR, namely the TyG index, TG/HDL-C ratio, and METS-IR, with CRC. Moreover, the study benefitted from a large cohort with nationwide population-based data from the NHIS-HealS database, which was standardized to ensure the reliability of the results. In addition, we employed a diverse set of statistical techniques to explore the relationship between IR markers and CRC.

5. Conclusions

In conclusion, the TyG index, TG/HDL-C ratio, and METS-IR were positively correlated with CRC incidence in Koreans.

Supplementary Materials

The following supporting information can be downloaded at https://www.mdpi.com/article/10.3390/jcm13061628/s1, Table S1. Definitions for clinical variables; Table S2. Baseline characteristics of study population according to the TG/HDL-C ratio; Table S3. Baseline characteristics of study population according to the METS-IR.

Author Contributions

Conceptualization, J.Y.L.; methodology, M.S.; software, M.S.; validation, M.S., J.Y.L. and Y.K.; formal analysis, M.S.; investigation, M.S and S.Y.M.; resources, M.S.; data curation, M.S.; writing—original draft preparation, M.S and J.Y.L.; writing—review and editing, M.S. and J.Y.L.; visualization, M.S.; supervision, M.S., S.Y.M., M.K., Y.K. and J.Y.L.; project administration, J.Y.L.; funding acquisition, J.Y.L. All authors have read and agreed to the published version of the manuscript.

Funding

This research was funded by Dong-A University in 2024.

Institutional Review Board Statement

Our research protocols were approved by an ethics committee in compliance with the Declaration of Helsinki which outlines the ethical principles of medical research involving human subjects. Because this study fell under a certain category, formal consent was not required. The study protocol was thoroughly reviewed and approved by the Institutional Review Board of Dong-A University College of Medicine (DAUHIRB-EXP23-105, approval date: 20 June 2023).

Informed Consent Statement

Because this study fell under a certain category, formal consent was not required.

Data Availability Statement

Data are contained within the article and Supplementary Materials.

Conflicts of Interest

The authors declare no conflicts of interest.

References

  1. Siegel, R.L.; Miller, K.D.; Wagle, N.S.; Jemal, A. Cancer statistics, 2023. CA A Cancer J. Clin. 2023, 73, 17–48. [Google Scholar] [CrossRef] [PubMed]
  2. Keum, N.; Giovannucci, E. Global burden of colorectal cancer: Emerging trends, risk factors and prevention strategies. Nat. Rev. Gastroenterol. Hepatol. 2019, 16, 713–732. [Google Scholar] [CrossRef] [PubMed]
  3. Rothwell, J.A.; Jenab, M.; Karimi, M.; Truong, T.; Mahamat-Saleh, Y.; Ferrari, P.; Dashti, S.G.; Kühn, T.; Cross, A.J.; Severi, G.; et al. Metabolic Syndrome and Risk of Gastrointestinal Cancers: An Investigation Using Large-scale Molecular Data. Clin. Gastroenterol. Hepatol. 2022, 20, e1338–e1352. [Google Scholar] [CrossRef] [PubMed]
  4. Tran, T.T.; Gunathilake, M.; Lee, J.; Kim, J. Association between metabolic syndrome and its components and incident colorectal cancer in a prospective cohort study. Cancer 2022, 128, 1230–1241. [Google Scholar] [CrossRef] [PubMed]
  5. Li, M.; Chi, X.; Wang, Y.; Setrerrahmane, S.; Xie, W.; Xu, H. Trends in insulin resistance: Insights into mechanisms and therapeutic strategy. Signal Transduct. Target. Ther. 2022, 7, 216. [Google Scholar] [CrossRef] [PubMed]
  6. Laakso, M.; Kuusisto, J. Insulin resistance and hyperglycaemia in cardiovascular disease development. Nat. Rev. Endocrinol. 2014, 10, 293–302. [Google Scholar] [CrossRef] [PubMed]
  7. Bugianesi, E.; Moscatiello, S.; Ciaravella, M.F.; Marchesini, G. Insulin resistance in nonalcoholic fatty liver disease. Curr. Pharm. Des. 2010, 16, 1941–1951. [Google Scholar] [CrossRef]
  8. Diamanti-Kandarakis, E.; Dunaif, A. Insulin resistance and the polycystic ovary syndrome revisited: An update on mechanisms and implications. Endocr. Rev. 2012, 33, 981–1030. [Google Scholar] [CrossRef]
  9. Lauby-Secretan, B.; Scoccianti, C.; Loomis, D.; Grosse, Y.; Bianchini, F.; Straif, K. Body Fatness and Cancer—Viewpoint of the IARC Working Group. N. Engl. J. Med. 2016, 375, 794–798. [Google Scholar] [CrossRef]
  10. Leitner, B.P.; Siebel, S.; Akingbesote, N.D.; Zhang, X.; Perry, R.J. Insulin and cancer: A tangled web. Biochem. J. 2022, 479, 583–607. [Google Scholar] [CrossRef]
  11. Giovannucci, E. Metabolic syndrome, hyperinsulinemia, and colon cancer: A review. Am. J. Clin. Nutr. 2007, 86, 836S–842S. [Google Scholar] [CrossRef]
  12. Gunter, M.J.; Hoover, D.R.; Yu, H.; Wassertheil-Smoller, S.; Rohan, T.E.; Manson, J.E.; Howard, B.V.; Wylie-Rosett, J.; Anderson, G.L.; Ho, G.Y.; et al. Insulin, insulin-like growth factor-I, endogenous estradiol, and risk of colorectal cancer in postmenopausal women. Cancer Res. 2008, 68, 329–337. [Google Scholar] [CrossRef] [PubMed]
  13. Renehan, A.G.; Zwahlen, M.; Egger, M. Adiposity and cancer risk: New mechanistic insights from epidemiology. Nat. Rev. Cancer 2015, 15, 484–498. [Google Scholar] [CrossRef] [PubMed]
  14. Singh, B.; Saxena, A. Surrogate markers of insulin resistance: A review. World J. Diabetes 2010, 1, 36–47. [Google Scholar] [CrossRef] [PubMed]
  15. Matthews, D.R.; Hosker, J.P.; Rudenski, A.S.; Naylor, B.A.; Treacher, D.F.; Turner, R.C. Homeostasis model assessment: Insulin resistance and beta-cell function from fasting plasma glucose and insulin concentrations in man. Diabetologia 1985, 28, 412–419. [Google Scholar] [CrossRef] [PubMed]
  16. Simental-Mendía, L.E.; Rodríguez-Morán, M.; Guerrero-Romero, F. The product of fasting glucose and triglycerides as surrogate for identifying insulin resistance in apparently healthy subjects. Metab. Syndr. Relat. Disord. 2008, 6, 299–304. [Google Scholar] [CrossRef] [PubMed]
  17. McLaughlin, T.; Reaven, G.; Abbasi, F.; Lamendola, C.; Saad, M.; Waters, D.; Simon, J.; Krauss, R.M. Is There a Simple Way to Identify Insulin-Resistant Individuals at Increased Risk of Cardiovascular Disease? Am. J. Cardiol. 2005, 96, 399–404. [Google Scholar] [CrossRef]
  18. Kim, J.S.; Kang, H.T.; Shim, J.Y.; Lee, H.R. The association between the triglyceride to high-density lipoprotein cholesterol ratio with insulin resistance (HOMA-IR) in the general Korean population: Based on the National Health and Nutrition Examination Survey in 2007–2009. Diabetes Res. Clin. Pract. 2012, 97, 132–138. [Google Scholar] [CrossRef]
  19. Bello-Chavolla, O.Y.; Almeda-Valdes, P.; Gomez-Velasco, D.; Viveros-Ruiz, T.; Cruz-Bautista, I.; Romo-Romo, A.; Sánchez-Lázaro, D.; Meza-Oviedo, D.; Vargas-Vázquez, A.; Campos, O.A.; et al. METS-IR, a novel score to evaluate insulin sensitivity, is predictive of visceral adiposity and incident type 2 diabetes. Eur. J. Endocrinol. 2018, 178, 533–544. [Google Scholar] [CrossRef]
  20. Wu, Z.; Cui, H.; Zhang, Y.; Liu, L.; Zhang, W.; Xiong, W.; Lu, F.; Peng, J.; Yang, J. The impact of the metabolic score for insulin resistance on cardiovascular disease: A 10-year follow-up cohort study. J. Endocrinol. Investig. 2022, 46, 523–533. [Google Scholar] [CrossRef]
  21. Paublini, H.; González, A.A.L.; Busquets-Cortés, C.; Tomas-Gil, P.; Riutord-Sbert, P.; Ramírez-Manent, J.I. Relationship between Atherogenic Dyslipidaemia and Lipid Triad and Scales That Assess Insulin Resistance. Nutrients 2023, 15, 2105. [Google Scholar] [CrossRef] [PubMed]
  22. Han, Y.; Zhou, Z.; Zhang, Y.; Zhao, G.; Xu, B. The Association of Surrogates of Insulin Resistance with Hyperuricemia among Middle-Aged and Older Individuals: A Population-Based Nationwide Cohort Study. Nutrients 2023, 15, 3139. [Google Scholar] [CrossRef] [PubMed]
  23. Fritz, J.; Bjørge, T.; Nagel, G.; Manjer, J.; Engeland, A.; Häggström, C.; Concin, H.; Teleka, S.; Tretli, S.; Gylling, B.; et al. The triglyceride-glucose index as a measure of insulin resistance and risk of obesity-related cancers. Int. J. Epidemiol. 2020, 49, 193–204. [Google Scholar] [CrossRef]
  24. Okamura, T.; Hashimoto, Y.; Hamaguchi, M.; Obora, A.; Kojima, T.; Fukui, M. Triglyceride–glucose index (TyG index) is a predictor of incident colorectal cancer: A population-based longitudinal study. BMC Endocr. Disord. 2020, 20, 113. [Google Scholar] [CrossRef] [PubMed]
  25. Liu, T.; Zhang, Q.; Wang, Y.; Ma, X.; Zhang, Q.; Song, M.; Cao, L.; Shi, H. Association between the TyG index and TG/HDL-C ratio as insulin resistance markers and the risk of colorectal cancer. BMC Cancer 2022, 22, 1007. [Google Scholar] [CrossRef] [PubMed]
  26. Quan, H.; Li, B.; Couris, C.M.; Fushimi, K.; Graham, P.; Hider, P.; Januel, J.M.; Sundararajan, V. Updating and validating the Charlson comorbidity index and score for risk adjustment in hospital discharge abstracts using data from 6 countries. Am. J. Epidemiol. 2011, 173, 676–682. [Google Scholar] [CrossRef] [PubMed]
  27. Giovannucci, E.; Ascherio, A.; Rimm, E.B.; Colditz, G.A.; Stampfer, M.J.; Willett, W.C. Physical activity, obesity, and risk for colon cancer and adenoma in men. Ann. Intern. Med. 1995, 122, 327–334. [Google Scholar] [CrossRef] [PubMed]
  28. Moghaddam, A.A.; Woodward, M.; Huxley, R. Obesity and Risk of Colorectal Cancer: A Meta-analysis of 31 Studies with 70,000 Events. Cancer Epidemiol. Biomark. Prev. 2007, 16, 2533–2547. [Google Scholar] [CrossRef]
  29. Bardou, M.; Barkun, A.N.; Martel, M. Obesity and colorectal cancer. Gut 2013, 62, 933–947. [Google Scholar] [CrossRef]
  30. Seo, J.Y.; Jin, E.H.; Chung, G.E.; Kim, Y.S.; Bae, J.H.; Yim, J.Y.; Han, K.D.; Yang, S.Y. The risk of colorectal cancer according to obesity status at four-year intervals: A nationwide population-based cohort study. Sci. Rep. 2023, 13, 8928. [Google Scholar] [CrossRef]
  31. Russo, A.; Autelitano, M.; Bisanti, L. Metabolic syndrome and cancer risk. Eur. J. Cancer 2008, 44, 293–297. [Google Scholar] [CrossRef] [PubMed]
  32. Stocks, T.; Lukanova, A.; Bjørge, T.; Ulmer, H.; Manjer, J.; Almquist, M.; Concin, H.; Engeland, A.; Hallmans, G.; Nagel, G.; et al. Metabolic factors and the risk of colorectal cancer in 580,000 men and women in the metabolic syndrome and cancer project (Me-Can). Cancer 2011, 117, 2398–2407. [Google Scholar] [CrossRef] [PubMed]
  33. Lee, J.; Lee, K.S.; Kim, H.; Jeong, H.; Choi, M.-J.; Yoo, H.-W.; Han, T.-H.; Lee, H. The relationship between metabolic syndrome and the incidence of colorectal cancer. Environ. Health Prev. Med. 2020, 25, 6. [Google Scholar] [CrossRef] [PubMed]
  34. Gallagher, E.J.; LeRoith, D. Epidemiology and molecular mechanisms tying obesity, diabetes, and the metabolic syndrome with cancer. Diabetes Care 2013, 36 (Suppl. 2), S233–S239. [Google Scholar] [CrossRef] [PubMed]
  35. Palmqvist, R.; Hallmans, G.; Rinaldi, S.; Biessy, C.; Stenling, R.; Riboli, E.; Kaaks, R. Plasma insulin-like growth factor 1, insulin-like growth factor binding protein 3, and risk of colorectal cancer: A prospective study in northern Sweden. Gut 2002, 50, 642. [Google Scholar] [CrossRef] [PubMed]
  36. Kapoor, D.; Malkin, C.J.; Channer, K.S.; Jones, T.H. Androgens, insulin resistance and vascular disease in men. Clin. Endocrinol. 2005, 63, 239–250. [Google Scholar] [CrossRef] [PubMed]
  37. Harbs, J.; Rinaldi, S.; Gicquiau, A.; Keski-Rahkonen, P.; Mori, N.; Liu, X.; Kaaks, R.; Katzke, V.; Schulze, M.B.; Agnoli, C.; et al. Circulating Sex Hormone Levels and Colon Cancer Risk in Men: A Nested Case-Control Study and Meta-Analysis. Cancer Epidemiol. Biomark. Prev. 2022, 31, 793–803. [Google Scholar] [CrossRef]
  38. Singh, S.; Sharma, P.; Sarma, D.K.; Kumawat, M.; Tiwari, R.; Verma, V.; Nagpal, R.; Kumar, M. Implication of Obesity and Gut Microbiome Dysbiosis in the Etiology of Colorectal Cancer. Cancers 2023, 15, 1913. [Google Scholar] [CrossRef]
  39. Chen, H.; Zheng, X.; Zong, X.; Li, Z.; Li, N.; Hur, J.; Fritz, C.D.; Chapman, W., Jr.; Nickel, K.B.; Tipping, A.; et al. Metabolic syndrome, metabolic comorbid conditions and risk of early-onset colorectal cancer. Gut 2021, 70, 1147–1154. [Google Scholar] [CrossRef]
  40. Johnson, S.M.; Gulhati, P.; Rampy, B.A.; Han, Y.; Rychahou, P.G.; Doan, H.Q.; Weiss, H.L.; Evers, B.M. Novel Expression Patterns of PI3K/Akt/mTOR Signaling Pathway Components in Colorectal Cancer. J. Am. Coll. Surg. 2010, 210, 767–776. [Google Scholar] [CrossRef]
  41. Friedrich, N.; Thuesen, B.; Jørgensen, T.; Juul, A.; Spielhagen, C.; Wallaschofksi, H.; Linneberg, A. The association between IGF-I and insulin resistance: A general population study in Danish adults. Diabetes Care 2012, 35, 768–773. [Google Scholar] [CrossRef]
  42. Bogazzi, F.; Ultimieri, F.; Raggi, F.; Russo, D.; Vanacore, R.; Guida, C.; Viacava, P.; Cecchetti, D.; Acerbi, G.; Brogioni, S. PPARgamma inhibits GH synthesis and secretion and increases apoptosis of pituitary GH-secreting adenomas. Eur. J. Endocrinol. 2004, 150, 863–875. [Google Scholar] [CrossRef] [PubMed]
  43. Saldeen, J.; Welsh, N. p38 MAPK inhibits JNK2 and mediates cytokine-activated iNOS induction and apoptosis independently of NF-κB translocation in insulin-producing cells. Eur. Cytokine Netw. 2004, 15, 47–52. [Google Scholar] [PubMed]
  44. Low, S.; Khoo, K.C.J.; Irwan, B.; Sum, C.F.; Subramaniam, T.; Lim, S.C.; Wong, T.K.M. The role of triglyceride glucose index in development of Type 2 diabetes mellitus. Diabetes Res. Clin. Pract. 2018, 143, 43–49. [Google Scholar] [CrossRef] [PubMed]
  45. Sánchez-Íñigo, L.; Navarro-González, D.; Fernández-Montero, A.; Pastrana-Delgado, J.; Martínez, J.A. The TyG index may predict the development of cardiovascular events. Eur. J. Clin. Investig. 2016, 46, 189–197. [Google Scholar] [CrossRef]
  46. Yan, F.; Yan, S.; Wang, J.; Cui, Y.; Chen, F.; Fang, F.; Cui, W. Association between triglyceride glucose index and risk of cerebrovascular disease: Systematic review and meta-analysis. Cardiovasc. Diabetol. 2022, 21, 226. [Google Scholar] [CrossRef] [PubMed]
  47. Ren, X.; Chen, Z.; Zheng, S.; Han, T.; Li, Y.; Liu, W.; Hu, Y. Association between Triglyceride to HDL-C Ratio (TG/HDL-C) and Insulin Resistance in Chinese Patients with Newly Diagnosed Type 2 Diabetes Mellitus. PLoS ONE 2016, 11, e0154345. [Google Scholar] [CrossRef]
  48. Kosmas, C.E.; Rodriguez Polanco, S.; Bousvarou, M.D.; Papakonstantinou, E.J.; Peña Genao, E.; Guzman, E.; Kostara, C.E. The Triglyceride/High-Density Lipoprotein Cholesterol (TG/HDL-C) Ratio as a Risk Marker for Metabolic Syndrome and Cardiovascular Disease. Diagnostics 2023, 13, 929. [Google Scholar] [CrossRef]
  49. Yoon, J.; Jung, D.; Lee, Y.; Park, B. The metabolic score for insulin resistance (METS-IR) as a predictor of incident ischemic heart disease: A longitudinal study among Korean without diabetes. J. Pers. Med. 2021, 11, 742. [Google Scholar] [CrossRef]
  50. Harriss, D.J.; Atkinson, G.; George, K.; Tim Cable, N.; Reilly, T.; Haboubi, N.; Zwahlen, M.; Egger, M.; Renehan, A.G.; the C-CLEAR group. Lifestyle factors and colorectal cancer risk (1): Systematic review and meta-analysis of associations with body mass index. Color. Dis. 2009, 11, 547–563. [Google Scholar] [CrossRef]
  51. Pelucchi, C.; Negri, E.; Talamini, R.; Levi, F.; Giacosa, A.; Crispo, A.; Bidoli, E.; Montella, M.; Franceschi, S.; La Vecchia, C. Metabolic syndrome is associated with colorectal cancer in men. Eur. J. Cancer 2010, 46, 1866–1872. [Google Scholar] [CrossRef]
  52. Chen, J.; Iverson, D. Estrogen in obesity-associated colon cancer: Friend or foe? Protecting postmenopausal women but promoting late-stage colon cancer. Cancer Causes Control 2012, 23, 1767–1773. [Google Scholar] [CrossRef]
  53. Geer, E.B.; Shen, W. Gender differences in insulin resistance, body composition, and energy balance. Gend. Med. 2009, 6, 60–75. [Google Scholar] [CrossRef]
Figure 1. The flow of the selection of the study population.
Jcm 13 01628 g001
Figure 2. Kaplan–Meier curve for the association between surrogate markers of insulin resistance and colorectal cancer.
Jcm 13 01628 g002
Figure 3. Restricted cubic spline of hazard ratio with 95% confidence intervals for colorectal cancer according to surrogate markers of insulin resistance.
Jcm 13 01628 g003
Figure 4. Subgroup analysis according to sex, age, and obesity status.
Jcm 13 01628 g004
Figure 5. Subgroup analysis divided into colon cancer and rectal cancer.
Jcm 13 01628 g005
Table 1. Baseline characteristics of the study population according to the TyG index.
All Subjects
(n = 314,141)
TyG Indexp-Value
1st Quartile, Q1
(n = 78,613)
2nd Quartile, Q2
(n = 77,345)
3rd Quartile, Q3
(n = 78,955)
4th Quartile, Q4
(n = 79,228)
Demographics
 Age (years)57.8 (8.5)59.0 (8.8)59.4 (8.8)59.1 (8.7)<0.001
 Sex (%) <0.001
  Male35,857 (45.6)39,296 (50.8)43,783 (55.5)50,396 (63.6)
  Female42,756 (54.4)38,049 (49.2)35,172 (44.5)28,832 (36.4)
 Income level (%) <0.001
  1st quartile11,242 (14.3)10,919 (14.1)10,853 (13.7)10,911 (13.8)
  2nd quartile16,832 (21.4)16,019 (20.7)15,876 (20.1)16,087 (20.3)
  3rd quartile22,312 (28.4)22,529 (29.1)23,464 (29.7)24,290 (30.7)
  4th quartile28,227 (35.9)27,878 (36.0)28,762 (36.4)27,940 (35.3)
 Residence (%) <0.001
  Urban51,988 (66.1)50,093 (64.8)50,240 (63.6)50,027 (63.1)
  Rural26,625 (33.9)27,252 (35.2)28,715 (36.4)29,201 (36.9)
Underlying disease
 Hypertension (%)28,077 (35.7)34,020 (44.0)39,418 (49.9)44,785 (56.5)<0.001
 Diabetes (%)3707 (4.7)6449 (8.3)10,498 (13.3)22,659 (28.6)<0.001
 Dyslipidemia (%)18,337 (23.3)26,124 (33.8)34,566 (43.8)44,624 (56.3)<0.001
 Charlson comorbidity index <0.001
 040,254 (51.2)36,737 (47.5)35,754 (45.3)32,843 (41.5)
 121,967 (27.9)21,470 (27.8)21,568 (27.3)21,147 (26.7)
 29434 (12.0)10,521 (13.6)11,105 (14.1)11,800 (14.9)
 ≥36958 (8.9)8617 (11.1)10,528 (13.3)13,438 (17.0)
Health screening
 Body mass index (kg/m2)23.1 (2.6)23.8 (2.7)24.3 (2.7)24.8 (2.6)<0.001
 Systolic blood pressure (mmHg)121.6 (14.8)124.5 (15.0)126.4 (15.0)128.6 (15.1)<0.001
 Diastolic blood pressure (mmHg)75.4 (9.7)77.1 (9.8)78.2 (9.7)79.6 (9.9)<0.001
 Fasting blood glucose (mg/dL)90.9 (11.4)95.8 (13.9)100.5 (17.7)114.2 (32.9)<0.001
 Total cholesterol (mg/dL)189.9 (34.0)198.2 (35.4)203.6 (36.9)209.5 (39.2)<0.001
 Triglyceride (mg/dL)67.7 (14.4)101.9 (16.3)140.3 (24.9)224.8 (67.4)<0.001
 HDL cholesterol (mg/dL)58.7 (12.9)55.4 (12.6)52.2 (12.1)49.0 (15.3)<0.001
 LDL cholesterol (mg/dL)117.4 (33.3)122.4 (35.9)123.3 (36.2)116.3 (40.3)<0.001
 Hemoglobin (g/dL)13.5 (1.4)13.7 (1.5)13.9 (1.5)14.2 (1.5)<0.001
 Glomerular filtration rate (mL/min/1.73 m2)80.3 (31.4)78.7 (28.6)78.0 (31.5)77.3 (31.9)<0.001
 Current smoker (%)9172 (11.7)11,452 (14.8)13,996 (17.7)18,125 (22.9)<0.001
 Alcohol consumption (%)27,427 (34.9)28,735 (37.2)31,686 (40.1)37,154 (46.9)<0.001
 Regular exercise (%)4156 (5.3)3683 (4.8)3521 (4.5)3207 (4.0)<0.001
 TyG index8.0 ± 0.28.5 ± 0.18.8 ± 0.19.4 ± 0.3<0.001
Table 2. Hazard ratios and 95% confidence intervals for the incidence of colorectal cancer according to the TyG index, TG/HDL ratio, and METS-IR.
Subjects
(n = 314,141)
EventsFollow-Up Duration (Person-Years)Incidence Rate (per 1000 Person-Years)Hazard Ratios (95% Confidence Intervals)
Crudep-ValueAdjusted *p-Value
TyG index
Q1
(n = 78,613)
1266746,8241.701.00
(reference)
1.00
(reference)
Q2
(n = 77,345)
1468727,0432.021.18
(1.10–1.27)
<0.0011.08
(1.00–1.16)
0.05
Q3
(n = 78,955)
1606742,1772.161.27
(1.18–1.37)
<0.0011.10
(1.02–1.19)
0.01
Q4
(n = 79,228)
1772744,7432.381.40
(1.31–1.51)
<0.0011.16
(1.07–1.25)
<0.001
TG/HDL-C ratio
Q1
(n = 78,885)
1287749,4081.721.00
(reference)
1.00
(reference)
Q2
(n = 78,206)
1497735,1362.041.18
(1.09–1.27)
<0.0011.07
(0.99–1.15)
0.09
Q3
(n = 78,444)
1642737,3742.231.29
(1.20–1.39)
<0.0011.11
(1.03–1.20)
0.005
Q4
(n = 78,606)
1686738,8962.281.32
(1.23–1.42)
<0.0011.12
(1.03–1.21)
0.006
METS-IR
Q1
(n = 78,631)
1367739,1311.851.00
(reference)
1.00
(reference)
Q2
(n = 78,542)
1485746,1491.991.08
(1.00–1.16)
0.041.05
(0.97–1.13)
0.24
Q3
(n = 78,498)
1588745,7312.131.15
(1.07–1.24)
<0.0011.07
(0.99–1.15)
0.07
Q4
(n = 78,470)
1672745,4652.241.22
(1.13–1.31)
<0.0011.10
(1.02–1.18)
0.02
* The model was adjusted for age, sex, income level, residence, hypertension, diabetes, dyslipidemia, Charlson comorbidity index, body mass index, hemoglobin level, glomerular filtration rate, smoking, alcohol consumption, and regular exercise status. In the METS-IR, the model was adjusted as for the aforementioned model except for the body mass index.
Disclaimer/Publisher’s Note: The statements, opinions and data contained in all publications are solely those of the individual author(s) and contributor(s) and not of MDPI and/or the editor(s). MDPI and/or the editor(s) disclaim responsibility for any injury to people or property resulting from any ideas, methods, instructions or products referred to in the content.

