

Comparison between Conventional and Digital Impressions for Determining Axes and Distances of Three Implants in Straight and Curved Lines: An In Vitro Study
 , ,
, ,  ,
, 
Abstract
:1. Introduction
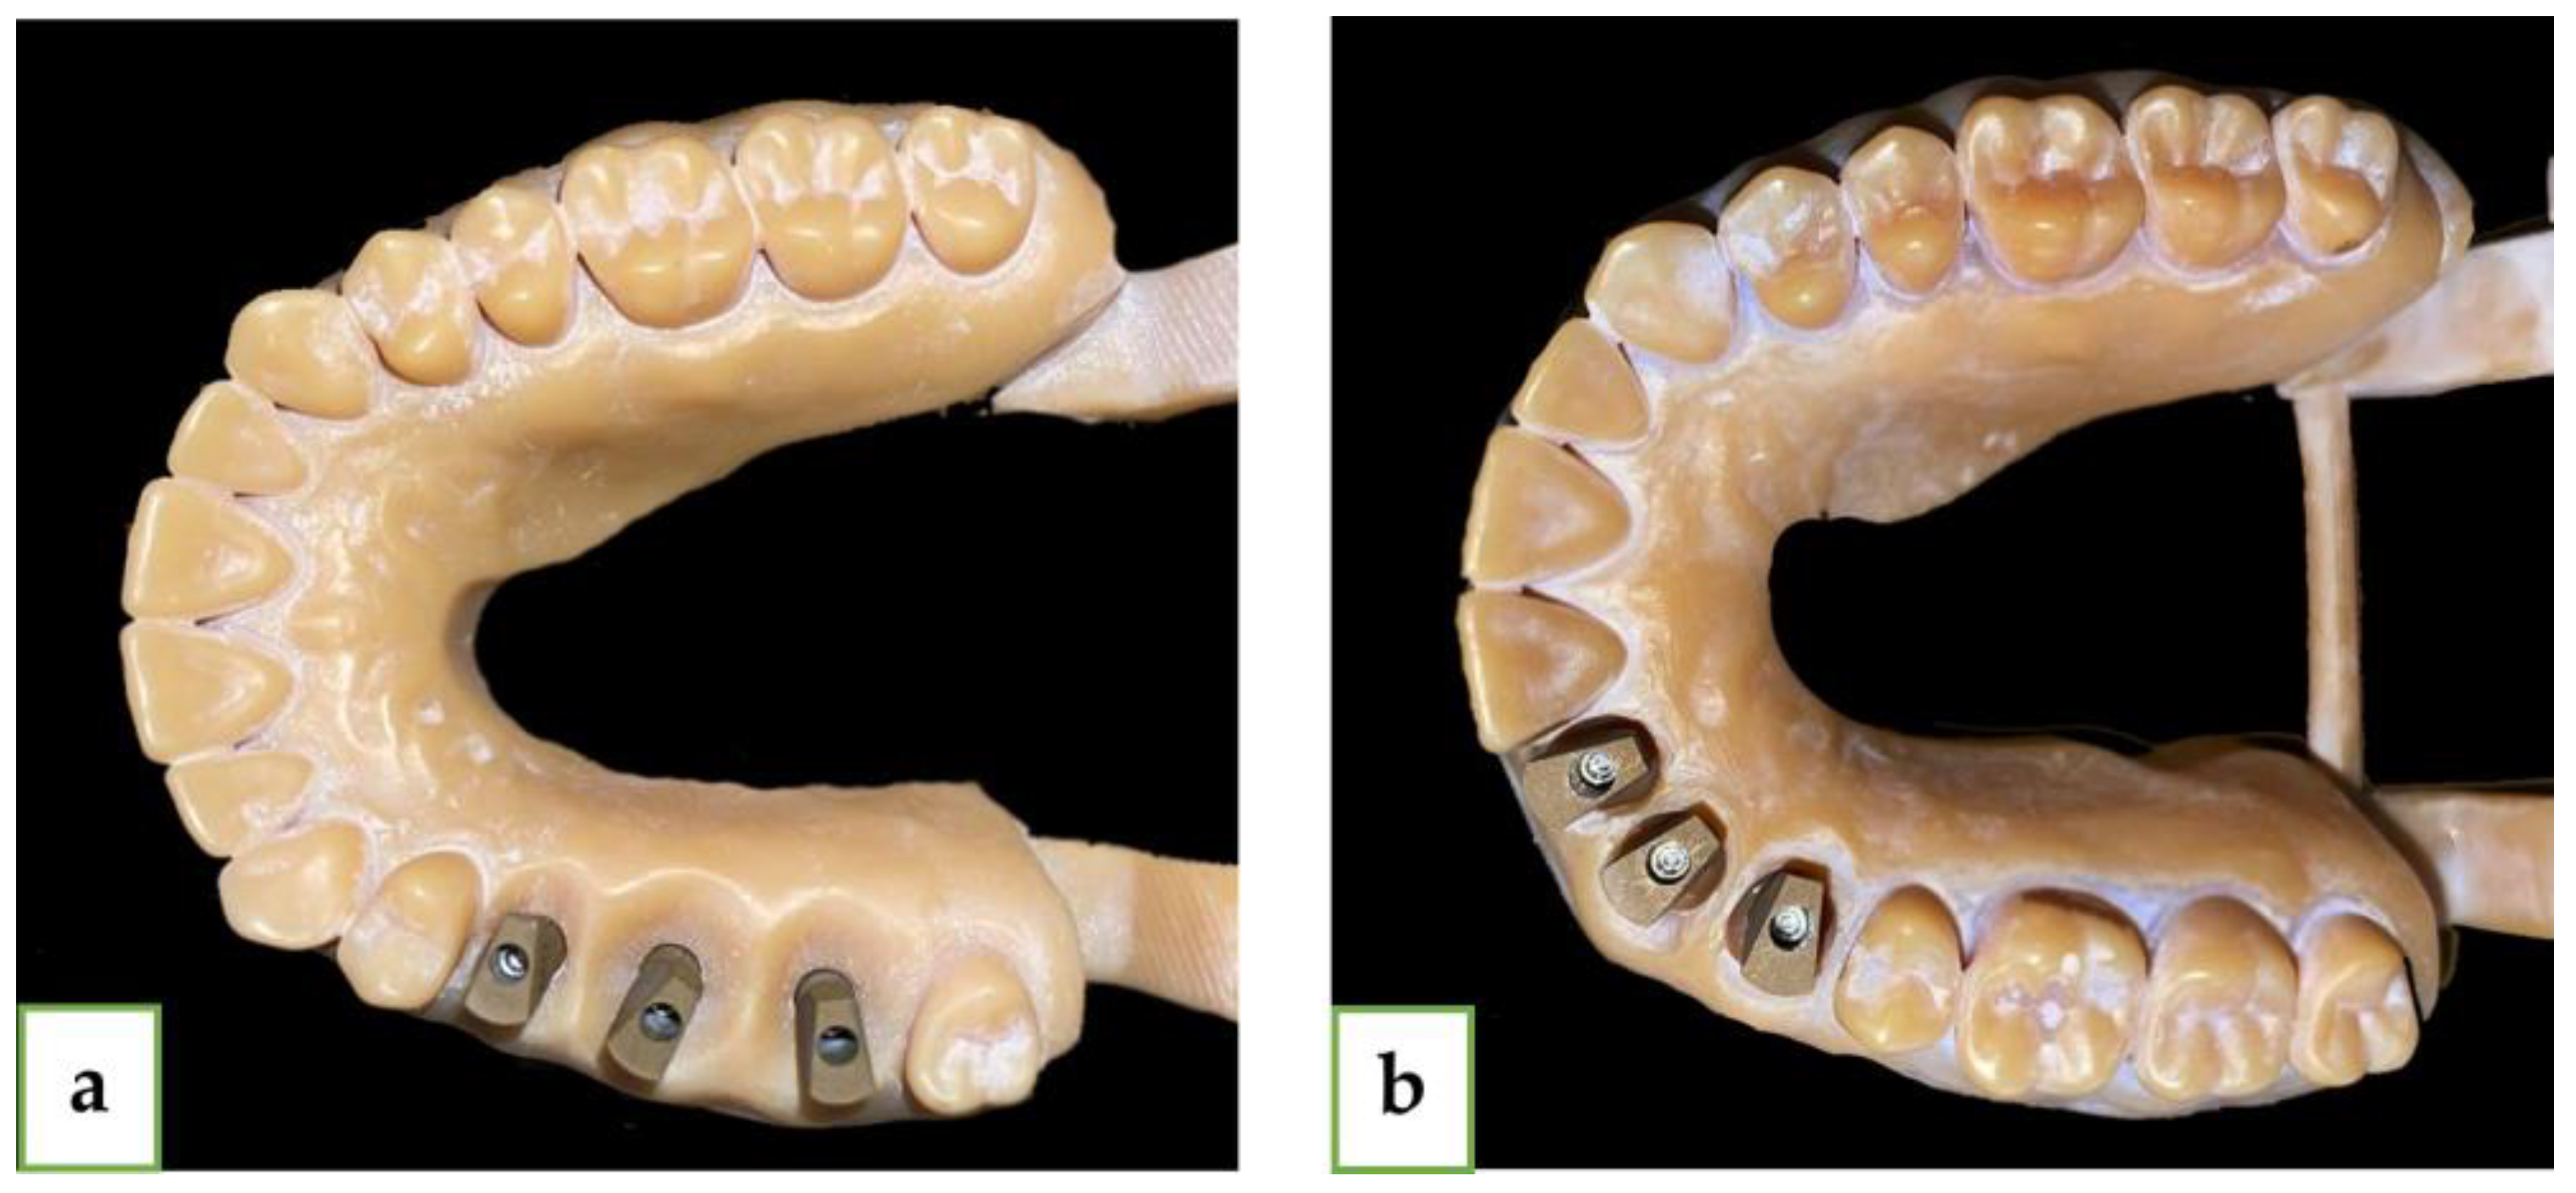
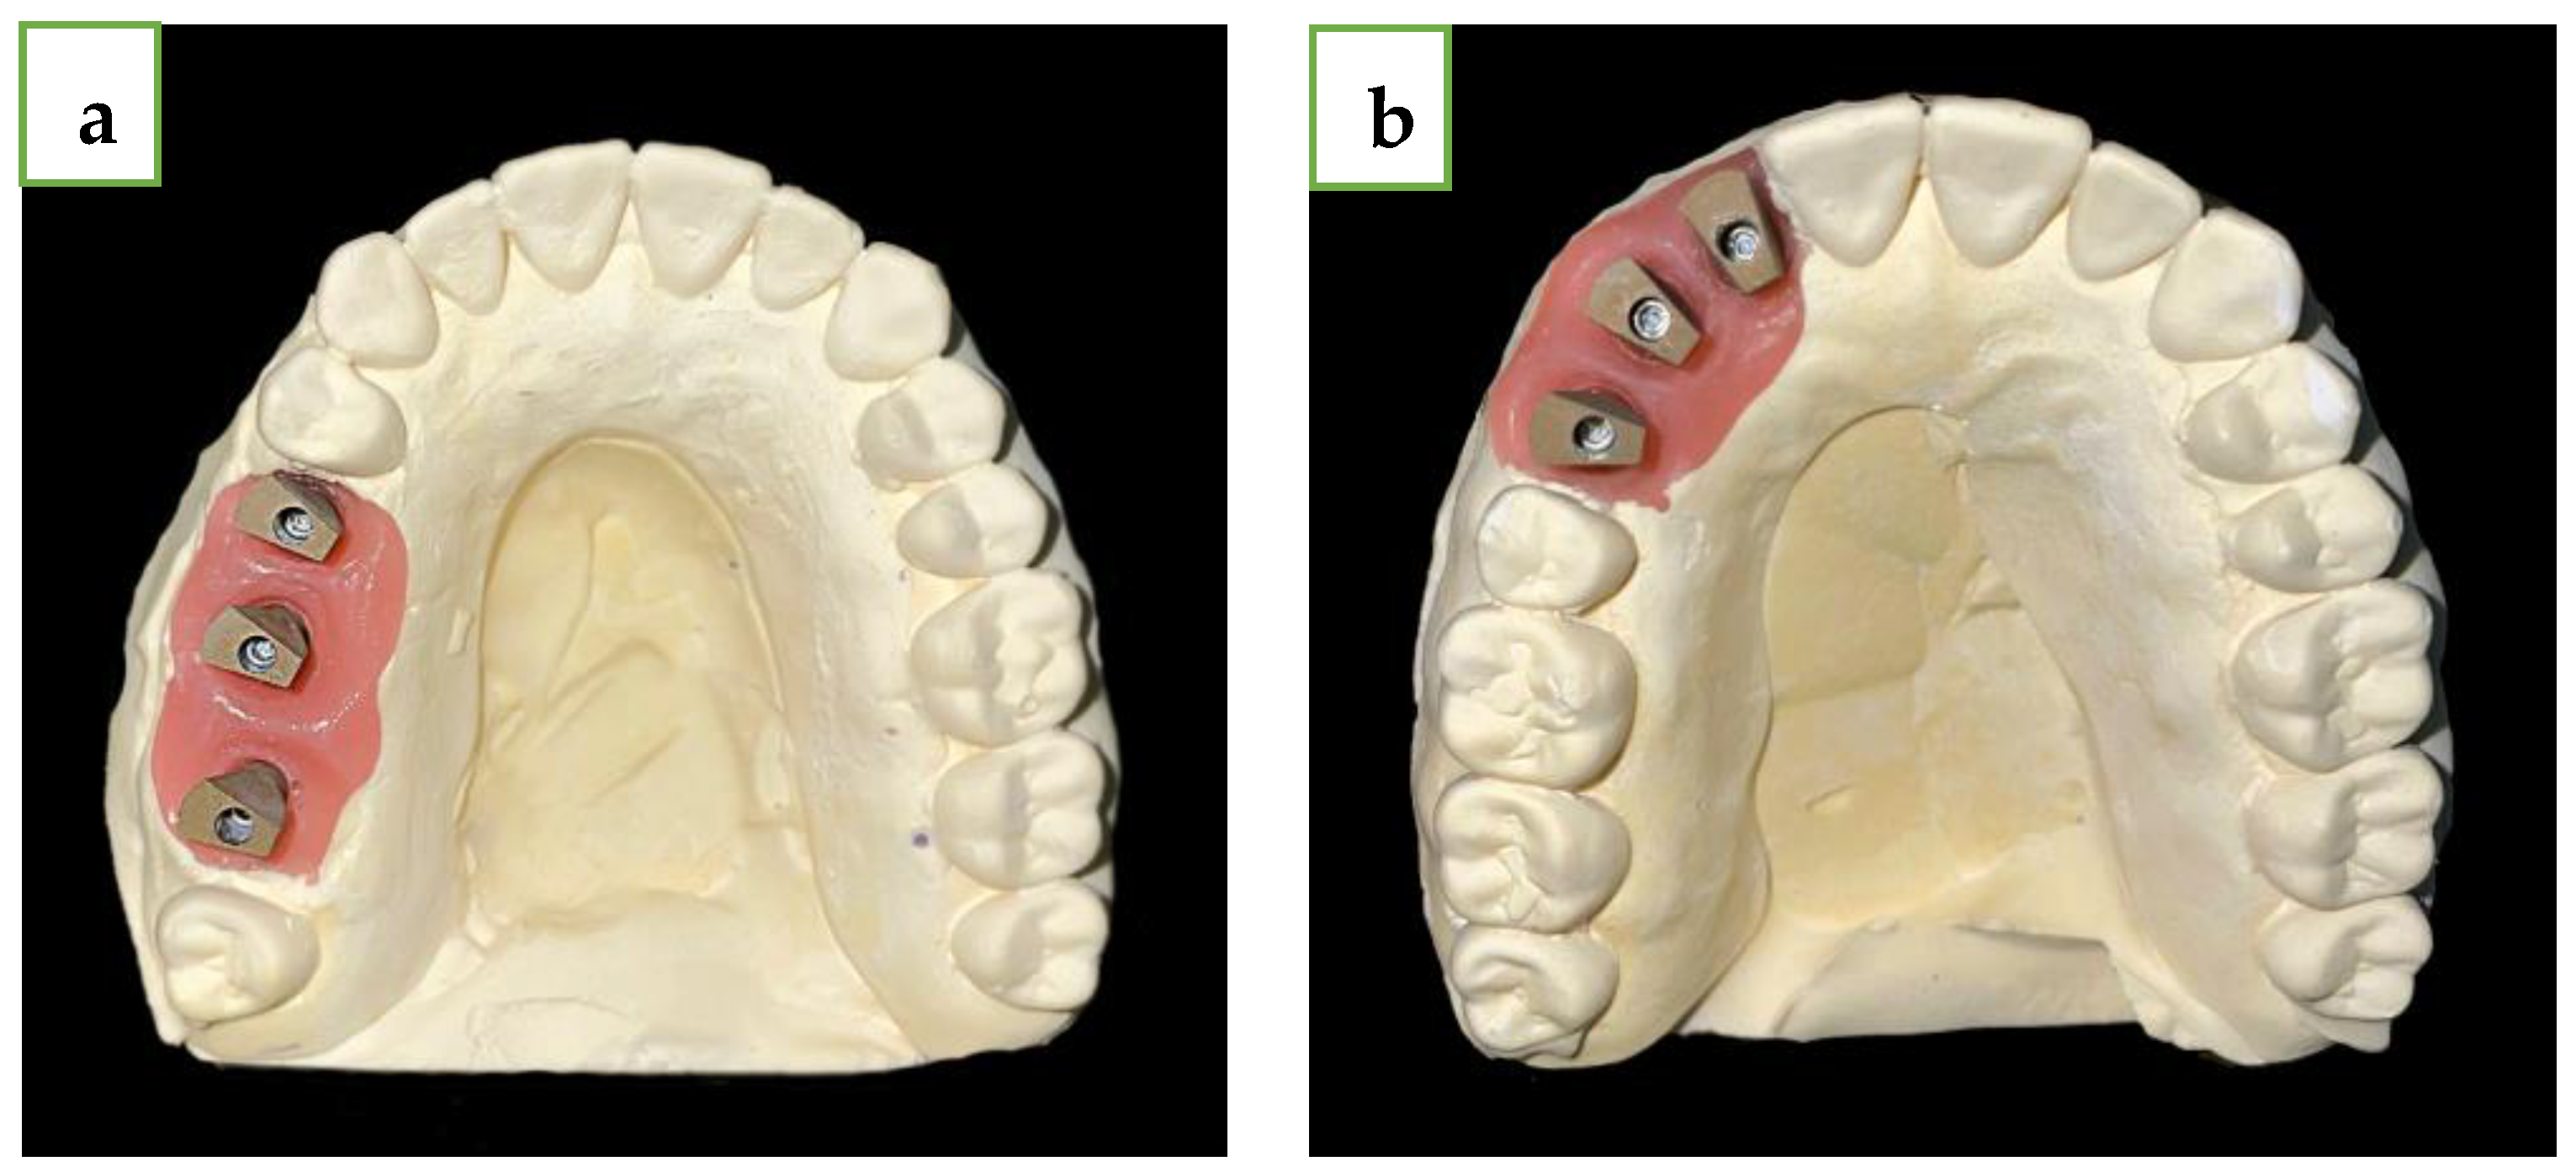
2. Materials and Methods
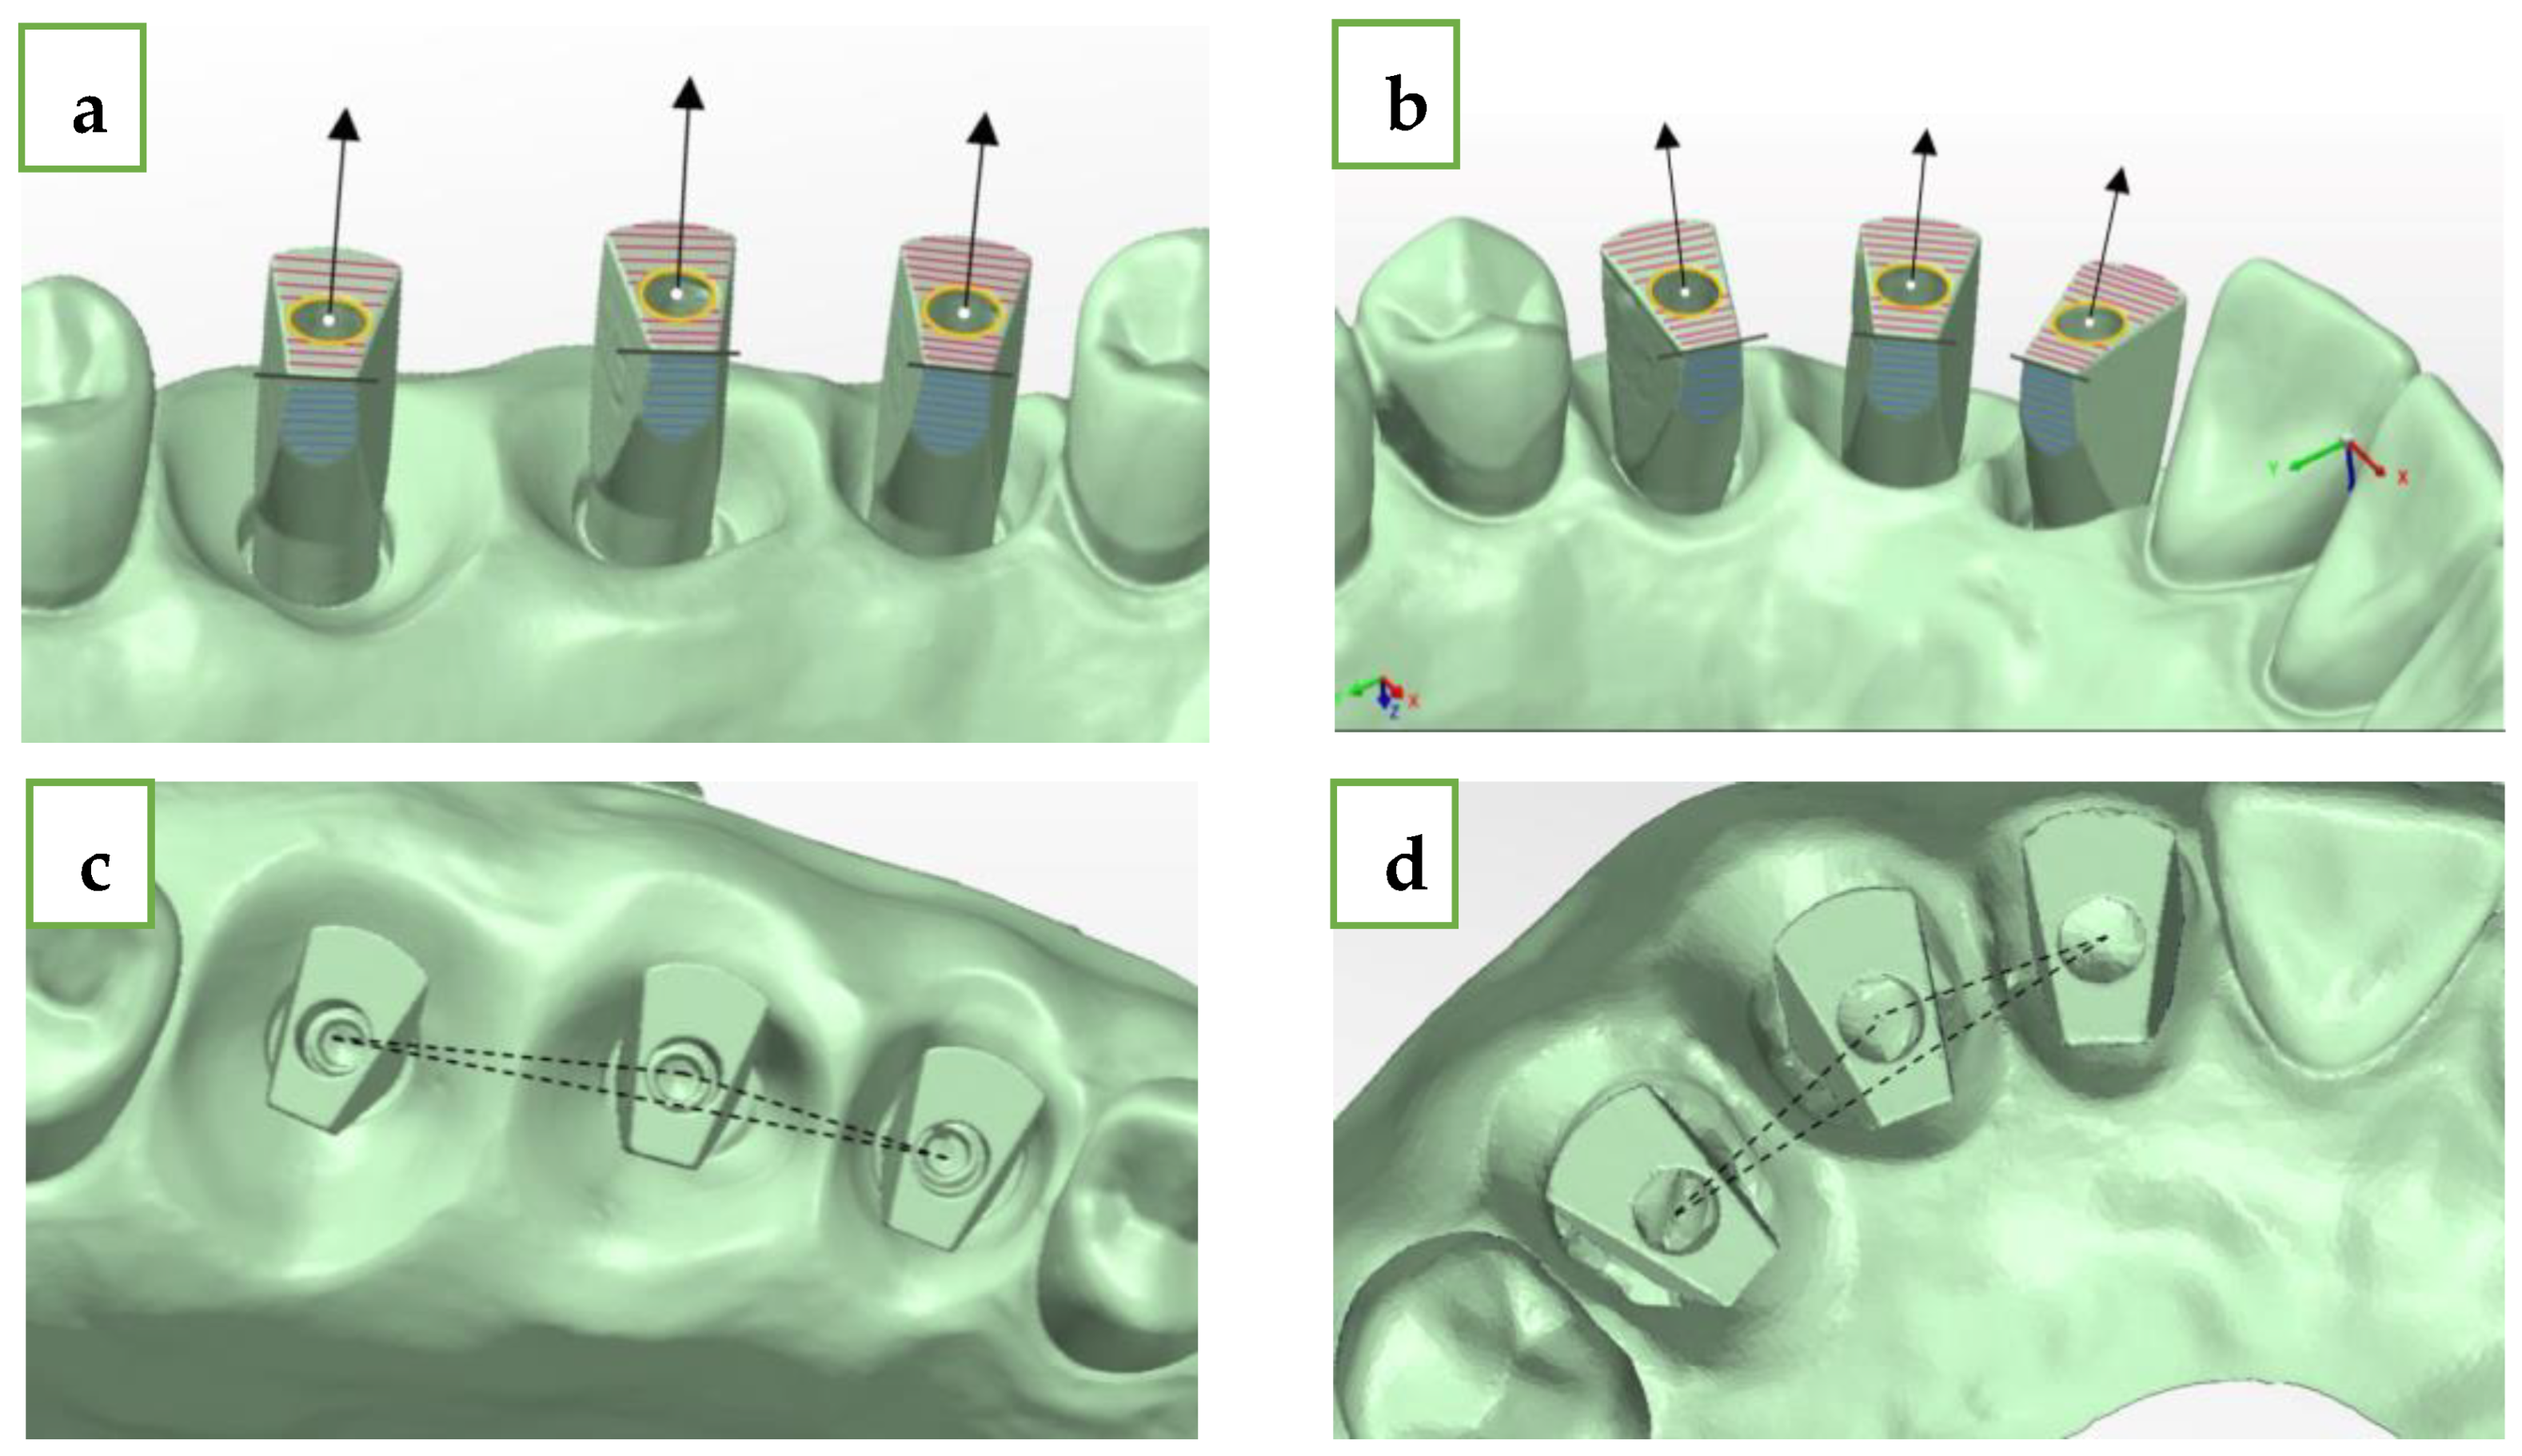
- Upper plane (red plane)—top surface of the MIS ISB, which was best-fitted;
- Cylinder (yellow circle)—inner cylinder of MIS ISB, which was best-fitted;
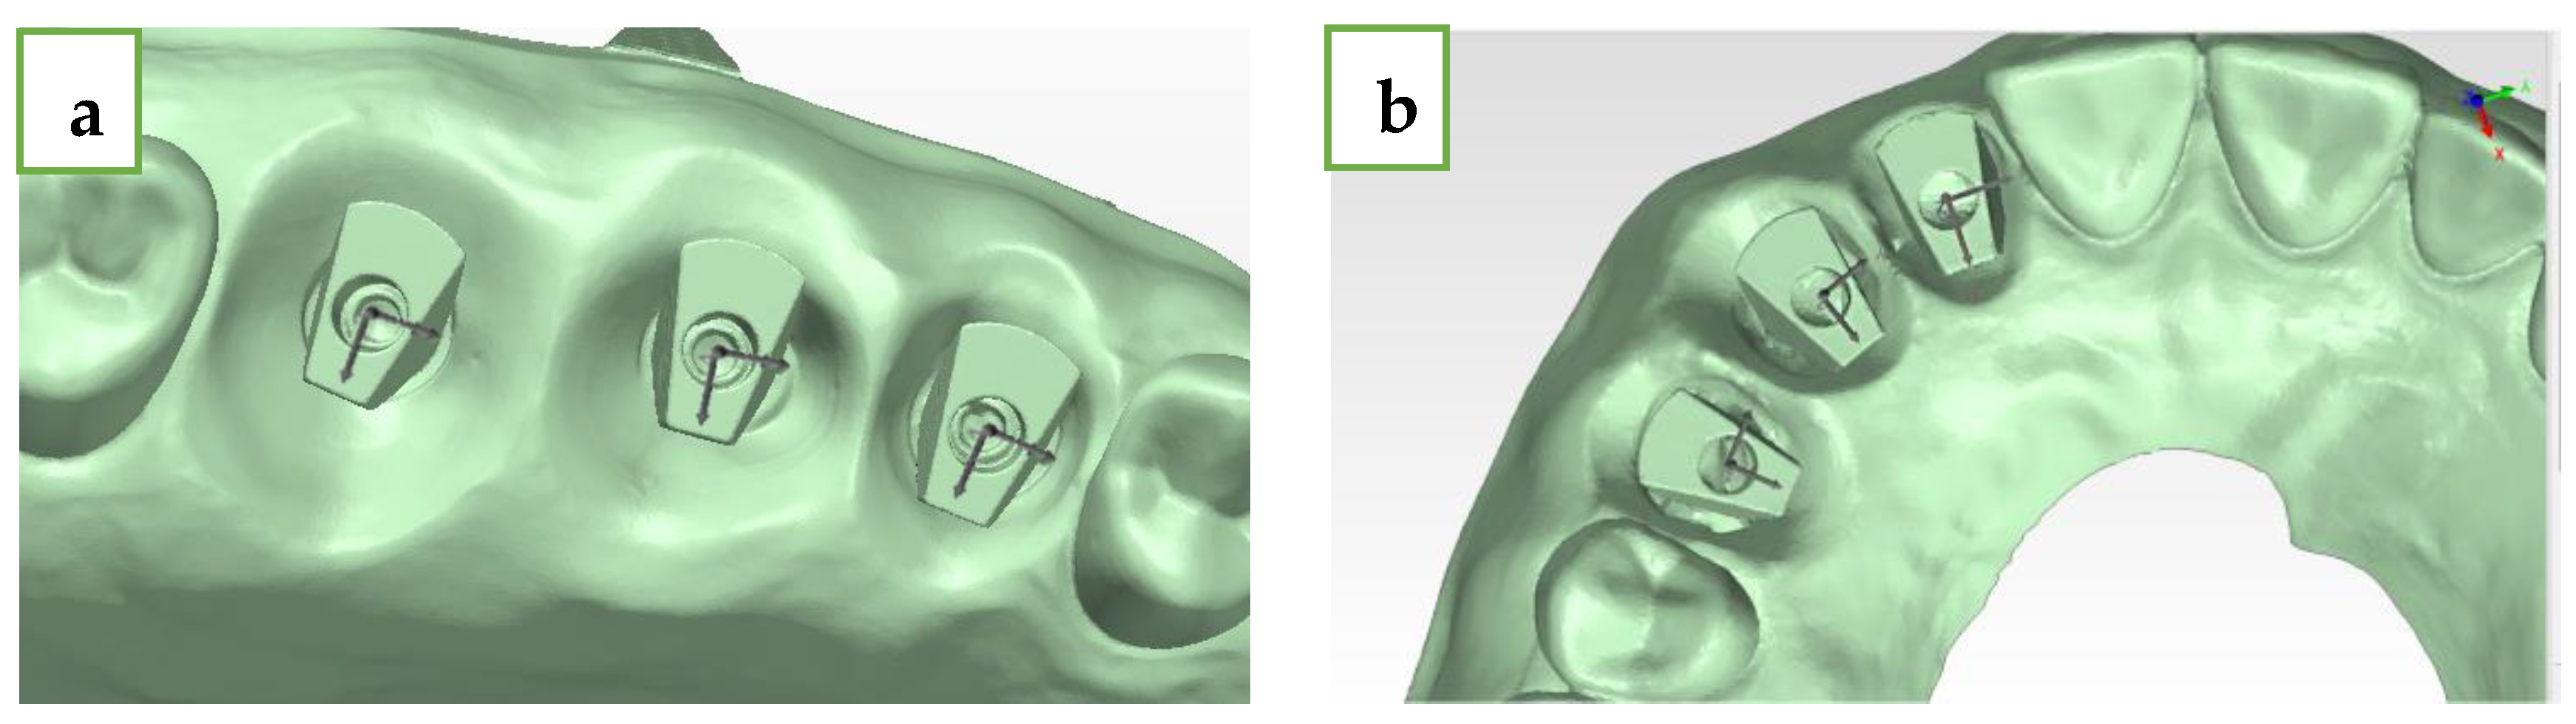
- Axis (black row)—longitudinal axis of MIS ISB, which was best-fitted;
- Central point (white dot)—this point is defined as the intersection between the cylinder and the upper plane of the MIS ISB;
- Palatal side plane (blue plane)—palatal straight plane of the MIS ISB, which was best-fitted;
- Sideline (black line)—this line is defined as the intersection between the upper plane and the palatal side plane for each MIS ISB;
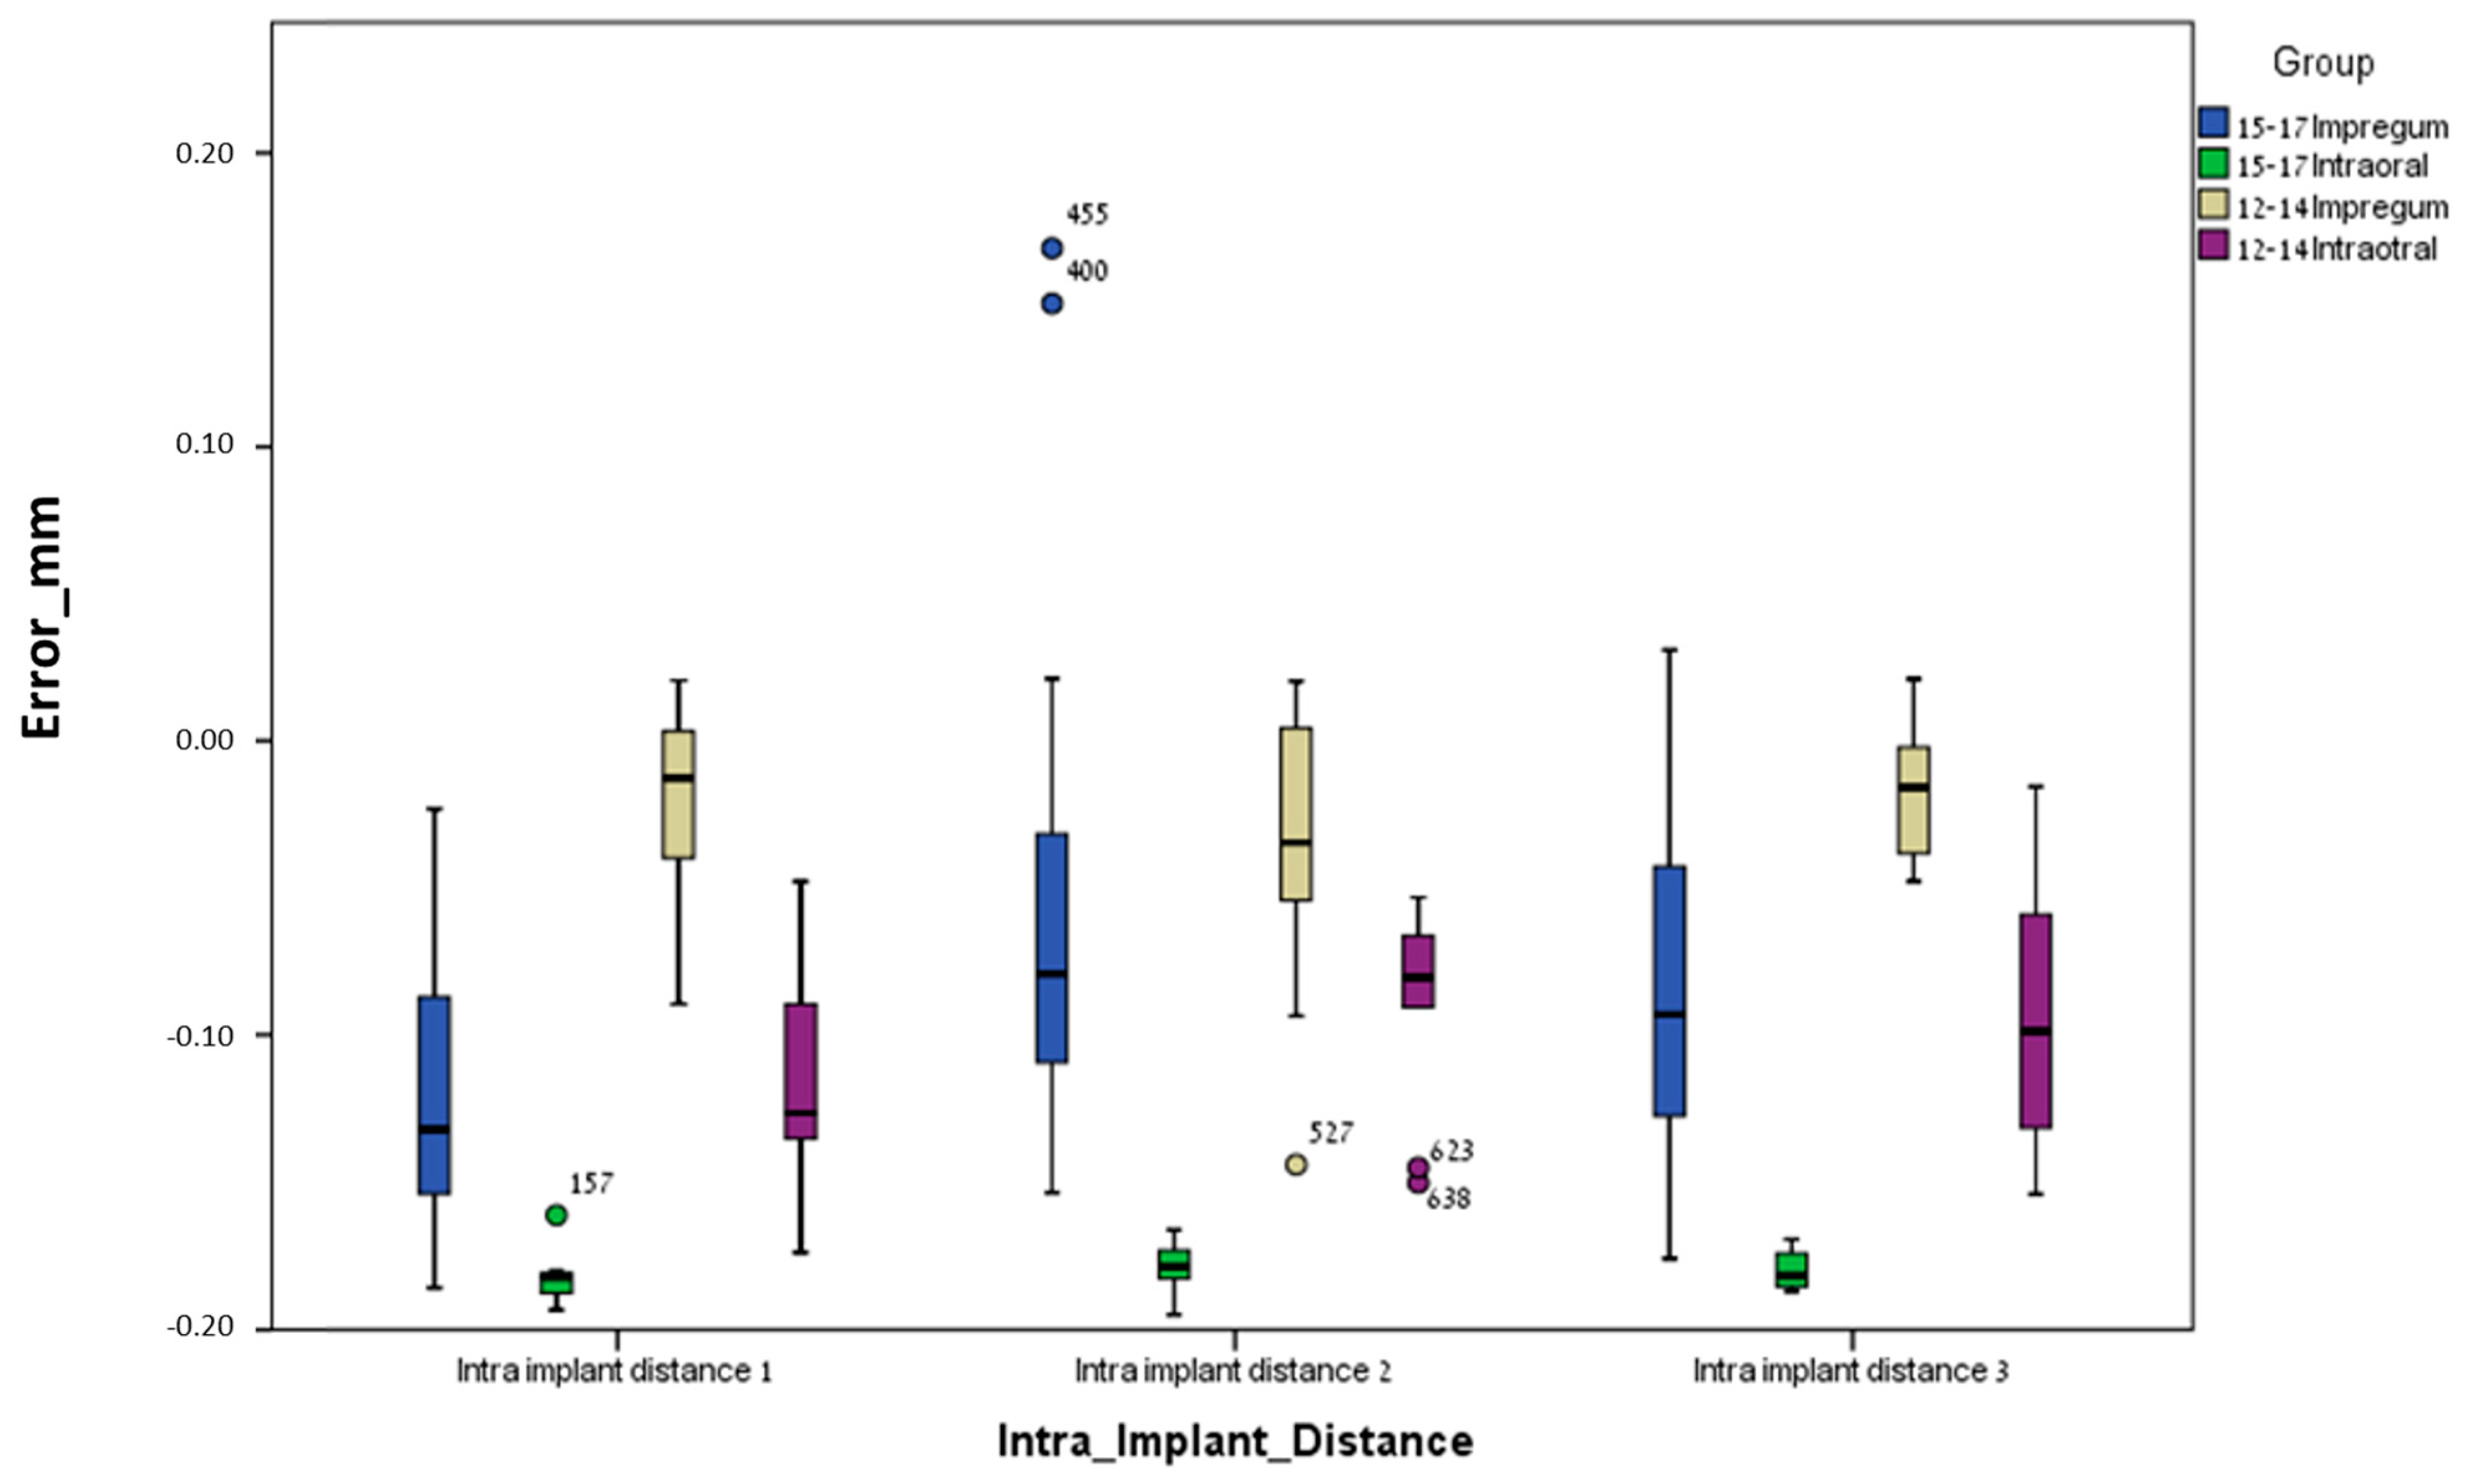
- Inter-implant distance (black intermitted line)—the distance between two central points: distance 1–2 (#15-#16 and #12-#13), distance 2–3 (#16-#17 and #13-#14), and distance 1–3 (#15-#17 and #12-#14). The deviation of each distance from the reference model was calculated by subtraction between the two results.
- h.
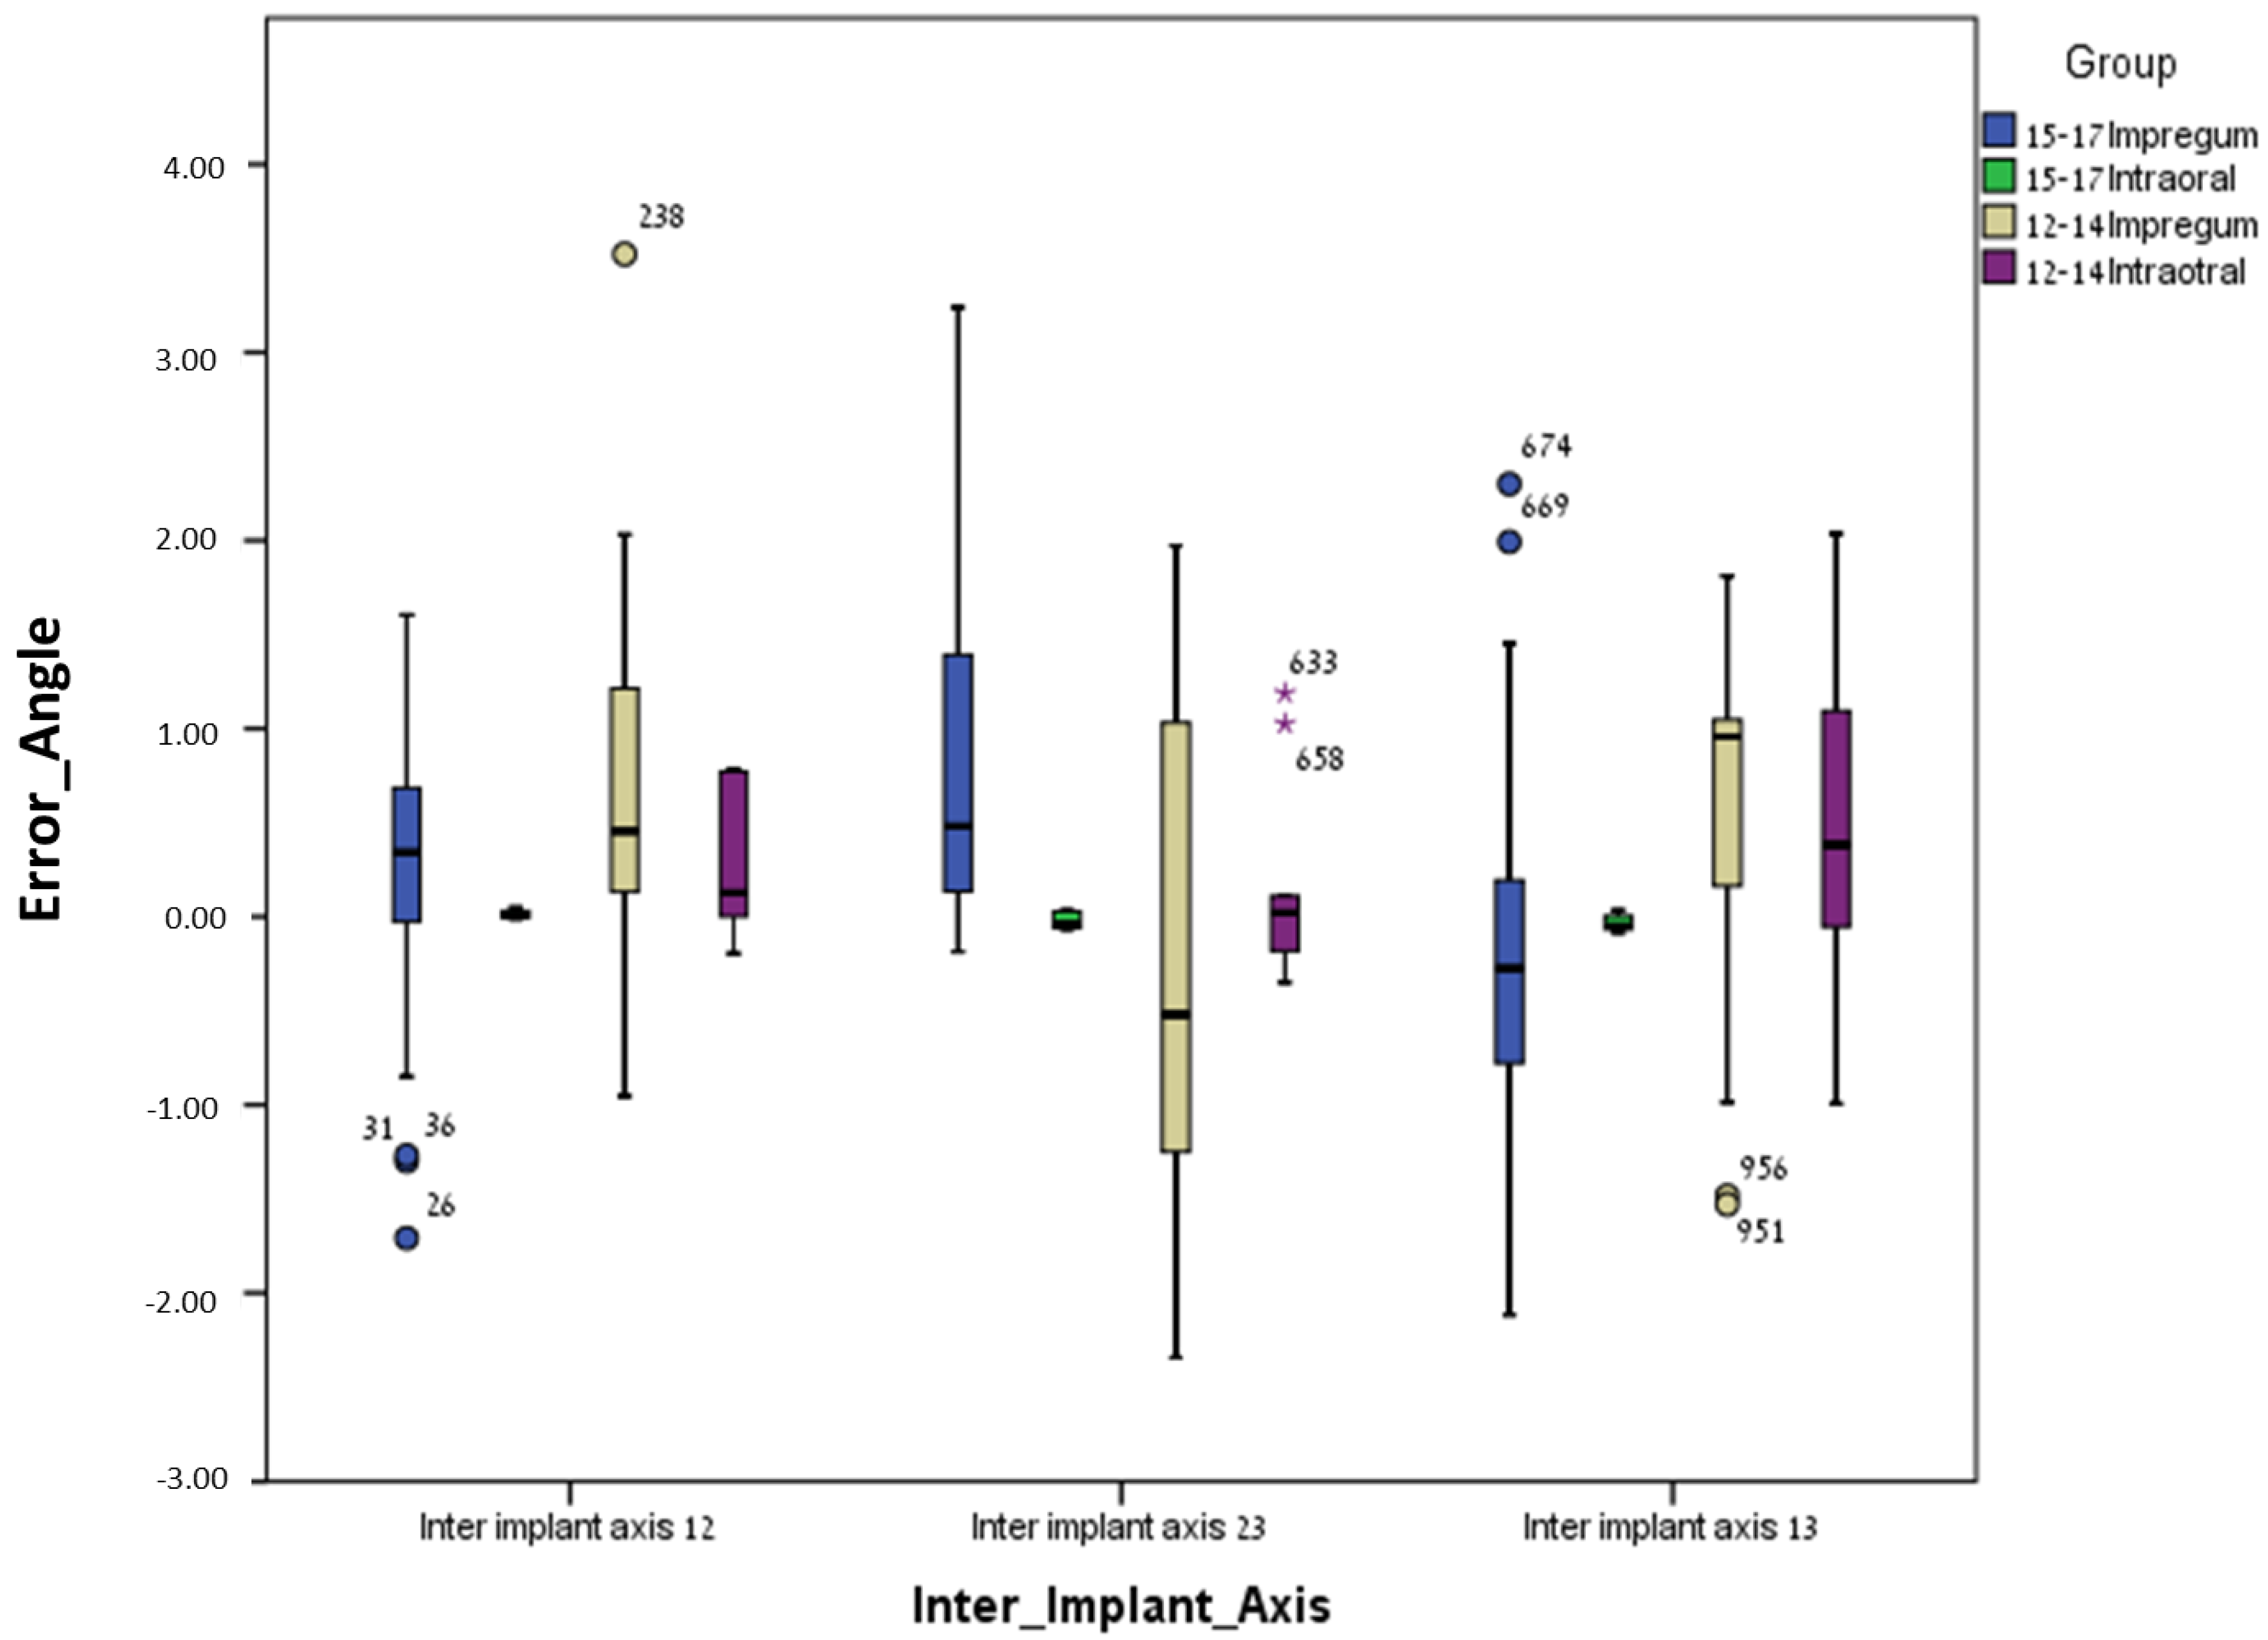
- Delta axis 1–2 (green)—defined as the angle formed between the axis of the mesial (#15 and #12) and middle (#16 and #13) MIS ISB;
- i.
- Delta axis 2–3 (orange)—defined as the angle formed between the axis of the middle (#16 and #13) and distal (#17 and #14) MIS ISB;
- j.
- Delta axis 1–3 (blue)—defined as the angle formed between the axis of the mesial (#15 and #12) and distal (#17 and #14) MIS ISB.
- X-axis (red)—buccal–palatal plane; buccal is the positive direction;
- Y-axis (green)—mesial–distal plane; distal is the positive direction;
- Z-axis (blue)—occlusal–gingival plane; occlusal is the positive direction.
3. Results
3.1. Between Groups
3.2. Within Groups
4. Discussion
5. Conclusions
Author Contributions
Funding
Institutional Review Board Statement
Informed Consent Statement
Data Availability Statement
Conflicts of Interest
References
- Ferro, K.J.; Morgano, S.M.; Driscoll, C.F.; Freilich, M.A.; Guckes, A.D.; Knoernschild, K.L.; McGarry, T.J.; Photography, N.A.; Twain, M. The glossary of prosthodontic terms. J. Prosthet. Dent. 2005, 94, 30. [Google Scholar]
- Marques, S.; Ribeiro, P.; Falcão, C.; Lemos, B.F.; Ríos-Carrasco, B.; Ríos-Santos, J.V.; Herrero-Climent, M. Digital Impressions in Implant Dentistry: A Literature Review. Int. J. Environ. Res. Public Health 2021, 18, 1020. [Google Scholar] [CrossRef]
- Lee, H.; So, J.S.; Hochstedler, J.L.; Ercoli, C. The accuracy of implant impressions: A systematic review. J. Prosthet. Dent. 2008, 100, 285–291. [Google Scholar] [CrossRef] [PubMed]
- Ahlholm, P.; Sipilä, K.; Vallittu, P.; Jakonen, M.; Kotiranta, U. Digital Versus Conventional Impressions in Fixed Prosthodontics: A Review. J. Prosthodont. 2018, 27, 35–41. [Google Scholar] [CrossRef] [PubMed]
- lbanchez-González, M.I.; Brinkmann, J.C.-B.; Peláez-Rico, J.; López-Suárez, C.; Rodríguez-Alonso, V.; Suárez-García, M.J. Accuracy of Digital Dental Implants Impression Taking with Intraoral Scanners Compared with Conventional Impression Techniques: A Systematic Review of In Vitro Studies. Int. J. Environ. Res. Public Health 2022, 19, 2026. [Google Scholar] [CrossRef] [PubMed]
- Johnson, G.H.; Mancl, L.A.; Schwedhelm, E.R.; Verhoef, D.R.; Lepe, X. Clinical trial investigating success rates for polyether and vinyl polysiloxane impressions made with full-arch and dual-arch plastic trays. J. Prosthet. Dent. 2010, 103, 13–22. [Google Scholar] [CrossRef] [PubMed]
- Walker, M.P.; Petrie, C.S.; Haj-Ali, R.; Spencer, P.; Dumas, C.; Williams, K. Moisture Effect on Polyether and Polyvinylsiloxane Dimensional Accuracy and Detail Reproduction. J. Prosthodont. 2005, 14, 158–163. [Google Scholar] [CrossRef] [PubMed]
- Choi, J.-W.; Ahn, J.-J.; Son, K.; Huh, J.-B. Three-Dimensional Evaluation on Accuracy of Conventional and Milled Gypsum Models and 3D Printed Photopolymer Models. Materials 2019, 12, 3499. [Google Scholar] [CrossRef]
- Kim, R.J.Y.; Benic, G.I.; Park, J.M. Trueness of ten intraoral scanners in determining the positions of simulated implant scan bodies. Sci. Rep. 2021, 11, 2606. [Google Scholar] [CrossRef]
- D’haese, R.; Vrombaut, T.; Roeykens, H.; Vandeweghe, S. In Vitro Accuracy of Digital and Conventional Impressions for Full-Arch Implant-Supported Prostheses. J. Clin. Med. 2022, 11, 594. [Google Scholar] [CrossRef]
- Keul, C.; Güth, J.-F. Accuracy of full-arch digital impressions: An in vitro and in vivo comparison. Clin. Oral Investig. 2020, 24, 735–745. [Google Scholar] [CrossRef] [PubMed]
- Ender, A.; Zimmermann, M.; Mehl, A. Accuracy of complete- and partial-arch impressions of actual intraoral scanning systemsin vitro. Int. J. Comput. Dent. 2019, 22, 11–19. [Google Scholar] [PubMed]
- Çakmak, G.; Yilmaz, H.; Treviño, A.; Kökat, A.M.; Yilmaz, B. The effect of scanner type and scan body position on the accuracy of complete-arch digital implant scans. Clin. Implant Dent. Relat. Res. 2020, 22, 533–541. [Google Scholar] [CrossRef] [PubMed]
- Buzayan, M.M.; Yunus, N.B. Passive Fit in Screw Retained Multi-unit Implant Prosthesis Understanding and Achieving: A Review of the Literature. J. Indian Prosthodont. Soc. 2014, 14, 16–23. [Google Scholar] [CrossRef] [PubMed]
- Mandelli, F.; Gherlone, E.; Gastaldi, G.; Ferrari, M. Evaluation of the accuracy of extraoral laboratory scanners with a single-tooth abutment model: A 3D analysis. J. Prosthodont. Res. 2017, 61, 363–370. [Google Scholar] [CrossRef] [PubMed]
- ISO 5725-1; Accuracy (Trueness and Precision) of Measurement Methods and Results—Part 1: General Principles and Definitions. International Standard ISO: Geneva, Switzerland, 1998.
- Gomez-Polo, M.; Ortega, R.; Gomez-Polo, C.; Celemin, A.; Highsmith, J.D.R. Factors Affecting the Decision to Use Cemented or Screw-Retained Fixed Implant-Supported Prostheses: A Critical Review. Int. J. Prosthodont. 2018, 31, 43. [Google Scholar] [CrossRef] [PubMed]
- Roig, E.; Roig, M.; Garza, L.C.; Costa, S.; Maia, P.; Espona, J. Fit of complete-arch implant-supported prostheses produced from an intraoral scan by using an auxiliary device and from an elastomeric impression: A pilot clinical trial. J. Prosthet. Dent. 2022, 128, 404–414. [Google Scholar] [CrossRef] [PubMed]
- Nwaneshiudu, A.; Kuschal, C.; Sakamoto, F.H.; Rox Anderson, R.; Schwarzenberger, K.; Young, R.C. Introduction to confocal microscopy. J. Investig. Dermatol. 2012, 132, 1–5. [Google Scholar] [CrossRef] [PubMed]
- Reis, I.N.R.D.; Chamma-Wedemann, C.N.; Silva, I.A.O.; Spin-Neto, R.; Sesma, N.; da Silva, E.V.F. Clinical outcomes of digital scans versus conventional impressions for implant-supported fixed complete arch prostheses: A systematic review and meta-analysis. J. Prosthet. Dent. 2023, in press. [CrossRef]
- Kong, L.; Li, Y.; Liu, Z. Digital versus conventional full-arch impressions in linear and 3D accuracy: A systematic review and meta-analysis of in vivo studies. Clin. Oral Investig. 2022, 26, 5625–5642. [Google Scholar] [CrossRef]
- Lyu, M.; Di, P.; Lin, Y.; Jiang, X. Accuracy of impressions for multiple implants: A comparative study of digital and conventional techniques. J. Prosthet. Dent. 2022, 128, 1017–1023. [Google Scholar] [CrossRef] [PubMed]
- Li, J.; Moon, H.S.; Kim, J.H.; Yoon, H.I.; Oh, K.C. Accuracy of impression-making methods in edentulous arches: An in vitro study encompassing conventional and digital methods. J. Prosthet. Dent. 2022, 128, 479–486. [Google Scholar] [CrossRef] [PubMed]
- Nagarkar, S.R.; Perdigão, J.; Seong, W.J.; Theis-Mahon, N. Digital versus conventional impressions for full-coverage restorations: A systematic review and meta-analysis. J. Am. Dent. Assoc. 2018, 149, 139–147.e1. [Google Scholar] [CrossRef] [PubMed]
- Abdel-Azim, T.; Zandinejad, A.; Elathamna, E.; Lin, W.; Morton, D. The influence of digital fabrication options on the accuracy of dental implant-based single units and complete-arch frameworks. Int. J. Oral Maxillofac. Implant. 2014, 29, 1281–1288. [Google Scholar] [CrossRef] [PubMed]
- Almeida e Silva, J.S.; Erdelt, K.; Edelhoff, D.; Araújo, É.; Stimmelmayr, M.; Vieira, L.C.; Güth, J.F. Marginal and internal fit of four-unit zirconia fixed dental prostheses based on digital and conventional impression techniques. Clin. Oral Investig. 2014, 18, 515–523. [Google Scholar] [CrossRef] [PubMed]
- Ender, A.; Zimmermann, M.; Attin, T.; Mehl, A. In vivo precision of conventional and digital methods for obtaining quadrant dental impressions. Clin. Oral Investig. 2016, 20, 1495–1504. [Google Scholar] [CrossRef] [PubMed]
- Hashemi, A.M.; Hashemi, H.M.; Siadat, H.; Shamshiri, A.; Afrashtehfar, K.I.; Alikhasi, M. Fully Digital versus Conventional Workflows for Fabricating Posterior Three-Unit Implant-Supported Reconstructions: A Prospective Crossover Clinical Trial. Int. J. Environ. Res. Public Health 2022, 19, 11456. [Google Scholar] [CrossRef]
- Alsharbaty, M.H.M.; Alikhasi, M.; Zarrati, S.; Shamshiri, A.R. A Clinical Comparative Study of 3-Dimensional Accuracy between Digital and Conventional Implant Impression Techniques. J. Prosthodont. 2019, 28, e902–e908, Erratum in J. Prosthodont. 2020, 29, 277. [Google Scholar] [CrossRef]
- Marghalani, A.; Weber, H.P.; Finkelman, M.; Kudara, Y.; El Rafie, K.; Papaspyridakos, P. Digital versus conventional implant impressions for partially edentulous arches: An evaluation of accuracy. J. Prosthet. Dent. 2018, 119, 574–579. [Google Scholar] [CrossRef]
- Alshawaf, B.; Weber, H.P.; Finkelman, M.; El Rafie, K.; Kudara, Y.; Papaspyridakos, P. Accuracy of printed casts generated from digital implant impressions versus stone casts from conventional implant impressions: A comparative in vitro study. Clin. Oral Implant. Res. 2018, 29, 835–842. [Google Scholar] [CrossRef]
- Teo, J.W.; Tan, K.B.; Nicholls, J.I.; Wong, K.M.; Uy, J. Three-dimensional accuracy of plastic transfer impression copings for three implant systems. Int. J. Oral Maxillofac. Implant. 2014, 29, 577–584. [Google Scholar] [CrossRef]
- Shely, A.; Lugassy, D.; Rosner, O.; Zanziper, E.; Nissan, J.; Rachmiel, S.; Khoury, Y.; Ben-Izhack, G. The Influence of Laboratory Scanner versus Intra-Oral Scanner on Determining Axes and Distances between Three Implants in a Straight Line by Using Two Different Intraoral Scan Bodies: A Pilot In Vitro Study. J. Clin. Med. 2023, 12, 6644. [Google Scholar] [CrossRef] [PubMed]
- Flügge, T.V.; Att, W.; Metzger, M.C.; Nelson, K. Precision of Dental Implant Digitization Using Intraoral Scanners. Int. J. Prosthodont. 2016, 29, 277–283. [Google Scholar] [CrossRef]
- Nedelcu, R.; Olsson, P.; Thulin, M.; Nyström, I.; Thor, A. In vivo trueness and precision of full-arch implant scans using intraoral scanners with three different acquisition protocols. J. Dent. 2023, 128, 104308. [Google Scholar] [CrossRef] [PubMed]
- Mizumoto, R.M.; Yilmaz, B.; McGlumphy, E.A., Jr.; Seidt, J.; Johnston, W.M. Accuracy of different digital scanning techniques and scan bodies for complete-arch implant-supported prostheses. J. Prosthet. Dent. 2020, 123, 96–104. [Google Scholar] [CrossRef]
- Iturrate, M.; Eguiraun, H.; Solaberrieta, E. Accuracy of digital impressions for implant-supported complete-arch prosthesis, using an auxiliary geometry part—An in vitro study. Clin. Oral Implant. Res. 2019, 30, 1250–1258. [Google Scholar] [CrossRef]
- El Osta, N.; Drancourt, N.; Auduc, C.; Veyrune, J.L.; Nicolas, E. Accuracy of conventional impressions and digital scans for implant-supported fixed prostheses in maxillary free-ended partial edentulism: An in vitro study. J. Dent. 2024, 143, 104892. [Google Scholar] [CrossRef] [PubMed]
- Giachetti, L.; Sarti, C.; Cinelli, F.; Russo, D.S. Accuracy of Digital Impressions in Fixed Prosthodontics: A Systematic Review of Clinical Studies. Int. J. Prosthodont. 2020, 33, 192–201. [Google Scholar] [CrossRef]
- Andriessen, F.S.; Rijkens, D.R.; van der Meer, W.J.; Wismeijer, D.W. Applicability and accuracy of an intraoral scanner for scanning multiple implants in edentulous mandibles: A pilot study. J. Prosthet. Dent. 2014, 111, 186–194. [Google Scholar] [CrossRef]
- Ma, Y.; Guo, Y.Q.; Jiang, L.; Yu, H. Influence of intraoral conditions on the accuracy of digital and conventional implant impression techniques for two-implant-supported fixed dental prostheses. J. Prosthodont. Res. 2023, 67, 633–640. [Google Scholar] [CrossRef]


| Conventional Method 15–17 (Polyether) | Digital Method 15–17 (Intra-Oral Scanner) | |||||||
|---|---|---|---|---|---|---|---|---|
| Median | P25 | P50 | P75 | Median | P25 | P50 | P75 | |
| Inter-implant distance 12 (mm) | 0.081 | 0.072 | 0.081 | 0.086 | −0.039 | −0.051 | −0.039 | −0.022 |
| Inter-implant distance 23 (mm) | −0.133 | −0.138 | −0.133 | −0.124 | 0.013 | 0.000 | 0.013 | 0.021 |
| Inter-implant distance 13 (mm) | −0.046 | −0.052 | −0.046 | −0.038 | −0.020 | −0.034 | −0.020 | −0.006 |
| Intra-implant distance (Central point 1) (mm) | 0.057 | 0.049 | 0.057 | 0.064 | 0.019 | 0.012 | 0.019 | 0.025 |
| Intra-implant distance (Central point 2) (mm) | 0.135 | 0.132 | 0.135 | 0.140 | 0.047 | 0.040 | 0.047 | 0.059 |
| Intra-implant distance (Central point 3) (mm) | 0.021 | 0.016 | 0.021 | 0.027 | 0.073 | 0.065 | 0.073 | 0.083 |
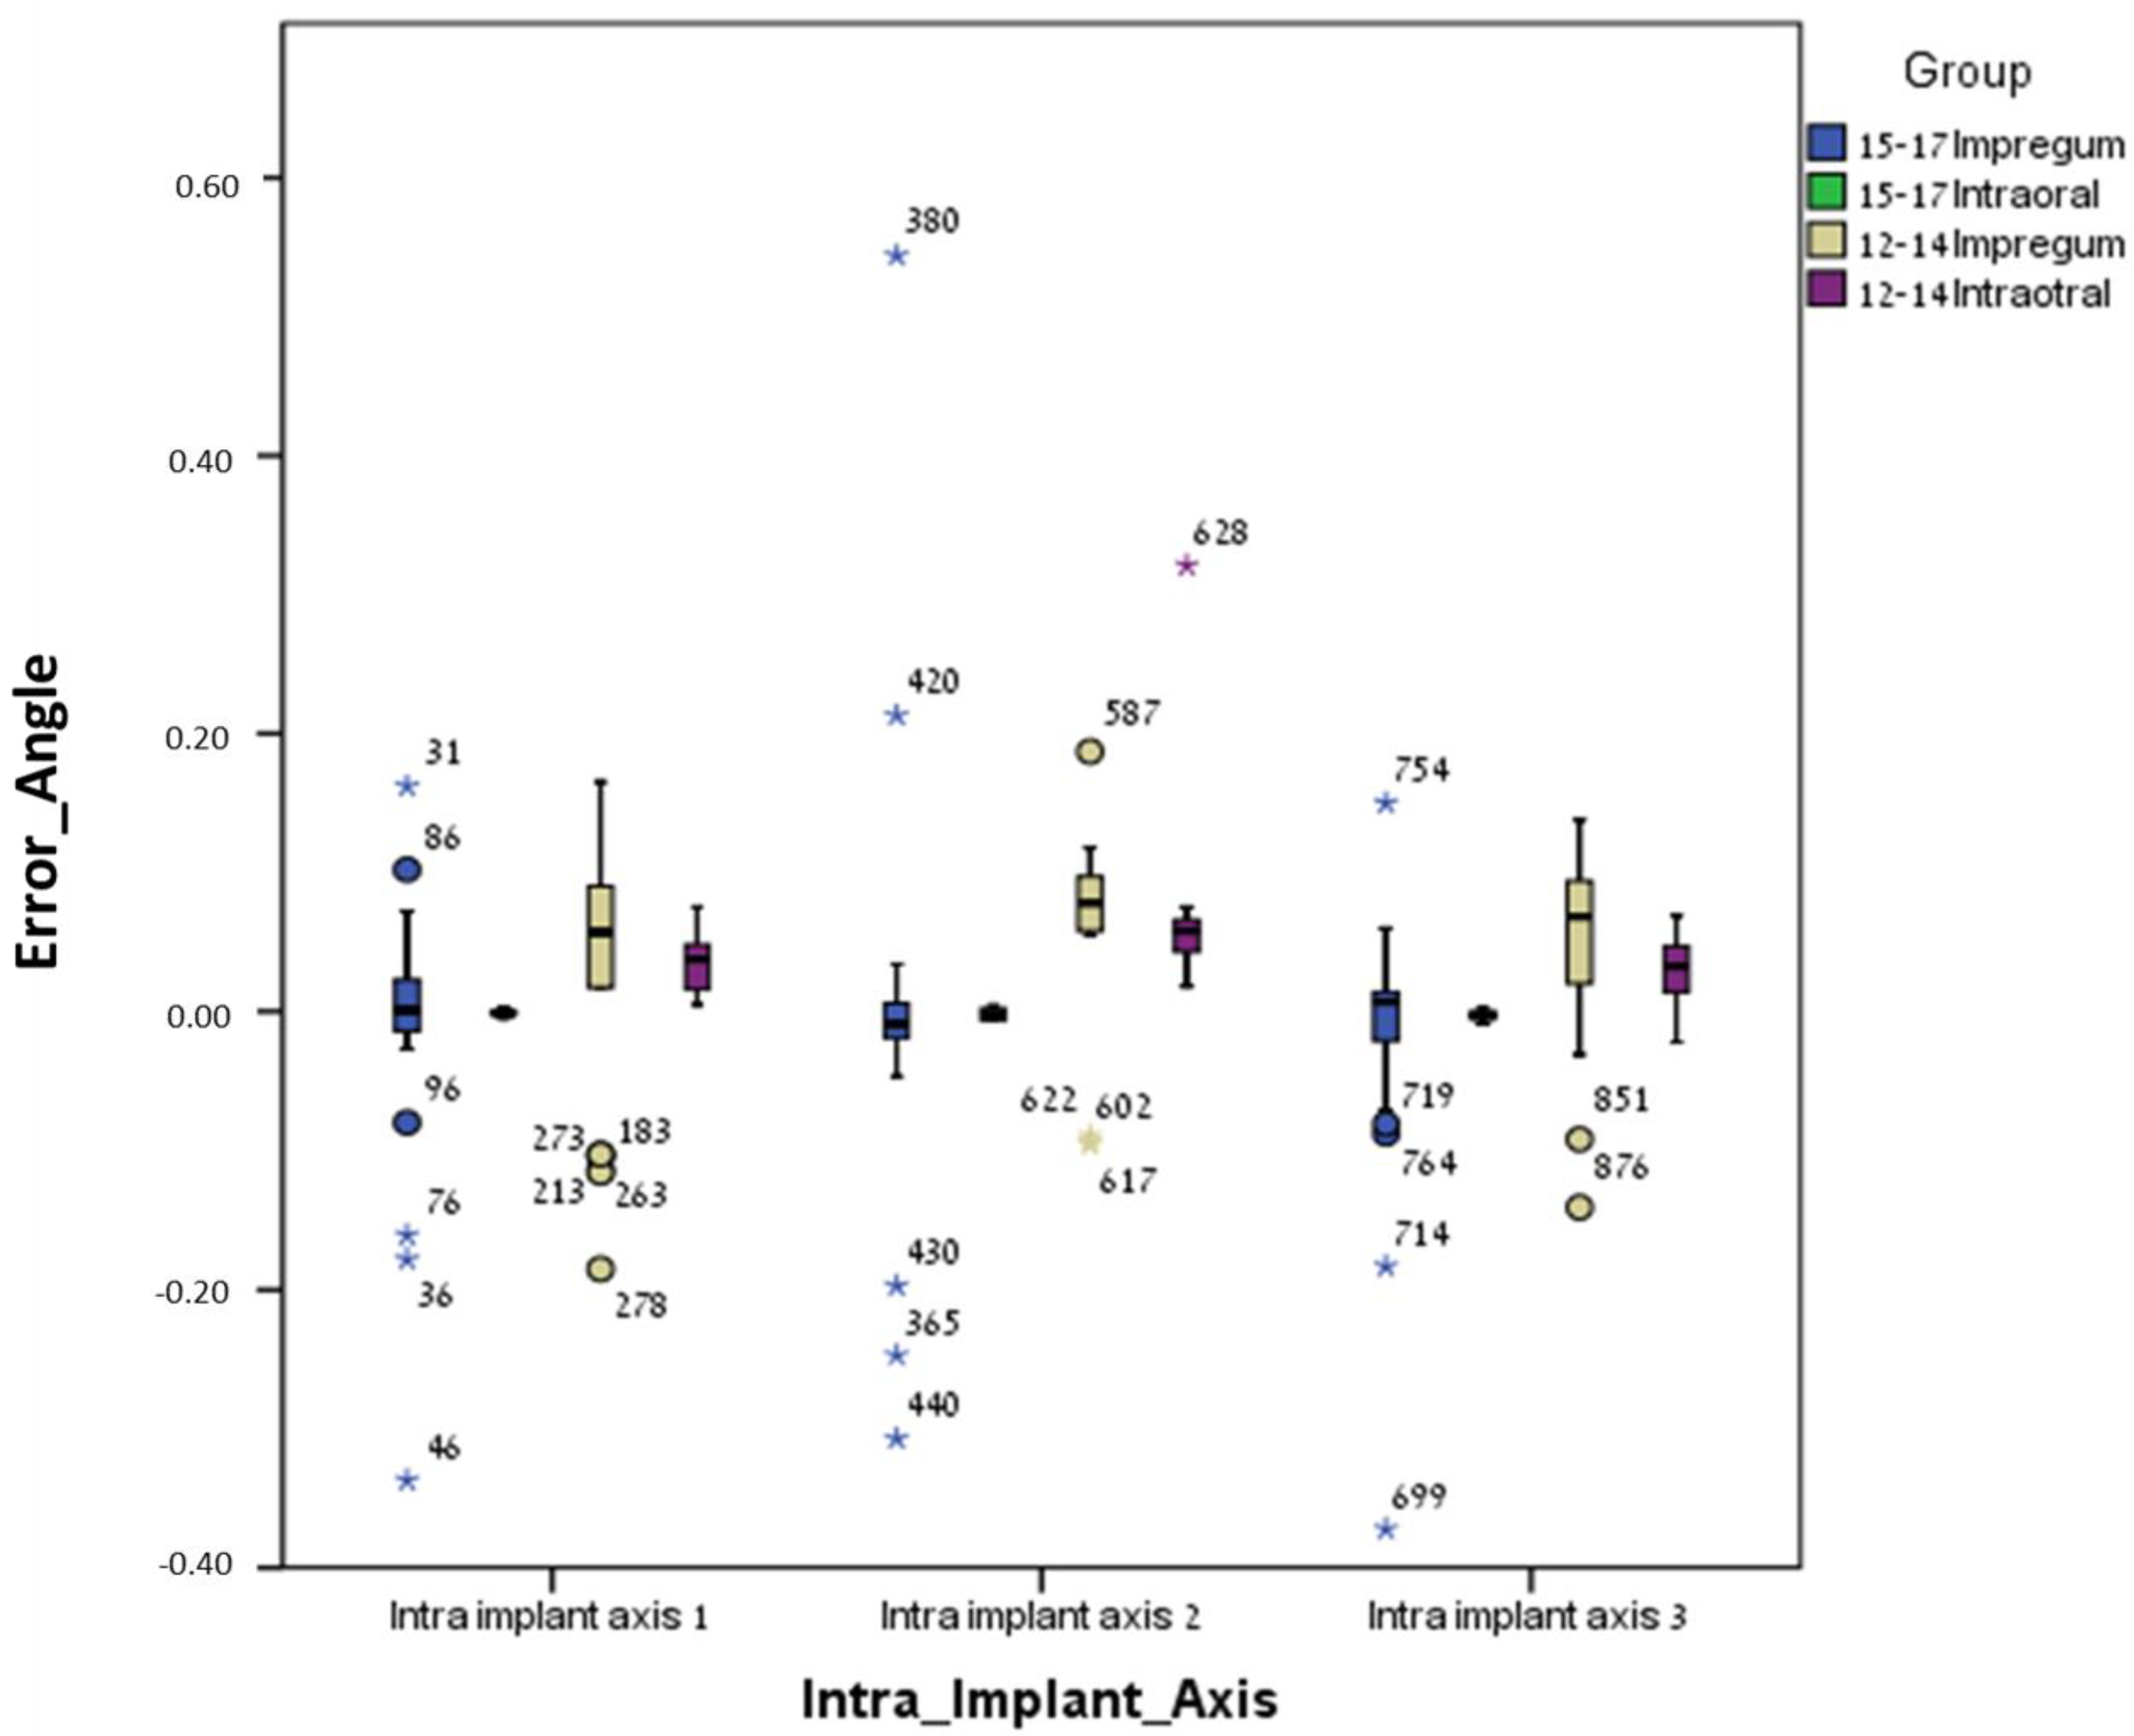
| Intra-implant axis Delta axis 1 (angle) | 0.311 | 0.244 | 0.311 | 0.344 | 0.355 | 0.245 | 0.355 | 0.495 |
| Intra-implant axis Delta axis 2 (angle) | 1.463 | 1.410 | 1.463 | 1.498 | 1.675 | 1.442 | 1.675 | 2.024 |
| Intra-implant axis Delta axis 3 (angle) | 0.142 | 0.094 | 0.142 | 0.189 | 1.975 | 1.832 | 1.975 | 2.256 |
| Inter-implant axis Delta axis 12 (angle) | 0.407 | 0.300 | 0.407 | 0.469 | −0.511 | −0.810 | −0.511 | −0.065 |
| Inter-implant axis Delta axis 23 (angle) | −0.995 | −1.067 | −0.995 | −0.947 | 0.250 | −0.111 | 0.250 | 0.540 |
| Inter-implant axis Delta axis 13 (angle) | −0.217 | −0.266 | −0.217 | −0.157 | −1.724 | −2.070 | −1.724 | −1.459 |
| Conventional Method 12–14 (Polyether) | Digital Method 12–14 (Intra-Oral Scanner) | |||||||
|---|---|---|---|---|---|---|---|---|
| Median | P25 | P50 | P75 | Median | P25 | P50 | P75 | |
| Inter-implant distance 12 (mm) | 0.081 | 0.072 | 0.081 | 0.086 | −0.039 | −0.051 | −0.039 | −0.022 |
| Inter-implant distance 23 (mm) | −0.133 | −0.138 | −0.133 | −0.124 | 0.013 | 0.000 | 0.013 | 0.021 |
| Inter-implant distance 13 (mm) | −0.046 | −0.052 | −0.046 | −0.038 | −0.020 | −0.034 | −0.020 | −0.006 |
| Intra-implant distance (Central point 1) (mm) | 0.057 | 0.049 | 0.057 | 0.064 | 0.019 | 0.012 | 0.019 | 0.025 |
| Intra-implant distance (Central point 2) (mm) | 0.135 | 0.132 | 0.135 | 0.140 | 0.047 | 0.040 | 0.047 | 0.059 |
| Intra-implant distance (Central point 3) (mm) | 0.021 | 0.016 | 0.021 | 0.027 | 0.073 | 0.065 | 0.073 | 0.083 |
| Intra-implant axis Delta axis 1 (angle) | 0.311 | 0.244 | 0.311 | 0.344 | 0.355 | 0.245 | 0.355 | 0.495 |
| Intra-implant axis Delta axis 2 (angle) | 1.463 | 1.410 | 1.463 | 1.498 | 1.675 | 1.442 | 1.675 | 2.024 |
| Intra-implant axis Delta axis 3 (angle) | 0.142 | 0.094 | 0.142 | 0.189 | 1.975 | 1.832 | 1.975 | 2.256 |
| Inter-implant axis Delta axis 12 (angle) | 0.407 | 0.300 | 0.407 | 0.469 | −0.511 | −0.810 | −0.511 | −0.065 |
| Inter-implant axis Delta axis 23 (angle) | −0.995 | −1.067 | −0.995 | −0.947 | 0.250 | −0.111 | 0.250 | 0.540 |
| Inter-implant axis Delta axis 13 (angle) | −0.217 | −0.266 | −0.217 | −0.157 | −1.724 | −2.070 | −1.724 | −1.459 |
Disclaimer/Publisher’s Note: The statements, opinions and data contained in all publications are solely those of the individual author(s) and contributor(s) and not of MDPI and/or the editor(s). MDPI and/or the editor(s) disclaim responsibility for any injury to people or property resulting from any ideas, methods, instructions or products referred to in the content. |
© 2024 by the authors. Licensee MDPI, Basel, Switzerland. This article is an open access article distributed under the terms and conditions of the Creative Commons Attribution (CC BY) license (https://creativecommons.org/licenses/by/4.0/).
Share and Cite
Ben-Izhack, G.; Rosner, O.; Zenziper, E.; Nissan, J.; Hosary, R.; Lugassy, D.; Shely, A. Comparison between Conventional and Digital Impressions for Determining Axes and Distances of Three Implants in Straight and Curved Lines: An In Vitro Study. J. Clin. Med. 2024, 13, 2352. https://doi.org/10.3390/jcm13082352
Ben-Izhack G, Rosner O, Zenziper E, Nissan J, Hosary R, Lugassy D, Shely A. Comparison between Conventional and Digital Impressions for Determining Axes and Distances of Three Implants in Straight and Curved Lines: An In Vitro Study. Journal of Clinical Medicine. 2024; 13(8):2352. https://doi.org/10.3390/jcm13082352
Chicago/Turabian StyleBen-Izhack, Gil, Ophir Rosner, Eran Zenziper, Joseph Nissan, Reema Hosary, Diva Lugassy, and Asaf Shely. 2024. "Comparison between Conventional and Digital Impressions for Determining Axes and Distances of Three Implants in Straight and Curved Lines: An In Vitro Study" Journal of Clinical Medicine 13, no. 8: 2352. https://doi.org/10.3390/jcm13082352