
The Depth of the Molecular Response in Patients with Chronic Myeloid Leukemia Correlates with Changes in Humoral Immunity

 , , , ,
Abstract
:1. Introduction
2. Materials and Methods
2.1. Patients
2.2. Multiplex Assay
2.3. Statistical Analysis
3. Results
3.1. Patients Characteristics
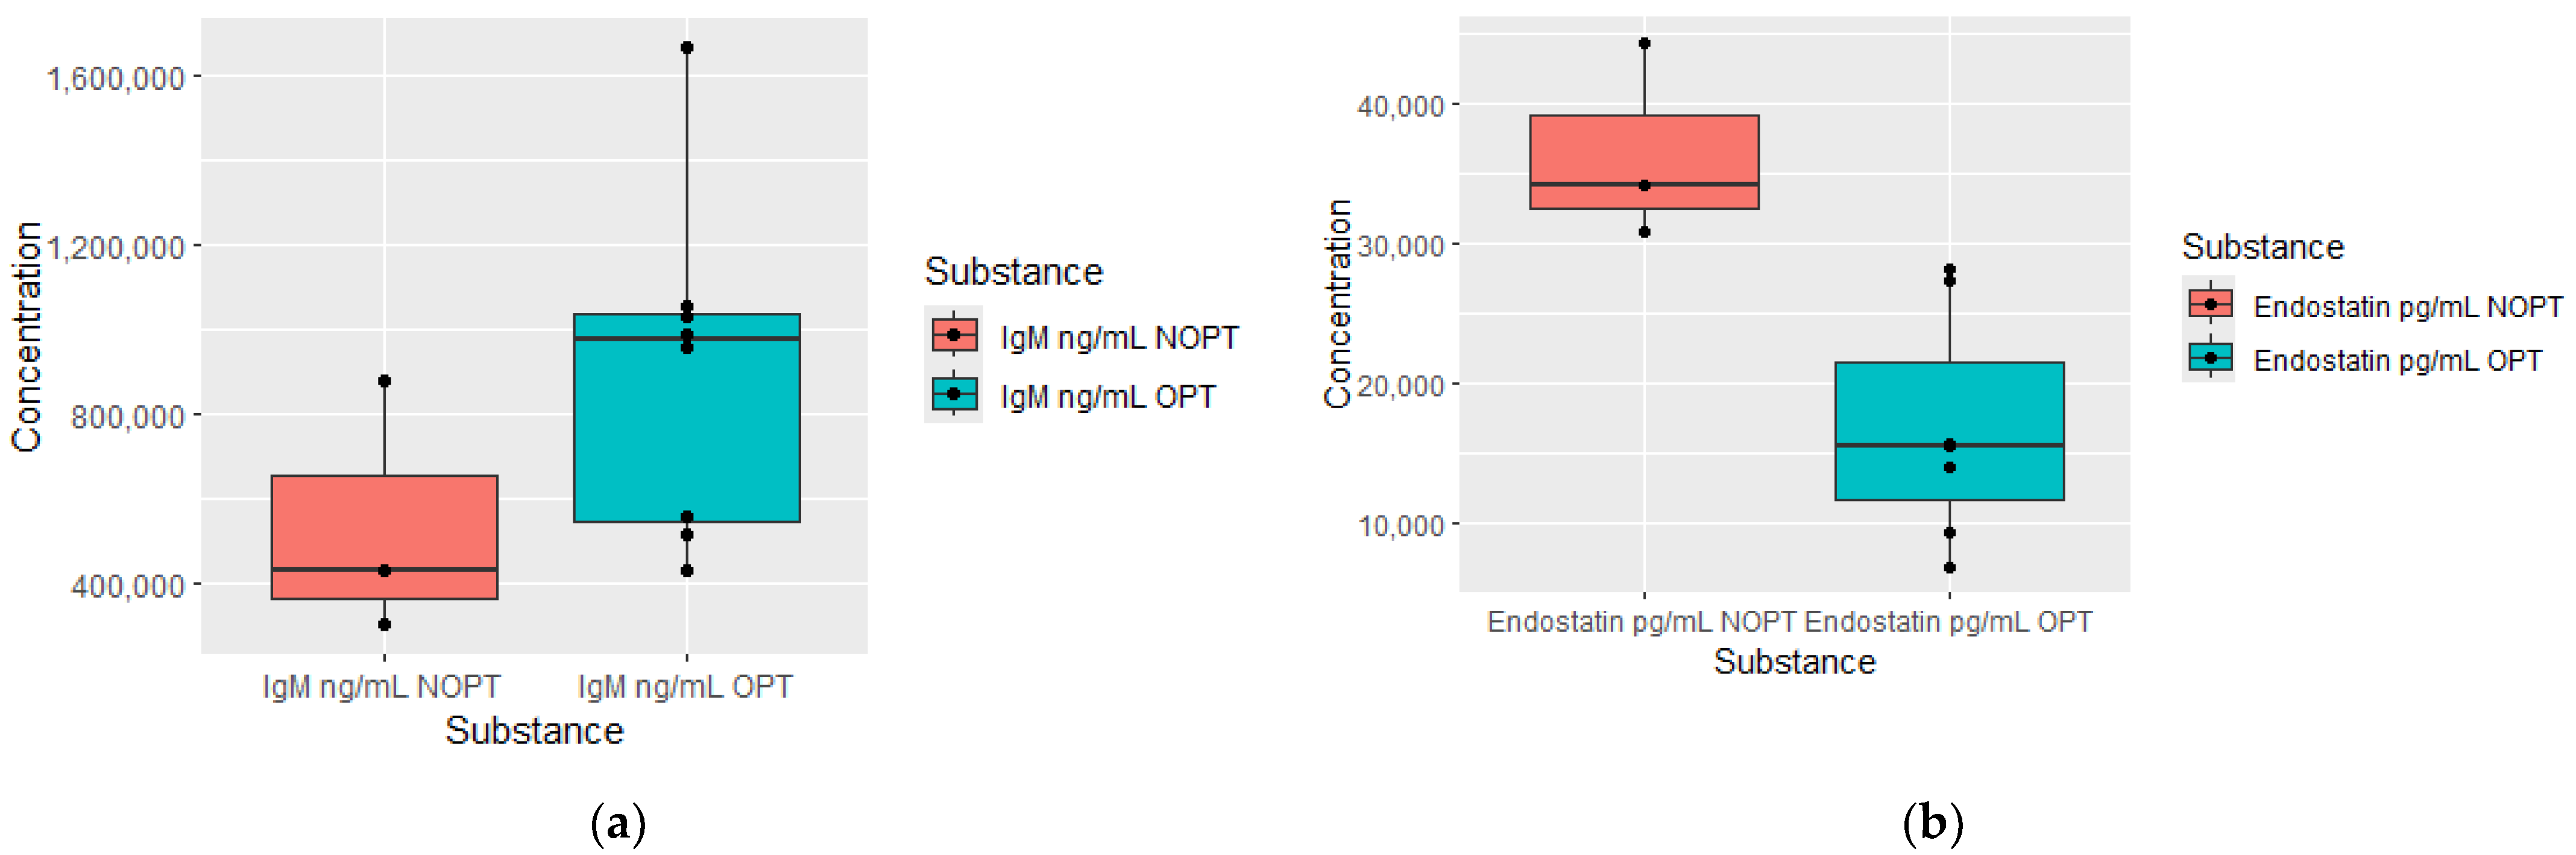
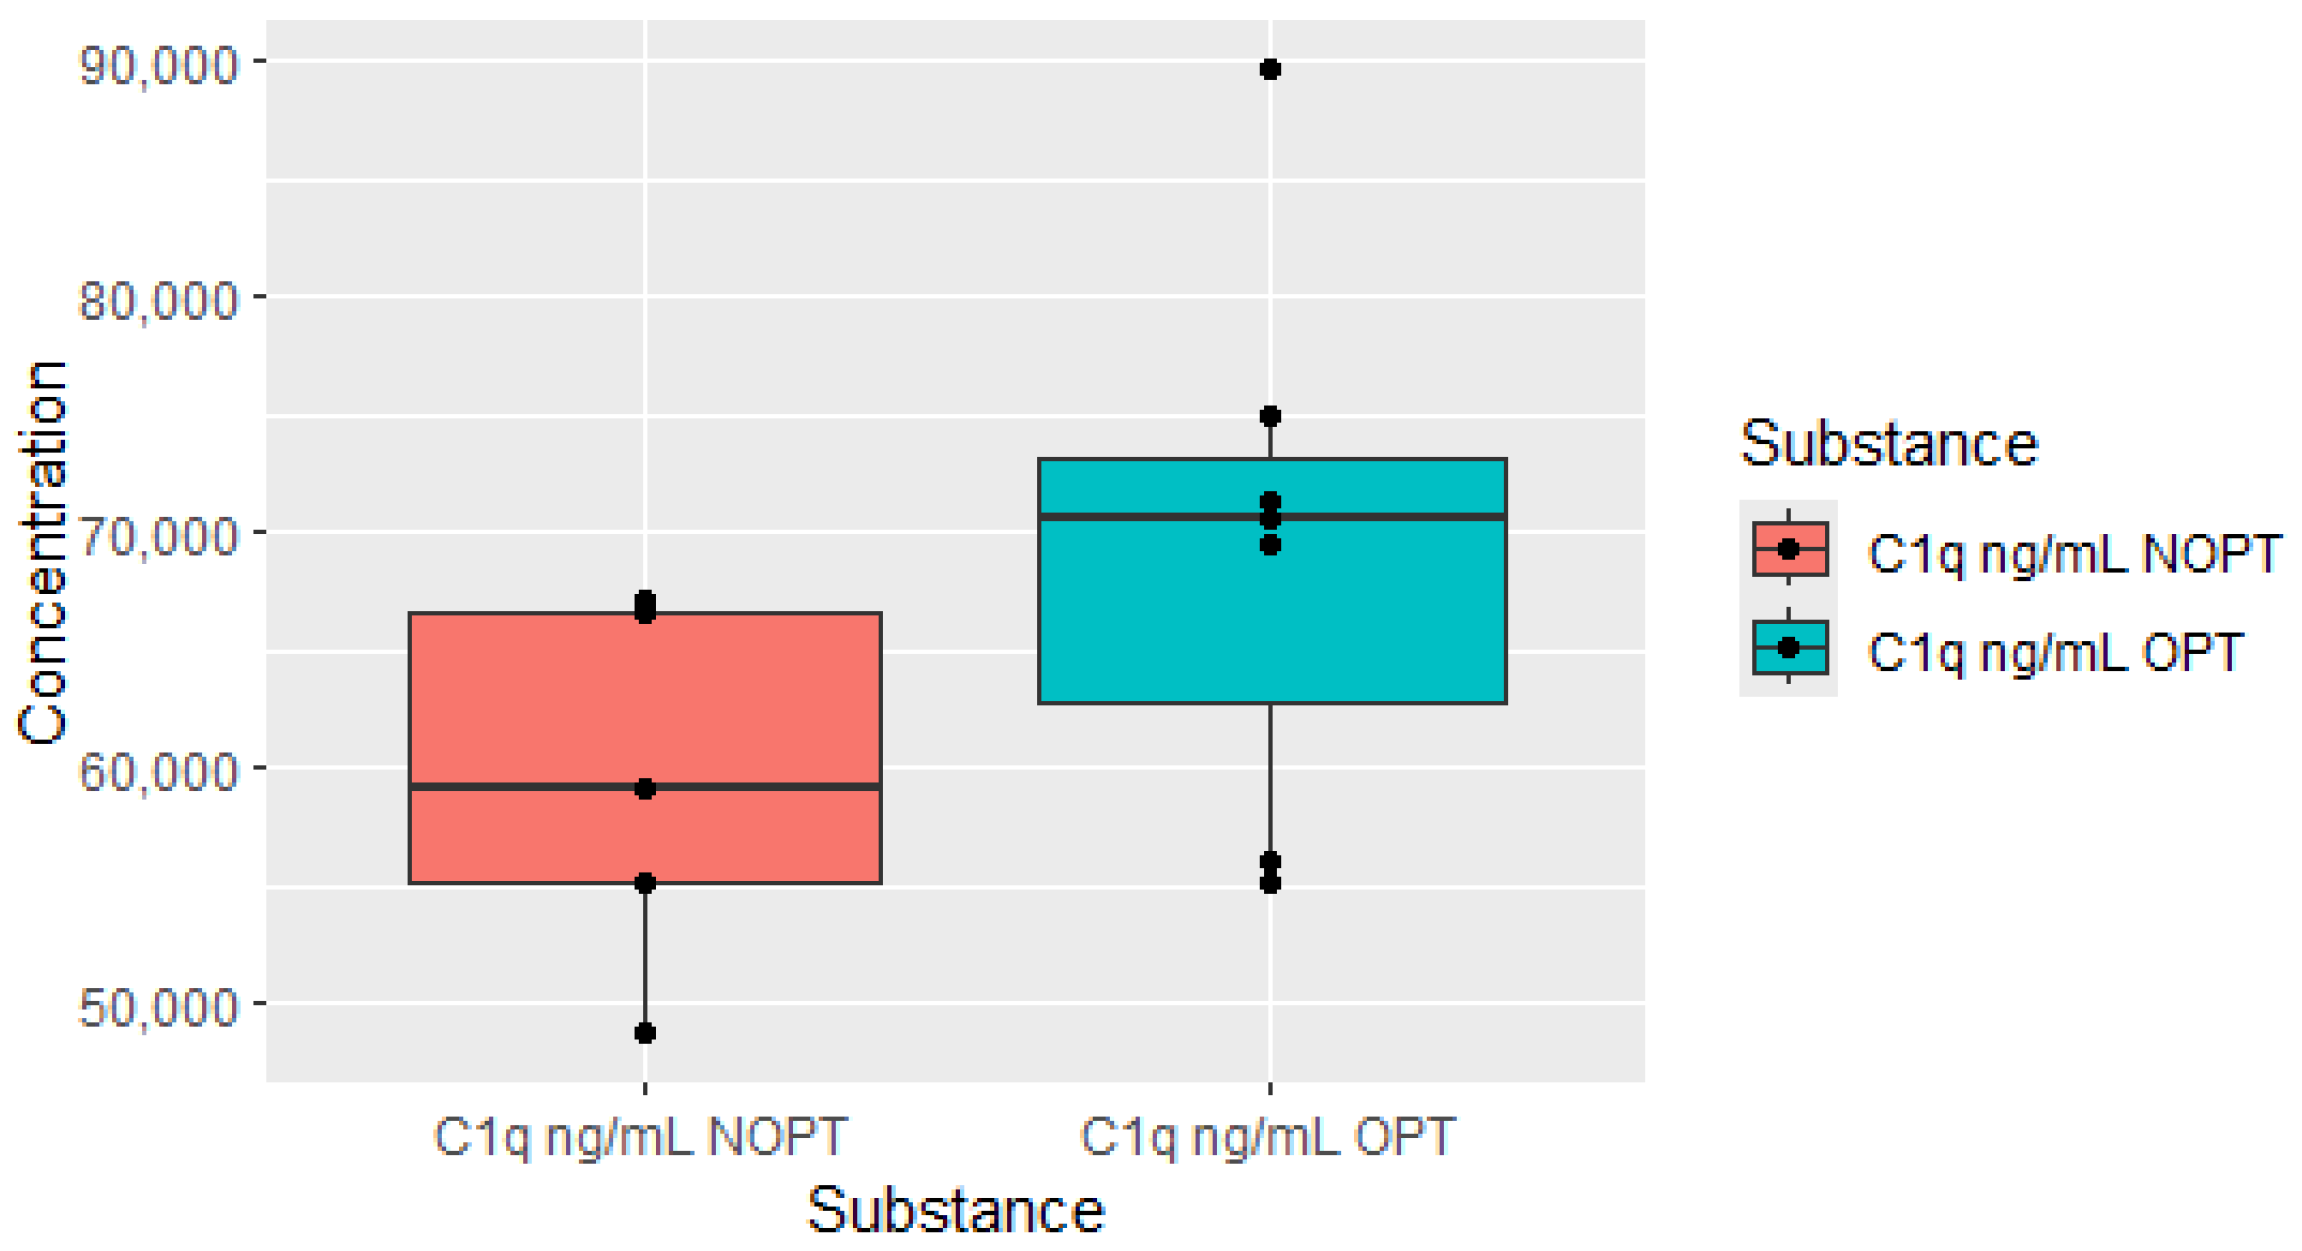
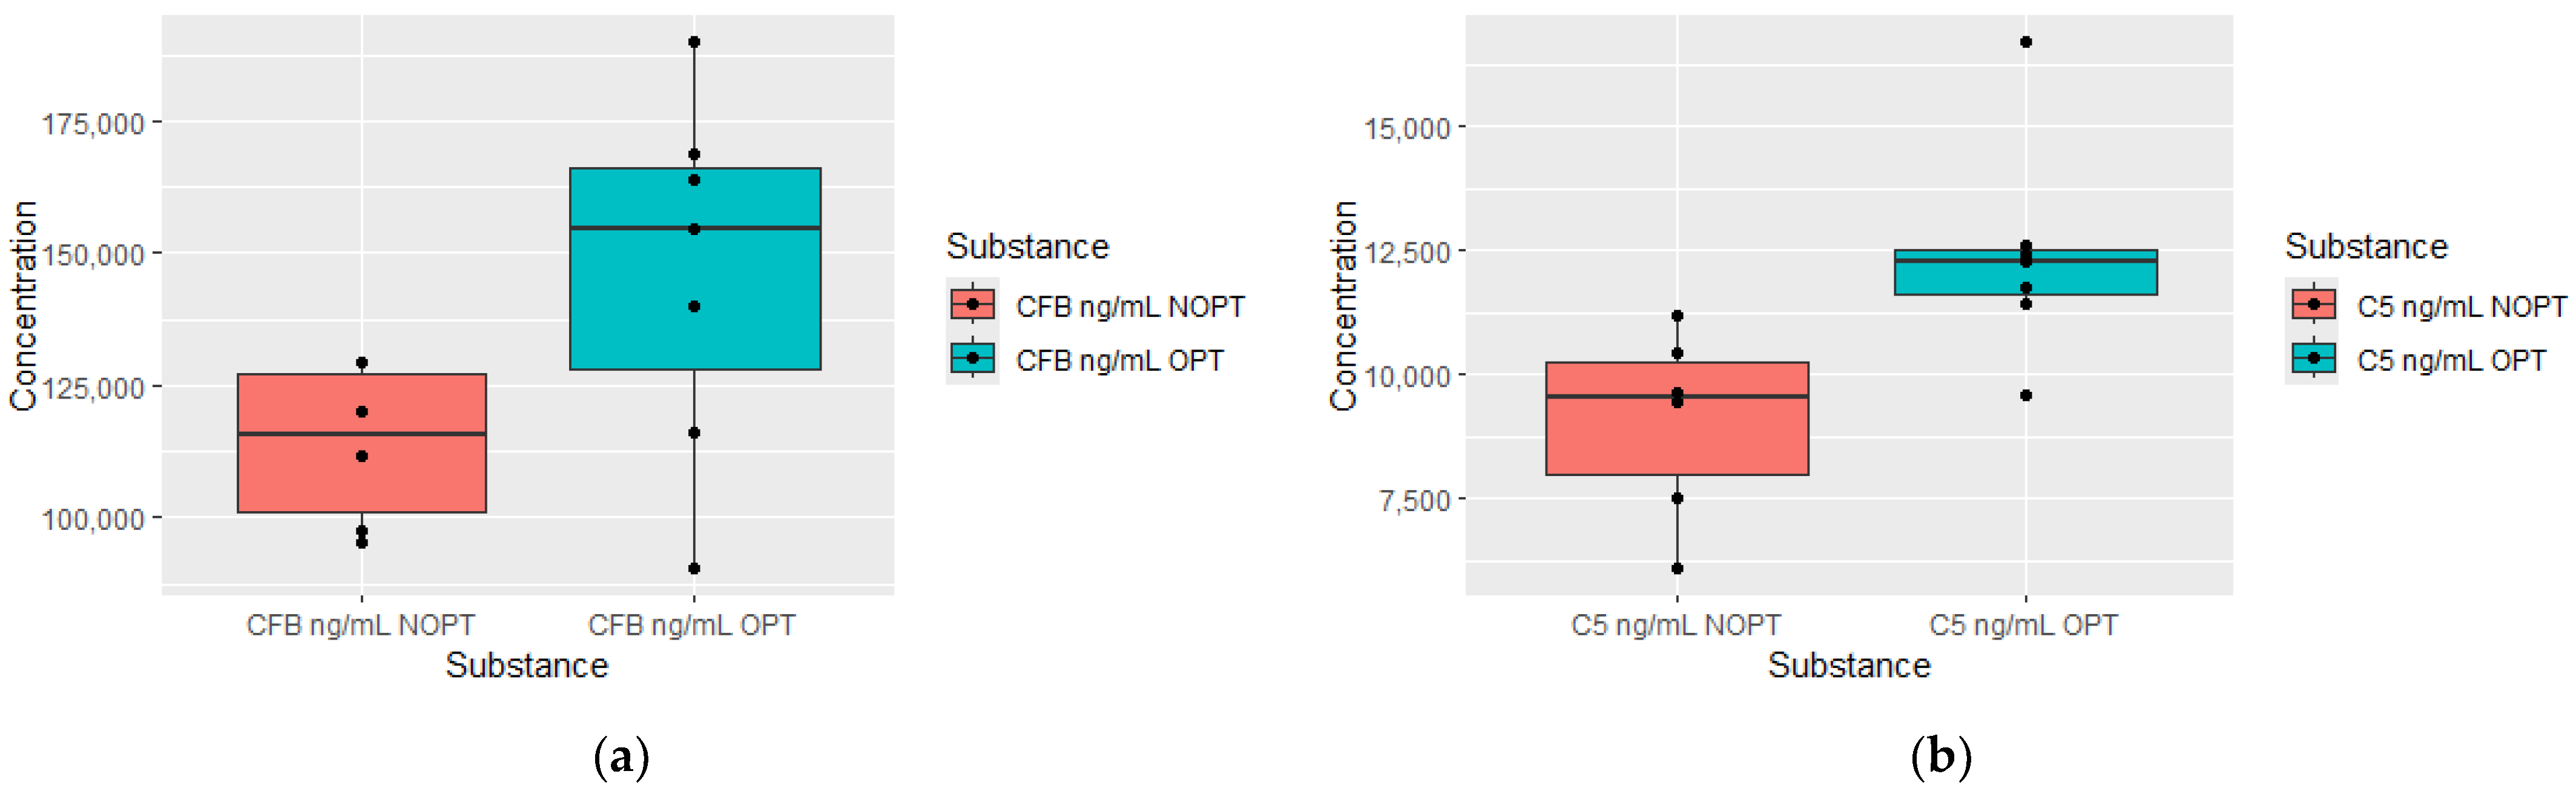
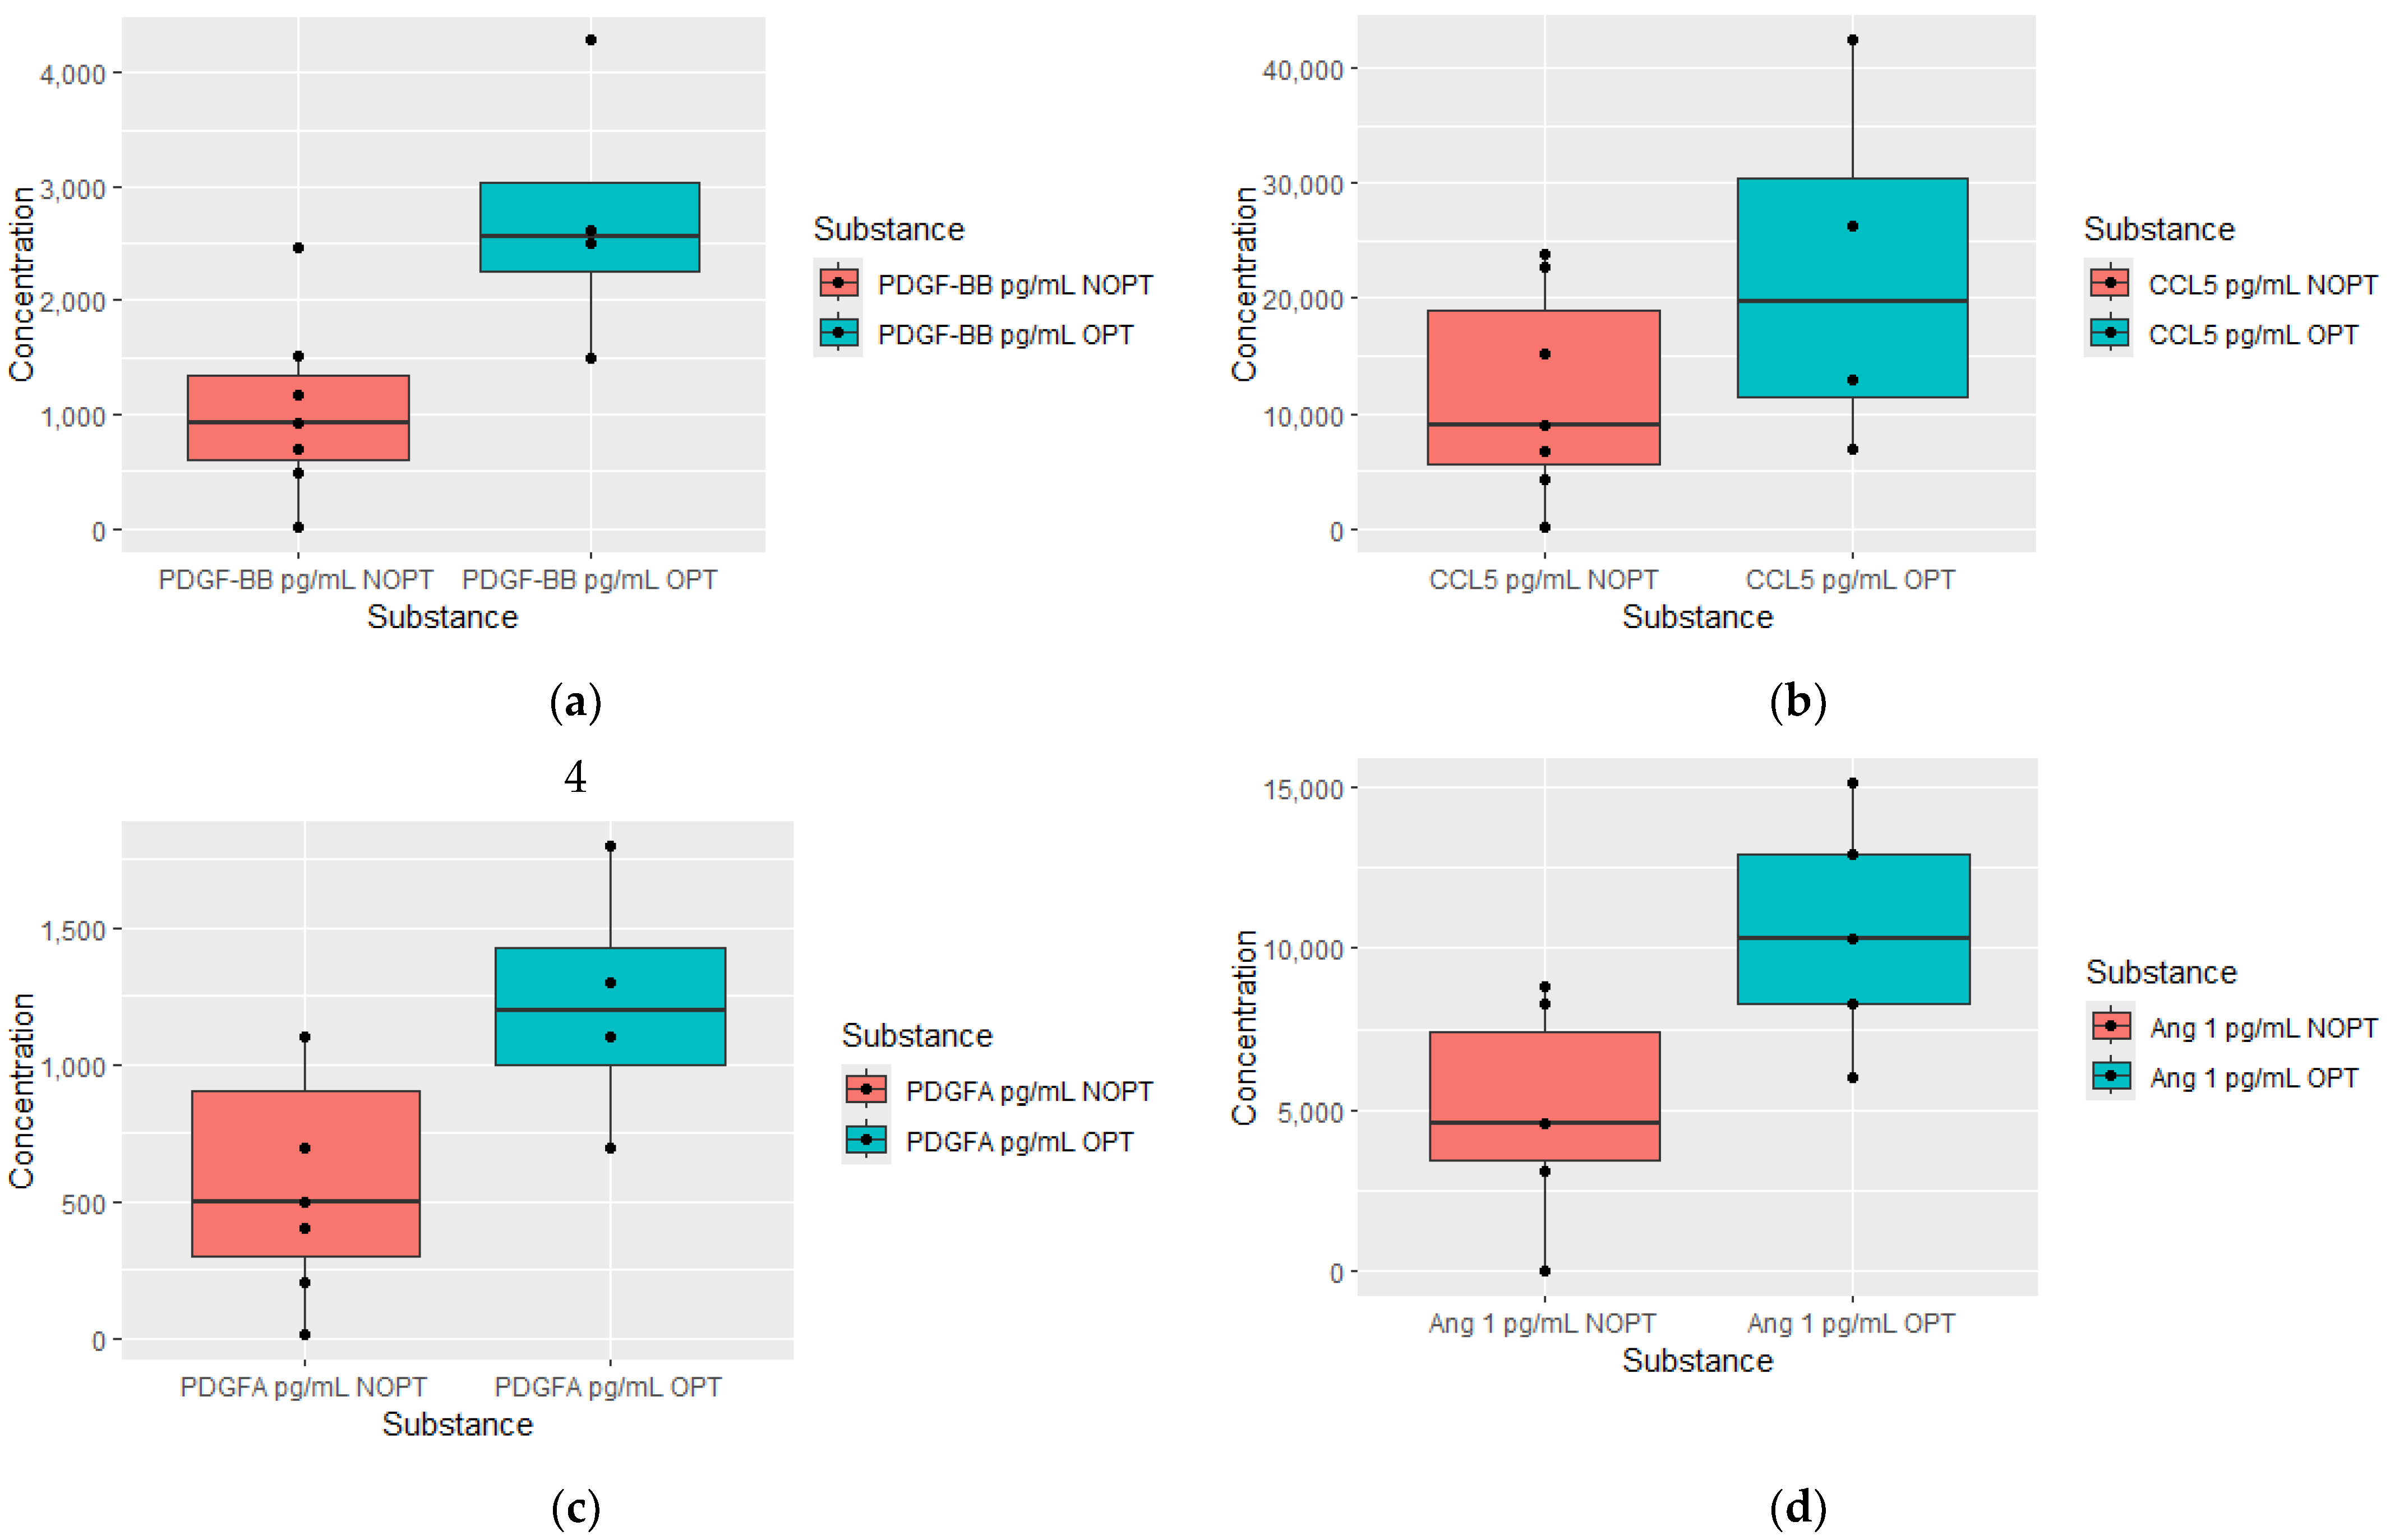
3.2. Significantly Changed Proteomics Levels Depended on Response
4. Discussion
Limitations
5. Conclusions
Author Contributions
Funding
Institutional Review Board Statement
Informed Consent Statement
Data Availability Statement
Conflicts of Interest
References
- Apperley, J.F. Chronic Myeloid Leukaemia. Lancet 2015, 385, 1447–1459. [Google Scholar] [CrossRef] [PubMed]
- Salesse, S.; Verfaillie, C.M. BCR/ABL: From Molecular Mechanisms of Leukemia Induction to Treatment of Chronic Myelogenous Leukemia. Oncogene 2002, 21, 8547–8559. [Google Scholar] [CrossRef] [PubMed]
- Hochhaus, A.; Baccarani, M.; Silver, R.T.; Schiffer, C.; Apperley, J.F.; Cervantes, F.; Clark, R.E.; Cortes, J.E.; Deininger, M.W.; Guilhot, F.; et al. European LeukemiaNet 2020 Recommendations for Treating Chronic Myeloid Leukemia. Leukemia 2020, 34, 966–984. [Google Scholar] [CrossRef] [PubMed]
- Hughes, A.; Yong, A.S.M. Immune Effector Recovery in Chronic Myeloid Leukemia and Treatment-Free Remission. Front. Immunol. 2017, 8, 469. [Google Scholar] [CrossRef] [PubMed]
- Ureshino, H. Treatment-Free Remission and Immunity in Chronic Myeloid Leukemia. Int. J. Hematol. 2021, 113, 642–647. [Google Scholar] [CrossRef]
- Hughes, A.; Clarson, J.; Tang, C.; Vidovic, L.; White, D.L.; Hughes, T.P.; Yong, A.S.M. CML Patients with Deep Molecular Responses to TKI Have Restored Immune Effectors and Decreased PD-1 and Immune Suppressors. Blood 2017, 129, 1166–1176. [Google Scholar] [CrossRef]
- Geelen, I.G.P.; Gullaksen, S.-E.; Ilander, M.M.; Olssen-Strömberg, U.; Mustjoki, S.; Richter, J.; Blijlevens, N.M.A.; Smit, W.M.; Gjertsen, B.T.; Gedde-Dahl, T.; et al. Switching from Imatinib to Nilotinib plus Pegylated Interferon-A2b in Chronic Phase CML Failing to Achieve Deep Molecular Response: Clinical and Immunological Effects. Ann. Hematol. 2023, 102, 1395–1408. [Google Scholar] [CrossRef]
- Humlová, Z.; Klamová, H.; Janatková, I.; Malíčková, K.; Králíková, P.; Sterzl, I.; Roth, Z.; Hamšíková, E.; Vonka, V. Changes of Immunological Profiles in Patients with Chronic Myeloid Leukemia in the Course of Treatment. Clin. Dev. Immunol. 2010, 2010, 137320. [Google Scholar] [CrossRef]
- Garrisi, V.M.; Sgherza, N.; Breccia, M.; Iacobazzi, A.; De Tullio, G.; Nardelli, G.; Negri, A.; Divella, R.; Daniele, A.; Micelli, G.; et al. Association between Proteomic Profile and Molecular Response in Chronic Myeloid Leukemia Patients. Leuk. Lymphoma 2018, 59, 1016–1018. [Google Scholar] [CrossRef]
- Méndez-Valdés, G.; Gómez-Hevia, F.; Lillo-Moya, J.; González-Fernández, T.; Abelli, J.; Cereceda-Cornejo, A.; Bragato, M.C.; Saso, L.; Rodrigo, R. Endostatin and Cancer Therapy: A Novel Potential Alternative to Anti-VEGF Monoclonal Antibodies. Biomedicines 2023, 11, 718. [Google Scholar] [CrossRef]
- Aref, S.; El-Sherbiny, M.; Azmy, E.; Goda, T.; Selim, T.; El-Refaie, M.; Twafik, E. Elevated Serum Endostatin Levels Are Associated with Favorable Outcome in Acute Myeloid Leukemia. Hematology 2008, 13, 95–100. [Google Scholar] [CrossRef]
- Lai, R.; Estey, E.; Shen, Y.; Despa, S.; Kantarjian, H.; Beran, M.; Maushouri, T.; Quackenbuch, R.C.; Keating, M.; Albitar, M. Clinical Significance of Plasma Endostatin in Acute Myeloid Leukemia/Myelodysplastic Syndrome. Cancer 2002, 94, 14–17. [Google Scholar] [CrossRef]
- Catellani, S.; Pierri, I.; Gobbi, M.; Poggi, A.; Zocchi, M.R. Imatinib Treatment Induces CD5+ B Lymphocytes and IgM Natural Antibodies with Anti-Leukemic Reactivity in Patients with Chronic Myelogenous Leukemia. PLoS ONE 2011, 6, e18925. [Google Scholar] [CrossRef] [PubMed]
- Rajala, H.L.M.; Missiry, M.E.; Ruusila, A.; Koskenvesa, P.; Brümmendorf, T.H.; Gjertsen, B.T.; Janssen, J.; Lotfi, K.; Markevärn, B.; Olsson-Strömberg, U.; et al. Tyrosine Kinase Inhibitor Therapy-Induced Changes in Humoral Immunity in Patients with Chronic Myeloid Leukemia. J. Cancer Res. Clin. Oncol. 2017, 143, 1543–1554. [Google Scholar] [CrossRef] [PubMed]
- Revel, M.; Daugan, M.V.; Sautés-Fridman, C.; Fridman, W.H.; Roumenina, L.T. Complement System: Promoter or Suppressor of Cancer Progression? Antibodies 2020, 9, 57. [Google Scholar] [CrossRef] [PubMed]
- Roumenina, L.T.; Daugan, M.V.; Petitprez, F.; Sautès-Fridman, C.; Fridman, W.H. Context-Dependent Roles of Complement in Cancer. Nat. Rev. Cancer 2019, 19, 698–715. [Google Scholar] [CrossRef]
- Schulz, K.; Trendelenburg, M. C1q as a Target Molecule to Treat Human Disease: What Do Mouse Studies Teach Us? Front. Immunol. 2022, 13, 958273. [Google Scholar] [CrossRef]
- Yang, R.; Huang, J.; Ma, H.; Li, S.; Gao, X.; Liu, Y.; Shen, J.; Liao, A. Is Complement C1q a Potential Marker for Tumor Burden and Immunodeficiency in Multiple Myeloma? Leuk. Lymphoma 2019, 60, 1812–1818. [Google Scholar] [CrossRef]
- Yang, L.-X.; Zhang, C.-T.; Yang, M.-Y.; Zhang, X.-H.; Liu, H.-C.; Luo, C.-H.; Jiang, Y.; Wang, Z.-M.; Yang, Z.-Y.; Shi, Z.-P.; et al. C1Q Labels a Highly Aggressive Macrophage-like Leukemia Population Indicating Extramedullary Infiltration and Relapse. Blood 2023, 141, 766–786. [Google Scholar] [CrossRef]
- Michelis, R.; Tadmor, T.; Barhoum, M.; Shehadeh, M.; Shvidel, L.; Aviv, A.; Stemer, G.; Dally, N.; Rahimi-Levene, N.; Yuklea, M.; et al. A C5a-Immunoglobulin Complex in Chronic Lymphocytic Leukemia Patients Is Associated with Decreased Complement Activity. PLoS ONE 2019, 14, e0209024. [Google Scholar] [CrossRef]
- Cavalcante, M.d.S.; Torres-Romero, J.C.; Lobo, M.D.P.; Moreno, F.B.M.B.; Bezerra, L.P.; Lima, D.S.; Matos, J.C.; Moreira, R.d.A.; Monteiro-Moreira, A.C.d.O. A Panel of Glycoproteins as Candidate Biomarkers for Early Diagnosis and Treatment Evaluation of B-Cell Acute Lymphoblastic Leukemia. Biomark. Res. 2016, 4, 1. [Google Scholar] [CrossRef] [PubMed]
- Song, G.; Li, Y.; Jiang, G. Role of VEGF/VEGFR in the Pathogenesis of Leukemias and as Treatment Targets (Review). Oncol. Rep. 2012, 28, 1935–1944. [Google Scholar] [CrossRef]
- Fousek, K.; Horn, L.A.; Palena, C. Interleukin-8: A Chemokine at the Intersection of Cancer Plasticity, Angiogenesis, and Immune Suppression. Pharmacol. Ther. 2021, 219, 107692. [Google Scholar] [CrossRef] [PubMed]
- Ramachandra, N.; Gupta, M.; Schwartz, L.; Todorova, T.; Shastri, A.; Will, B.; Steidl, U.; Verma, A. Role of IL8 in Myeloid Malignancies. Leuk. Lymphoma 2023, 64, 1742–1751. [Google Scholar] [CrossRef] [PubMed]
- Söderlund, S.; Christiansson, L.; Persson, I.; Hjorth-Hansen, H.; Richter, J.; Simonsson, B.; Mustjoki, S.; Olsson-Strömberg, U.; Loskog, A. Plasma Proteomics in CML Patients before and after Initiation of Tyrosine Kinase Inhibitor Therapy Reveals Induced Th1 Immunity and Loss of Angiogenic Stimuli. Leuk. Res. 2016, 50, 95–103. [Google Scholar] [CrossRef] [PubMed]
- Petrackova, M.; Hamsikova, E.; Duskova, M.; Ptackova, P.; Klamova, H.; Humlova, Z.; Vonka, V. Predictive Value of Serum Cytokine Levels in Chronic Myeloid Leukemia Patients. Immunol. Lett. 2016, 179, 61–67. [Google Scholar] [CrossRef] [PubMed]
- Hantschel, O.; Gstoettenbauer, A.; Colinge, J.; Kaupe, I.; Bilban, M.; Burkard, T.R.; Valent, P.; Superti-Furga, G. The Chemokine Interleukin-8 and the Surface Activation Protein CD69 Are Markers for Bcr–Abl Activity in Chronic Myeloid Leukemia. Mol. Oncol. 2008, 2, 272–281. [Google Scholar] [CrossRef] [PubMed]
- Kavanagh, S.; Mirzai, B.; Fuller, K.; Erber, W.N. TGFα Expression in Myeloid Malignancies. J. Clin. Pathol. 2016, 69, 543–546. [Google Scholar] [CrossRef] [PubMed]
- Verma, S.; Singh, A.; Yadav, G.; Kushwaha, R.; Ali, W.; Verma, S.P.; Singh, U.S. Serum Tumor Necrosis Factor-Alpha Levels in Acute Leukemia and Its Prognostic Significance. Cureus 2022, 14, e24835. [Google Scholar] [CrossRef]
- Nievergall, E.; Reynolds, J.; Kok, C.H.; Watkins, D.B.; Biondo, M.; Busfield, S.J.; Vairo, G.; Fuller, K.; Erber, W.N.; Sadras, T.; et al. TGF-α and IL-6 Plasma Levels Selectively Identify CML Patients Who Fail to Achieve an Early Molecular Response or Progress in the First Year of Therapy. Leukemia 2016, 30, 1263–1272. [Google Scholar] [CrossRef]
- Bierie, B.; Moses, H.L. Transforming Growth Factor Beta (TGF-β) and Inflammation in Cancer. Cytokine Growth Factor Rev. 2010, 21, 49–59. [Google Scholar] [CrossRef] [PubMed]
- Dong, M.; Blobe, G.C. Role of Transforming Growth Factor-Beta in Hematologic Malignancies. Blood 2006, 107, 4589–4596. [Google Scholar] [CrossRef] [PubMed]
- Wang, C.-Z.; Zhang, Z.-Q.; Zhang, Y.; Zheng, L.-F.; Liu, Y.; Yan, A.-T.; Zhang, Y.-C.; Chang, Q.-H.; Sha, S. Comprehensive Characterization of TGFB1 across Hematological Malignancies. Sci. Rep. 2023, 13, 19107. [Google Scholar] [CrossRef] [PubMed]
- Aldinucci, D.; Borghese, C.; Casagrande, N. The CCL5/CCR5 Axis in Cancer Progression. Cancers 2020, 12, 1765. [Google Scholar] [CrossRef] [PubMed]
- Hjorth-Hansen, H.; Stentoft, J.; Richter, J.; Koskenvesa, P.; Höglund, M.; Dreimane, A.; Porkka, K.; Gedde-Dahl, T.; Gjertsen, B.T.; Gruber, F.X.; et al. Safety and Efficacy of the Combination of Pegylated Interferon-A2b and Dasatinib in Newly Diagnosed Chronic-Phase Chronic Myeloid Leukemia Patients. Leukemia 2016, 30, 1853–1860. [Google Scholar] [CrossRef]
- Roy, L.; Chomel, J.-C.; Guilhot, J.; Guerci-Bresler, A.; Escoffre-Barbe, M.; Giraudier, S.; Charbonnier, A.; Dubruille, V.; Huguet, F.; Johnson-Ansah, H.; et al. Dasatinib plus Peg-Interferon Alpha 2b Combination in Newly Diagnosed Chronic Phase Chronic Myeloid Leukaemia: Results of a Multicenter Phase 2 Study (DASA-PegIFN Study). Br. J. Haematol. 2023, 200, 175–186. [Google Scholar] [CrossRef]


| Age at Diagnosis (Years) | 50.5 (33–74) |
| Sex (N (%)) | |
| Female | 15 (51%) |
| Male | 16 (49%) |
| Sokal score | |
| Low risk | 19 (61%) |
| Intermediate risk | 10 (33%) |
| High risk | 2 (6%) |
| EUTOS score (N (%)) | |
| Low risk | 28 (90%) |
| High risk (7) | 3 (10%) |
| TKI | |
| Imatinib | 23 (74%) |
| Dasatinib | 5 (16%) |
| Nilotinib | 3 (10%) |
| Inclusion Criteria | Exclusion Criteria |
|---|---|
| Age over 18 and under 80 | Diagnosis of chronic myeloid leukemia in the accelerated or blast phase |
| Diagnosed with chronic myeloid leukemia in the chronic phase | Coexistence of another myeloid or lymphoid tumor |
| No prior TKI treatment for CML | Reservations from a clinician that they would qualify to participate in the study regarding compliance with medical recommendations |
| Morphology at Diagnosis | IS% | |||||
|---|---|---|---|---|---|---|
| No. | WBC × 109/L | Hb(g/L) | PLT × 109/L | 3rd Month | 6th Month | 12th Month |
| 1 | 147.06 | 11.5 | 171 | 12.84 | 1.6442 | 0.74 |
| 2 | 222.54 | 5.4 | 136 | 87.09 | 17.53 | 10.48 |
| 3 | 165 | 10.1 | 270 | 0.54 | 0.07 | 0.01 |
| 4 | 113 | 11.2 | 173 | 8.92 | 0.56 | 0.41 |
| 5 | 208.55 | 11.4 | 368 | 23.26 | 19.37 | 0.0074 |
| 6 | 39.45 | 13.8 | 210 | 2.27 | 0.3 | 2.14 |
| 7 | 32.89 | 10.8 | 1134 | 7.15 | 0.022 | 0.038 |
| 8 | 45.77 | 12.1 | 627 | 5.63 | 4.95 | 0.179 |
| 9 | 36 | 12.8 | 212 | 12.3 | 8.5 | 0.38 |
| 10 | 134 | 13 | 340 | 3.4 | 0.12 | 0.8 |
| 11 | 487 | 11.1 | 396 | 10.6 | 6.9 | 0.27 |
| 12 | 216 | 8.6 | 1484 | 34.89 | 9.2 | 0.13 |
| 13 | 57.94 | 12.7 | 256 | 2.62 | 1.27 | 1.24 |
| 14 | 224.18 | 9.4 | 807 | 9.35 | 0.13 | 0.007 |
| 15 | 47.78 | 12.4 | 840 | 3.57 | 3.99 | 0.06 |
| 16 | 151.85 | 11.6 | 131 | 1.36 | 0.838 | 0.04 |
| 17 | 86.2 | 12.9 | 1060 | 14.84 | 8.47 | 103.69 |
| 18 | 59.05 | 12.3 | 522 | 6.66 | 0.24 | 0.23 |
| 19 | 449.73 | 10.8 | 652 | 142.30 | 2.098 | 0.0085 |
| 20 | 392.84 | 6.1 | 334 | 9.98 | 0.027 | 93.42 |
| 21 | 127.82 | 10.2 | 287 | 4.86 | 3.25 | 10.95 |
| 22 | 82.62 | 14 | 378 | 21.73 | 16.06 | 2.12 |
| 23 | 317.89 | 13.3 | 141 | 131.02 | 0.003 | 0.04 |
| 24 | 137.2 | 9 | 623 | 0.17 | 6.39 | 1.38 |
| 25 | 15.03 | 14.17 | 573 | 9.03 | 0.12 | 0.056 |
| 26 | 86.98 | 14 | 188 | 1.47 | 2.44 | 0.13 |
| 27 | 46.02 | 12.4 | 666 | 9.59 | 0.38 | 0.07 |
| 28 | 85.44 | 10.8 | 768 | 7.71 | 0.13 | 3.99 |
| 29 | 430.61 | 11.3 | 306 | 9.35 | 0.13 | 0.38 |
| 30 | 47.78 | 12.4 | 840 | 1.19 | 0.17 | 0.13 |
| 31 | 27.76 | 13.8 | 230 | 2.51 | 29.23 | 0.13 |
| Optimal Response (OPT) | Non-Optimal Response (NOPT) | p-Value | n (OPT and NOPT) | |
|---|---|---|---|---|
| Serum cytokine levels measured at diagnosis in patients who achieved early molecular response in 3 months | ||||
| Endostatin µg/mL | 15,7 (6.9–28.1) | 37.5 (30.7–44.3) | 0.0299 | OPT = 7, NOPT = 3 |
| IgM ug/mL | 1029.8 (432.6–1668.2) | 365.1 (299.51–430.7) | 0.0299 | OPT = 8, NOPT = 3 |
| Serum cytokine levels were measured at 3 months, depending on response according to ELN after 6 months of treatment | ||||
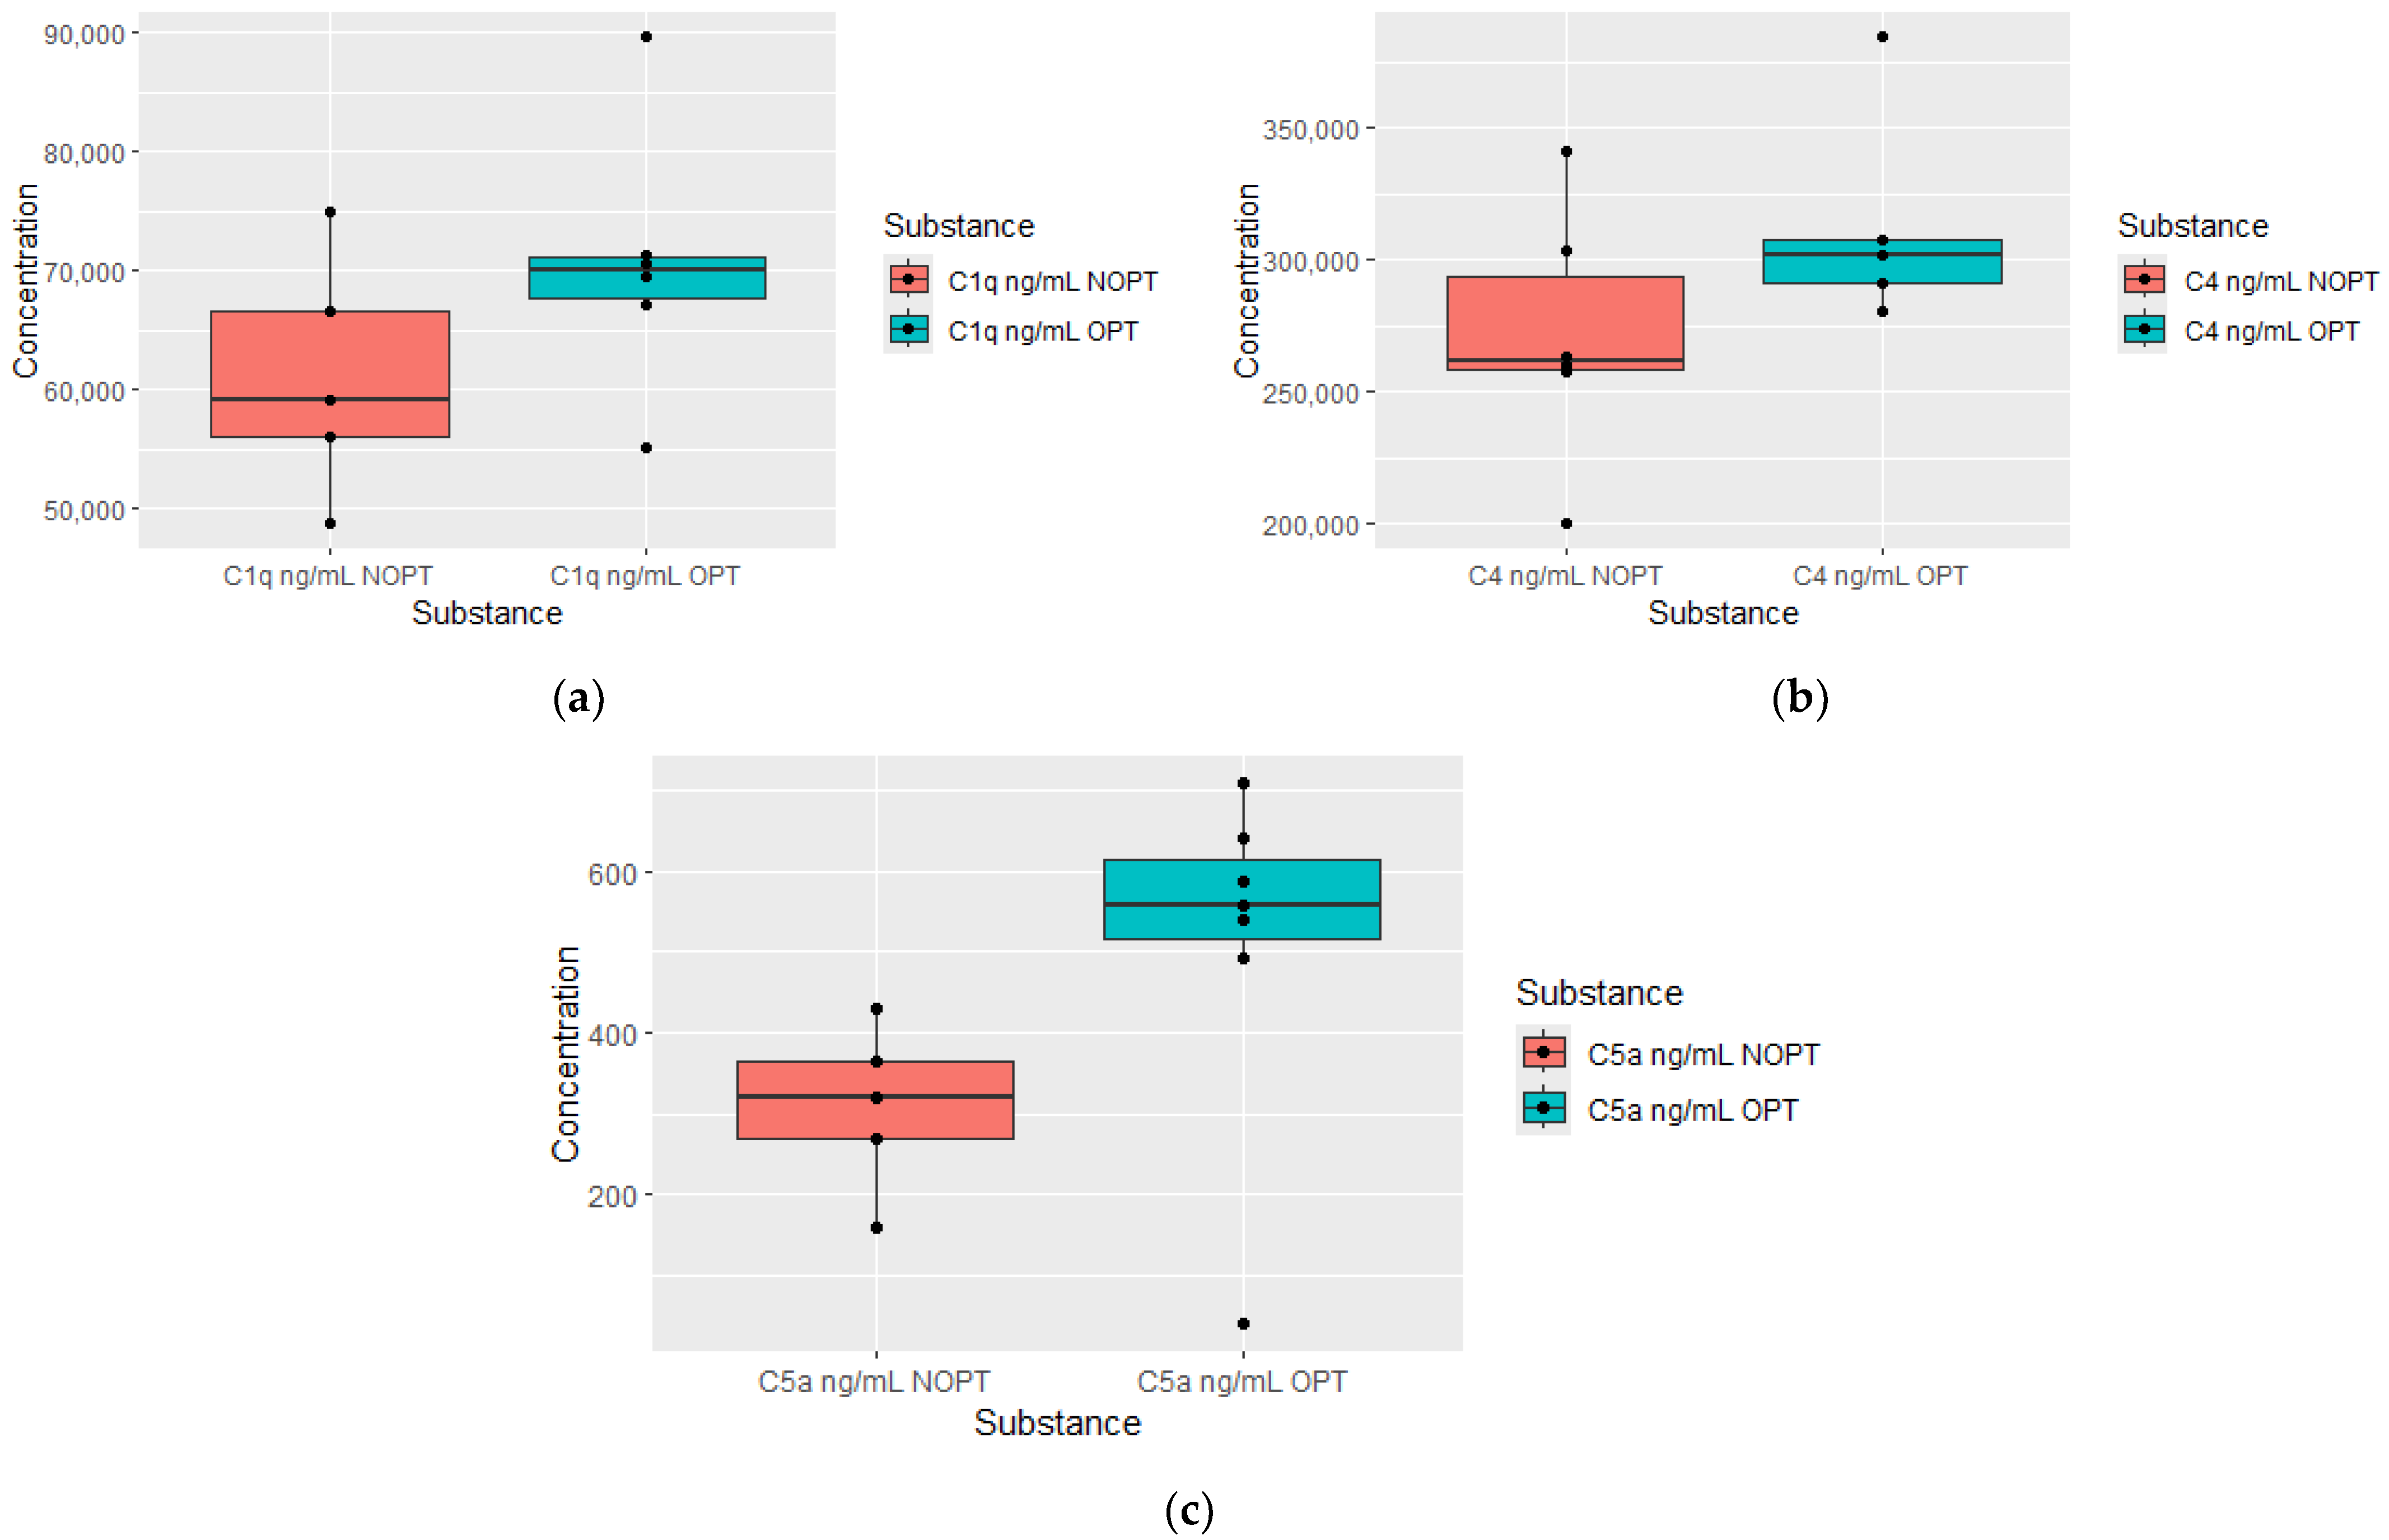
| C1q µg/mL | 69.6 (55.8–89.7) | 56.1 (48.6–66.6) | 0.0136 | OPT = 6, NOPT = 5 |
| C4 µg/mL | 307.6 (280.4–384.7) | 260.3 (199.5–303.4) | 0.0136 | OPT = 5, NOPT = 6 |
| C5a µg/mL | 539.8 (39.5–709.1) | 320.2 (158.4–430.8) | 0.0327 | OPT = 7, NOPT = 5 |
| Serum cytokine levels measured at 3 months, depending on response according to ELN after 12 months of treatment | ||||
| C1q µg/mL | 70.9 (56.1–89.7) | 59.8 (48.7–67.4) | 0.0141 | OPT = 7, NOPT = 5 |
| Serum cytokine levels measured at 6 months, depending on response according to ELN after 12 months of treatment | ||||
| CFB µg/mL | 159.2 (90.2–194.4) | 111.6 (95.1–129.5) | 0.0372 | OPT = 7, NOPT = 6 |
| C5 µg/mL | 12 (9.5–16.7) | 9.4 (6.1–11.) | 0.007 | OPT = 7, NOPT = 6 |
| Serum cytokine levels measured at 12 months, depending on response according to ELN after 12 months of treatment | ||||
| PDGF-BB pg/mL | 2.6 (1.5–6) | 0.82 (0.003–1.8) | 0.0084 | OPT = 4, NOPT = 7 |
| CCL5 ng/mL | 26.4 (6.8–63) | 5.9 (0.18–22.7) | 0.0281 | OPT = 4, NOPT = 7 |
| PDGF-AA pg/mL | 1300 (700–1800) | 450 (8.4–1100) | 0.0098 | OPT = 4, NOPT = 6 |
| Angiopoietin 1 ng/mL | 10.3 (6–15.1) | 3.8 (0–8.3) | 0.0101 | OPT = 5, NOPT = 5 |
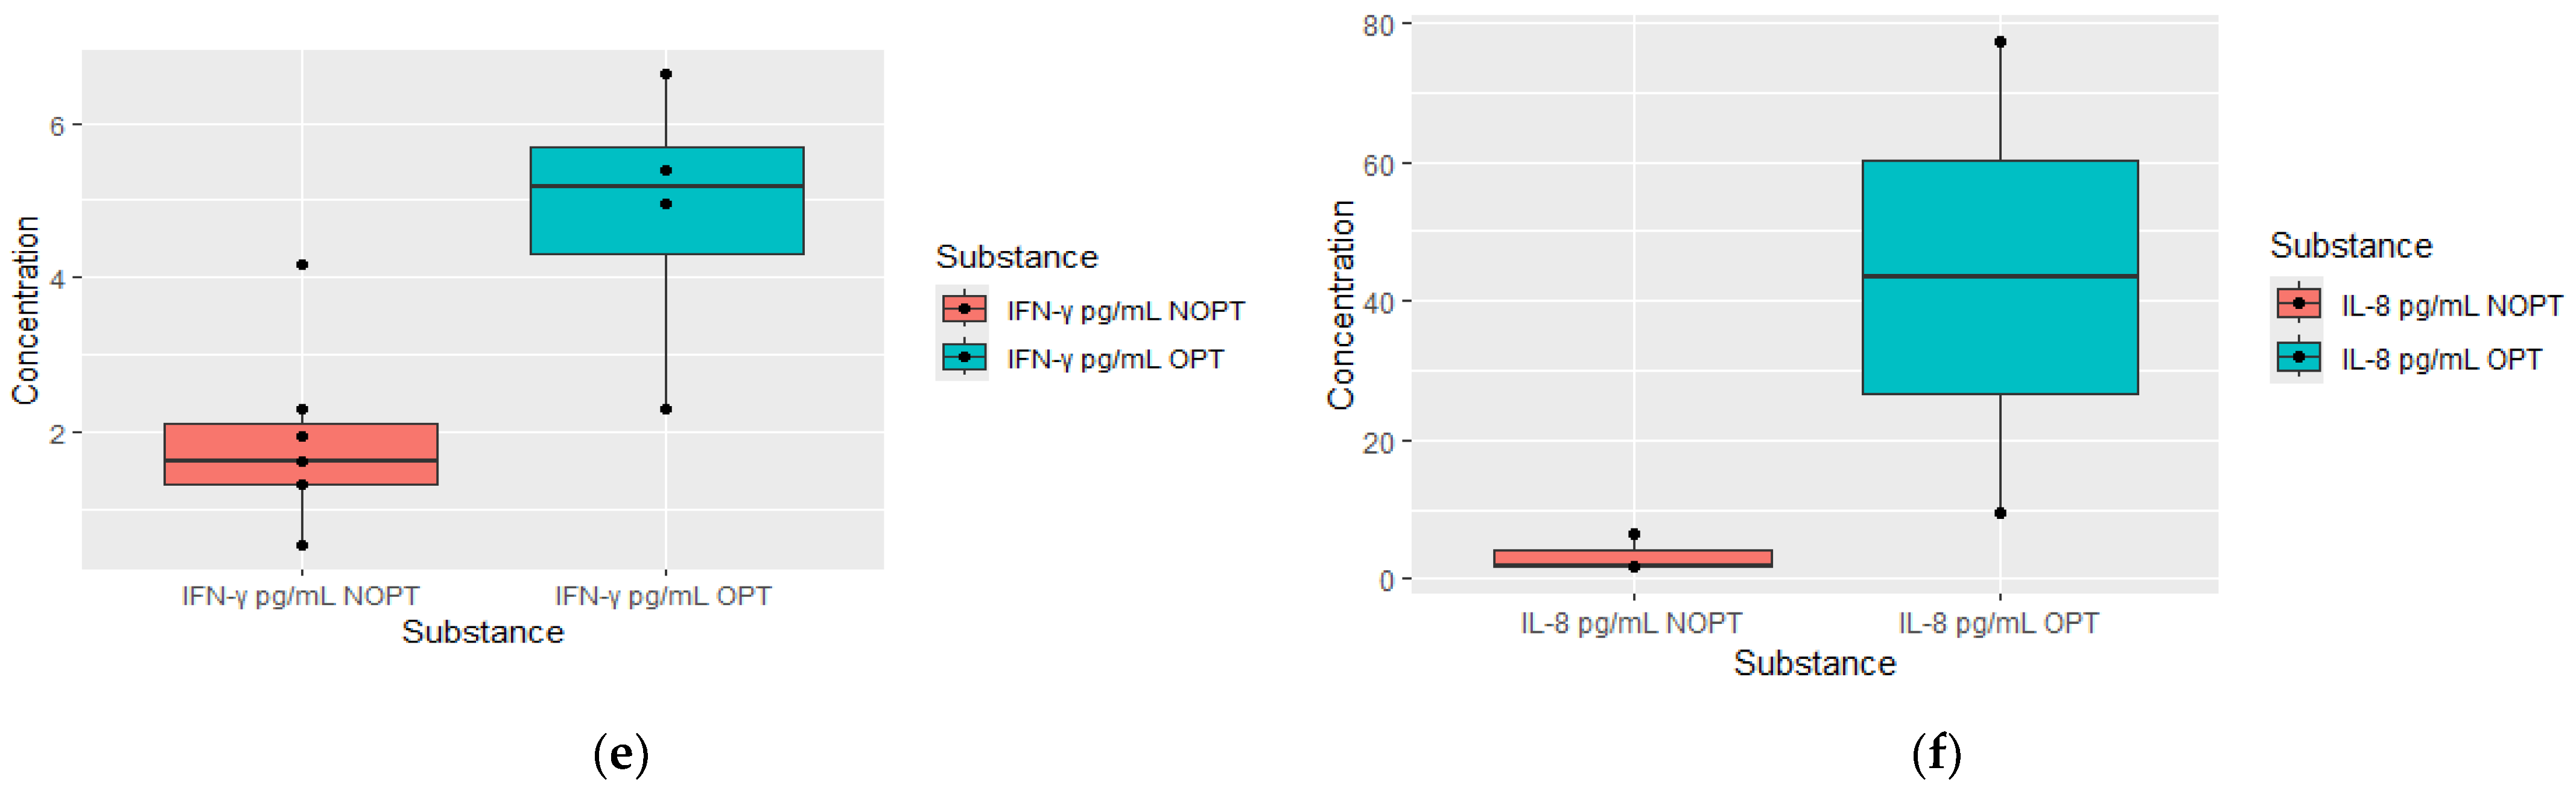
| IFN Y pg/mL | 4.9 (2.3–6.6) | 1.6 (0.53–4.16) | 0.0268 | OPT = 4, NOPT = 6 |
| IL-8 pg/mL | 4.3 (1.952–99.7) | 1.8 (0.54–5.2) | 0.0404 | OPT = 3, NOPT = 7 |
| EGF pg/mL | 36.2 (30.5–196.4) | 10.8 (0–43.3) | 0.0128 | OPT = 5, NOPT = 8 |
| VEGF pg/mL | 27.8 (11.2–32.1) | 12.5 (5.4–21.4) | 0.0281 | OPT = 5, NOPT = 8 |
| TGF-β ng/mL | 26.6 (14–52.3) | 13.8 (8.6–17.5) | 0.0191 | OPT = 5, NOPT = 8 |
| PDGF-AB ng/mL | 4.5 (1.8–5.2) | 1.2 (0.5–3.3) | 0.0281 | OPT = 5, NOPT = 8 |
| OPT Group (n = 3) | Non-OPT Group (n = 3) | p-Value | |
|---|---|---|---|
| TNF-α pg/mL | 9.9 (9.7–16.01) | 4.7 (0.72–8.52) | 0.049 |
| IL-8 pg/mL | 9.6 (6.6–77.3) | 1.645 (1.2–1.7) | 0.049 |
| VEGF pg/mL | 17.39 (11.9–25.8) | 10.508 (4.9–10.9) | 0.049 |
| FGFb pg/mL | 50.7 (46.2–116) | 12.9 (10.6–26.5) | 0.049 |
| FGFA pg/mL | 166 (165–239) | 127 (78.1–144) | 0.049 |
| TGF-β pg/mL | 24.5 (14.1–52.3) | 20.1 (18.3–20.3) | 0.049 |
| Diagnosis (dg) | 3 Months | p-Value dg vs. 3 Months | 6 Months | p-Value 3 Months vs. 6 Months | 12 Months | p-Value 6 Months vs. 12 Months | |
|---|---|---|---|---|---|---|---|
| Agniopoetin-1 ng/mL | 26.6 ± 19.5 | 16.7 ± 10.9 | 0.916512 | 13.4 ± 7.6 | 0.043115 | 6.2 ± 3.7 | 0.213525 |
| IFNy pg/mL | 3.7 ± 2.2 | 3.3 ± 2.8 | 0.600180 | 3.2 ± 2.7 | 0.144128 | 2.9 ± 1.9 | 0.310495 |
| IL-2 pg/mL | 0.11 ± 0.12 | 0.15 ± 0.34 | 0.500185 | 0.2 ± 0.3 | 0.500185 | 0.13 ± 0.17 | 0.779435 |
| IL-4 pg/mL | 2.0 ± 0.3 | 17.3 ± 48 | 0.463072 | 14.8 ± 42.8 | 0.345232 | 17.8 ±48.8 | 0.138642 |
| IL-6 pg/mL | 2.1 ± 2.2 | 15.2 ± 47.3 | 0.074736 | 14.8 ± 42.6 | 0.500185 | 16.6 ± 47.6 | 0.674424 |
| TNF-α pg/mL | 31.3 ± 20.9 | 11.3 ± 6.4 | 0.046400 | 8.3 ± 3.7 | 0.892738 | 7.0 ± 3.3 | 0.207579 |
| IL-8 pg/mL | 12.3 ± 25.1 | 16.1 ± 33.1 | 0.916512 | 12.8 ± 28.2 | 0.224917 | 11.4 ± 27.9 | 0.575403 |
| VEGF pg/mL | 300.0 ± 296.6 | 41.9 ± 31.5 | 0.046400 | 23.4 ± 11.0 | 0.138012 | 19.2 ± 8.5 | 0.109746 |
| MMP-8 pg/mL | 27,146.7 ± 46815.2 | 824.5 ± 953.8 | 0.027709 | 613.2 ± 630.2 | 0.892738 | 653.3 ± 820.6 | 0.085832 |
| GM-CSF pg/mL | 4.0 ± 5.8 | 20.5 ± 50.7 | 0.027709 | 16.5 ± 44.8 | 0.079617 | 14.4 ± 42.5 | 0.674424 |
| Endostatin pg/mL | 22,311.2 ± 11,004.2 | 15,888.6 ± 6521.3 | 0.115852 | 15,113.6 ± 5470.2 | 0.685831 | 16,525.1 ± 6282.5 | 0.020880 |
| IgM µg/ml | 893.9 ± 403.3 | 895.6 ± 589.6 | 0.463072 | 1748.3 ± 3652.0 | 0.043115 | 672.3 ± 295.2 | 0.858955 |
| IgG1 µg/ml | 3023.1 ± 976.7 | 3261.7 ± 1150.8 | 0.115852 | 2832.4 ± 895.6 | 0.500185 | 3004.5 ± 1170.2 | 0.767097 |
| IgG2 µg/ml | 2525.4 ± 706.1 | 2748.1 ± 577.3 | 0.600180 | 2463.3 ± 1143.9 | 0.043115 | 2440.2 ± 1172.6 | 0.593955 |
| IgA µg/ml | 1122.6 ± 575.2 | 1402.4 ± 401.4 | 0.345448 | 1299.1 ± 531.5 | 0.138012 | 1616.8 ± 613.3 | 0.858955 |
| TGF-β pg/mL | 75,524.1 ± 48,366.6 | 38,528.0 ± 24,429.4 | 0.753153 | 31,352.1 ± 15,667.6 | 0.224917 | 18,229.9 ± 7626.1 | 0.441269 |
| C1q ng/mL | 74,341.3 ± 15,950.3 | 66,293.3 ± 10,730.0 | 0.345448 | 57,804.0 ± 10,912.3 | 0.079617 | 62,203.2 ± 14,231.9 | 0.109746 |
| C3 ng/mL | 1,073,842.6 ± 33,5210.1 | 825,772.8 ± 319,168.6 | 0.248865 | 775,648.4 ± 233,689.3 | 0.685831 | 886,776.8 ± 52,4181.1 | 0.313939 |
| C3b ng/mL | 725,974.3 ± 224,693.7 | 709,537.7 ± 420,208.4 | 0.916512 | 527,593.8 ± 173,738.1 | 0.685831 | 570,364.7 ± 339,324.7 | 0.593955 |
| C4 ng/mL | 349,806.2 ± 77,609.4 | 290,159.9 ± 45,897.4 | 0.172956 | 258,703.2 ± 49,847.2 | 0.138012 | 297,406.6 ± 79,357.7 | 0.085832 |
| FB ng/mL | 161,715.6 ± 51,009.2 | 152,373.0 ± 25,262.8 | 0.345448 | 131,307.2 ± 29,619.4 | 0.224917 | 156,274.2 ± 46,457.8 | 0.138642 |
| FH ng/mL | 272,343.5 ± 43,893.3 | 294,454.4 ± 40,040.9 | 0.916512 | 279,224.5 ± 44,034.6 | 0.500185 | 310,911.1 ± 65,094.0 | 0.085832 |
| C2 ng/mL | 2135.5 ± 2767.6 | 505.3 ± 180.5 | 0.027709 | 479.9 ± 43.3 | 0.345232 | 510.6 ± 253.0 | 0.017961 |
| C4B ng/mL | 16,275.8 ± 3673.2 | 11,980.9 ± 4470.4 | 0.074736 | 10,681.1 ± 4371.7 | 0.345232 | 10,904.2 ± 4829.6 | 0.260394 |
| C5 ng/mL | 15,195.8 ± 3875.5 | 12,433.8 ± 2067.0 | 0.046400 | 10,849.2 ± 2514.1 | 0.685831 | 11,349.3 ± 3280.7 | 0.952765 |
| C5A ng/mL | 707.5 ± 494.5 | 400.3 ± 180.6 | 0.115852 | 405.9 ± 198.1 | 0.892738 | 376.2 ± 218.8 | 0.400815 |
| Thrombospondin-2 pg/mL | 13,770.3 ± 9169.6 | 9444.4 ± 5078.18 | 0.027709 | 14,693.4 ± 8967.9 | 0.079617 | 18,946.0 ± 10,057.7 | 0.020880 |
Disclaimer/Publisher’s Note: The statements, opinions and data contained in all publications are solely those of the individual author(s) and contributor(s) and not of MDPI and/or the editor(s). MDPI and/or the editor(s) disclaim responsibility for any injury to people or property resulting from any ideas, methods, instructions or products referred to in the content. |
© 2024 by the authors. Licensee MDPI, Basel, Switzerland. This article is an open access article distributed under the terms and conditions of the Creative Commons Attribution (CC BY) license (https://creativecommons.org/licenses/by/4.0/).
Share and Cite
Janowski, M.; Łuczkowska, K.; Gniot, M.; Lewandowski, K.; Safranow, K.; Helbig, G.; Machaliński, B.; Paczkowska, E. The Depth of the Molecular Response in Patients with Chronic Myeloid Leukemia Correlates with Changes in Humoral Immunity. J. Clin. Med. 2024, 13, 2353. https://doi.org/10.3390/jcm13082353
Janowski M, Łuczkowska K, Gniot M, Lewandowski K, Safranow K, Helbig G, Machaliński B, Paczkowska E. The Depth of the Molecular Response in Patients with Chronic Myeloid Leukemia Correlates with Changes in Humoral Immunity. Journal of Clinical Medicine. 2024; 13(8):2353. https://doi.org/10.3390/jcm13082353
Chicago/Turabian StyleJanowski, Michał, Karolina Łuczkowska, Michał Gniot, Krzysztof Lewandowski, Krzysztof Safranow, Grzegorz Helbig, Bogusław Machaliński, and Edyta Paczkowska. 2024. "The Depth of the Molecular Response in Patients with Chronic Myeloid Leukemia Correlates with Changes in Humoral Immunity" Journal of Clinical Medicine 13, no. 8: 2353. https://doi.org/10.3390/jcm13082353