Genetic and Epigenetic Biomarkers of Immune Checkpoint Blockade Response

 , and
, and 
Abstract
:1. Introduction
2. Induction of Inhibitory Immune Checkpoints (ICs) as a Major Mechanism of Tumor Immune Evasion
3. Mechanisms of Clinically Targeted ICR Signaling pathways
3.1. PD-1 Signaling
3.2. CTLA-4 Signaling
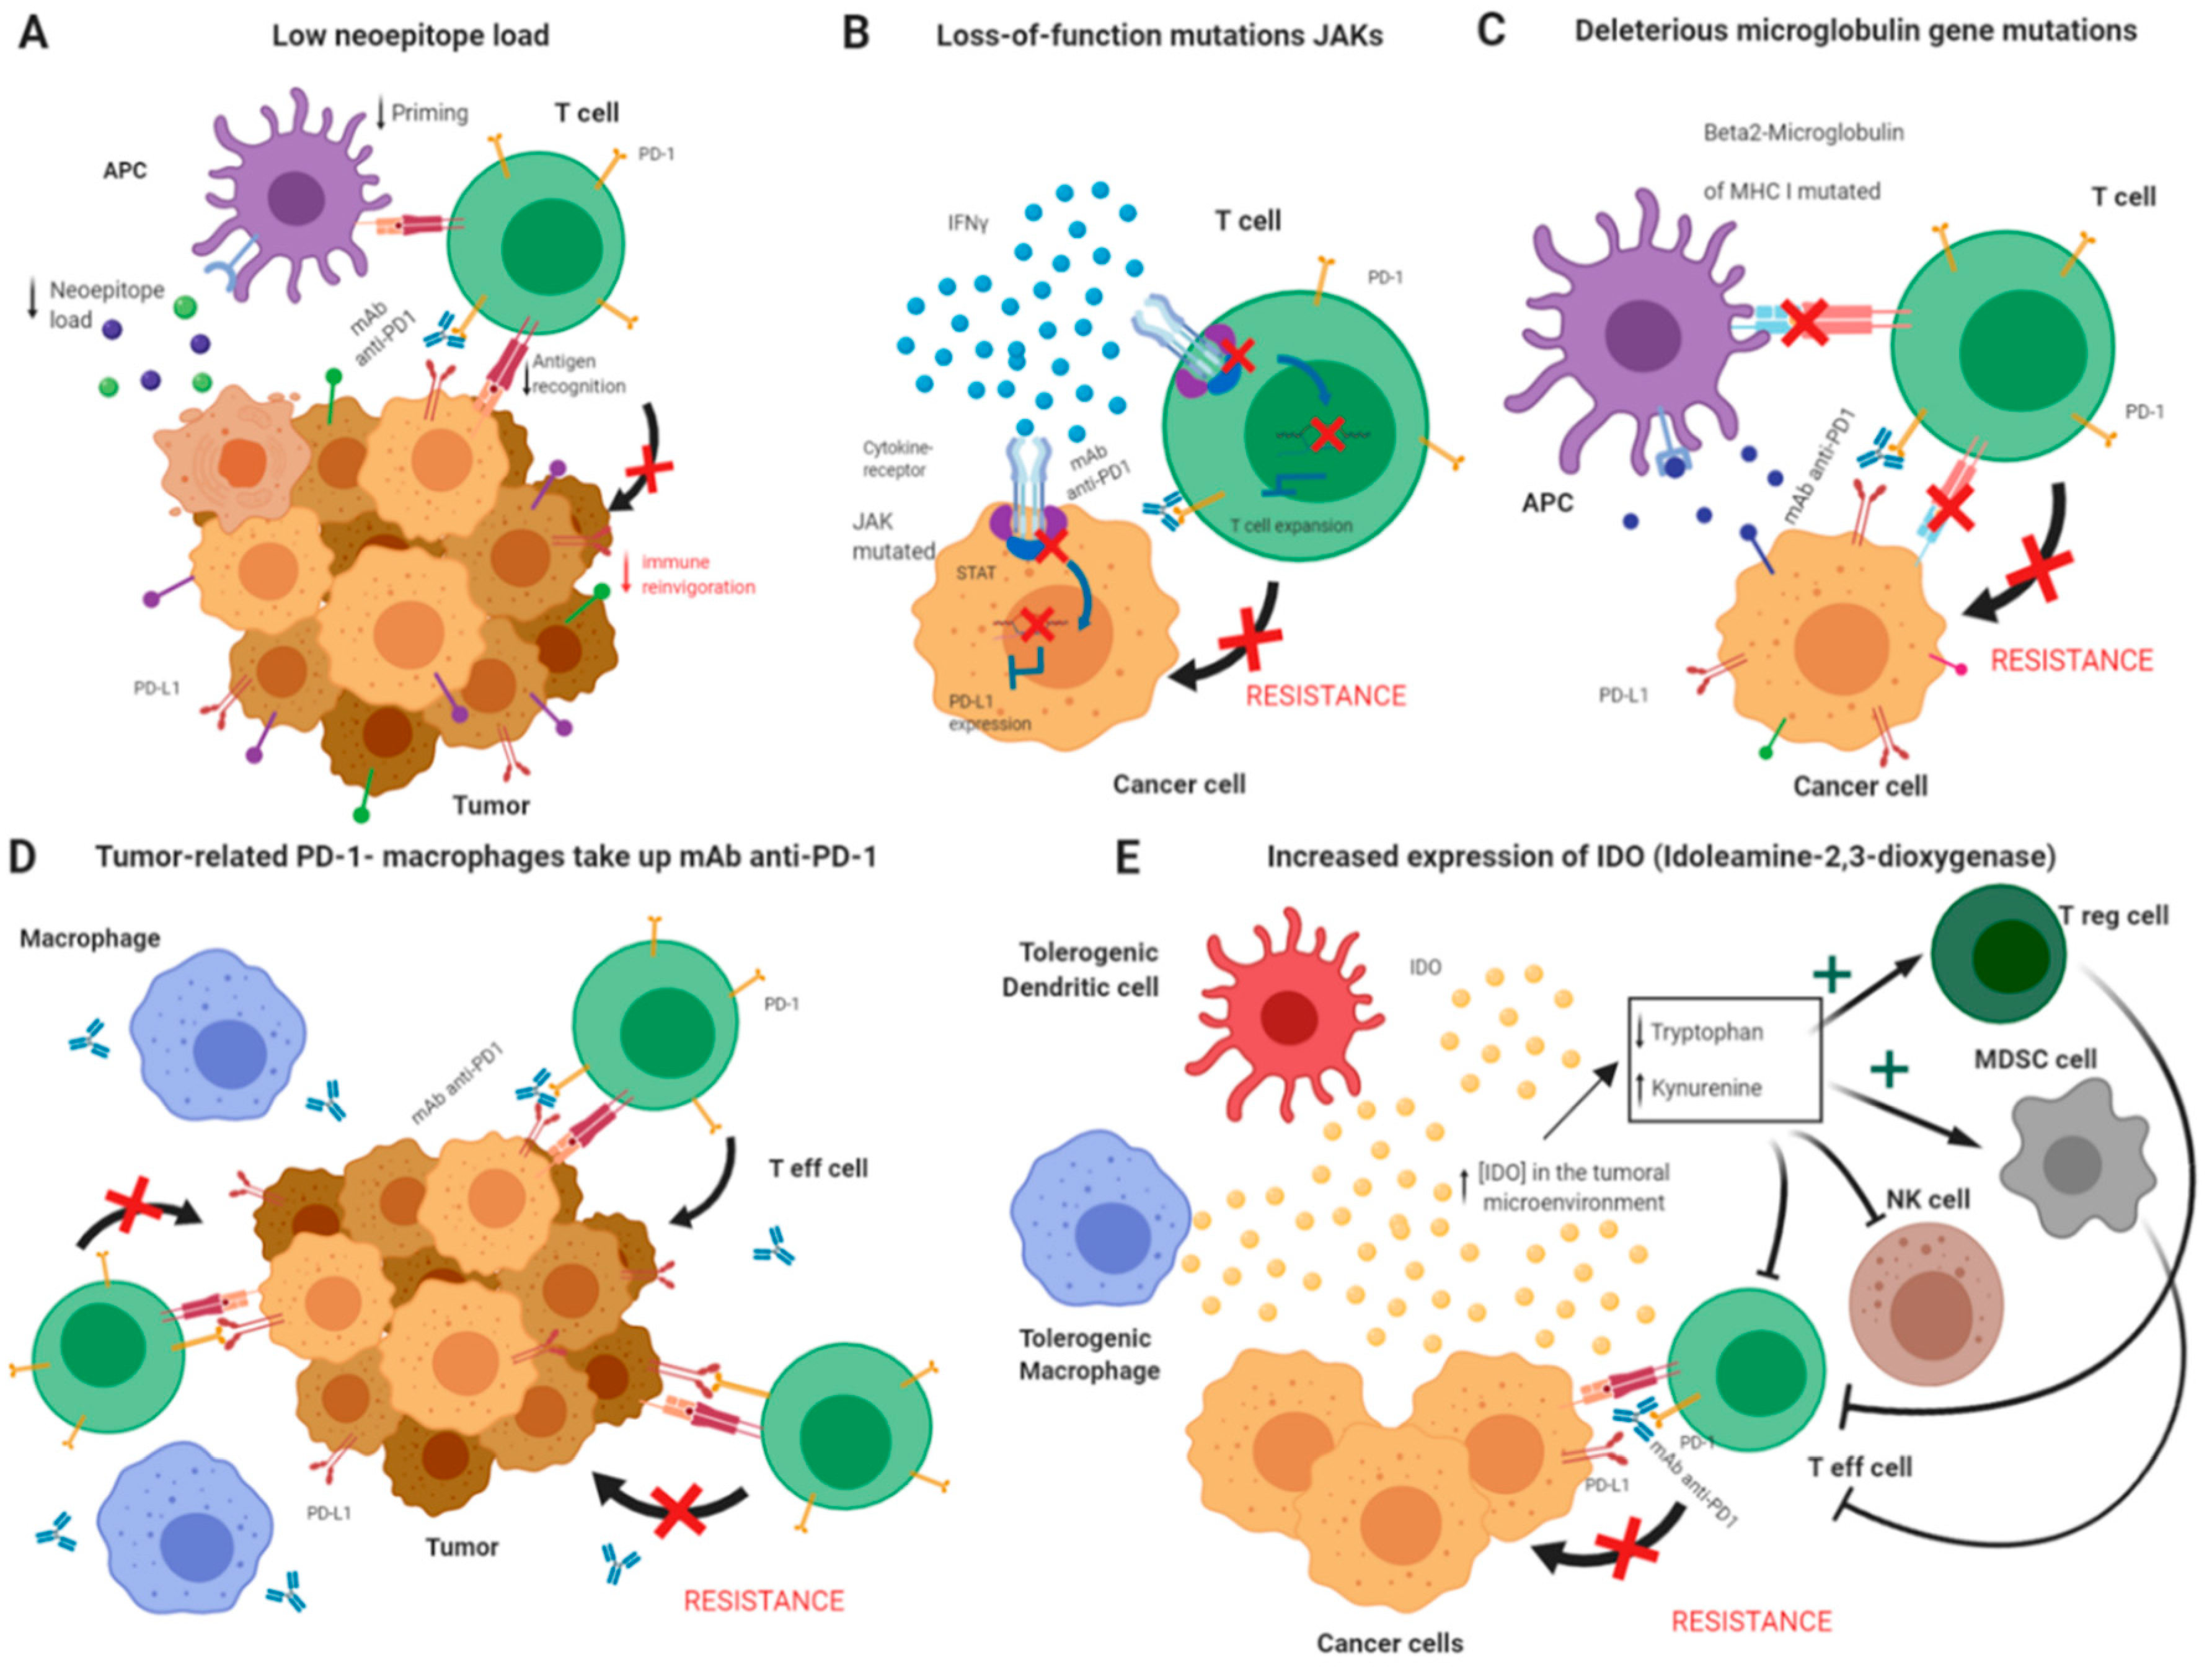
4. Molecular Underpinnings of ICB Failure
Resistance Mechanisms
5. ICB Response Biomarker Candidates
5.1. Solid Biopsy Biomarker Candidates
5.1.1. Genetic and Epigenetic Markers
5.1.2. Transcriptional Biomarkers
5.1.3. Histopathological Biomarkers
5.1.4. Cellular Biomarkers
5.2. Liquid Biopsy Biomarker Candidates
6. DNA Methylation and Hydroxymethylation as Potential Biomarkers of Response to Cancer Immunotherapy
6.1. Involvement of DNA Methylation and Hydroxymethylation in Tumor Immune Evasion
6.2. Emerging Evidence Supporting the Roles of DNA Methylation and Hydroxymethylation as Epigenetic Predictors of ICB Response
7. Future Perspectives and Conclusions
Author Contributions
Funding
Acknowledgments
Conflicts of Interest
References
- Galon, J.; Bruni, D. Approaches to treat immune hot, altered and cold tumours with combination immunotherapies. Nat. Rev. Drug Discov. 2019, 18, 197–218. [Google Scholar] [CrossRef]
- Schreiber, R.D.; Old, L.J.; Smyth, M.J. Cancer Immunoediting: Integrating Immunity’s Roles in Cancer Suppression and Promotion. Science 2011, 331, 1565–1570. [Google Scholar] [CrossRef] [PubMed] [Green Version]
- Pardoll, D.M. The blockade of immune checkpoints in cancer immunotherapy. Nat. Rev. Cancer 2012, 12, 252–264. [Google Scholar] [CrossRef] [PubMed] [Green Version]
- Ribas, A.; Wolchok, J.D. Cancer immunotherapy using checkpoint blockade. Science 2018, 359, 1350–1355. [Google Scholar] [CrossRef] [Green Version]
- Sheppard, K.A.; Fitz, L.J.; Lee, J.M.; Benander, C.; George, J.A.; Wooters, J.; Qiu, Y.; Jussif, J.M.; Carter, L.L.; Wood, C.R.; et al. PD-1 inhibits T-cell receptor induced phosphorylation of the ZAP70/CD3ζ signalosome and downstream signaling to PKCθ. FEBS Lett. 2004, 574, 37–41. [Google Scholar] [CrossRef] [Green Version]
- Okazaki, T.; Maeda, A.; Nishimura, H.; Kurosaki, T.; Honjo, T. PD-1 immunoreceptor inhibits B cell receptor-mediated signaling by recruiting src homology 2-domain-containing tyrosine phosphatase 2 to phosphotyrosine. Proc. Natl. Acad. Sci. USA 2001, 98, 13866–13871. [Google Scholar] [CrossRef] [PubMed] [Green Version]
- Francisco, L.M.; Salinas, V.H.; Brown, K.E.; Vanguri, V.K.; Freeman, G.J.; Kuchroo, V.K.; Sharpe, A.H. PD-L1 regulates the development, maintenance, and function of induced regulatory T cells. J. Exp. Med. 2009, 206, 3015–3029. [Google Scholar] [CrossRef]
- Terme, M.; Ullrich, E.; Aymeric, L.; Meinhardt, K.; Desbois, M.; Delahaye, N.; Viaud, S.; Ryffel, B.; Yagita, H.; Kaplanski, G.; et al. IL-18 induces PD-1-dependent immunosuppression in cancer. Cancer Res. 2011, 71, 5393–5399. [Google Scholar] [CrossRef] [PubMed] [Green Version]
- Ribas, A. Tumor Immunotherapy Directed at PD-1. N. Engl. J. Med. 2012, 366, 2517–2519. [Google Scholar] [CrossRef] [Green Version]
- Wei, S.C.; Levine, J.H.; Cogdill, A.P.; Zhao, Y.; Anang, N.-A.A.S.; Andrews, M.C.; Sharma, P.; Wang, J.; Wargo, J.A.; Pe’er, D.; et al. Distinct Cellular Mechanisms Underlie Anti-CTLA-4 and Anti-PD-1 Checkpoint Blockade. Cell 2017, 170, 1120–1133. [Google Scholar] [CrossRef] [Green Version]
- Ma, W.; Gilligan, B.M.; Yuan, J.; Li, T. Current status and perspectives in translational biomarker research for PD-1/PD-L1 immune checkpoint blockade therapy. J. Hematol. Oncol. 2016, 9, 47. [Google Scholar] [CrossRef] [PubMed] [Green Version]
- Sharma, P.; Hu-Lieskovan, S.; Wargo, J.A.; Ribas, A. Primary, Adaptive, and Acquired Resistance to Cancer Immunotherapy. Cell 2017, 168, 707–723. [Google Scholar] [CrossRef] [PubMed] [Green Version]
- Thorsson, V.; Gibbs, D.L.; Brown, S.D.; Wolf, D.; Bortone, D.S.; Ou Yang, T.-H.; Porta-Pardo, E.; Gao, G.F.; Plaisier, C.L.; Eddy, J.A.; et al. The Immune Landscape of Cancer. Immunity 2018, 48, 812–830. [Google Scholar] [CrossRef] [PubMed] [Green Version]
- Ribas, A.; Kefford, R.; Marshall, M.A.; Punt, C.J.A.; Haanen, J.B.; Marmol, M.; Garbe, C.; Gogas, H.; Schachter, J.; Linette, G.; et al. Phase III randomized clinical trial comparing tremelimumab with standard-of-care chemotherapy in patients with advanced melanoma. J. Clin. Oncol. 2013, 31, 616–622. [Google Scholar] [CrossRef] [Green Version]
- Hodi, F.S.; O’Day, S.J.; McDermott, D.F.; Weber, R.W.; Sosman, J.A.; Haanen, J.B.; Gonzales, R.; Robert, C.; Schadendorf, D.; Hassel, J.C.; et al. Improved Survival with Ipilimumab in Patients with Metastatic Melanoma Abstract. N. Engl. J. Med. 2010, 30, 711–734. [Google Scholar] [CrossRef]
- Ribas, A.; Puzanov, I.; Dummer, R.; Schadendorf, D.; Hamid, O.; Robert, C.; Hodi, F.S.; Schachter, J.; Pavlick, A.C.; Lewis, K.D.; et al. Pembrolizumab versus investigator-choice chemotherapy for ipilimumab-refractory melanoma (KEYNOTE-002): A randomised, controlled, phase 2 trial. Lancet Oncol. 2015, 16, 908–918. [Google Scholar] [CrossRef]
- Rey, J.; Weber, S.; D’Angelo, S.P.; Minor, D.; Hodi, S.; Gutzmer, R.; Hoeller, C.; Khushalani, N.I.; Miller, W.H., Jr.; Lao, C.D.; et al. Nivolumab versus chemotherapy in patients with advanced melanoma who progressed after anti-CTLA-4 treatment (CheckMate 037): A randomised, controlled, open-label, phase 3 trial. Lancet Oncol. 2015, 16, 375. [Google Scholar]
- Wolchok, J.D.; Kluger, H.; Callahan, M.K.; Postow, M.A.; Rizvi, N.A.; Lesokhin, A.M.; Segal, N.H.; Ariyan, C.E.; Gordon, R.A.; Reed, K.; et al. Nivolumab plus Ipilimumab in Advanced Melanoma. N. Engl. J. Med. 2013, 369, 122–155. [Google Scholar] [CrossRef] [Green Version]
- Larkin, J.; Chiarion-Sileni, V.; Gonzalez, R.; Grob, J.J.; Cowey, C.L.; Lao, C.D.; Schadendorf, D.; Dummer, R.; Smylie, M.; Rutkowski, P.; et al. Combined Nivolumab and Ipilimumab or Monotherapy in Untreated Melanoma. N. Engl. J. Med. 2015, 373, 23–34. [Google Scholar] [CrossRef] [Green Version]
- Bergman, Y.; Cedar, H. DNA methylation dynamics in health and disease. Nat. Struct. Mol. Biol. 2013, 20, 274–281. [Google Scholar] [CrossRef]
- Jeschke, J.; Collignon, E.; Fuks, F. Portraits of TET-mediated DNA hydroxymethylation in cancer. Curr. Opin. Genet. Dev. 2016, 36, 16–26. [Google Scholar] [CrossRef] [PubMed]
- Smith, Z.D.; Meissner, A. DNA methylation: Roles in mammalian development. Nat. Rev. Genet. 2013, 14, 204–220. [Google Scholar] [CrossRef] [PubMed]
- Feng, Y.; Rudensky, A.Y. DNA methylation secures CD4+ and CD8+ T cell lineage borders. Nat. Immunol. 2015, 16, 681–683. [Google Scholar] [CrossRef] [PubMed]
- Tsagaratou, A.; Aijo, T.; Lio, C.-W.J.; Yue, X.; Huang, Y.; Jacobsen, S.E.; Lähdesmäki, H.; Rao, A. Dissecting the dynamic changes of 5-hydroxymethylcytosine in T-cell development and differentiation. Proc. Natl. Acad. Sci. USA 2014, 111, E3306–E3315. [Google Scholar] [CrossRef] [Green Version]
- Chirichella, M.; Kwee, I.; Vincenzetti, L.; Monticelli, S.; Leoni, C. The contribution of active and passive mechanisms of 5mC and 5hmC removal in human T lymphocytes is differentiation- and activation-dependent. Eur. J. Immunol. 2019, 49, 611–625. [Google Scholar]
- Ye, C.; Tao, R.; Cao, Q.; Zhu, D.; Wang, Y.; Wang, J.; Lu, J.; Chen, E.; Li, L. Whole-genome DNA methylation and hydroxymethylation profiling for HBV-related hepatocellular carcinoma. Int. J. Oncol. 2016, 49, 589–602. [Google Scholar] [CrossRef]
- Heyn, H.; Esteller, M. DNA methylation profiling in the clinic: Applications and challenges. Nat. Rev. Genet. 2012, 13, 679–692. [Google Scholar] [CrossRef]
- Duruisseaux, M.; Martínez-Cardús, A.; Calleja-Cervantes, M.E.; Moran, S.; Castro de Moura, M.; Davalos, V.; Piñeyro, D.; Sanchez-Cespedes, M.; Girard, N.; Brevet, M.; et al. Epigenetic prediction of response to anti-PD-1 treatment in non-small-cell lung cancer: A multicentre, retrospective analysis. Lancet Respir Med. 2018, 6, 771–781. [Google Scholar] [CrossRef]
- Mittal, D.; Gubin, M.M.; Schreiber, R.D.; Smyth, M.J. New insights into cancer immunoediting and its three component phases-elimination, equilibrium and escape. Curr. Opin. Immunol. 2014, 27, 16–25. [Google Scholar] [CrossRef] [Green Version]
- Whiteside, T.L.; Demaria, S.; Rodriguez-Ruiz, M.E.; Zarour, H.M.; Melero, I. Emerging opportunities and challenges in cancer immunotherapy. Clin. Cancer Res. 2016, 22, 1845–1855. [Google Scholar] [CrossRef] [Green Version]
- David, J.M.; Dominguez, C.; McCampbell, K.K.; Gulley, J.L.; Schlom, J.; Palena, C. A novel bifunctional anti-PD-L1/TGF-β Trap fusion protein (M7824) efficiently reverts mesenchymalization of human lung cancer cells. Oncoimmunology 2017, 6, e1349589. [Google Scholar] [CrossRef] [PubMed] [Green Version]
- Voron, T.; Colussi, O.; Marcheteau, E.; Pernot, S.; Nizard, M.; Pointet, A.-L.; Latreche, S.; Bergaya, S.; Benhamouda, N.; Tanchot, C.; et al. VEGF-A modulates expression of inhibitory checkpoints on CD8 + T cells in tumors. J. Exp. Med. 2015, 212, 139–148. [Google Scholar] [CrossRef] [PubMed]
- Parker, K.H.; Beury, D.W.; Ostrand-Rosenberg, S. Myeloid-Derived Suppressor Cells: Critical Cells Driving Immune Suppression in the Tumor Microenvironment. Adv. Cancer Res. 2015, 128, 95–139. [Google Scholar] [PubMed] [Green Version]
- Campbell, D.J. Control of Regulatory T Cell Migration, Function, and Homeostasis. J Immunol. 2015, 195, 2507–2513. [Google Scholar] [CrossRef] [PubMed] [Green Version]
- O’Donnell, J.S.; Teng, M.W.L.; Smyth, M.J. Cancer immunoediting and resistance to T cell-based immunotherapy. Nat. Rev. Clin. Oncol. 2019, 16, 151–167. [Google Scholar] [CrossRef] [PubMed]
- Verdegaal, E.M.E.; de Miranda, N.F.C.C.; Visser, M.; Harryvan, T.; van Buuren, M.M.; Andersen, R.S.; Hadrup, S.R.; van der Minne, C.E.; Schotte, R.; Spits, H.; et al. Neoantigen landscape dynamics during human melanoma-T cell interactions. Nature 2016, 536, 91–95. [Google Scholar] [CrossRef]
- Zaretsky, J.M.; Garcia-Diaz, A.; Shin, D.S.; Escuin-Ordinas, H.; Hugo, W.; Hu-Lieskovan, S.; Torrejon, D.Y.; Abril-Rodriguez, G.; Sandoval, S.; Barthly, L.; et al. Mutations Associated with Acquired Resistance to PD-1 Blockade in Melanoma. N. Engl. J. Med. 2016, 375, 819–829. [Google Scholar] [CrossRef]
- Campoli, M.; Ferrone, S. Tumor escape mechanisms: Potential role of soluble HLA antigens and NK cells activating ligands. Tissue Antigens 2008, 72, 321–334. [Google Scholar] [CrossRef] [Green Version]
- Luke, J.J.; Flaherty, K.T.; Ribas, A.; Long, G.V. Targeted agents and immunotherapies: Optimizing outcomes in melanoma. Nat. Rev. Clin. Oncol. 2017, 14, 463–482. [Google Scholar] [CrossRef] [Green Version]
- Moskophidis, D.; Lechner, F.; Pircher, H.; Zinkernagel, R.M. Virus persistence in acutely infected immunocompetent mice by exhaustion of antiviral cytotoxic effector T cells. Nature 1993, 362, 758–761. [Google Scholar] [CrossRef]
- Gibbons, R.M.; Liu, X.; Pulko, V.; Harrington, S.M.; Krco, C.J.; Kwon, E.D.; Dong, H. B7-H1 limits the entry of effector CD8+ T cells to the memory pool by upregulating bim. Oncoimmunology 2012, 1, 1061–1073. [Google Scholar] [CrossRef] [PubMed] [Green Version]
- Schietinger, A.; Greenberg, P.D. Tolerance and exhaustion: Defining mechanisms of T cell dysfunction. Trends Immunol. 2014, 35, 51–60. [Google Scholar] [CrossRef] [PubMed] [Green Version]
- Fourcade, J.; Sun, Z.; Benallaoua, M.; Guillaume, P.; Luescher, I.F.; Sander, C.; Kirkwood, J.M.; Kuchroo, V.; Zarour, H.M. Upregulation of Tim-3 and PD-1 expression is associated with tumor antigen–specific CD8 + T cell dysfunction in melanoma patients. J. Exp. Med. 2010, 207, 2175–2186. [Google Scholar] [CrossRef] [PubMed]
- Sakuishi, K.; Apetoh, L.; Sullivan, J.M.; Blazar, B.R.; Kuchroo, V.K.; Anderson, A.C. Targeting Tim-3 and PD-1 pathways to reverse T cell exhaustion and restore anti-tumor immunity. J. Exp. Med. 2011, 208, 1331. [Google Scholar] [CrossRef]
- Zhou, Q.; Munger, M.E.; Veenstra, R.G.; Weigel, B.J.; Hirashima, M.; Munn, D.H.; Murphy, W.J.; Azuma, M.; Anderson, A.C.; Kuchroo, V.K.; et al. Coexpression of Tim-3 and PD-1 identifies a CD8+ T-cell exhaustion phenotype in mice with disseminated acute myelogenous leukemia. Blood 2011, 117, 4501–4510. [Google Scholar] [CrossRef] [PubMed]
- Curran, M.A.; Montalvo, W.; Yagita, H.; Allison, J.P. PD-1 and CTLA-4 combination blockade expands infiltrating T cells and reduces regulatory T and myeloid cells within B16 melanoma tumors. Proc. Natl. Acad. Sci. USA 2010, 107, 4275–4280. [Google Scholar] [CrossRef] [Green Version]
- Baumeister, S.H.; Freeman, G.J.; Dranoff, G.; Sharpe, A.H. Coinhibitory Pathways in Immunotherapy for Cancer. Annu. Rev. Immunol. 2016, 34, 539–573. [Google Scholar] [CrossRef]
- Gordon, S.R.; Maute, R.L.; Dulken, B.W.; Hutter, G.; George, B.M.; McCracken, M.N.; Gupta, R.; Tsai, J.M.; Sinha, R.; Corey, D.; et al. PD-1 expression by tumour-associated macrophages inhibits phagocytosis and tumour immunity. Nature 2017, 545, 495–499. [Google Scholar] [CrossRef]
- Hui, E.; Cheung, J.; Zhu, J.; Su, X.; Taylor, M.J.; Wallweber, H.A.; Sasmal, D.K.; Huang, J.; Kim, J.M.; Mellman, I.; et al. T cell costimulatory receptor CD28 is a primary target for PD-1–mediated inhibition. Science 2017, 355, 1428–1433. [Google Scholar] [CrossRef]
- Fife, B.T.; Pauken, K.E.; Eagar, T.N.; Obu, T.; Wu, J.; Tang, Q.; Azuma, M.; Krummel, M.F.; Bluestone, J.A. Interactions between PD-1 and PD-L1 promote tolerance by blocking the TCR–induced stop signal. Nat. Immunol. 2009, 10, 1185–1192. [Google Scholar] [CrossRef]
- Hirano, F.; Kaneko, K.; Tamura, H.; Dong, H.; Wang, S.; Ichikawa, M.; Rietz, C.; Flies, D.B.; Lau, J.S.; Zhu, G.; et al. Blockade of B7-H1 and PD-1 by monoclonal antibodies potentiates cancer therapeutic immunity. Cancer Res. 2005, 65, 1089–1096. [Google Scholar] [PubMed]
- Rooney, M.S.; Shukla, S.A.; Wu, C.J.; Getz, G.; Hacohen, N. Molecular and genetic properties of tumors associated with local immune cytolytic activity. Cell 2015, 160, 48–61. [Google Scholar] [CrossRef] [PubMed] [Green Version]
- Zinselmeyer, B.H.; Heydari, S.; Sacristán, C.; Nayak, D.; Cammer, M.; Herz, J.; Cheng, X.; Davis, S.J.; Dustin, M.L.; McGavern, D.B. PD-1 promotes immune exhaustion by inducing antiviral T cell motility paralysis. J. Exp. Med. 2013, 210, 757–774. [Google Scholar] [CrossRef] [PubMed] [Green Version]
- Wang, W.; Lau, R.; Yu, D.; Zhu, W.; Korman, A.; Weber, J. PD1 blockade reverses the suppression of melanoma antigen-specific CTL by CD4+CD25Hi regulatory T cells. Int Immunol. 2009, 21, 1065–1077. [Google Scholar] [CrossRef] [Green Version]
- Gros, A.; Parkhurst, M.R.; Tran, E.; Pasetto, A.; Robbins, P.F.; Ilyas, S.; Prickett, T.D.; Gartner, J.J.; Crystal, J.S.; Roberts, I.M.; et al. Prospective identification of neoantigen-specific lymphocytes in the peripheral blood of melanoma patients. Nat. Med. 2016, 22, 433–438. [Google Scholar] [CrossRef]
- Stevanović, S.; Pasetto, A.; Helman, S.R.; Gartner, J.J.; Prickett, T.D.; Howie, B.; Robins, H.S.; Robbins, P.F.; Klebanoff, C.A.; Rosenberg, S.A.; et al. Landscape of immunogenic tumor antigens in successful immunotherapy of virally induced epithelial cancer. Science 2017, 356, 200–205. [Google Scholar] [CrossRef]
- Walker, L.S.K.; Sansom, D.M. Confusing signals: Recent progress in CTLA-4 biology. Trends Immunol. 2015, 36, 63–70. [Google Scholar] [CrossRef] [Green Version]
- Wing, K.; Onishi, Y.; Prieto-Martin, P.; Yamaguchi, T.; Miyara, M.; Fehervari, Z.; Nomura, T.; Sakaguchi, S. CTLA-4 Control over Foxp3 + Regulatory T Cell Function. Proc. Natl. Acad. Sci. USA 2008, 322, 271–275. [Google Scholar] [CrossRef]
- Keir, M.E.; Butte, M.J.; Freeman, G.J.; Sharpe, A.H. PD-1 and Its Ligands in Tolerance and Immunity. Annu. Rev. Immunol. 2008, 26, 677–704. [Google Scholar] [CrossRef] [Green Version]
- Nurieva, R.; Thomas, S.; Nguyen, T.; Martin-Orozco, N.; Wang, Y.; Kaja, M.K.; Yu, X.Z.; Dong, C. T-cell tolerance or function is determined by combinatorial costimulatory signals. EMBO J. 2006, 25, 2623–2633. [Google Scholar] [CrossRef] [Green Version]
- Matheu, M.P.; Othy, S.; Greenberg, M.L.; Dong, T.X.; Schuijs, M.; Deswarte, K.; Hammad, H.; Lambrecht, B.N.; Parker, I.; Cahalan, M.D. Imaging regulatory T cell dynamics and CTLA4-mediated suppression of T cell priming. Nat. Commun. 2015, 6, 1–11. [Google Scholar] [CrossRef] [PubMed] [Green Version]
- Onishi, Y.; Fehervari, Z.; Yamaguchi, T.; Sakaguchi, S. Foxp3+ natural regulatory T cells preferentially form aggregates on dendritic cells in vitro and actively inhibit their maturation. Proc. Natl. Acad. Sci. USA 2008, 105, 10113–10118. [Google Scholar] [CrossRef] [PubMed] [Green Version]
- Schneider, H.; Downey, J.; Smith, A.; Zinselmeyer, B.H.; Rush, C.; Brewer, J.M.; Wei, B.; Hogg, N.; Garside, P.; Rudd, C.E. Reversal of the TCR Stop Signal by CTLA-4. Science 2006, 313, 1972–1975. [Google Scholar] [CrossRef] [PubMed] [Green Version]
- Wang, C.J.; Heuts, F.; Ovcinnikovs, V.; Wardzinski, L.; Bowers, C.; Schmidt, E.M.; Kogimtzis, A.; Kenefeck, R.; Sansom, D.M.; Walker, L.S. CTLA-4 controls follicular helper T-cell differentiation by regulating the strength of CD28 engagement. Proc. Natl. Acad. Sci. USA 2014, 112, 524–529. [Google Scholar] [CrossRef] [Green Version]
- Champiat, S.; Dercle, L.; Ammari, S.; Massard, C.; Hollebecque, A.; Postel-Vinay, S.; Chaput, N.; Eggermont, A.; Marabelle, A.; Soria, J.C.; et al. Hyperprogressive Disease Is a New Pattern of Progression in Cancer Patients Treated by Anti-PD-1/PD-L1. Clin. Cancer Res. 2017, 23, 1920–1928. [Google Scholar] [CrossRef] [Green Version]
- Marusyk, A.; Almendro, V.; Polyak, K. Intra-tumour heterogeneity: A looking glass for cancer? Nat. Rev. Cancer. 2012, 12, 323–334. [Google Scholar] [CrossRef]
- Li, M.; Li, A.; Zhou, S.; Xu, Y.; Xiao, Y.; Bi, R.; Yang, W. Heterogeneity of PD-L1 expression in primary tumors and paired lymph node metastases of triple negative breast cancer. BMC Cancer 2018, 18, 4. [Google Scholar] [CrossRef] [Green Version]
- McGranahan, N.; Furness, A.J.S.; Rosenthal, R.; Ramskov, S.; Lyngaa, R.; Saini, S.K.; Jamal-Hanjani, M.; Wilson, G.A.; Birkbak, N.J.; Hiley, C.T.; et al. Clonal neoantigens elicit T cell immunoreactivity and sensitivity to immune checkpoint blockade. Science 2016, 351, 1463–1469. [Google Scholar] [CrossRef] [Green Version]
- Snyder, A.; Makarov, V.; Merghoub, T.; Yuan, J.; Zaretsky, J.M.; Desrichard, A.; Walsh, L.A.; Postow, M.A.; Wong, P.; Ho, T.S.; et al. Genetic basis for clinical response to CTLA-4 blockade in melanoma. N. Engl. J. Med. 2014, 371, 2189–2199. [Google Scholar] [CrossRef]
- Hugo, W.; Zaretsky, J.M.; Sun, L.; Song, C.; Moreno, B.H.; Hu-Lieskovan, S.; Berent-Maoz, B.; Pang, J.; Chmielowski, B.; Cherry, G.; et al. Genomic and Transcriptomic Features of Response to Anti-PD-1 Therapy in Metastatic Melanoma. Cell 2016, 165, 35–44. [Google Scholar] [CrossRef] [Green Version]
- Rizvi, N.A.; Hellmann, M.D.; Snyder, A.; Kvistborg, P.; Makarov, V.; Havel, J.J.; Lee, W.; Yuan, J.; Wong, P.; Ho, T.S.; et al. Cancer immunology. Mutational landscape determines sensitivity to PD-1 blockade in non-small cell lung cancer. Science 2015, 348, 124–128. [Google Scholar] [CrossRef] [PubMed] [Green Version]
- Van Allen, E.M.; Miao, D.; Schilling, B.; Shukla, S.A.; Blank, C.; Zimmer, L.; Sucker, A.; Hillen, U.; Foppen, M.H.G.; Goldinger, S.M.; et al. Genomic correlates of response to CTLA-4 blockade in metastatic melanoma HHS Public Access. Science 2015, 350, 207–211. [Google Scholar] [CrossRef] [PubMed] [Green Version]
- Riaz, N.; Havel, J.J.; Makarov, V.; Desrichard, A.; Urba, W.J.; Sims, J.S.; Hodi, F.S.; Martín-Algarra, S.; Mandal, R.; Sharfman, W.H.; et al. Tumor and Microenvironment Evolution during Immunotherapy with Nivolumab. Cell 2017, 171, 934–949. [Google Scholar] [CrossRef] [PubMed] [Green Version]
- Anagnostou, V.; Smith, K.N.; Forde, P.M.; Niknafs, N.; Bhattacharya, R.; White, J.; Zhang, T.; Adleff, V.; Phallen, J.; Wali, N.; et al. Evolution of Neoantigen Landscape during Immune Checkpoint Blockade in Non–Small Cell Lung Cancer. Cancer Discov. 2017, 7, 264–276. [Google Scholar] [CrossRef] [PubMed] [Green Version]
- Kato, S.; Goodman, A.; Walavalkar, V.; Barkauskas, D.A.; Sharabi, A.; Kurzrock, R. Hyperprogressors after immunotherapy: Analysis of genomic alterations associated with accelerated growth rate. Clin. Cancer Res. 2017, 23, 4242–4250. [Google Scholar] [CrossRef] [PubMed] [Green Version]
- Spranger, S.; Bao, R.; Gajewski, T.F. Melanoma-intrinsic b-catenin signalling prevents anti-tumour immunity. Nature 2015, 523, 231–235. [Google Scholar] [CrossRef]
- Tumeh, P.C.; Harview, C.L.; Yearley, J.H.; Shintaku, I.P.; Taylor, E.J.M.; Robert, L.; Chmielowski, B.; Spasic, M.; Henry, G.; Ciobanu, V.; et al. PD-1 blockade induces responses by inhibiting adaptive immune resistance. Nature 2014, 515, 568–571. [Google Scholar] [CrossRef]
- Abdel-Rahman, O.; Morris, D. Immune checkpoint inhibitors and non-small-cell lung cancer management: 2018 update. Immunotherapy 2019, 11, 149–153. [Google Scholar] [CrossRef]
- Rizvi, H.; Sanchez-Vega, F.; La, K.; Chatila, W.; Jonsson, P.; Halpenny, D.; Plodkowski, A.; Long, N.; Sauter, J.L.; Rekhtman, N.; et al. Molecular determinants of response to anti-programmed cell death (PD)-1 and anti-programmed death-ligand 1 (PD-L1) blockade in patients with non-small-cell lung cancer profiled with targeted next-generation sequencing. J. Clin. Oncol. 2018, 36, 633–641. [Google Scholar] [CrossRef]
- Goldberg, S.B.; Narayan, A.; Kole, A.J.; Decker, R.H.; Teysir, J.; Carriero, N.J.; Lee, A.; Nemati, R.; Nath, S.K.; Mane, S.M.; et al. Early Assessment of Lung Cancer Immunotherapy Response via Circulating Tumor DNA. Clin. Cancer Res. 2018, 24, 1872–1880. [Google Scholar] [CrossRef] [Green Version]
- Blons, H.; Garinet, S.; Laurent-Puig, P.; Oudart, J.-B. Molecular markers and prediction of response to immunotherapy in non-small cell lung cancer, an update. J. Thorac. Dis. 2019, 11, S25–S36. [Google Scholar] [CrossRef] [PubMed]
- Queirolo, P.; Dozin, B.; Morabito, A.; Banelli, B.; Piccioli, P.; Fava, C.; Leo, C.; Carosio, R.; Laurent, S.; Fontana, V.; et al. Association of CTLA-4 gene variants with response to therapy and long-term survival in metastatic melanoma patients treated with ipilimumab: An Italian melanoma intergroup study. Front. Immunol. 2017, 8, 386. [Google Scholar] [CrossRef] [PubMed] [Green Version]
- Le, D.T.; Durham, J.N.; Smith, K.N.; Wang, H.; Bartlett, B.R.; Aulakh, L.K.; Lu, S.; Kemberling, H.; Wilt, C.; Luber, B.S.; et al. Mismatch repair deficiency predicts response of solid tumors to PD-1 blockade. Science 2017, 357, 409–413. [Google Scholar] [CrossRef] [PubMed] [Green Version]
- Teo, M.Y.; Seier, K.; Ostrovnaya, I.; Regazzi, A.M.; Kania, B.E.; Moran, M.M.; Cipolla, C.K.; Bluth, M.J.; Chaim, J.; Al-Ahmadie, H.; et al. Alterations in DNA Damage Response and Repair Genes as Potential Marker of Clinical Benefit From PD-1/PD-L1 Blockade in Advanced Urothelial Cancers. J. Clin. Oncol. 2018, 36, 1685. [Google Scholar] [CrossRef] [PubMed]
- Dong, Z.-Y.; Zhong, W.-Z.; Zhang, X.-C.; Su, J.; Xie, Z.; Liu, S.-Y.; Tu, H.Y.; Chen, H.J.; Sun, Y.L.; Zhou, Q.; et al. Potential Predictive Value of TP53 and KRAS Mutation Status for Response to PD-1 Blockade Immunotherapy in Lung Adenocarcinoma. Clin. Cancer Res. 2017, 23, 3012–3024. [Google Scholar] [CrossRef] [PubMed] [Green Version]
- Chat, V.; Ferguson, R.; Simpson, D.; Kazlow, E.; Lax, R.; Moran, U.; Pavlick, A.; Frederick, D.; Boland, G.; Sullivan, R.; et al. Autoimmune genetic risk variants as germline biomarkers of response to melanoma immune-checkpoint inhibition. Cancer Immunol. Immunother. 2019, 68, 897–905. [Google Scholar] [CrossRef]
- Marwitz, S.; Scheufele, S.; Perner, S.; Reck, M.; Ammerpohl, O.; Goldmann, T. Epigenetic modifications of the immune-checkpoint genes CTLA4 and PDCD1 in non-small cell lung cancer results in increased expression. Clin. Epigenetics 2017, 9, 2–4. [Google Scholar] [CrossRef]
- Seremet, T.; Koch, A.; Jansen, Y.; Schreuer, M.; Wilgenhof, S.; Del Marmol, V.; Liènard, D.; Thielemans, K.; Schats, K.; Kockx, M.; et al. Molecular and epigenetic features of melanomas and tumor immune microenvironment linked to durable remission to ipilimumab-based immunotherapy in metastatic patients. J. Transl. Med. 2016, 14, 232. [Google Scholar] [CrossRef] [Green Version]
- Ascierto, M.L.; Makohon-Moore, A.; Lipson, E.J.; Taube, J.M.; Mcmiller, T.L.; Berger, A.E.; Fan, J.; Kaunitz, G.J.; Cottrell, T.R.; Kohutek, Z.A.; et al. Transcriptional Mechanisms of Resistance to Anti-PD-1 Therapy. Clin. Cancer Res. 2017, 23, 3168–3180. [Google Scholar] [CrossRef] [Green Version]
- Cristescu, R.; Mogg, R.; Ayers, M.; Albright, A.; Murphy, E.; Yearley, J.; Sher, X.; Liu, X.Q.; Lu, H.; Nebozhyn, M.; et al. Pan-tumor genomic biomarkers for PD-1 checkpoint blockade-based immunotherapy. Science 2018, 362, eaar3593. [Google Scholar] [CrossRef] [Green Version]
- Shukla, S.A.; Bachireddy, P.; Schilling, B.; Galonska, C.; Zhan, Q.; Bango, C.; Langer, R.; Lee, P.C.; Gusenleitner, D.; Keskin, D.B.; et al. Cancer-Germline Antigen Expression Discriminates Clinical Outcome to CTLA-4 Blockade. Cell 2018, 173, 624–633. [Google Scholar] [CrossRef] [PubMed] [Green Version]
- Borghaei, H.; Paz-Ares, L.; Horn, L.; Spigel, D.R.; Steins, M.; Ready, N.E.; Chow, L.Q.; Vokes, E.E.; Felip, E.; Holgado, E.; et al. Nivolumab versus Docetaxel in Advanced Nonsquamous Non–Small-Cell Lung Cancer. N. Engl. J. Med. 2015, 373, 1627–1639. [Google Scholar] [CrossRef] [PubMed]
- El-Osta, H.; Jafri, S. Predictors for clinical benefit of immune checkpoint inhibitors in advanced non-small-cell lung cancer: A meta-analysis. Immunotherapy 2019, 11, 189–199. [Google Scholar] [CrossRef] [PubMed]
- Reck, M.; Rodríguez-Abreu, D.; Robinson, A.G.; Hui, R.; Csőszi, T.; Fülöp, A.; Gottfried, M.; Peled, N.; Tafreshi, A.; Cuffe, S.; et al. Pembrolizumab versus Chemotherapy for PD-L1-Positive Non-Small-Cell Lung Cancer. N. Engl. J. Med. 2016, 375, 1823–1833. [Google Scholar] [CrossRef] [Green Version]
- Mlecnik, B.; Bindea, G.; Angell, H.K.; Valge-Archer, V.; Latouche, J.-B. Integrative Analyses of Colorectal Cancer Show Immunoscore Is a Stronger Predictor of Patient Survival Than Microsatellite Instability. Immunity 2016, 44, 698–711. [Google Scholar] [CrossRef] [Green Version]
- Shields, B.D.; Taylor, E.M.; Byrum, S.D.; Sengupta, D.; Koss, B.; Baldini, G.; Baldini, G.; Ransom, S.; Cline, K.; Mackintosh, S.G.; et al. Indicators of responsiveness to immune checkpoint inhibitors. Sci. Rep. 2017, 7, 807. [Google Scholar] [CrossRef] [Green Version]
- Rizvi, N.A.; Chan, T.A. Immunotherapy and oncogenic pathways: The PTEN connection. Cancer Discov. 2016, 6, 128–129. [Google Scholar] [CrossRef] [Green Version]
- De Coana, Y.P.; Wolodarski, M.; Poschke, I.; Yoshimoto, Y.; Yang, Y.; Nystrom, M.; Edbäck, U.; Brage, S.E.; Lundqvist, A.; Masucci, G.V.; et al. Ipilimumab treatment decreases monocytic MDSCs and increases CD8 effector memory T cells in long-term survivors with advanced melanoma. Oncotarget 2017, 8, 21539–21553. [Google Scholar] [CrossRef] [Green Version]
- Huang, A.C.; Postow, M.A.; Orlowski, R.J.; Mick, R.; Bengsch, B.; Manne, S.; Xu, W.; Harmon, S.; Giles, J.R.; Wenz, B.; et al. T-cell invigoration to tumour burden ratio associated with anti-PD-1 response. Nature 2017, 545, 60–65. [Google Scholar] [CrossRef] [Green Version]
- Zaragoza, J.; Caille, A.; Beneton, N.; Bens, G.; Christiann, F.; Maillard, H.; Machet, L. High neutrophil to lymphocyte ratio measured before starting ipilimumab treatment is associated with reduced overall survival in patients with melanoma. Br. J. Dermatol. 2016, 174, 146–151. [Google Scholar] [CrossRef]
- Dronca, R.S.; Liu, X.; Harrington, S.M.; Chen, L.; Cao, S.; Kottschade, L.A.; McWilliams, R.R.; Block, M.S.; Nevala, W.K.; Thompson, M.A.; et al. T cell Bim levels reflect responses to anti–PD-1 cancer therapy. JCI Insight 2016, 1, 1–14. [Google Scholar] [CrossRef] [PubMed]
- Hamid, O.; Schmidt, H.; Nissan, A.; Ridolfi, L.; Aamdal, S.; Hansson, J.; Guida, M.; Hyams, D.M.; Gómez, H.; Bastholt, L.; et al. A prospective phase II trial exploring the association between tumor microenvironment biomarkers and clinical activity of ipilimumab in advanced melanoma. J. Transl. Med. 2011, 9, 204. [Google Scholar] [CrossRef] [PubMed] [Green Version]
- Simeone, E.; Gentilcore, G.; Giannarelli, D.; Grimaldi, A.M.; Caracò, C.; Curvietto, M.; Esposito, A.; Paone, M.; Palla, M.; Cavalcanti, E.; et al. Immunological and biological changes during ipilimumab treatment and their potential correlation with clinical response and survival in patients with advanced melanoma. Cancer Immunol. Immunother. 2014, 63, 675–683. [Google Scholar] [CrossRef] [PubMed]
- Gaba, L.; Victoria, I.; Pineda, E.; Fernandez, A.; Aya, F.; Prat, A.; Arance, A.M. Changes in blood eosinophilia during anti-PD1 therapy as a predictor of long term disease control in metastatic melanoma. J. Clin. Oncol. 2019, 33 (Suppl. S15), 9069. [Google Scholar] [CrossRef]
- Diem, S.; Kasenda, B.; Spain, L.; Martin-Liberal, J.; Marconcini, R.; Gore, M.; Larkin, J. Serum lactate dehydrogenase as an early marker for outcome in patients treated with anti-PD-1 therapy in metastatic melanoma. Br. J. Cancer 2016, 114, 256–261. [Google Scholar] [CrossRef]
- Hannani, D.; Vétizou, M.; Enot, D.; Rusakiewicz, S.; Chaput, N.; Klatzmann, D.; Desbois, M.; Jacquelot, N.; Vimond, N.; Chouaib, S.; et al. Anticancer immunotherapy by CTLA-4 blockade: Obligatory contribution of IL-2 receptors and negative prognostic impact of soluble CD25. Cell Res. 2015, 25, 208–224. [Google Scholar] [CrossRef]
- Koguchi, Y.; Hoen, H.M.; Bambina, S.A.; Rynning, M.D.; Fuerstenberg, R.K.; Curti, B.D.; Urba, W.J.; Milburn, C.; Bahjat, F.R.; Korman, A.J.; et al. Serum Immunoregulatory Proteins as Predictors of Overall Survival of Metastatic Melanoma Patients Treated with Ipilimumab. Cancer Res. 2015, 75, 5084–5092. [Google Scholar] [CrossRef] [Green Version]
- Chow, M.T.; Ozga, A.J.; Servis, R.L.; Frederick, D.T.; Lo, J.A.; Fisher, D.E.; Freeman, G.J.; Boland, G.M.; Luster, A.D. Intratumoral Activity of the CXCR3 Chemokine System Is Required for the Efficacy of Anti-PD-1 Therapy. Immunity 2019, 50, 1498–1512. [Google Scholar] [CrossRef]
- Krajsová, I.; Arenberger, P.; Lakomý, R.; Kubala, E.; Březinová, I.; Poprach, A.; Šťastný, M.; Mužík, J.; Melichar, B. Long-term Survival with Ipilimumab: Experience from a National Expanded Access Program for Patients with Melanoma. Anticancer Res. 2015, 35, 6303–6310. [Google Scholar]
- Shin, D.S.; Zaretsky, J.M.; Escuin-Ordinas, H.; Garcia-Diaz, A.; Hu-Lieskovan, S.; Kalbasi, A.; Grasso, C.S.; Hugo, W.; Sandoval, S.; Torrejon, D.Y.; et al. Primary resistance to PD-1 blockade mediated by JAK1/2 mutations. Cancer Discov. 2017, 7, 188–201. [Google Scholar] [CrossRef] [Green Version]
- Galon, J.; Angell, H.K.; Bedognetti, D.; Marincola, F.M. The Continuum of Cancer Immunosurveillance: Prognostic, Predictive, and Mechanistic Signatures. Immunity 2013, 39, 11–26. [Google Scholar] [CrossRef] [PubMed] [Green Version]
- Gao, J.; Shi, L.Z.; Zhao, H.; Chen, J.; Xiong, L.; He, Q.; Chen, T.; Roszik, J.; Bernatchez, C.; Woodman, S.E.; et al. Loss of IFN-γ Pathway Genes in Tumor Cells as a Mechanism of Resistance to Anti-CTLA-4 Therapy. Cell 2016, 167, 397–404. [Google Scholar] [CrossRef] [PubMed]
- Gettinger, S.; Choi, J.; Hastings, K.; Truini, A.; Datar, I.; Sowell, R.; Wurtz, A.; Dong, W.; Cai, G.; Melnick, M.A.; et al. Impaired HLA class I antigen processing and presentation as a mechanism of acquired resistance to immune checkpoint inhibitors in lung cancer. Cancer Discov. 2017, 7, 1420–1435. [Google Scholar] [CrossRef] [PubMed] [Green Version]
- Arlauckas, S.P.; Garris, C.S.; Kohler, R.H.; Kitaoka, M.; Cuccarese, M.F.; Yang, K.S.; Miller, M.A.; Carlson, J.C.; Freeman, G.J.; Anthony, R.M.; et al. In vivo imaging reveals a tumor-associated macrophage-mediated resistance pathway in anti-PD-1 therapy. Sci. Transl. Med. 2017, 9, eaal3604. [Google Scholar] [CrossRef] [PubMed] [Green Version]
- Koyama, S.; Akbay, E.A.; Li, Y.Y.; Herter-Sprie, G.S.; Buczkowski, K.A.; Richards, W.G.; Gandhi, L.; Redig, A.J.; Rodig, S.J.; Asahina, H.; et al. Adaptive resistance to therapeutic PD-1 blockade is associated with upregulation of alternative immune checkpoints. Nat. Commun. 2016, 7, 1–9. [Google Scholar] [CrossRef]
- Hornyák, L.; Dobos, N.; Koncz, G.; Karányi, Z.; Páll, D.; Szabó, Z.; Halmos, G.; Székvölgyi, L. The Role of Indoleamine-2,3-Dioxygenase in Cancer Development, Diagnostics, and Therapy. Front. Immunol. 2018, 9, 151. [Google Scholar] [CrossRef]
- Conway, J.R.; Kofman, E.; Mo, S.S.; Elmarakeby, H.; Van Allen, E. Genomics of response to immune checkpoint therapies for cancer: Implications for precision medicine. Genome Med. 2018, 10, 93. [Google Scholar] [CrossRef] [Green Version]
- Holmgaard, R.B.; Zamarin, D.; Munn, D.H.; Wolchok, J.D.; Allison, J.P. Indoleamine 2,3-dioxygenase is a critical resistance mechanism in antitumor T cell immunotherapy targeting CTLA-4. J. Exp. Med. 2013, 210, 1389–1402. [Google Scholar] [CrossRef]
- Kumar, V.; Chaudhary, N.; Garg, M.; Floudas, C.S.; Soni, P.; Chandra, A.B. Current diagnosis and management of immune related adverse events (irAEs) induced by immune checkpoint inhibitor therapy. Front. Pharmacol. 2017, 8, 49. [Google Scholar] [CrossRef] [Green Version]
- Joost Lesterhuis, W.; Bosco, A.; Millward, M.J.; Small, M.; Nowak, A.K.; Lake, R.A. Dynamic versus static biomarkers in cancer immune checkpoint blockade: Unravelling complexity. Nat. Rev. Drug Discov. 2017, 16, 264–272. [Google Scholar] [CrossRef] [Green Version]
- Khagi, Y.; Kurzrock, R.; Patel, S.P. Next generation predictive biomarkers for immune checkpoint inhibition. Cancer Metastasis Rev. 2017, 36, 179–190. [Google Scholar] [CrossRef] [PubMed] [Green Version]
- Topalian, S.L.; Taube, J.M.; Anders, R.A.; Pardoll, D.M. Mechanism-driven biomarkers to guide immune checkpoint blockade in cancer therapy. Nat. Rev. Cancer 2016, 16, 275–287. [Google Scholar] [CrossRef]
- Nolan, E.; Savas, P.; Policheni, A.N.; Darcy, P.K.; Vaillant, F.; Mintoff, C.P.; Dushyanthen, S.; Mansour, M.; Pang, J.B.; Fox, S.B.; et al. Combined immune checkpoint blockade as a therapeutic strategy for BRCA1-mutated breast cancer. Sci. Transl. Med. 2017, 9, 1–13. [Google Scholar] [CrossRef]
- Herbst, R.S.; Soria, J.C.; Kowanetz, M.; Fine, G.D.; Hamid, O.; Gordon, M.S.; Sosman, J.A.; McDermott, D.F.; Powderly, J.D.; Gettinger, S.N.; et al. Predictive correlates of response to the anti-PD-L1 antibody MPDL3280A. Nature 2016, 515, 563–567. [Google Scholar] [CrossRef] [PubMed] [Green Version]
- Roh, W.; Chen, P.-L.; Reuben, A.; Spencer, C.N.; Prieto, P.A.; Miller, J.P.; Gopalakrishnan, V.; Wang, F.; Cooper, Z.A.; Reddy, S.M.; et al. Integrated molecular analysis of tumor biopsies on sequential CTLA-4 and PD-1 blockade reveals markers of response and resistance. Sci. Transl. Med. 2017, 9, eaah3560. [Google Scholar] [CrossRef] [PubMed] [Green Version]
- Garaud, S.; Roufosse, F.; De Silva, P.; Gu-Trantien, C.; Lodewyckx, J.N.; Duvillier, H.; Dedeurwaerder, S.; Bizet, M.; Defrance, M.; Fuks, F.; et al. FOXP1 is a regulator of quiescence in healthy human CD4+ T cells and is constitutively repressed in T cells from patients with lymphoproliferative disorders. Eur. J. Immunol. 2017, 47, 168–179. [Google Scholar] [CrossRef]
- Shi, B.; Geng, J.; Wang, Y.-H.; Wei, H.; Walters, B.; Li, W.; Luo, X.; Stevens, A.; Pittman, M.; Li, B.; et al. Foxp1 Negatively Regulates T Follicular Helper Cell Differentiation and Germinal Center Responses by Controlling Cell Migration and CTLA-4. J. Immunol. 2018, 200, 586–594. [Google Scholar] [CrossRef]
- Pabla, S.; Conroy, J.M.; Nesline, M.K.; Glenn, S.T.; Papanicolau-Sengos, A.; Burgher, B.; Hagen, J.; Giamo, V.; Andreas, J.; Lenzo, F.L.; et al. Proliferative potential and resistance to immune checkpoint blockade in lung cancer patients. J. Immunother. Cancer 2019, 7, 27. [Google Scholar] [CrossRef] [Green Version]
- Solovyov, A.; Vabret, N.; Arora, K.S.; Snyder, A.; Funt, S.A.; Bajorin, D.F.; Rosenberg, J.E.; Bhardwaj, N.; Ting, D.T.; Greenbaum, B.D. Global Cancer Transcriptome Quantifies Repeat Element Polarization between Immunotherapy Responsive and T Cell Suppressive Classes. Cell Rep. 2018, 23, 512–521. [Google Scholar] [CrossRef]
- Lipson, E.J.; Forde, P.M.; Hammers, H.J.; Emens, L.A.; Taube, J.M.; Topalian, S.L. Antagonists of PD-1 and PD-L1 in Cancer Treatment. Semin Oncol. 2015, 42, 587–600. [Google Scholar] [CrossRef] [Green Version]
- Charoentong, P.; Finotello, F.; Angelova, M.; Mayer, C.; Efremova, M.; Rieder, D.; Hackl, H.; Trajanoski, Z. Pan-cancer Immunogenomic Analyses Reveal Genotype-Immunophenotype Relationships and Predictors of Response to Checkpoint Blockade. Cell Rep. 2017, 18, 248–262. [Google Scholar] [CrossRef] [PubMed] [Green Version]
- Daud, A.I.; Loo, K.; Pauli, M.L.; Sanchez-Rodriguez, R.; Sandoval, P.M.; Taravati, K.; Tsai, K.; Nosrati, A.; Nardo, L.; Alvarado, M.D.; et al. Tumor immune profiling predicts response to anti–PD-1 therapy in human melanoma. J. Clin. Invest. 2016, 126, 3447–3452. [Google Scholar] [CrossRef] [PubMed]
- Hodi, F.S.; Butler, M.; Oble, D.A.; Seiden, M.V.; Haluska, F.G.; Kruse, A.; Macrae, S.; Nelson, M.; Canning, C.; Lowy, I.; et al. Immunologic and clinical effects of antibody blockade of cytotoxic T lymphocyte-associated antigen 4 in previously vaccinated cancer patients. Proc. Natl. Acad. Sci. USA 2008, 105, 3005–3010. [Google Scholar] [CrossRef] [PubMed] [Green Version]
- Siravegna, G.; Marsoni, S.; Siena, S.; Bardelli, A. Integrating liquid biopsies into the management of cancer. Nat. Rev. Clin. Oncol. 2017, 14, 531–548. [Google Scholar] [CrossRef] [PubMed]
- Goodall, J.; Mateo, J.; Yuan, W.; Mossop, H.; Porta, N.; Miranda, S.; Perez-Lopez, R.; Dolling, D.; Robinson, D.R.; Sandhu, S.; et al. Circulating cell-free DNA to guide prostate cancer treatment with PARP inhibition. Cancer Discov. 2017, 7, 1006–1017. [Google Scholar] [CrossRef] [PubMed] [Green Version]
- Lipson, E.J.; Velculescu, V.E.; Pritchard, T.S.; Sausen, M.; Pardoll, D.M.; Topalian, S.L.; Diaz, L.A., Jr. Circulating tumor DNA analysis as a real-time method for monitoring tumor burden in melanoma patients undergoing treatment with immune checkpoint blockade. J. Immunother. Cancer 2014, 2, 1–7. [Google Scholar] [CrossRef] [PubMed] [Green Version]
- Weiss, G.J.; Beck, J.; Braun, D.P.; Bornemann-Kolatzki, K.; Barilla, H.; Cubello, R.; Quan, W., Jr.; Sangal, A.; Khemka, V.; Waypa, J.; et al. Tumor cell-free DNA copy number instability predicts therapeutic response to immunotherapy. Clin. Cancer Res. 2017, 23, 5074–5081. [Google Scholar] [CrossRef] [Green Version]
- Li, W.; Zhang, X.; Lu, X.; You, L.; Song, Y.; Luo, Z.; Zhang, J.; Nie, J.; Zheng, W.; Xu, D.; et al. 5-Hydroxymethylcytosine signatures in circulating cell-free DNA as diagnostic biomarkers for human cancers. Cell Res. 2017, 27, 1243–1257. [Google Scholar] [CrossRef] [Green Version]
- Kulasinghe, A.; Perry, C.; Kenny, L.; Warkiani, M.E.; Nelson, C.; Punyadeera, C. PD-L1 expressing circulating tumour cells in head and neck cancers. BMC Cancer 2017, 7, 4–9. [Google Scholar] [CrossRef] [Green Version]
- Sanmamed, M.F.; Perez-Gracia, J.L.; Schalper, K.A.; Fusco, J.P.; Gonzalez, A.; Rodriguez-Ruiz, M.E.; Oñate, C.; Perez, G.; Alfaro, C.; Martín-Algarra, S.; et al. Changes in serum interleukin-8 (IL-8) levels reflect and predict response to anti-PD-1 treatment in melanoma and non-small-cell lung cancer patients. Ann. Oncol. 2017, 28, 1988–1995. [Google Scholar] [CrossRef]
- Wu, X.; Giobbie-Hurder, A.; Liao, X.; Connelly, C.; Connolly, E.M.; Li, J.; Manos, M.P.; Lawrence, D.; McDermott, D.; Severgnini, M.; et al. Angiopoietin-2 as a Biomarker and Target for Immune Checkpoint Therapy. Cancer Immunol. Res. 2016, 5, 17–28. [Google Scholar] [CrossRef] [Green Version]
- Zhou, J.; Mahoney, K.M.; Giobbie-Hurder, A.; Zhao, F.; Lee, S.; Liao, X.; Rodig, S.; Li, J.; Wu, X.; Butterfield, L.H.; et al. Soluble PD-L1 as a Biomarker in Malignant Melanoma Treated with Checkpoint Blockade. Cancer Immunol. Res. 2017, 5, 480–492. [Google Scholar] [CrossRef] [Green Version]
- Tallerico, R.; Cristiani, C.M.; Staaf, E.; Garofalo, C.; Sottile, R.; Capone, M.; Pico de Coaña, Y.; Madonna, G.; Palella, E.; Wolodarski, M.; et al. IL-15, TIM-3 and NK cells subsets predict responsiveness to anti-CTLA-4 treatment in melanoma patients. Oncoimmunology 2017, 6, 1–12. [Google Scholar] [CrossRef] [Green Version]
- Kwek, S.S.; Lewis, J.; Zhang, L.; Weinberg, V.; Greaney, S.K.; Harzstark, A.L.; Lin, A.M.; Ryan, C.J.; Small, E.J.; Fong, L. Preexisting Levels of CD4 T Cells Expressing PD-1 Are Related to Overall Survival in Prostate Cancer Patients Treated with Ipilimumab. Cancer Immunol. Res. 2015, 3, 1008–1016. [Google Scholar] [CrossRef] [Green Version]
- Carthon, B.C.; Wolchok, J.D.; Yuan, J.; Kamat, A.; Ng Tang, D.S.; Sun, J.; Ku, G.; Troncoso, P.; Logothetis, C.J.; Allison, J.P.; et al. Preoperative CTLA-4 blockade: Tolerability and immune monitoring in the setting of a presurgical clinical trial. Clin. Cancer Res. 2010, 16, 2861–2871. [Google Scholar] [CrossRef] [Green Version]
- Weide, B.; Martens, A.; Hassel, J.C.; Berking, C.; Postow, M.A.; Bisschop, K.; Simeone, E.; Mangana, J.; Schilling, B.; Di Giacomo, A.M.; et al. Baseline biomarkers for outcome of melanoma patients treated with pembrolizumab. Clin. Cancer Res. 2016, 22, 5487–5496. [Google Scholar] [CrossRef] [Green Version]
- Schilling, B.; Maio, M.; Martus, P.; Ascierto, P.A.; Romano, E.; Dreno, B.; Capone, M.; Ascierto, P.A.; Di Giacomo, A.M.; Maio, M.; et al. Baseline Peripheral Blood Biomarkers Associated with Clinical Outcome of Advanced Melanoma Patients Treated with Ipilimumab. Clin. Cancer Res. 2016, 22, 2908–2918. [Google Scholar]
- Ghoneim, H.E.; Fan, Y.; Moustaki, A.; Abdelsamed, H.A.; Dash, P.; Dogra, P.; Carter, R.; Awad, W.; Neale, G.; Thomas, P.G.; et al. De Novo Epigenetic Programs Inhibit PD-1 Blockade-Mediated T Cell Rejuvenation. Cell 2017, 170, 142–157. [Google Scholar] [CrossRef]
- Pauken, K.E.; Sammons, M.A.; Odorizzi, P.M.; Manne, S.; Godec, J.; Khan, O.; Drake, A.M.; Chen, Z.; Sen, D.R.; Kurachi, M.; et al. Epigenetic stability of exhausted T cells limits durability of reinvigoration by PD-1 blockade. Science 2016, 354, 1160–1165. [Google Scholar] [CrossRef] [Green Version]
- Gate, R.E.; Cheng, C.S.; Aiden, A.P.; Siba, A.; Tabaka, M.; Lituiev, D.; Machol, I.; Gordon, M.G.; Subramaniam, M.; Shamim, M.; et al. Genetic determinants of co-accessible chromatin regions in activated T cells across humans. Nat. Genet. 2018, 50, 1140–1150. [Google Scholar] [CrossRef]
- Ghoneim, H.E.; Zamora, A.E.; Thomas, P.G.; Youngblood, B.A. Cell-Intrinsic Barriers of T Cell-Based Immunotherapy. Trends Mol. Med. 2016, 22, 1000–1011. [Google Scholar] [CrossRef] [Green Version]
- Sharma, P.; Allison, J.P. Immune Checkpoint Targeting in Cancer Therapy: Toward Combination Strategies with Curative Potential. Cell 2015, 161, 205–214. [Google Scholar] [CrossRef] [Green Version]
- Araki, K.; Youngblood, B.; Ahmed, R. Programmed Cell Death 1-Directed Immunotherapy for Enhancing T-Cell Function. Cold Spring Harb. Symp. Quant. Biol. 2013, 78, 239–247. [Google Scholar] [CrossRef]
- Pastor, W.A.; Aravind, L.; Rao, A. TETonic shift: Biological roles of TET proteins in DNA demethylation and transcription. Nat. Rev. Mol. Cell Biol. 2013, 14, 341–356. [Google Scholar] [CrossRef] [PubMed] [Green Version]
- McPherson, R.C.; Konkel, J.E.; Prendergast, C.T.; Thomson, J.P.; Ottaviano, R.; Leech, M.D.; Kay, O.; Zandee, S.E.; Sweenie, C.H.; Wraith, D.C.; et al. Epigenetic modification of the PD-1 (Pdcd1) promoter in effector CD4(+) T cells tolerized by peptide immunotherapy. eLife 2014, 3, e03416. [Google Scholar] [CrossRef] [Green Version]
- Peng, D.; Kryczek, I.; Nagarsheth, N.; Zhao, L.; Wei, S.; Wang, W.; Sun, Y.; Zhao, E.; Vatan, L.; Szeliga, W.; et al. Epigenetic silencing of TH1-type chemokines shapes tumour immunity and immunotherapy. Nature 2015, 527, 249–253. [Google Scholar] [CrossRef] [Green Version]
- Dupage, M.; Mazumdar, C.; Schmidt, L.M.; Cheung, A.F.; Jacks, T. Expression of tumour-specific antigens underlies cancer immunoediting. Nature 2012, 482, 405–409. [Google Scholar] [CrossRef] [Green Version]
- Fratta, E.; Coral, S.; Covre, A.; Parisi, G.; Colizzi, F.; Danielli, R.; Nicolay, H.J.; Sigalotti, L.; Maio, M. The biology of cancer testis antigens: Putative function, regulation and therapeutic potential. Mol. Oncol. 2011, 5, 164–182. [Google Scholar] [CrossRef] [Green Version]
- Guo, Z.S.; Hong, J.A.; Irvine, K.R.; Chen, G.A.; Spiess, P.J.; Liu, Y.; Zeng, G.; Wunderlich, J.R.; Nguyen, D.M.; Restifo, N.P.; et al. De novo Induction of a Cancer/Testis Antigen by 5-Aza-2V-Deoxycytidine Augments Adoptive Immunotherapy in a Murine Tumor Model. Cancer Res. 2006, 66, 1105–1113. [Google Scholar]
- Goodyear, O.; Agathanggelou, A.; Novitzky-Basso, I.; Siddique, S.; Mcskeane, T.; Ryan, G.; Vyas, P.; Cavenagh, J.; Stankovic, T.; Moss, P.; et al. Induction of a CD8 T-cell response to the MAGE cancer testis antigen by combined treatment with azacitidine and sodium valproate in patients with acute myeloid leukemia and myelodysplasia. Blood 2010, 116, 1908–1918. [Google Scholar] [CrossRef] [Green Version]
- Chiappinelli, K.B.; Strissel, P.L.; Desrichard, A.; Li, H.; Henke, C.; Akman, B.; Hein, A.; Rote, N.S.; Cope, L.M.; Snyder, A.; et al. Inhibiting DNA Methylation Causes an Interferon Response in Cancer via dsRNA Including Endogenous Retroviruses. Cell 2015, 162, 974–986. [Google Scholar] [CrossRef] [PubMed] [Green Version]
- Roulois, D.; Yau, H.L.; Singhania, R.; Wang, Y.; Danesh, A.; Shen, S.Y.; Han, H.; Liang, G.; Jones, P.A.; Pugh, T.J.; et al. DNA-Demethylating Agents Target Colorectal Cancer Cells by Inducing Viral Mimicry by Endogenous Transcripts. Cell 2015, 162, 961–973. [Google Scholar] [CrossRef] [PubMed] [Green Version]
- Ichiyama, K.; Chen, T.; Wang, X.; Yan, X.; Kim, B.S.; Tanaka, S.; Ndiaye-Lobry, D.; Deng, Y.; Zou, Y.; Zheng, P.; et al. The Methylcytosine Dioxygenase Tet2 Promotes DNA Demethylation and Activation of Cytokine Gene Expression in T Cells. Immunity 2015, 42, 613–626. [Google Scholar] [CrossRef] [PubMed] [Green Version]
- Tyrakis, P.A.; Palazon, A.; Macias, D.; Lee, K.L.; Phan, A.T.; Veliça, P.; You, J.; Chia, G.S.; Sim, J.; Doedens, A.; et al. S-2-hydroxyglutarate regulates CD8 + T-lymphocyte fate The VHL-HIF-1α axis regulates 2HG production. Nature 2016, 540, 236–241. [Google Scholar] [CrossRef] [PubMed]
- Yue, X.; Trifari, S.; Äijö, T.; Tsagaratou, A.; Pastor, W.A.; Zepeda-Martínez, J.A.; Lio, C.W.; Li, X.; Huang, Y.; Vijayanand, P.; et al. Control of Foxp3 stability through modulation of TET activity. J. Exp. Med. 2016, 213, 377–397. [Google Scholar] [CrossRef] [PubMed] [Green Version]
- Toker, A.; Engelbert, D.; Garg, G.; Polansky, J.K.; Floess, S.; Miyao, T.; Baron, U.; Düber, S.; Geffers, R.; Giehr, P.; et al. Active Demethylation of the Foxp3 Locus Leads to the Generation of Stable Regulatory T Cells within the Thymus. J. Immunol. 2013, 190, 3180–3188. [Google Scholar] [CrossRef] [Green Version]
- Bruniquel, D.; Schwartz, R.H. Selective, stable demethylation of the interleukin-2 gene enhances transcription by an active process. Nat. Immunol. 2003, 4, 235–240. [Google Scholar] [CrossRef]
- Scharer, C.D.; Barwick, B.G.; Youngblood, B.A.; Ahmed, R.; Boss, J.M. Global DNA Methylation Remodeling Accompanies CD8 T Cell Effector Function. J. Immunol. 2013, 191, 3419–3429. [Google Scholar] [CrossRef] [Green Version]
- Doering, T.A.; Crawford, A.; Angelosanto, J.M.; Paley, M.A.; Ziegler, C.G.; Wherry, E.J. Network Analysis Reveals Centrally Connected Genes and Pathways Involved in CD8 + T Cell Exhaustion versus Memory. Immunity 2012, 37, 1130–1144. [Google Scholar] [CrossRef] [Green Version]
- Lauschke, V.M.; Zhou, Y.; Ingelman-Sundberg, M. Novel genetic and epigenetic factors of importance for inter-individual differences in drug disposition, response and toxicity. Pharmacol. Ther. 2019, 197, 122–152. [Google Scholar] [CrossRef]
- Lauschke, V.M.; Milani, L.; Ingelman-Sundberg, M. Pharmacogenomic Biomarkers for Improved Drug Therapy—Recent Progress and Future Developments. AAPS J. 2017, 20, 4. [Google Scholar] [CrossRef] [PubMed]
- Lauschke, V.M.; Barragan, I.; Ingelman-Sundberg, M. Pharmacoepigenetics and Toxicoepigenetics: Novel Mechanistic Insights and Therapeutic Opportunities. Annu. Rev. Pharmacol. Toxicol. 2018, 58, 161–185. [Google Scholar] [CrossRef]
- Thomas, M.; Marcato, P.; Thomas, M.L.; Marcato, P. Epigenetic Modifications as Biomarkers of Tumor Development, Therapy Response, and Recurrence across the Cancer Care Continuum. Cancers 2018, 10, 101. [Google Scholar] [CrossRef] [PubMed] [Green Version]
- Costa-Pinheiro, P.; Montezuma, D.; Henrique, R.; Jerónimo, C. Diagnostic and prognostic epigenetic biomarkers in cancer. Epigenomics 2015, 7, 1003–1015. [Google Scholar] [CrossRef]
- Booth, M.J.; Ost, T.W.B.; Beraldi, D.; Bell, N.M.; Branco, M.R.; Reik, W.; Balasubramanian, S. Oxidative bisulfite sequencing of 5-methylcytosine and 5- hydroxymethylcytosine. Nat. Protoc. 2013, 8, 1841–1851. [Google Scholar] [CrossRef] [Green Version]
- Yu, M.; Hon, G.C.; Szulwach, K.E.; Song, C.-X.; Jin, P.; Ren, B.; He, C. Tet-assisted bisulfite sequencing of 5-hydroxymethylcytosine. Nat. Protoc. 2012, 7, 2159–2170. [Google Scholar] [CrossRef] [Green Version]
- Ivanov, M.; Kals, M.; Lauschke, V.; Barragan, I.; Ewels, P.; Käller, M.; Axelsson, T.; Lehtiö, J.; Milani, L.; Ingelman-Sundberg, M. Single base resolution analysis of 5-hydroxymethylcytosine in 188 human genes: Implications for hepatic gene expression. Nucleic Acids Res. 2016, 44, 6756–6769. [Google Scholar] [CrossRef] [Green Version]
- Kasela, S.; Ivanov, M.; Sayed, S.; Nobre, A.; Espino, L.; Marabita, F.; Milani, L.; Barragan, I. Cross-omics interactions for the identification of new biomarkers in hepatocellular carcinoma. In SEBBM16; Spanish Society of Biochemistry and Molecular Biology: Salamanca, Spain, 2016; p. 170. [Google Scholar]
- Forloni, M.; Gupta, R.; Nagarajan, A.; Sun, L.S.; Dong, Y.; Pirazzoli, V.; Toki, M.; Wurtz, A.; Melnick, M.A.; Kobayashi, S.; et al. Oncogenic EGFR Represses the TET1 DNA Demethylase to Induce Silencing of Tumor Suppressors in Cancer Cells. Cell Rep. 2016, 16, 457–471. [Google Scholar] [CrossRef] [Green Version]
- Bally, A.P.R.; Austin, J.W.; Boss, J.M. Genetic and Epigenetic Regulation of PD-1 Expression. J Immunol. 2016, 196, 2431–2437. [Google Scholar] [CrossRef] [Green Version]
- Yang, H.; Bueso-Ramos, C.; Dinardo, C.; Estecio, M.R.; Davanlou, M.; Geng, Q.R.; Fang, Z.; Nguyen, M.; Pierce, S.; Wei, Y.; et al. Expression of PD-L1, PD-L2, PD-1 and CTLA4 in myelodysplastic syndromes is enhanced by treatment with hypomethylating agents. Leukemia 2014, 28, 1280–1288. [Google Scholar] [CrossRef]
- Alvi, M.A.; Loughrey, M.B.; Dunne, P.; McQuaid, S.; Turkington, R.; Fuchs, M.A.; McGready, C.; Bingham, V.; Pang, B.; Moore, W.; et al. Molecular profiling of signet ring cell colorectal cancer provides a strong rationale for genomic targeted and immune checkpoint inhibitor therapies. Br. J. Cancer. 2017, 117, 203–209. [Google Scholar] [CrossRef] [Green Version]
- Mehta, A.; Kim, Y.J.; Robert, L.; Tsoi, J.; Comin-Anduix, B.; Berent-Maoz, B.; Cochran, A.J.; Economou, J.S.; Tumeh, P.C.; Puig-Saus, C.; et al. Immunotherapy Resistance by Infl ammation-Induced Dedifferentiation. Cancer Discov. 2018, 8, 935–943. [Google Scholar] [CrossRef] [Green Version]
- Novak, P.; Jensen, T.J.; Garbe, J.C.; Stampfer, M.R.; Futscher, B.W. Stepwise DNA methylation changes are linked to escape from defined proliferation barriers and mammary epithelial cell immortalization. Cancer Res. 2009, 69, 5251–5258. [Google Scholar] [CrossRef] [Green Version]
- Yang, D.; Thangaraju, M.; Greeneltch, K.; Browning, D.D.; Schoenlein, P.V.; Tamura, T.; Ozato, K.; Ganapathy, V.; Abrams, S.I.; Liu, K. Repression of IFN regulatory factor 8 by DNA methylation is a molecular determinant of apoptotic resistance and metastatic phenotype in metastatic tumor cells. Cancer Res. 2007, 67, 3301–3309. [Google Scholar] [CrossRef] [Green Version]
- Wrangle, J.; Wang, W.; Koch, A.; Easwaran, H.; Mohammad, H.P.; Vendetti, F.V.; Vancriekinge, W.; Demeyer, T.; Du, Z.; Parsana, P.; et al. Alterations of immune response of non-small cell lung cancer with Azacytidine. Oncotarget 2013, 4, 2067–2069. [Google Scholar] [CrossRef] [Green Version]
- Covre, A.; Coral, S.; Nicolay, H.; Parisi, G.; Fazio, C.; Colizzi, F.; Fratta, E.; Di Giacomo, A.M.; Sigalotti, L.; Natali, P.G.; et al. Antitumor activity of epigenetic immunomodulation combined with CTLA-4 blockade in syngeneic mouse models. Oncoimmunology 2015, 4, e1019978. [Google Scholar] [CrossRef] [Green Version]
- Wang, L.; Amoozgar, Z.; Huang, J.; Saleh, M.H.; Xing, D.; Orsulic, S.; Goldberg, M.S. Decitabine Enhances Lymphocyte Migration and Function and Synergizes with CTLA-4 Blockade in a Murine Ovarian Cancer Model. Cancer Immunol. Res. 2015, 3, 1030–1041. [Google Scholar] [CrossRef] [Green Version]
- Collignon, E.; Canale, A.; Wardi, C.; Al Bizet, M.; Calonne, E.; Dedeurwaerder, S.; Garaud, S.; Naveaux, C.; Barham, W.; Wilson, A.; et al. Immunity drives TET1 regulation in cancer through NF-kB. Sci. Adv. 2018, 4, eaap7309. [Google Scholar] [CrossRef] [Green Version]
- Jones, P.A.; Ohtani, H.; Chakravarthy., A.; De Carvalho, D.D. Epigenetic therapy in immune-oncology. Nat. Rev. Cancer. 2019, 19, 151–161. [Google Scholar] [CrossRef]
- Sun, W.; Lv, S.; Li, H.; Cui, W.; Wang, L. Enhancing the Anticancer Efficacy of Immunotherapy through Combination with Histone Modification Inhibitors. Genes 2018, 9, 633. [Google Scholar] [CrossRef] [Green Version]
- Hoque, M.O.; Begum, S.; Topaloglu, O.; Chatterjee, A.; Rosenbaum, E.; Van Criekinge, W.; Westra, W.H.; Schoenberg, M.; Zahurak, M.; Goodman, S.N.; et al. Quantitation of promoter methylation of multiple genes in urine DNA and bladder cancer detection. J. Natl. Cancer Inst. 2006, 98, 996–1004. [Google Scholar] [CrossRef] [PubMed] [Green Version]
- Jatkoe, T.A.; Karnes, R.J.; Freedland, S.J.; Wang, Y.; Le, A.; Baden, J. A urine-based methylation signature for risk stratification within low-risk prostate cancer. Br. J. Cancer 2015, 112, 802–808. [Google Scholar] [CrossRef] [PubMed] [Green Version]
- Friedrich, M.G.; Weisenberger, D.J.; Cheng, J.C.; Chandrasoma, S.; Siegmund, K.D.; Gonzalgo, M.L.; Toma, M.I.; Huland, H.; Yoo, C.; Tsai, Y.C.; et al. Detection of Methylated Apoptosis-Associated Genes in Urine Sediments of Bladder Cancer Patients. Clin. Cancer Res. 2004, 10, 7457–7465. [Google Scholar] [CrossRef] [PubMed] [Green Version]
- Wang, L.; Lin, Y.-L.; Li, B.; Wang, Y.-Z.; Li, W.-P.; Ma, J.-G. Aberrant promoter methylation of the cadherin 13 gene in serum and its relationship with clinicopathological features of prostate cancer. J. Int. Med. Res. 2014, 42, 1085–1092. [Google Scholar] [CrossRef]
- Brait, M.; Banerjee, M.; Maldonado, L.; Ooki, A.; Loyo, M.; Guida, E.; Izumchenko, E.; Mangold, L.; Humphreys, E.; Rosenbaum, E.; et al. Promoter methylation of MCAM, ERα and ERβ in serum of early stage prostate cancer patients. Oncotarget 2017, 8, 15431–15440. [Google Scholar] [CrossRef] [Green Version]
- Hagrass, H.A.; Pasha, H.F.; Ali, A.M. Estrogen receptor alpha (ERα) promoter methylation status in tumor and serum DNA in Egyptian breast cancer patients. Gene 2014, 552, 81–86. [Google Scholar] [CrossRef]
- Li, W.-H.; Zhang, H.; Guo, Q.; Wu, X.-D.; Xu, Z.-S.; Dang, C.-X.; Xia, P.; Song, Y.C. Detection of SNCA and FBN1 Methylation in the Stool as a Biomarker for Colorectal Cancer. Dis. Markers 2015, 2015, 657570. [Google Scholar] [CrossRef] [Green Version]
- Hibi, K.; Mizukami, H.; Saito, M.; Kigawa, G.; Nemoto, H.; Sanada, Y. FBN2 methylation is detected in the serum of colorectal cancer patients with hepatic metastasis. Anticancer Res. 2012, 32, 4371–4374. [Google Scholar]
- Yamamoto, N.; Nakayama, T.; Kajita, M.; Miyake, T.; Iwamoto, T.; Kim, S.J.; Sakai, A.; Ishihara, H.; Tamaki, Y.; Noguchi, S. Detection of aberrant promoter methylation of GSTP1, RASSF1A, and RARb2 in serum DNA of patients with breast cancer by a newly established one-step methylation-specific PCR assay. Breast Cancer Res. Treat. 2012, 132, 165–173. [Google Scholar] [CrossRef]
- Woodson, K.; O’reilly, K.J.; Hanson, J.C.; Nelson, D.; Walk, E.L.; Tangrea, J.A. The Usefulness of the Detection of GSTP1 Methylation in Urine as a Biomarker in the Diagnosis of Prostate Cancer. J. Urol. 2008, 179, 508–512. [Google Scholar] [CrossRef]
- Liu, L.; Sun, L.; Li, C.; Li, X.; Zhang, Y.; Yu, Y.; Xia, W. Quantitative detection of methylation of FHIT and BRCA1 promoters in the serum of ductal breast cancer patients. Bio-Med. Mater. Eng. 2015, 26, S2217–S2222. [Google Scholar] [CrossRef] [PubMed] [Green Version]
- Shan, M.; Yin, H.; Li, J.; Li, X.; Wang, D.; Su, Y.; Niu, M.; Zhong, Z.; Wang, J.; Zhang, X.; et al. Detection of aberrant methylation of a six-gene panel in serum DNA for diagnosis of breast cancer. Oncotarget 2016, 7, 18485–18494. [Google Scholar] [CrossRef] [PubMed] [Green Version]
- Herbst, A.; Wallner, M.; Rahmig, K.; Stieber, P.; Crispin, A.; Lamerz, R.; Kolligs, F.T. Methylation of helicase-like transcription factor in serum of patients with colorectal cancer is an independent predictor of disease recurrence. Eur. J. Gastroenterol. Hepatol. 2009, 21, 565–569. [Google Scholar] [CrossRef] [PubMed]
- Miglio, U.; Mezzapelle, R.; Paganotti, A.; Veggiani, C.; Mercalli, F.; Mancuso, G.; Gaudino, E.; Rena, O.; Buosi, R.; Boldorini, R. Frequency of O6-methylguanine-DNA methyltransferase promoter methylation in cytological samples from small cell lung cancer. Diagn. Cytopathol. 2015, 43, 947–952. [Google Scholar] [CrossRef] [PubMed]
- Renard, I.; Joniau, S.; Van Cleynenbreugel, B.; Collette, C.; Naômé, C.; Vlassenbroeck, I.; Nicolas, H.; de Leval, J.; Straub, J.; Van Criekinge, W.; et al. Identification and Validation of the Methylated TWIST1 and NID2 Genes through Real-Time Methylation-Specific Polymerase Chain Reaction Assays for the Noninvasive Detection of Primary Bladder Cancer in Urine Samples. Eur Urol. 2010, 58, 96–104. [Google Scholar] [CrossRef]
- Deng, Q.-K.; Lei, Y.-G.; Lin, Y.-L.; Ma, J.-G.; Li, W.-P. Prognostic Value of Protocadherin10 (PCDH10) Methylation in Serum of Prostate Cancer Patients. Med. Sci. Monit. 2016, 22, 516–521. [Google Scholar] [CrossRef]
- Wang, Y.; Yu, Y.; Ye, R.; Zhang, D.; Li, Q.; An, D.; Fang, L.; Lin, Y.; Hou, Y.; Xu, A.; et al. An epigenetic biomarker combination of PCDH17 and POU4F2 detects bladder cancer accurately by methylation analyses of urine sediment DNA in Han Chinese. Oncotarget 2016, 7, 2754–2764. [Google Scholar] [CrossRef]
- Bosch, L.J.W.; Mongera, S.; Terhaar Sive Droste, J.S.; Oort, F.A.; Van Turenhout, S.T.; Penning, M.T.; Louwagie, J.; Mulder, C.J.; van Engeland, M.; Carvalho, B.; et al. Analytical sensitivity and stability of DNA methylation testing in stool samples for colorectal cancer detection. Cell. Oncol. 2012, 35, 309–315. [Google Scholar] [CrossRef]
- Lee, S.M.; Park, J.Y.; Kim, D.S. Methylation of TMEFF2 Gene in Tissue and Serum DNA from Patients with Non-Small Cell Lung Cancer. Mol. Cells 2012, 34, 171–176. [Google Scholar] [CrossRef]
- Daniūnaitė, K.; Berezniakovas, A.; Jankevičius, F.; Laurinavičius, A.; Lazutka, J.R.; Jarmalaitė, S. Frequent methylation of RASSF1 and RARB in urine sediments from patients with early stage prostate cancer. Medicina 2011, 47, 147–153. [Google Scholar]
- Nian, J.; Sun, X.; Ming, S.; Yan, C.; Ma, Y.; Feng, Y.; Yang, L.; Yu, M.; Zhang, G.; Wang, X.; et al. Diagnostic Accuracy of Methylated SEPT9 for Blood-based Colorectal Cancer Detection: A Systematic Review and Meta-Analysis. Clin. Transl. Gastroenterol. 2017, 8, e216. [Google Scholar] [CrossRef]
- Tham, C.; Chew, M.; Soong, R.; Lim, J.; Ang, M.; Tang, C.; Zhao, Y.; Ong, S.Y.; Liu, Y. Postoperative serum methylation levels of TAC1 and SEPT9 are independent predictors of recurrence and survival of patients with colorectal cancer. Cancer 2014, 120, 3131–3141. [Google Scholar] [CrossRef]
- Liu, Y.; Hoe Chew, M.; Kian Tham, C.; Leong Tang, C.; Ong, S.Y.; Zhao, Y. Methylation of serum SST gene is an independent prognostic marker in colorectal cancer. Am. J. Cancer Res. 2016, 6, 2098–2108. [Google Scholar]
- Hibi, K.; Goto, T.; Shirahata, A.; Saito, M.; Kigawa, G.; Nemoto, H.; Sanada, Y. Detection of TFPI2 methylation in the serum of colorectal cancer patients. Cancer Lett. 2011, 311, 96–100. [Google Scholar] [CrossRef]
- Kamimae, S.; Yamamoto, E.; Yamano, H.-O.; Nojima, M.; Suzuki, H.; Ashida, M.; Hatahira, T.; Sato, A.; Kimura, T.; Yoshikawa, K.; et al. Epigenetic Alteration of DNA in Mucosal Wash Fluid Predicts Invasiveness of Colorectal Tumors. Cancer Prev. Res. 2011, 4, 674–683. [Google Scholar] [CrossRef] [Green Version]
- Balaña, C.; Ramirez, J.L.; Taron, M.; Multiforme, G.; Roussos, Y.; Ariza, A.; Ballester, R.; Sarries, C.; Mendez, P.; Sanchez, J.J.; et al. O 6 -methyl-guanine-DNA methyltransferase Methylation in Serum and Tumor DNA Predicts Response to Temozolamide Plus Cisplatin in Glioblastoma Multiforme. Clin. Cancer Res. 2003, 9, 1461–1468. [Google Scholar]
- Ooki, A.; Maleki, Z.; Tsay, J.-C.J.; Goparaju, C.; Brait, M.; Turaga, N.; Nam, H.S.; Rom, W.N.; Pass, H.I.; Sidransky, D.; et al. A Panel of Novel Detection and Prognostic Methylated DNA Markers in Primary Non-Small Cell Lung Cancer and Serum DNA. Clin. Cancer Res. 2017, 23, 7141–7152. [Google Scholar] [CrossRef] [Green Version]
- Balgkouranidou, I.; Chimonidou, M.; Milaki, G.; Tsarouxa, E.G.; Kakolyris, S.; Welch, D.R.; Georgoulias, V.; Lianidou, E.S. Breast cancer metastasis suppressor-1 promoter methylation in cell-free DNA provides prognostic information in non-small cell lung cancer. Br. J. Cancer 2014, 110, 2054–2062. [Google Scholar] [CrossRef] [Green Version]
- Lianidou, E.; Chimonidou, M.; Milaki, G.; Georgoulias, V.; Balgkouranidou, I.; Tsaroucha, E.; Kakolyris, S.; Georgoulias, V.; Lianidou, E. SOX17 promoter methylation in plasma circulating tumor DNA of patients with non-small cell lung cancer. Clin. Chem. Lab. Med. 2016, 54, 1385–1393. [Google Scholar]


| Drug | Approval Date | Mechanism | Sample Size | Reference Clinical Trial | Cancer Type | Indications |
|---|---|---|---|---|---|---|
| Ipilimumab (YERVOY®) * | 28/10/2015 | CTLA4 | 951 | EORTC (NCT00636168) | Melanoma | Adjuvant treatment of cutaneous melanoma patients with pathologic involvement of regional lymph nodes of more than 1 mm who have undergone complete resection |
| Ipilimumab (YERVOY®) * | 25/3/2011 | CTLA-4 | 676 | MDX010-20 (NCT00094653) | Melanoma | Unresectable or metastatic melanoma with previous systematic treatment previously |
| Pembrolizumab (KEYTRUDA®) * | 04/09/2014 | PD-1 | 173 | KEYNOTE-001 (NCT01295827) | Melanoma | Unresectable or metastatic melanoma and disease progression following Ipilimumab and, if BRAF V600 mutation positive, a BRAF inhibitor |
| Pembrolizumab (KEYTRUDA®) * | 18/12/2015 | PD-1 | 834+540 | KEYNOTE-006 (NCT01866319); KEYNOTE-002 (NCT01704287) | Melanoma | Unresectable or metastatic melanoma |
| Nivolumab + Ipilimumab (OPDIVO® + YERVOY®) * | 30/09/2015 | PD-1, CTLA4 | 142 | CheckMate-069 (NCT01927419) | Melanoma | BRAF V600 wild-type, unresectable or metastatic melanoma |
| Nivolumab (OPDIVO®) * | 22/12/2014 | PD-1 | 120 | CheckMate-037 (NCT01721746) | Melanoma | Unresectable or metastatic melanoma and disease progression following Ipilimumab and, if BRAF V600 mutation positive, a BRAF inhibitor |
| Pembrolizumab (KEYTRUDA®) * | 15/02/2019 | PD-1 | 1019 | KEYNOTE-054 (NCT02362594) | Melanoma | Melanoma with involvement of lymph node(s) following complete resection |
| Nivolumab (OPDIVO®) * | 20/12/2017 | PD-1 | 906 | CheckMate-238 (NCT02388906) | Melanoma | Adjuvant treatment of advanced melanoma |
| Nivolumab + Ipilimumab (OPDIVO® + YERVOY®) | 16/04/2018 | PD-1, CTLA4 | 847 | CheckMate-214 (NCT02231749) | Hepatocellular carcinoma | Intermediate or poor risk advanced hepatocellular carcinoma without prior treatment |
| Pembrolizumab (KEYTRUDA®) | 09/11/2018 | PD-1 | 104 | KEYNOTE-224 (NCT02702414) | Hepatocellular carcinoma | Hepatocellular carcinoma previously treated with Sorafenib |
| Nivolumab (OPDIVO®) | 22/09/2017 | PD-1 | 154 | CheckMate-040 (NCT01658878) | Hepatocellular carcinoma | Hepatocellular carcinoma previously treated with sorafenib |
| Pembrolizumab (KEYTRUDA®) * | 15/03/2017 | PD-1 | 210 | KEYNOTE-087 (NCT02453594) | Lymphoma | Refractory classical Hodgkin lymphoma patients, or those who have relapsed after three or more prior lines of therapy |
| Nivolumab (OPDIVO®) * | 17/05/2016 | PD-1 | 95 | CheckMate-205 (NCT02181738); CheckMate-039 (NCT01592370) | Lymphoma | Recurrent Hodgkin lymphoma following autologous hematopoietic stem cell transplantation and post-transplantation Brentuximab Vedotin |
| Pembrolizumab (KEYTRUDA®) | 13/06/2018 | PD-1 | 53 | KEYNOTE-170 (NCT02576990) | Lymphoma | Refractory primary mediastinal large B-cell lymphoma patients, or who have relapsed after two or more prior lines of therapy |
| Cemiplimab-rwlc (LIBTAYO®) * | 28/09/2018 | PD-1 | 108 | R2810-ONC-1423 (NCT02383212) R2810-ONC-1540 (NCT02760498) | Cutaneous squamous cell carcinoma | Metastatic or locally advanced cutaneous squamous cell carcinoma patients who are not candidates for curative surgery or curative radiation |
| Pembrolizumab (KEYTRUDA®) * | 05/08/2016 | PD-1 | 174 | KEYNOTE-012 (NCT01848834) | Squamous cell carcinoma of the head and neck | Recurrent or metastatic squamous cell carcinoma of the head and neck with progression on or after platinum-containing chemotherapy |
| Nivolumab (OPDIVO®) * | 10/11/2016 | PD-1 | 361 | CheckMate-141 (NCT02105636) | Squamous cell carcinoma of the head and neck | Advanced squamous cell carcinoma of the head and neck with progression on/after a platinum-based therapy |
| Nivolumab (OPDIVO®) | 31/07/2017 | PD-1 | 74 | CheckMate-142 (NCT02060188) | Colorectal | Treatment of patients 12 years and older with mismatch repair deficient and microsatellite instability high metastatic colorectal cancer that has progressed following treatment with Fluoropyrimidine, Oxaliplatin, and Irinotecan |
| Nivolumab + Ipilimumab (OPDIVO® + YERVOY®) | 10/07/2018 | CTLA4 | 82 | CheckMate-142 (NCT02060188) | Metastatic colorectal cancer with high microsatellite instability or mismatch repair deficiency | |
| Pembrolizumab (KEYTRUDA®) | 23/05/2017 | PD-1 | 149 | KEYNOTE-016 (NCT01876511); KEYNOTE-164 (NCT02460198); KEYNOTE-012 (NCT01848834); KEYNOTE-028 (NCT02054806); KEYNOTE-158 (NCT02628067) | Colorectal | Unresectable or metastatic, microsatellite instability-high or mismatch repair deficient solid tumors patients that have progressed following prior treatment and who have no satisfactory alternative treatment options or with microsatellite instability-high or mismatch repair deficient colorectal cancer that has progressed following treatment with Fluoropyrimidine, Oxaliplatin, and Irinotecan |
| Pembrolizumab (KEYTRUDA®) | 12/06/2018 | PD-1 | 98 | KEYNOTE-158 (NCT02628067) | Cervical | Recurrent or metastatic cervical cancer patients with progression on or after chemotherapy whose tumors express PD-L1 as determined by an FDA-approved test |
| Pembrolizumab (KEYTRUDA®) * | 11/04/2019 | PD-1 | 1274 | KEYNOTE-042 (NCT02220894) | Lung | First-line treatment of patients with stage III non-small-cell lung cancer who are not candidates for surgical resection or definitive chemoradiation or metastatic non-small cell lung cancer. Patients’ tumors must have no EGFR or ALK genomic aberrations and express PD-L1 (Tumor Proportion Score [TPS] ≥1%) determined by an FDA-approved test |
| Atezolizumab (TECENTRIQ®) + chemotherapy * | 06/12/2018 | PD-L1 | 1202 | IMpower150 trial (NCT02366143) | Lung | Metastatic non-squamous, non-small-cell lung cancer with no EGFR or ALK genomic tumor aberrations |
| Atezolizumab (TECENTRIQ®) * | 18/10/2016 | PD-L1 | 1137 | POPLAR (NCT01903993); OAK (NCT02008227) | Lung | Metastatic non-small-cell lung cancer patients whose disease progressed during or following platinum-containing chemotherapy. |
| Pembrolizumab (KEYTRUDA®) + pemetrexed and carboplatin * | 10/05/17 | PD-1 | 123 | KEYNOTE-021 (NCT02039674) | Lung | Previously untreated metastatic non-squamous non-small-cell lung cancer |
| Nivolumab (OPDIVO®) * | 09/10/2015 | PD-1 | 582 | CheckMate-057 (NCT01673867) | Lung | Metastatic non-small-cell lung cancer with progression on or after platinum-based chemotherapy |
| Pembrolizumab (KEYTRUDA®) + carboplatin/ paclitaxel * | 30/10/2018 | PD-1 | 559 | KEYNOTE-407 (NCT02775435) | Lung | Metastatic squamous non-small cell lung cancer |
| Pembrolizumab (KEYTRUDA®) * | 24/10/2016 | PD-1 | 305 + 1033 | KEYNOTE-024 (NCT02142738); KEYNOTE-010 (NCT01905657) | Lung | Metastatic non-small-cell lung cancer patients whose tumors express PD-L1 as determined by an FDA-approved test |
| Nivolumab (OPDIVO®) * | 04/03/2015 | PD-1 | 272 | CheckMate-017 (NCT01642004) | Lung | Metastatic squamous non-small-cell lung cancer with progression on or after platinum-based chemotherapy |
| Pembrolizumab (KEYTRUDA®) + pemetrexed and platinum * | 20/08/2018 | PD-1 | 616 | KEYNOTE-189 (NCT02578680) | Lung | Metastatic, non-squamous non-small-cell lung cancer, with no with no EGFR or ALK genomic tumor aberrations |
| Durvalumab (IMFINZI®) * | 06/02/2018 | PD-L1 | 713 | PACIFIC (NCT02125461) | Lung | Unresectable stage III non-small cell lung cancer patients whose disease has not progressed following concurrent platinum-based chemotherapy and radiation therapy |
| Pembrolizumab (KEYTRUDA®) * | 02/10/2015 | PD-1 | 61 | KEYNOTE-001 (NCT01295827) | Lung | Metastatic non-small cell lung cancer patients whose tumors express programmed death ligand 1 as determined by an FDA-approved test, with disease progression on or after platinum-containing chemotherapy |
| Atezolizumab (TECENTRIQ®) + carboplatin and etoposide * | 18/03/2019 | PD-L1 | 403 | IMpower133 (NCT02763579) | Lung | Extensive-stage small cell lung cancer |
| Nivolumab (OPDIVO®) | 16/08/2018 | PD-1 | 109 | CheckMate-032 (NCT01928394) | Lung | Progressive metastatic small cell lung cancer with progression after platinum-based chemotherapy and other lines of therapy |
| Nivolumab (OPDIVO®) * | 02/02/2017 | PD-1 | 270 | CheckMate-275 (NCT02387996) | Urothelial | Locally advanced or metastatic urothelial carcinoma patients who have disease progression during or following platinum-containing chemotherapy or have disease progression within 12 months of neoadjuvant or adjuvant treatment with a platinum-containing chemotherapy |
| Durvalumab (IMFINZI®) | 01/05/2017 | PD-L1 | 182 | Study 1108 (NCT01693562) | Urothelial | Locally advanced or metastatic urothelial carcinoma patients who have disease progression during or following platinum-containing chemotherapy or who have disease progression within 12 months of neoadjuvant or adjuvant treatment with platinum-containing chemotherapy |
| Atezolizumab (TECENTRIQ®) * | 18/05/2016 | PD-L1 | 310 | IMvigor210 (NCT02108652) | Urothelial | Locally advanced or metastatic urothelial carcinoma patients who have disease progression during or following platinum-containing chemotherapy or have disease progression within 12 months of neoadjuvant or adjuvant treatment with platinum-containing chemotherapy |
| Avelumab (BAVENCIO®) | 09/05/2017 | PD-L1 | 242 | JAVELIN Solid Tumor (NCT01772004) | Urothelial | Locally advanced or metastatic urothelial carcinoma patients whose disease progressed during or following platinum-containing chemotherapy or within 12 months of neoadjuvant or adjuvant platinum-containing chemotherapy |
| Pembrolizumab (KEYTRUDA®) * | 18/05/2017 | PD-1 | 542 | KEYNOTE-045 (NCT02256436) | Urothelial | Locally advanced or metastatic urothelial carcinoma patients who have disease progression during or following platinum-containing chemotherapy or within 12 months of neoadjuvant or adjuvant treatment with platinum-containing chemotherapy |
| Pembrolizumab (KEYTRUDA®) | 19/12/2018 | PD-1 | 50 | KEYNOTE-017 (NCT02267603) | Merkel cell carcinoma | Recurrent locally advanced or metastatic Merkel cell carcinoma |
| Avelumab (BAVENCIO®) * | 23/3/2017 | PD-L1 | 1738 | JAVELIN Merkel 200 (NCT02155647) | Merkel cell carcinoma | Metastatic Merkel cell carcinoma |
| Nivolumab (OPDIVO®) * | 23/11/2015 | PD-1 | 821 | CheckMate-025 (NCT01668784) | Renal | Advanced renal cell carcinoma in patients with previous anti-angiogenic therapy |
| Atezolizumab (TECENTRIQ®) * | 08/03/2019 | PD-L1 | 902 | IMpassion130 (NCT02425891) | Breast | Unresectable locally advanced or metastatic triple-negative breast cancer patients whose tumors express PD-L1 (PD-L1 stained tumor-infiltrating immune cells [IC] of any intensity covering ≥ 1% of the tumor area), as determined by an FDA-approved test |
| Pembrolizumab (KEYTRUDA®) | 22/09/2017 | PD-1 | 259 | KEYNOTE-059 (NCT02335411) | Gastric/gastro-esophageal junction | Recurrent locally advanced or metastatic, gastric or gastroesophageal junction adenocarcinoma patients whose tumors express PD-L1 as determined by an FDA-approved test |
| Drug | Targeted IC | Sample Size | Cancer Type | Response Rate | Phase | Trial Number |
|---|---|---|---|---|---|---|
| Ipilimumab | CTLA-4 | 100 | Melanoma (stage III/IV) | 10.9% | III/IV | NCT00094653 |
| Pembrolizumab | PD-1 | 31 | Hodgkin Lymphoma (recurred) | 65% | I | NCT01953692 |
| Pembrolizumab | PD-1 | 26 | Locoregional Merkel-cell carcinoma (advanced) | 56% | II | NCT02267603 |
| Nivolumab | PD-1 | 240 | Squamous-Cell Carcinoma (relapsed or advanced) | 13.3% | III | NCT02105636 |
| Nivolumab | PD-1 | 410 | Renal-Cell Carcinoma (advanced) | 25% | III | NCT01668784 |
| Pembrolizumab | PD-1 | 270 | Urothelial Carcinoma (advanced) | 21.1% | III | NCT02256436 |
| Pembrolizumab | PD-L1 | 27 | Triple-Negative Breast Cancer (advanced) | 18.5% | I | NCT01848834 |
| Nivolumab | PD-1 | 39 | Hepatocellular carcinoma (advanced) | 23% | I/II | NCT01658878 |
| MDX1105-01 (anti–PD-L1) | PD-L1 | 207 | Non-small-cell lung cancer, melanoma, colorectal cancer, renal cell carcinoma, prostate cancer, ovarian cancer, gastric cancer, breast cancer | 12.6% | I | NCT00729664 |
| Atezolizumab | PD-L1 | 175 | Non-small-cell lung cancer, renal cell carcinoma, melanoma, other tumors | 18% | I | NCT01375842 |
| Tremelimumab | CTLA-4 | 17 | Hepatocellular carcinoma (advanced with chronic hepatitis C) | 17.6% | II | NCT01008358 |
| Avelumab | PD-L1 | 88 | Merkel cell carcinoma (chemotherapy-refractory stage IV) | 31.8% | II | NCT02155647 |
| Atezolizumab | PD-L1 | 116 | Triple-negative breast cancer (metastatic) | 9.5% | I | NCT01375842 |
| Atezolizumab | PD-L1 | 32 | Head and neck cancer | 22% | I | NCT01375842 |
| Atezolizumab | PD-L1 | 95 | Urothelial cancer (metastatic) | 26% | I | NCT01375842 |
| Nivolumab | PD1 | 296 | Melanoma (advanced), non–small-cell lung cancer, prostate cancer (castration-resistant), renal-cell cancer, colorectal cancer | 18% in non-small-cell lung cancer, 28% in melanoma, 27% in renal-cell cancer | I | NCT01354431 |
| Pidilizumab | PD-1 | 66 | Diffuse large B-cell lymphoma | 51% | II | NCT00532259 |
| Pidilizumab | PD-1 | 32 | Follicular lymphoma (relapsed) | 66% | II | NCT00904722 |
| Nivolumab | PD-1 | 23 | Hodgkin’s lymphoma (relapsed or refractory) | 87% | I | NCT01592370 |
| Lambrolizumab | PD-1 | 135 | Melanoma (advanced) | 38% | I | NCT01295827 |
| Nivolumab | PD1 | 107 | Melanoma (advanced) | 30.8% | I | NCT00730639 |
| Nivolumab | PD1 | 418 | Melanoma (untreated without BRAF mutation) | 40.0% | III | NCT01721772 |
| Nivolumab | PD1 | 631 | Melanoma (advanced that progressed after anti-CTLA-4 treatment) | 31.7% | III | NCT01721746 |
| Pembrolizumab | PD1 | 495 | Non–small-cell lung cancer | 19.4% | I | NCT01295827 |
| Nivolumab | PD1 | 272 | Squamous-cell non-small-cell lung cancer (advanced) | 20% | III | NCT01642004 |
| Nivolumab | PD1 | 129 | Non–small-cell lung cancer (previously treated advanced) | 17% | I | NCT00730639 |
| Biomarker | Type | Target of the Test | Cohort Size | Predictive Power | Assay/Predictive Value |
|---|---|---|---|---|---|
| Amount and clonality of TCR repertoire | Genetic | Immune | 25 | p = 0.004 | TCR sequencing In metastatic melanoma, high clonality of TCR repertoire significantly correlated with clinical response to pembrolizumab treatment [77] |
| Tumor neoantigen clonality | Genetic | Tumor | 139 | No ITH threshold, HR = 0.47, p = 0.025 ITH threshold = 0, HR = 0.212, p = 0.019 ITH threshold = 0.01, HR = 0.33, p = 0.008 ITH threshold = 0.05, HR = 0.45, p = 0.083 | Whole exome sequencing In melanoma patients treated with ipilimumab or tremelimumab, overall survival was significantly better in tumors with low neoantigen intratumor heterogeneity (ITH) and high clonal neoantigen burden [68] |
| Tumor mutational burden (TMB) | Genetic | Tumor | 16, 49 | HR = 0.19, p = 0.01, HR = 1.38, p = 0.24 | Whole exome sequencing targeted next generation sequencing High TMB associated with clinical benefit [71,78,79] |
| ctDNA | Genetic | Tumor | 28 | Progression-free survival, HR = 0.29, p = 0.03 Overall survival, HR = 0.17, p = 0.007 | ctDNA level by next-generation sequencing High value of ctDNA drop indicates good response [80] |
| JAK1, JAK2 | Genetic | Immune | 4 | / | JAK1/JAK2 mutation by whole genome sequencing JAK1/2 mutation indicates bad response [37,39,81] |
| β2 microglobulin (B2M) | Genetic | Tumor | 40, 34 | p = 0.009, p = 0.004 | B2M mutation by whole-genome sequencing B2M mutation indicates bad response [69] |
| Germinal SNPs −1577G/G and CT60G/G in CTLA4 | Genetic | Germinal | 173 | −1577G>A, OR = 0.04 and 0.24 CT60G>A, OR = 0.07 and 0.28 | SNPs by genotyping. −1577G>A and CT60G>A indicates good response [82] |
| BRCA1/2 | Genetic | Tumor | 38 | OR = 6.2, p = 0.002 | BRCA2 mutation by whole-genome sequencing. BRCA2 mutation indicates good response [70,83,84] |
| KRAS, TP53 | Genetic | Tumor | 54 (immunotherapy cohort) | pTP53 mut = 0.042 pKRAS mut = 0.003 | TP53 and KRAS mutation by whole genome sequencing TP53/KRAS mutation indicates good response [85] |
| MDM2, EFGR | Genetic | Tumor | 155 | OR (MDM2) = 10.8 OR (EGFR) = 8.36 | Targeted sequencing. MDM2/EGFR amplification indicates bad response [75] |
| rs17388568 | Genetic | Germinal | 169 | OR = 0.26, p = 0.0002 | Genotyping by Sequenom MassArray. rs17388568 associated with response [86] |
| FOXP1 BS-5mC | Epigenetic | Immune | 61 | Progression-free survival, HR = 0.415, p = 0.0063 Overall survival, HR = 0.409, p = 0.0094 | FOXP1 methylation by EPIC array and pyrosequencing FOXP1 methylation indicates bad response [28] |
| CTLA4, PDCD1 | Epigenetic | Tumor | 18 | p < 0.01 | Array-based CpG-methylation assessment Significant differences in the CpG-methylation patterns between tumor tissues and matched controls were observed [87] |
| 68 genes | Epigenetic | Tumor | 18 | p < 0.05 | Differential DNA methylation pattern between durable clinical benefit vs. no clinical benefit [88] |
| LAMA3 | Transcriptional | Tumor | 26 | p = 0.003 | RT-PCR In patients with metastatic melanoma, LAMA3 is differentially expressed in regressing versus progressing metastases [89] |
| IFN-γ-associated gene-expression score | Transcriptional | Tumor | 19, 62, 43, 33 | p < 0.05 | Expression score by NanoString gene expression profiling High value of expression level indicates better response [1,90] |
| KRT1, KRT5, KRT10, KRT15, KRT78 (keratin genes) LOR, FLG2, DSC1, DSC3, LGALS7, LAMA3, KLK7 (cell adhesion genes) WNT3, WNT5A (Wnt pathway genes) | Transcriptional | Immune/tumor | 10 | FC ≥ 1.5 | Gene expression by whole genome microarray High values indicate bad response [89] |
| Melanoma Antigen Gene (MAGE)-A cancer-germline antigens | Transcriptional/histopathological | Tumor | 55 | p = 0.011 | Expression of MAGE-A cancer-germline antigens by RT-PCR and IHC. High value indicates bad response [91] |
| PD-L1 | Histopathological | Immune/tumor | 455, 305, 26 | Overall survival, p = 0.06 (≥1% PD-L1), p < 0.001 (≥5% and ≥10% PD-L1), Progression-free survival, p = 0.02 (≥1% PD-L1), p < 0.001 (≥5% and ≥10% PD-L1), Objective response rate, p = 0.002 (≥1%, ≥5% and ≥10% PD-L1); Overall survival HR for death, 0.60, p = 0.005; p = 0.006. | PD-L1 IHC In advanced non-small-cell lung cancer patients treated with Nivolumab, PD-L1 expression predicts overall survival, progression-free survival, and objective response rate, with increasing interaction p-values with increasing % of PD-L1 expression [92] In PD-L1 negative metastatic non-small-cell lung cancer patients, ICB efficacy is equivalent to chemotherapy [93] In advanced non-small-cell lung cancer, first line setting pembrolizumab in monotherapy is correlated with better progression-free survival (PFS) and overall survival (OS) than platinum-doublet chemotherapy, only if PD-L1 expression is equal to or above 50% [94] In metastatic melanoma treated with Pembrolizumab, the responders presented significantly higher numbers of PD-L1+ cells when compared to the patients that progressed (p = 0.006) [77] |
| CD8 | Histopathological | Immune | 46 | p < 0.0001 | CD8 IHC In metastatic melanoma treated with Pembrolizumab, the responders presented significantly higher numbers of CD8+ cells when compared to the patients that progressed [77] |
| PD-1 | Histopathological | Immune | 41 | p = 0.0002 | PD-1 IHC In metastatic melanoma treated with Pembrolizumab, the responders presented significantly higher numbers of PD-1+ compared to the patients that progressed [77] |
| Immunoscore | Histopathological | Immune | 475 | Disease-specific survival, HR = 2.4 (microsatellite instable) Overall survival, HR = 1.8 (microsatellite instable) Disease-specific survival, HR = 3.4 (microsatellite stable) Overall survival, HR = 2.43 (microsatellite stable) | CD3 and CD8 or CD8 and CD45RO IHC In colorectal cancer patients treated with anti-PD-1, immunoscore is a better response biomarker than microsatellite instability. Multivariate analysis shows a significant correlation of Immunoscore with disease-specific survival, disease-free survival, and overall survival despite their microsatellite status [95] |
| CD63, E-cadherin, CXCL4, CXCL12 | Histopathological /protein | Immune/tumor | 8 | pCD63 = 0.013 pE-cadherin = 0.005 pCXCL4 = 0.04 pCXCL12 = 0.041 | CD63, E-cadherin by IHC, CD63, E-cadherin, CXCL4, CXCL12 by proteomics All of them indicate better response [96] |
| PTEN | Histopathological | Tumor | 39 | p = 0.029 | PTEN IHC High value indicates bad response (p = 0.029) [97] |
| Circulating CD8+ T cells | Cellular | Immune | 43 | % survival, HR = 0.21, p = 0.00063 | Circulating CD8+ T cells by flow cytometry. High value indicates response [98] |
| Circulating monocytic MDSCs (CD14+) | Cellular | Immune | 43 | Overall survival, HR = 2.89, p = 0.002203 | Circulating monocytic MDSCs (CD14+) by flow cytometry. High value indicates bad response [98] |
| Circulating PD-1+ CD8+ T cells | Cellular | Immune | 25 | p = 0.02 | Circulating PD-1+ CD8+ T cells by flow cytometry High value indicates response [99] |
| Neutrophils/lymphocytes ratio | Cellular | Immune | 58 | Overall survival (NLR ≥ 4) HR = 2.2, p = 0.0009 | Neutrophils and lymphocytes by flow cytometry High value indicates bad response [100] |
| Circulating Bim+PD-1+CD8+ T cells | Cellular | Immune | 13 | p < 0.05 | Bim+PD-1+CD8+ T cell by flow cytometry High value indicates better response [101] |
| Total tumor infiltrating lymphocytes (TILs) | Cellular | Immune | 64 | p = 0.005 | Total TILs by IHC High value indicates response [102,103] |
| Total eosinophils | Cellular | Immune | 29 | Progression-free survival p < 0.0001, overall survival p = 0.017 | Absolute eosinophil counts by blood tests High values indicate better response [104] |
| Lactate Dehydrogenase (LDH) | Secreted | Serum | 66 | Overall survival p = 0.0292 | LDH ELISA. Elevated value indicates bad response [105] |
| sCD25 | Secreted | Serum | 262 | % survival, HR = 1.26, p < 0.0165 | sCD25 level by sIL-2 Receptor EIA assay High value indicates bad response [106] |
| CXCL11 | Secreted | Serum | 247 | Overall survival, HR = 1.88, p = 0.014 | CXCL11 level examined by bead-based multiplexed immunoassay. High value indicates bad response [107] |
| CXCL9 and CXCL10 | Secreted | Plasma | 18 | p < 0.001 | CXCL9 and CXCL10 levels examined by ELISA. Levels after anti-PD1 + anti-CTLA4 treatment are higher in responders vs. non-responders [108] |
| C-reactive protein | Secreted | Serum | 196 | p = 0.028 | CRP by immunofiltration High value indicates response [109] |
| Type of Biomarker | Gene | Type of Cancer | Description | Accuracy of Panel Including Methylated Gene or p Value |
|---|---|---|---|---|
| Diagnostic | ARF | Bladder | Urine ARF promoter detects bladder cancer [192] | ∆82%/96% |
| Prognostic | APC, GSTP1 | Prostate | APC and GSTP1 hypermethylation in prostate cancer strongly correlated to adverse pathological features [193] | ROC of the assay test score: clinical AUC = 0.79 |
| Diagnostic | BCL | Bladder | Urine sediments BCL methylation detects bladder cancer [194] | † 78% (29/37) |
| Prognostic | CDH13 | Prostate | Serum methylation of CDH13 was significantly associated with advanced tumor stage, worse survival outcome and relative risk of death [195] | HR 6.132 (95%CI: 3.160–12.187) p = 0.0073 |
| Diagnostic | CDKN2A | Bladder | Urine CDKN2A promoter detects bladder cancer [192] | ∆82%/96% |
| Diagnostic | DAPK | Bladder | Urine sediments DAPK methylation detects bladder cancer [194] | † 78% (29/37) |
| Diagnostic (early) | ERα | Prostate/breast (primary) | Serum promoter ERα methylation detects early stage prostate and breast cancer [196,197] | ∆75%/70% |
| Diagnostic (early) | ERβ | Prostate | Serum promoter ERβ methylation detects early stage prostate cancer [196] | ∆75%/70% |
| Diagnostic | FBN1 | Colorectal | Stool FBN1 methylation detects colorectal cancer [198] | ∆84.3%/93.3% |
| Diagnostic | FBN2 | Colorectal (primary) | Serum methylation of FBN2 detects colorectal cancer in males and hepatic metastasis [199] | Male: p = 0.0167; hepatic metastasis: p < 0.0001 |
| Diagnostic, Prognostic | GSTP1 | Bladder/prostate/castrate-resistant prostate/breast | Urine/serum GSTP1 is hypermethylated in prostate cancer and strongly correlated to adverse pathological features [193,200,201] | ∆82%,96%/−/† 82% (28/34)/∆75%/98%/† 6% 7/120/† 22% 22/101 |
| Diagnostic | FHIT | Ductal breast cancer | Serum FHIT is associated with breast cancer [202] | p < 0.05 |
| Diagnostic | hMLH1 | Breast | Serum hMLH1 detects breast cancer [203] | AUC = 0.727 (BCa versus NC), AUC = 0.789 (BCa versus BN) |
| Prognostic | HLTF | Colorectal | Serum HLTF methylation is associated with increased risk of recurrence [204] | HR 2.7 (95%CI: 1.2–6.0) p= 0.014) |
| Diagnostic | HOXD13 | Breast | Serum HOXD13 detects breast cancer [203] | AUC = 0.727 (BCa versus NC), AUC = 0.789 (BCa versus BN) |
| Diagnostic (early) | 5MCAM | Prostate | Serum promoter 5MCAM methylation detects early stage prostate cancer [196] | ∆75%/70% |
| Diagnostic | MGMT | Bladder/lung/Colorectal | Clinical response to dacarbazine is restricted to those with MGMT hypermethylation in colorectal cancer [205] | ∆82%/96% |
| Diagnostic | NID2 | Bladder (primary) | Urine NID2 methylation detects primary bladder cancer [206] | † 94% (466/496) |
| Diagnostic | P16 | Breast | Serum P16 detects breast cancer [203] | AUC = 0.727 (BCa versus NC), AUC = 0.789 (BCa versus BN) |
| Diagnostic | PCDHGB7 | Breast | Serum PCDHGB7 detects breast cancer [203] | AUC = 0.727 (BCa versus NC), AUC = 0.789 (BCa versus BN) |
| Prognostic | PCDH10 | Prostate | PCDH10 methylation in serum is an independent predictor of worse biochemical recurrence-free survival and overall survival [207] | HR 2.796 (95%CI: 1.431–6.763) p = 0.006 |
| Diagnostic | PCDH17 | Bladder | Urine sediment PCDH17 methylation detects bladder cancer [208] | ∆90%/93.96% |
| Diagnostic | PHACTR3 | Colorectal | Stool PHACTR3 methylation detects colorectal cancer [209] | Sensitivity: 55%–66%; specificity: 95%–100% |
| Diagnostic | POU4F2 | Bladder | Urine sediment POU4F2 methylation detects bladder cancer [208] | ∆90%/93.96% |
| Diagnostic | TERT | Bladder | Urine sediments TERT methylation detects bladder cancer [194] | † 78% (29/37) |
| Diagnostic | TMEFF2 | NSCLC | Higher frequency of TMEFF2 methylation in tumors without EGFR mutations than those harboring EGFR mutations [210] | Multivariate adjusted odds ratio = 7.13 (95%CI: 2.05–24.83) p = 0.002 |
| Diagnostic (early) | RARB | Prostate | Urine sediments RARB methylation detects early stage prostate cancer [211] | † 82% (28/34) |
| Diagnostic | RARβ2 | Breast | Serum RARβ2 promoter methylation as part of a methylation/specific PCR assay detects breast cancer [200] | † 6% 7/120/†22% 22/101 |
| Diagnostic (early) | RASSF1 | Prostate | Urine sediments RASSF1 methylation detects early-stage prostate cancer [211] | † 82% (28/34) |
| Diagnostic, Prognostic | RASSF1a | Breast/lung/ovarian | Serum RASSF1a promoter methylation as part of a methylation/specific PCR assay detects breast cancer [200] | AUC = 0.727 (BCa versus NC), AUC = 0.789 (BCa versus BN)/† 6% 7/120/† 22% 22/101 |
| Diagnostic, prognostic | SEPT9, TAC, CEA | Colorectal | Serum SEPT9 methylation predicts colorectal cancer; Epipro Colon 2.0 with 2/3 algorithm is the most effective assay [212]. In postoperative serum, SEPT9, CEA or TAC methylation predict recurrence and survival [213] | (Diagnostic) Sensitivity = 0.71, Specificity = 0.92, AUC = 0.88. (Prognostic) Disease-free survival: adjusted hazard rations of the ∆ = 2.58–4.71 p < 0.05; recurrence: sensitivity = 32.6–90; specificity = 80–90 |
| Diagnostic | SFN | Breast | Urine sediment SFN methylation detects bladder cancer [194] | AUC = 0.727 (BCa versus NC), AUC = 0.789 (BCa versus BN) |
| Diagnostic | SNCA | Colorectal | Stool SNCA methylation detects colorectal cancer [198] | ∆84.3%/93.3% |
| Prognostic | SST | Colorectal | High serum SST methylation is an independent prognostic biomarker of colorectal cancer [214] | Multivariate adjusted for cancer-specific survival: HR 1.96 (95%CI: 1.06, 3.62) p = 0.031; for overall survival HR 2.60 (95%CI: 1.37, 4.94) p = 0.003 |
| Diagnostic | TWIST1 | Bladder (primary) | Urine TWIST1 methylation detects primary bladder cancer [206] | † 94% (466/496) |
| Diagnostic, prognostic | VIM | Colorectal | Serum VIM methylation correlated with liver metastasis, peritoneal dissemination, and distant metastasis [215] | (Liver metastasis) p = 0.026 (Peritoneal dissemination) p = 0.0029 (Distant metastasis) p = 0.0063 |
| Prognostic | mir-34b/c | Colorectal | Mucosal wash fluid mir-34b/c methylation is associated with invasiveness [216] | Accuracy: 91.3% for the training set and 85.1% for the test set. |
| Prognostic | MGMT | Glioblastoma multiforme | Serum and tumor methylation of MGMT is associated with better stable response [217] | Median time to progression: log-rank test, p = 0.006, 29.9 weeks with methylated MGMT, 95%CI, 24.3–35.4) vs. 15.7 weeks with unmethylated MGMT (95%CI, 14.3–17.2). |
| Diagnostic, Prognostic (early) | Panel of 6 genes (CDO1, HOXA9, AJAP1, PTGDR, UNCX, and MARCH11) | Lung | Methylation status in the 6 genes analyzed in serum for the detection of stage IA NSCLC. In addition, a prognostic risk category based on the cancer and serum methylation status of CDO1, HOXA9, PTGDR, and AJAP1 refined the risk stratification for outcomes as an independent prognostic factor in early-stage disease [218] | (Serum) Sensitivity: 72.1%; specificity: 71.4%. (Prognosis factor) Combination methylation marker multivariate adjusted p = 0.035 |
| Prognostic | BRMS1 | Lung | Cell-free DNA circulating BRMS1 promoter methylation has a statistically significant influence both on operable NSCLC patients’ disease-free interval (DFI) time and OS and on advanced NSCLC patients’ PFS and OS [219] | Multivariate analysis: for progression-free survival: HR 1.951 (95%CI: 1.175–3.238) p = 0.01; for overall survival: HR 2.057 (95%CI: 1.247–3.386) p = 0.005 |
| Prognostic | SOX17 | Lung | SOX17 promoter methylation in plasma cell-free DNA has a statistically significant influence on advanced NSCLC patient overall survival [220] | Univariate analysis for overall survival: HR 1.834 (95%CI: 1.105–3.045) p = 0.019 |
© 2020 by the authors. Licensee MDPI, Basel, Switzerland. This article is an open access article distributed under the terms and conditions of the Creative Commons Attribution (CC BY) license (http://creativecommons.org/licenses/by/4.0/).
Share and Cite
Xiao, Q.; Nobre, A.; Piñeiro, P.; Berciano-Guerrero, M.-Á.; Alba, E.; Cobo, M.; Lauschke, V.M.; Barragán, I. Genetic and Epigenetic Biomarkers of Immune Checkpoint Blockade Response. J. Clin. Med. 2020, 9, 286. https://doi.org/10.3390/jcm9010286
Xiao Q, Nobre A, Piñeiro P, Berciano-Guerrero M-Á, Alba E, Cobo M, Lauschke VM, Barragán I. Genetic and Epigenetic Biomarkers of Immune Checkpoint Blockade Response. Journal of Clinical Medicine. 2020; 9(1):286. https://doi.org/10.3390/jcm9010286
Chicago/Turabian StyleXiao, Qingyang, André Nobre, Pilar Piñeiro, Miguel-Ángel Berciano-Guerrero, Emilio Alba, Manuel Cobo, Volker M. Lauschke, and Isabel Barragán. 2020. "Genetic and Epigenetic Biomarkers of Immune Checkpoint Blockade Response" Journal of Clinical Medicine 9, no. 1: 286. https://doi.org/10.3390/jcm9010286