4.1. Temporal Responses under Hyperventilation
Although recent studies have revealed that the CBFV response to CO
2 is nonlinear, linear regression was applied in
Figure 4 only to indicate the changing rate in CBFV, CO
2, and blood pressure for the three subject groups under the initial 30 s of hyperventilation, in which the steepest variation in P
ETCO2 and MCBFV occurred as we examined the original signals. The mean data at each breath of the POTS group (
n = 60) still presented excellent fit results with
r2 of 0.90, 0.83, 0.96, and 0.93 for mean percentage changes in P
ETCO2, MCBFV, MABP, and MSBP, respectively. Nevertheless, in two groups of healthy subjects that have few test participants (Healthy-Youth:
n = 13; Healthy-Elder:
n = 10), the linear regression cannot be performed reliably, as it yielded an
r2 of 0.29, 0.77, 0.07, and 0.08 in the Healthy-Youth group and 0.85, 0.73, 0.05, and 0.13 in the Healthy-Elder group for mean percentage changes in P
ETCO2, MCBFV, MABP, and MSBP, respectively.
During the hyperventilation phase, the changes in CO2 level causes the peripheral blood vessels to dilate, and this consequently results in a decrease in BP and variance in blood flow. However, the BP responses during hyperventilation may become significant in some patients with vascular disease or diabetes, which have been clinically verified as impairment of cerebral autoregulation (CA) or autonomic neuropathy.
In the current study, all healthy subjects and POTS patients recruited for the study had no history of cardiovascular, respiratory, hypertensive, diabetic, or other neurological conditions and autonomic disorders. Hence, we considered that the BP responses to CO2 under hyperventilation should exhibit equal effect on the three subject groups and would not play an important factor in the study of CBFV response to CO2.
4.2. Linear Responses of Cardiorespiratory Signals to CO2 under Hyperventilation
A study by Claassen et al. [
11] in 10 healthy youths (
n = 10, age = 37 ± 8 years), in which the nonlinear regression function of Model II was applied, also assessed the MCBFV–P
ETCO2 linear relationship by estimating CVMR
0, the linear regression slope of changes in MCBFV over the entire range of changes in P
ETCO2, and CVMR
1, the linear regression slope of changes in MCBFV in the steep ranges of P
ETCO2 for the sigmoidal fitted curves. The slopes of the MCBFV–P
ETCO2 linear relationship estimated in the current study (
Figure 6) were more comparable to the CVMR
0 in an earlier study [
11]. However, the range of changes in P
ETCO2 in the current study was between 5 and 30 mmHg caused by hyperventilation, in comparison to the wider range of CO
2 changes (10–65 mmHg) caused by voluntary hyperventilation preceding rebreathing in the earlier study [
11].
On the other hand, another experimental study conducted by Battisti-Charbonney et al. [
22] in healthy human subjects (
n = 10, age = 27 ± 5.8 years) for cerebrovascular responses to increasing CO
2 hyperoxic and hypoxic rebreathing, where the test subjects hyperventilated to a target P
ETCO2 range between 20 and 25 mmHg during hyperventilation= also estimated the slope of the fitted sigmoidal curve for the middle cerebral artery flow velocity (left MCA
v and right MCA
v) response to CO
2 within hyperoxic and hypoxic ranges.
The CVMR
0 and CVMR
1 estimated by Claassen et al. [
11] were both 5 ± 1%·mmHg
−1. The sigmoidal slopes estimated by Battisti-Charbonney et al. [
22] were 7.8 ± 0.5%·mmHg
−1 (left MCA
v) and 8.1 ± 1.1%·mmHg
−1 (left MCA
v) for the hyperoxic range and 11 ± 0.9%·mmHg
−1 (left MCA
v) and 10.9 ± 1.1%·mmHg
−1 (left MCA
v) for the hyperoxic range.
The linear relationship of MCBFV–P
ETCO2 (
Figure 6) for the POTS group (slope = 2.1142,
r2 = 0.88) appeared to be flatter than for the two healthy subject groups (Healthy-Youth: slope = 3.215,
r2 = 0.92; Healthy-Elder: slope = 4.06,
r2 = 0.88). Moreover, this suggested the lag of sensitivity in the regulation of the CBF response to the rapidly changed CO
2 levels during the initial hyperventilation period. Nonetheless, the two linear regression lines of the healthy groups did not indicate a difference in the solidity of cerebral autoregulation between youths and older individuals.
In comparison with the CVMRmax estimated by the two nonlinear regression models, the slope of linear regression seemed to underestimate the maximal cerebral vasodilatory effect of CO2. Using the CVMRmax of the POTS group as an example, CVMRmax = 12.65 ± 8.10 and 12.49 ± 9.18%·mmHg−1 were estimated using curve-fit Models I and II, respectively, compared with slope = 2.1142%·mmHg−1 through linear regression.
4.3. Nonlinear Curve-Fitting and Model Parameters
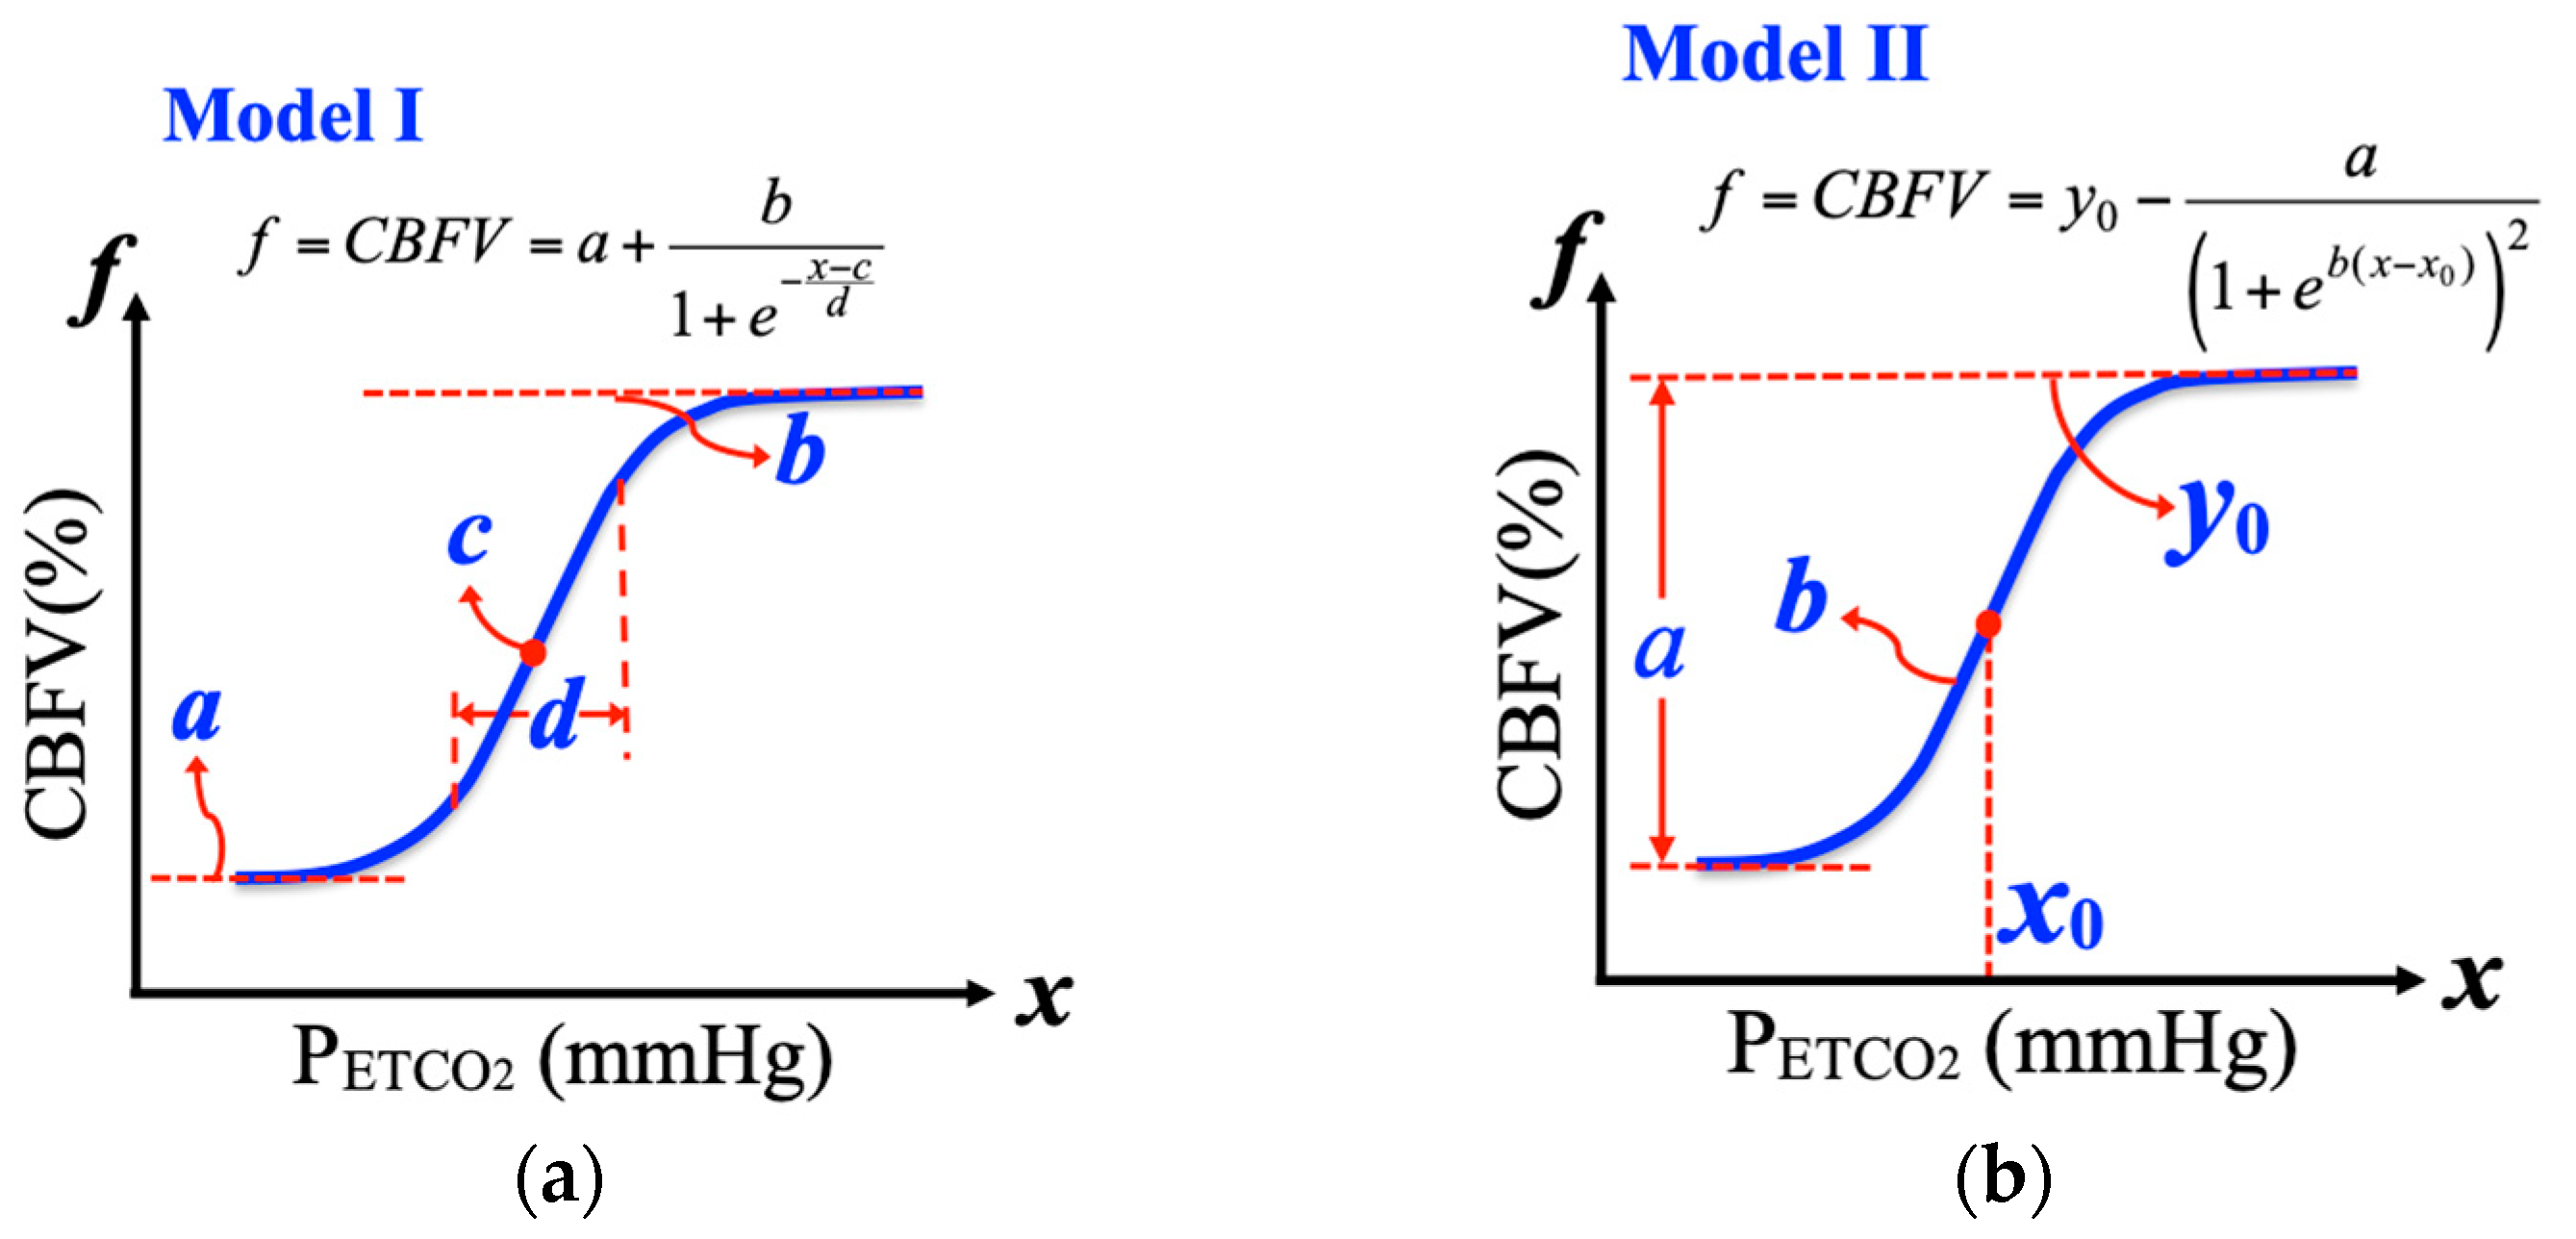
We adopted two sigmoidal regression function models, Model I and Model II, for our CBFV response analysis during the hyperventilation phases for three subject groups, as did Claassen et al. [
11] and Battisti-Charbonney et al. [
22], who used healthy youths as test subjects. Although data with a sigmoidal distribution could be fitted with choices of nonlinear regression functions, the two models used in the current research and previous studies [
11,
22] were identified to provide clear physiological meanings of their model parameters.
During hyperventilation, the CBFV response displayed a sigmoidal function with respect to transient changes in CO
2. The fitted curves of CBFV and CVMR responses to P
ETCO2 showed similar behaviors through slightly different fit parameters by two models (
Figure 7). However, the statistic tests (
Table 4 and
Table 5) for differences between POTS group and two healthy subject groups indicated two models estimated the center of the fitted curve (Model I: mid-P
ETCO2 c; Model II: P
ETCO2 level
x0) diverged from healthy youths with consistent significance. Under the assumption that the proposed nonlinear models accurately fitted the sigmoid CBFV response to CO
2 and correctly described the regulation of CBFV by CO
2 through changes in the diameter of cerebral vessels, it may be claimed that above mid-P
ETCO2, the center of the steep range of the sigmoidal curve, not only indicates the P
ETCO2 at which vessel responsiveness is at its maximum, but also the P
ETCO2 at which vessel diameter is at its midpoint [
22].
In comparison with healthy elders, both models conveyed coherent test results on the lessened maximum CBFV (CBFV
max) for the POTS group. The test on CVMR for the two models seemed to be a lack of significance compared with healthy youths. The CBF response to transient changes in CO
2 showed a time delay [
34]. However, identification of the accurate time delay between transient changes in CBF and P
ETCO2 needs complex and precise control of the CO
2 levels and breathing process during the experiment, and the delay was only compensated manually on raw signals in the current study. This factor might have affected the estimation of CVMR with the regression models.
It is well-known that CA is very sensitive to changes in carbon dioxide. Although physiological aging is known to be associated with many changes in the cardiovascular and cerebrovascular systems and also with impairment in a number of conditions, dynamic CA was also shown to be preserved in normal subjects during orthostatic stress, but no age-related deterioration has been demonstrated in dynamic CA in normal subjects during supine rest [
35]. A study that investigated the effect of aging on dynamic CA in normal subjects during orthostatic stress induced by head-up tilt also showed autoregulatory indexes were similar in younger and older subjects at all times before, during, and after tilt, although CBFV was significantly lower at rest in aged subjects [
36]. However, none of the related studies were performed to demonstrate the dynamic relationship of CBFV response to CO
2 between healthy youths and elders under hypocapnic or hypercapnic range of change in carbon dioxide, not to mention the nonlinear relationship of cerebrovascular response during transient changes in CO
2.
An earlier study investigated the effect of aging on CA using a moving-window autoregressive moving average (MWARMA) to calculate CA as an autoregulatory index (ARMA-ARI) during hypercapnia and hypocapnia, and the results suggested that CA is not affected by healthy aging and also demonstrated that CBFV was higher and change in CBFV due to respiratory maneuver was significantly greater in the younger group compared with the aged group [
37].
Meanwhile, studies investigating the effect of aerobic exercise training on CVMR also showed mixed results about aged subjects. It was observed that both hypo- and hypercapnic CVMRs were similar between endurance Masters athletes and age-matched sedentary older adults by using TCD during hyperventilation and modified rebreathing [
38]. On the other hand, with similar participant groups, it was found the youth adults had lower measured CVMR than aged adults by using functional MRI during steady-state hypercapnia [
39].
The steady-state level of CBF progressively decreased in normal aging adults [
40]. This age-related reduction in CBF might reflect decreased cerebral metabolic rate and cerebrovascular dysfunction. Nevertheless, the objective current study was not to investigate the comparison between youths and elders, or to examine whether the age would alter the CBFV response to CO
2. We utilized nonlinear regression functions to model the CBFV-CO
2 relationship during transient changes in P
ETCO2 within hypocapnic range to further explore the nonlinear cerebral blood flow response and cerebral vasomotor reactivity to carbon dioxide between patients with POTS and healthy subjects, mainly healthy youths.
In two groups of healthy subjects that only had fewer test participants (Healthy-Youth: n = 13, Healthy-Elder: n = 10), the linear regression could not be performed reliably as it yielded an r2 of 0.29, 0.77, 0.07, and 0.08 in the Healthy-Youth group, and r2 of 0.85, 0.73, 0.05, and 0.13 in the Healthy-Elder group for mean percentage changes in PETCO2, MCBFV, MABP, and MSBP, respectively.
Indeed, current research is the first attempt to utilize nonlinear models, which were earlier applied to investigate healthy youth subjects in patients with POTS to access their dynamic CBFV response and CVMR during transient changes in P
ETCO2, and comparisons were performed with healthy youths and elders. Of course, we could still find the difference between healthy youths and elders based on this pioneering viewpoint. The aged group appeared to have lower mean values in P
ETCO2 and CBFV, and higher mean values in ABP during hyperventilation. As we can see from
Figure 7, the nonlinear curve fit results of Models I and II for the Healthy-Youth posed lower CVMR with both models than Healthy-Elder, and this is consistent with the earlier finding [
39] with the use of functional MRI during steady-state hypercapnia. However, both fitted sigmoidal curves also indicated that the aged group was modeled with higher CBFV
max and responded to lower P
ETCO2 level and descended more sharply in the steep portion of the sigmoidal curve. Nevertheless, the statistical significance analysis in the aging effect was beyond the scope of the current study.

 ,
, 


