Bortezomib Treatment Modulates Autophagy in Multiple Myeloma

 , , , , , , , and
Abstract
:1. Introduction
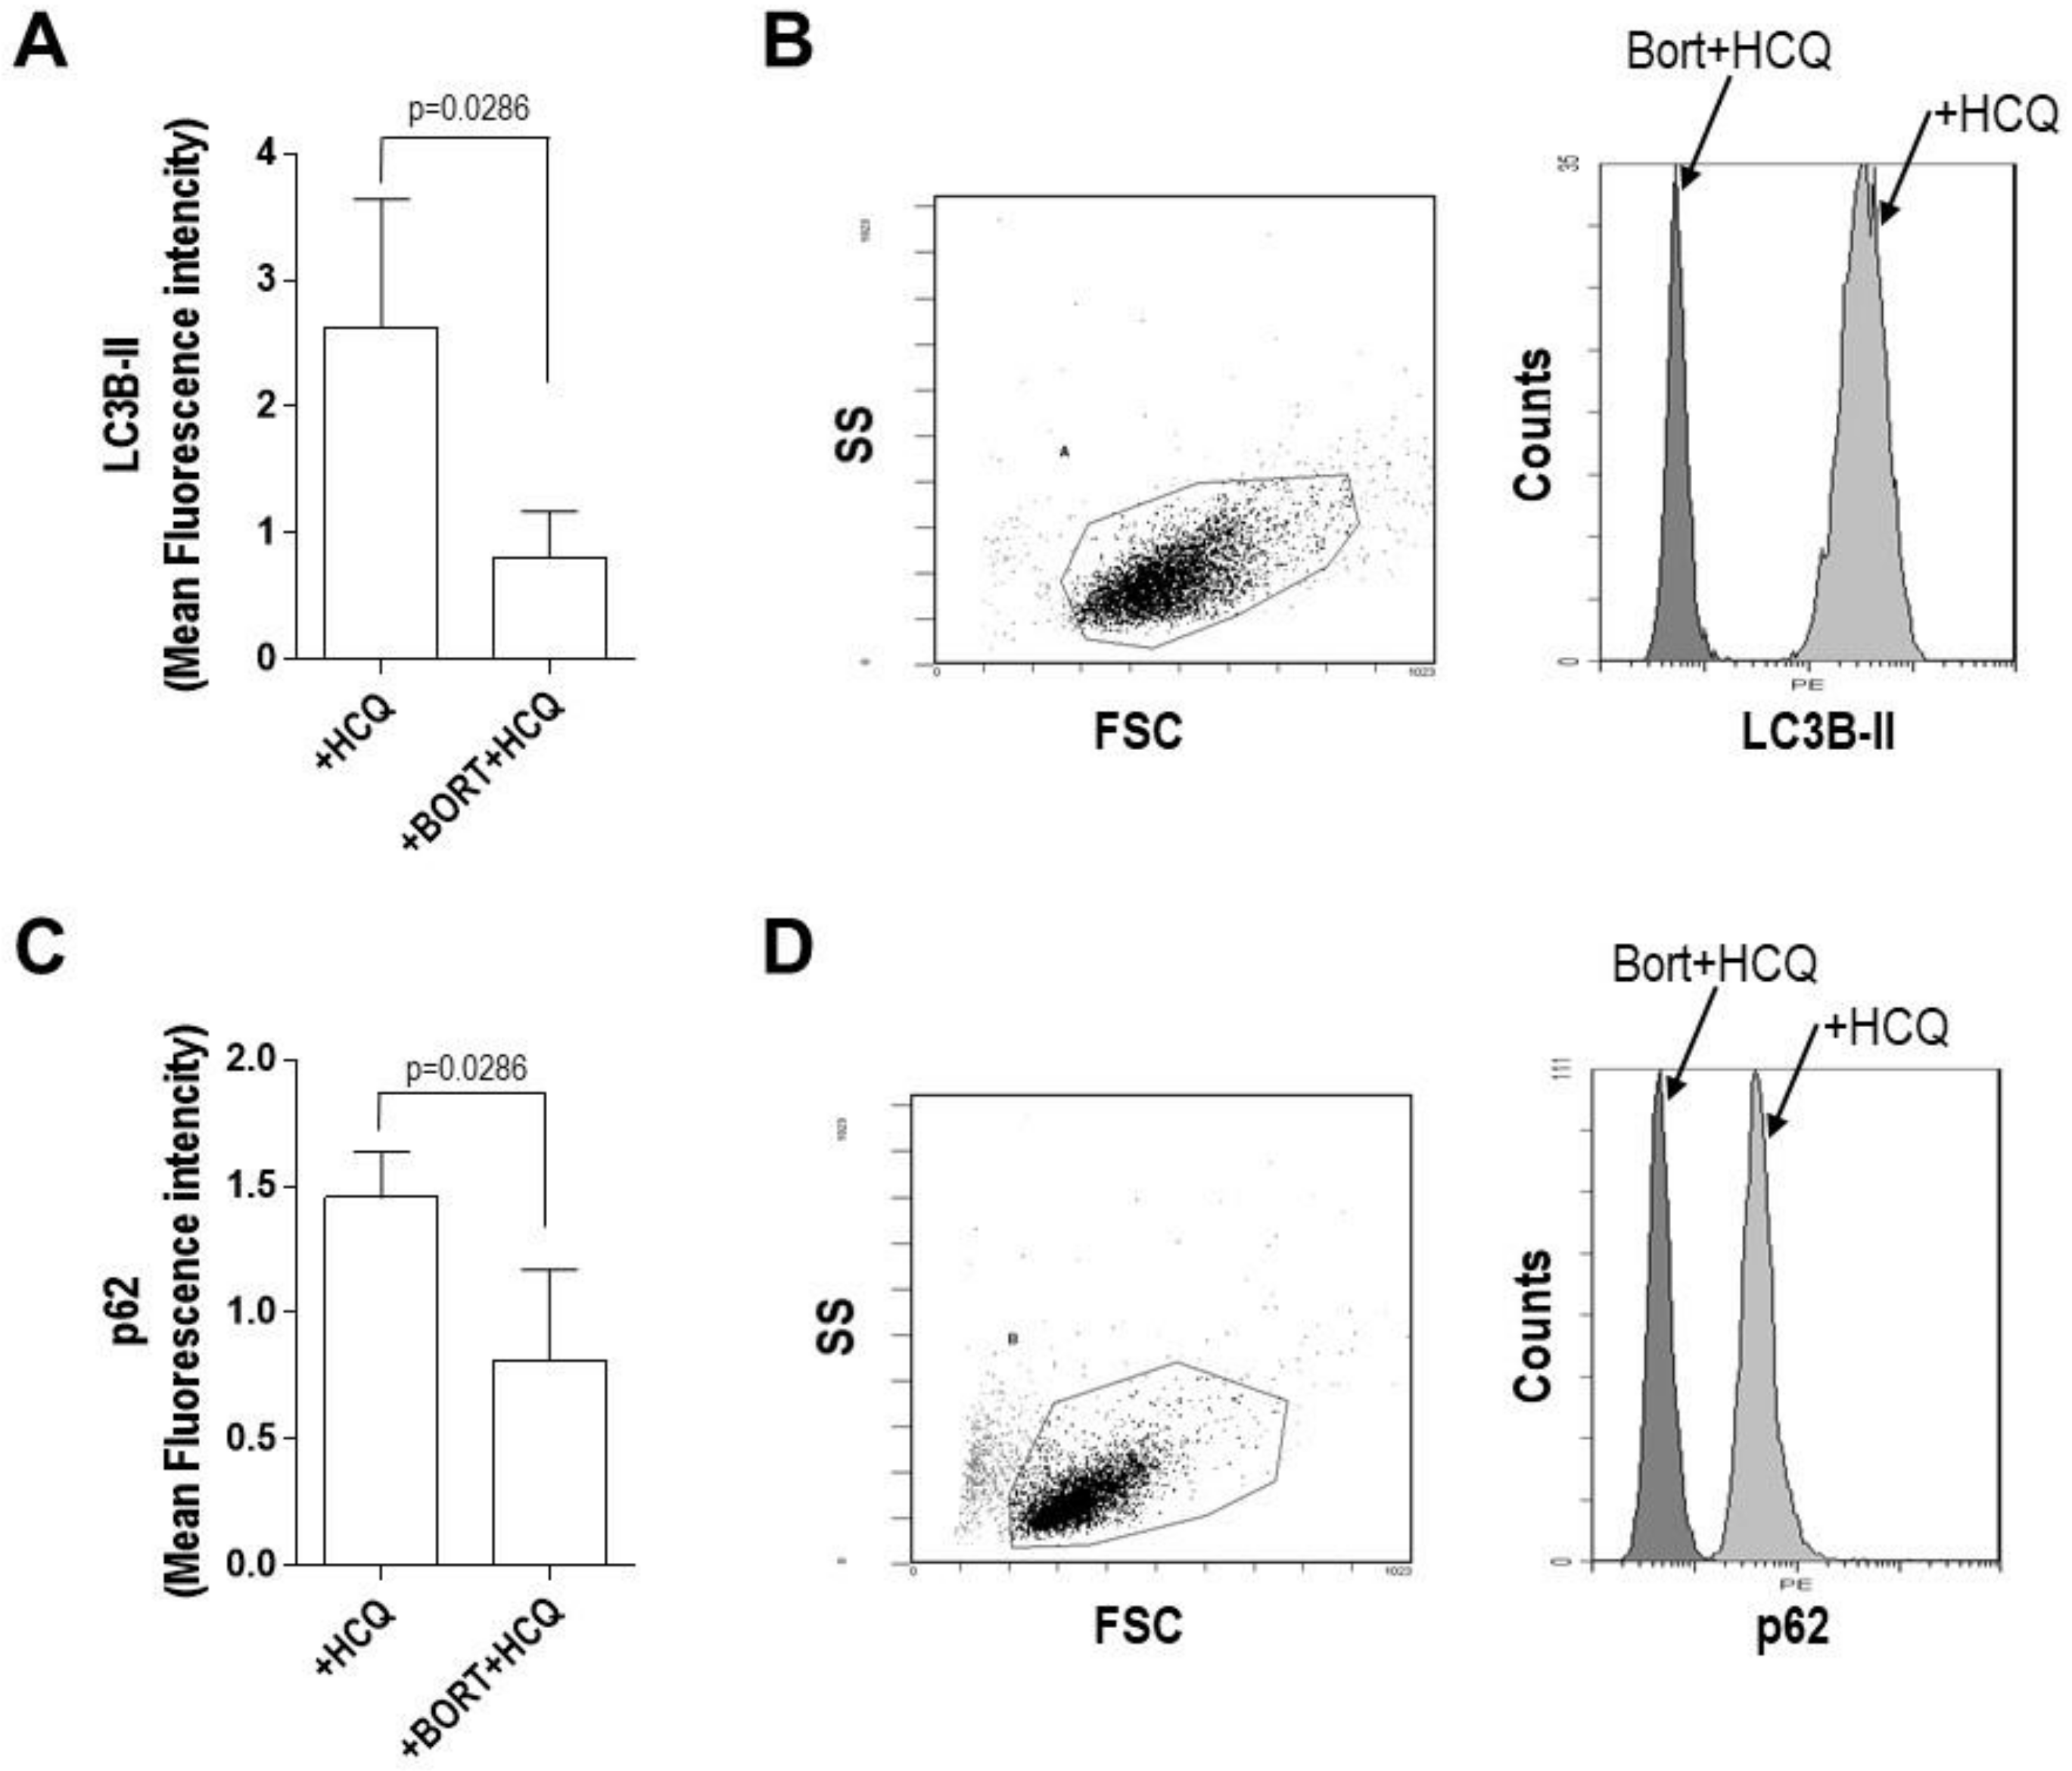
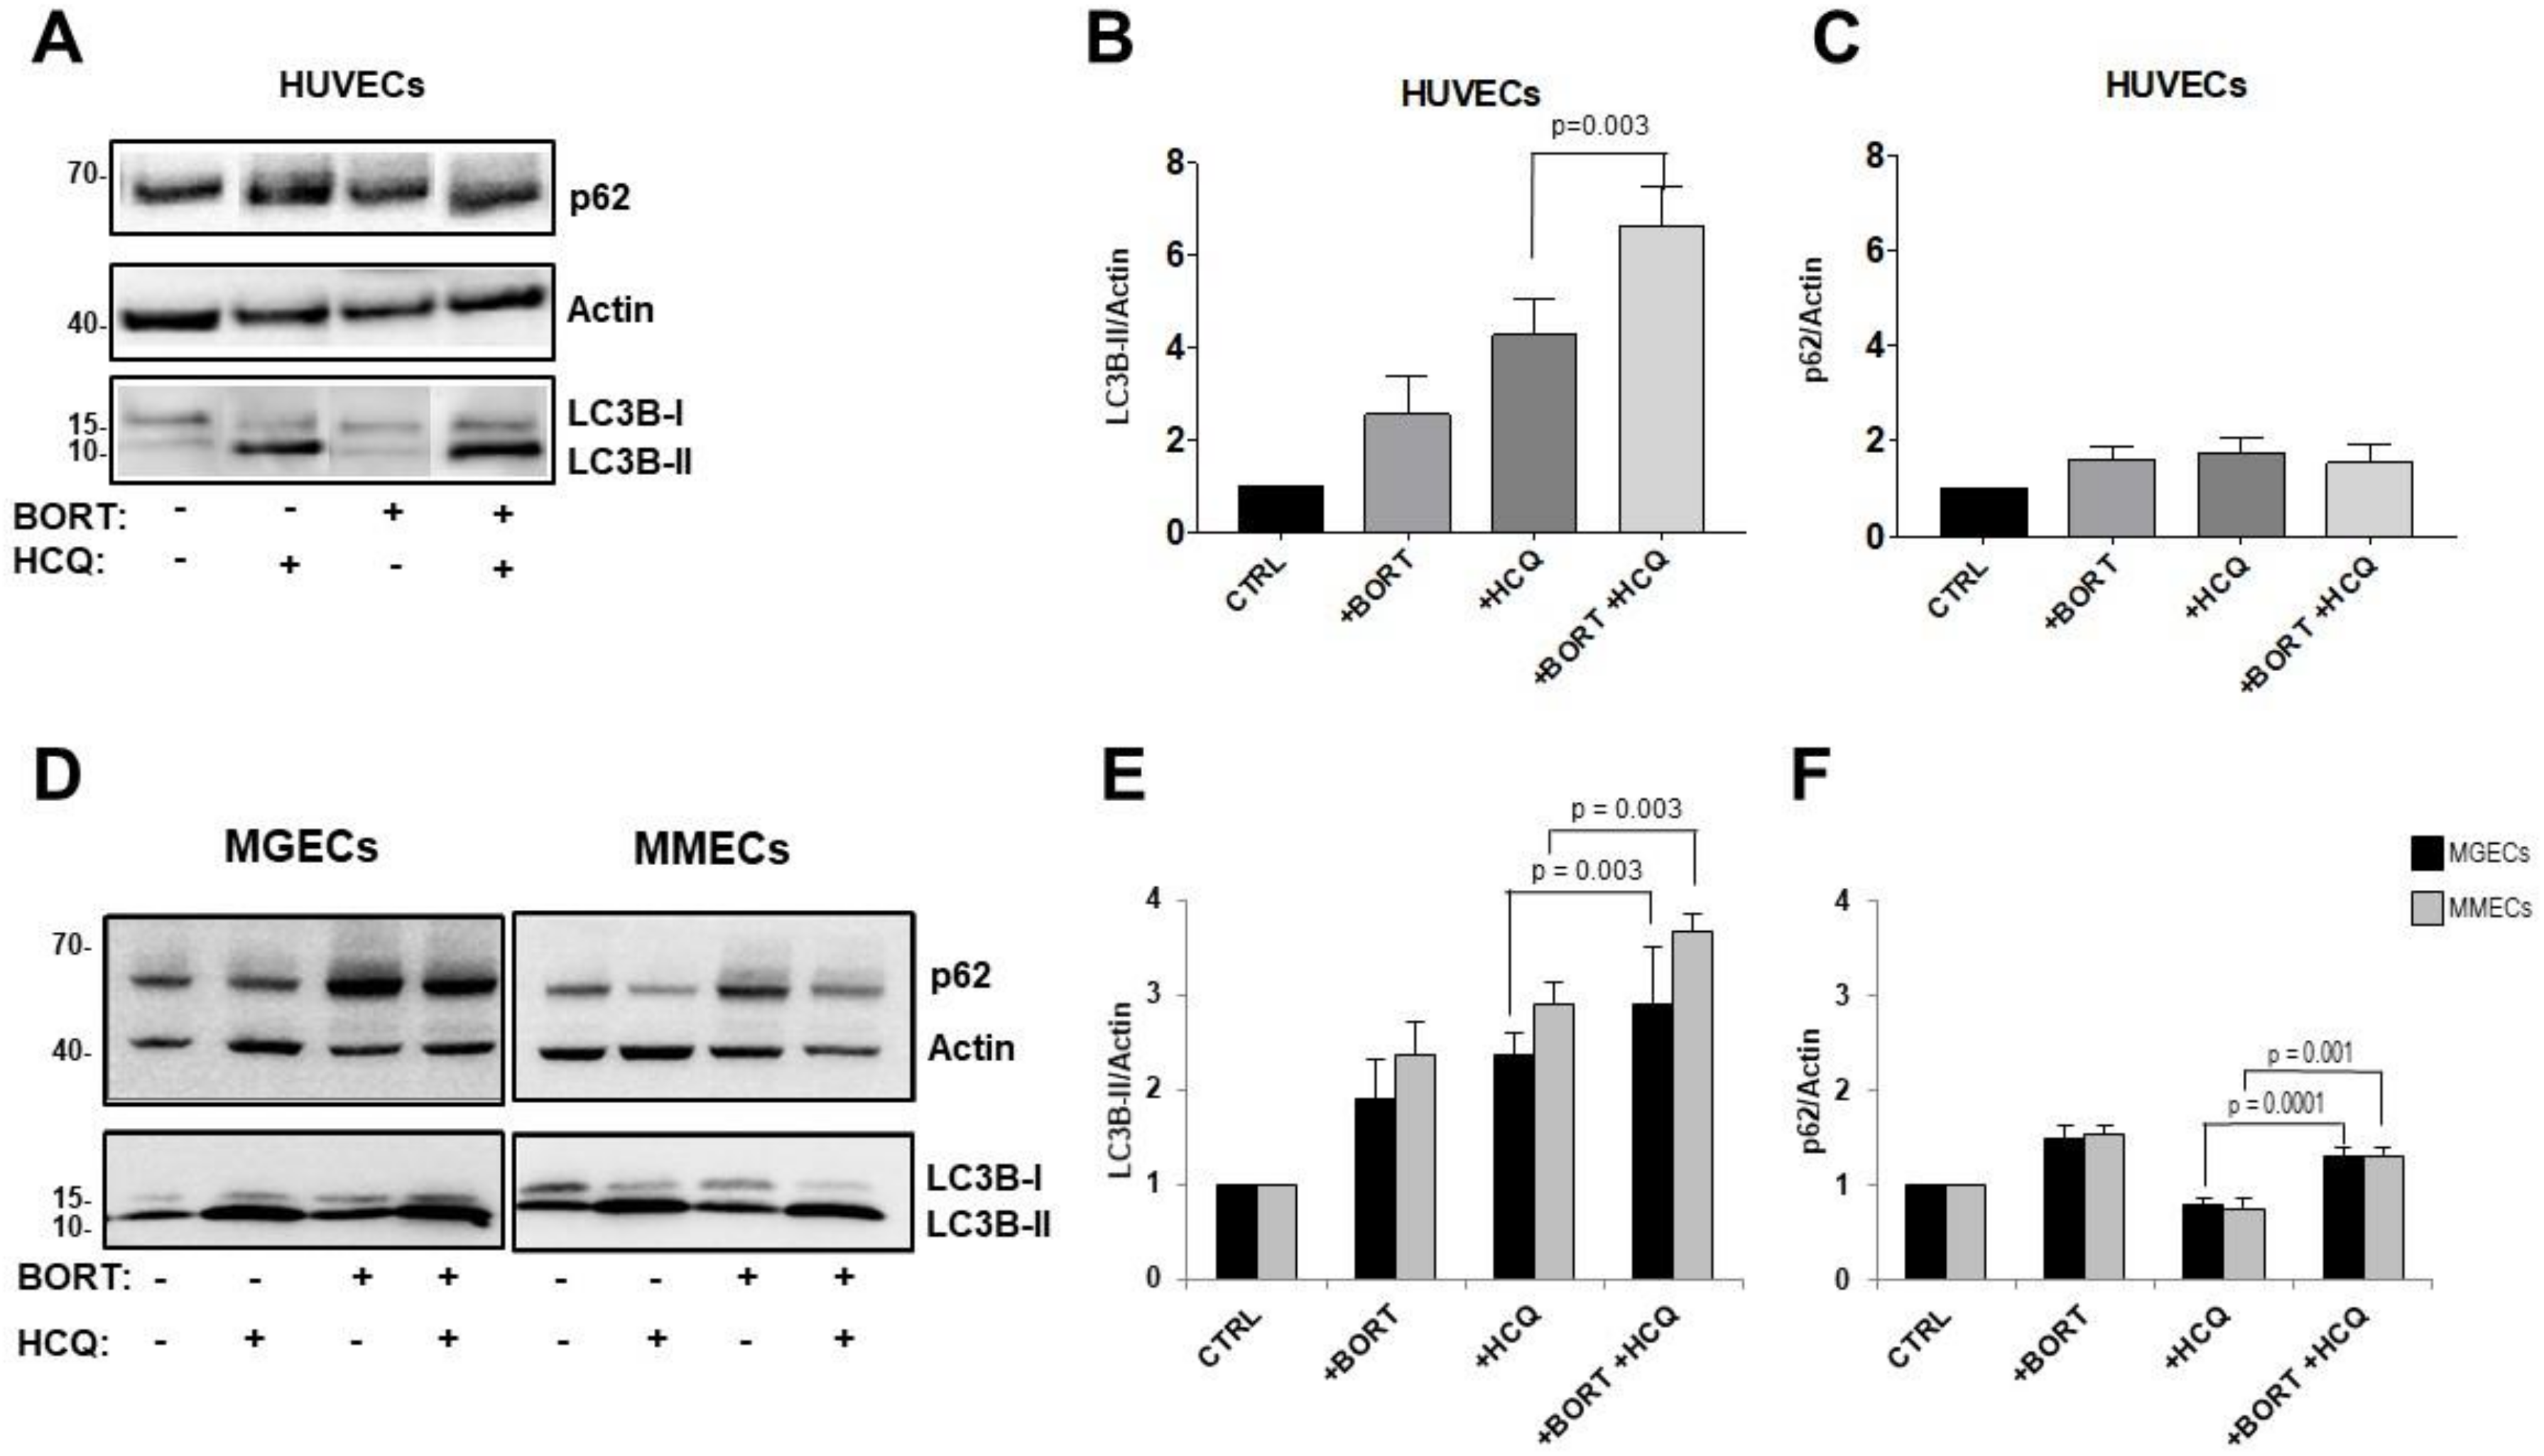
2. Results
3. Discussion
4. Materials and Methods
4.1. Study Subjects and Biological Samples
4.2. Plasma Cell Lines
4.3. Primary Endothelial Cell Preparation
4.4. Reagents
4.5. Immunoblotting
4.6. Cytotoxicity Assay
4.7. Apoptosis Assay
4.8. Protein–Protein Interaction Analysis
4.9. Statistical Analysis
Supplementary Materials
Author Contributions
Funding
Conflicts of Interest
References
- Kyle, R.A.; Rajkumar, S.V. Multiple myeloma. Blood 2008, 111, 2962–2972. [Google Scholar] [CrossRef] [Green Version]
- Siegel, R.L.; Miller, K.D.; Jemal, A. Cancer statistics, 2019. CA Cancer J. Clin. 2019, 69, 7–34. [Google Scholar] [CrossRef] [PubMed] [Green Version]
- Laubach, J.P.; Voorhees, P.M.; Hassoun, H.; Jakubowiak, A.; Lonial, S.; Richardson, P.G. Current strategies for treatment of relapsed/refractory multiple myeloma. Expert Rev. Hematol. 2014, 7, 97–111. [Google Scholar] [CrossRef]
- Yang, W.C.; Lin, S.F. Mechanisms of Drug Resistance in Relapse and Refractory Multiple Myeloma. BioMed Res. Int. 2015, 2015, 341430. [Google Scholar] [CrossRef] [PubMed] [Green Version]
- Harousseau, J.L.; Attal, M. How I treat first relapse of myeloma. Blood 2017, 130, 963–973. [Google Scholar] [CrossRef] [PubMed] [Green Version]
- Laubach, J.; Garderet, L.; Mahindra, A.; Gahrton, G.; Caers, J.; Sezer, O.; Voorhees, P.; Leleu, X.; Johnsen, H.E.; Streetly, M.; et al. Management of relapsed multiple myeloma: Recommendations of the International Myeloma Working Group. Leukemia 2016, 30, 1005–1017. [Google Scholar] [CrossRef] [PubMed]
- Adams, J.; Palombella, V.J.; Sausville, E.A.; Johnson, J.; Destree, A.; Lazarus, D.D.; Maas, J.; Pien, C.S.; Prakash, S.; Elliott, P.J. Proteasome inhibitors: A novel class of potent and effective antitumor agents. Cancer Res. 1999, 59, 2615–2622. [Google Scholar] [PubMed]
- Hideshima, T.; Mitsiades, C.; Akiyama, M.; Hayashi, T.; Chauhan, D.; Richardson, P.; Schlossman, R.; Podar, K.; Munshi, N.C.; Mitsiades, N.; et al. Molecular mechanisms mediating antimyeloma activity of proteasome inhibitor PS-341. Blood 2003, 101, 1530–1534. [Google Scholar] [CrossRef] [PubMed] [Green Version]
- Hideshima, T.; Richardson, P.; Chauhan, D.; Palombella, V.J.; Elliott, P.J.; Adams, J.; Anderson, K.C. The proteasome inhibitor PS-341 inhibits growth, induces apoptosis, and overcomes drug resistance in human multiple myeloma cells. Cancer Res. 2001, 61, 3071–3076. [Google Scholar]
- LeBlanc, R.; Catley, L.P.; Hideshima, T.; Lentzsch, S.; Mitsiades, C.S.; Mitsiades, N.; Neuberg, D.; Goloubeva, O.; Pien, C.S.; Adams, J.; et al. Proteasome inhibitor PS-341 inhibits human myeloma cell growth in vivo and prolongs survival in a murine model. Cancer Res. 2002, 62, 4996–5000. [Google Scholar]
- Mitsiades, N.; Mitsiades, C.S.; Poulaki, V.; Chauhan, D.; Fanourakis, G.; Gu, X.; Bailey, C.; Joseph, M.; Libermann, T.A.; Treon, S.P.; et al. Molecular sequelae of proteasome inhibition in human multiple myeloma cells. Proc. Natl. Acad. Sci. USA 2002, 99, 14374–14379. [Google Scholar] [CrossRef] [PubMed] [Green Version]
- Richardson, P.G.; Barlogie, B.; Berenson, J.; Singhal, S.; Jagannath, S.; Irwin, D.; Rajkumar, S.V.; Srkalovic, G.; Alsina, M.; Alexanian, R.; et al. A phase 2 study of bortezomib in relapsed, refractory myeloma. N. Engl. J. Med. 2003, 348, 2609–2617. [Google Scholar] [CrossRef] [PubMed] [Green Version]
- Richardson, P.G.; Sonneveld, P.; Schuster, M.W.; Irwin, D.; Stadtmauer, E.A.; Facon, T.; Harousseau, J.L.; Ben-Yehuda, D.; Lonial, S.; Goldschmidt, H.; et al. Bortezomib or high-dose dexamethasone for relapsed multiple myeloma. N. Engl. J. Med. 2005, 352, 2487–2498. [Google Scholar] [CrossRef] [PubMed] [Green Version]
- Egan, J.B.; Shi, C.X.; Tembe, W.; Christoforides, A.; Kurdoglu, A.; Sinari, S.; Middha, S.; Asmann, Y.; Schmidt, J.; Braggio, E.; et al. Whole-genome sequencing of multiple myeloma from diagnosis to plasma cell leukemia reveals genomic initiating events, evolution, and clonal tides. Blood 2012, 120, 1060–1066. [Google Scholar] [CrossRef]
- Keats, J.J.; Chesi, M.; Egan, J.B.; Garbitt, V.M.; Palmer, S.E.; Braggio, E.; Van Wier, S.; Blackburn, P.R.; Baker, A.S.; Dispenzieri, A.; et al. Clonal competition with alternating dominance in multiple myeloma. Blood 2012, 120, 1067–1076. [Google Scholar] [CrossRef]
- Magrangeas, F.; Avet-Loiseau, H.; Gouraud, W.; Lode, L.; Decaux, O.; Godmer, P.; Garderet, L.; Voillat, L.; Facon, T.; Stoppa, A.M.; et al. Minor clone provides a reservoir for relapse in multiple myeloma. Leukemia 2013, 27, 473–481. [Google Scholar] [CrossRef] [Green Version]
- Boudreault, J.S.; Touzeau, C.; Moreau, P. Triplet combinations in relapsed/refractory myeloma: Update on recent phase 3 trials. Expert Rev. Hematol. 2017, 10, 207–215. [Google Scholar] [CrossRef]
- Chhabra, S. Novel Proteasome Inhibitors and Histone Deacetylase Inhibitors: Progress in Myeloma Therapeutics. Pharmaceuticals (Basel) 2017, 10. [Google Scholar] [CrossRef]
- Desantis, V.; Saltarella, I.; Lamanuzzi, A.; Mariggio, M.A.; Racanelli, V.; Vacca, A.; Frassanito, M.A. Autophagy: A New Mechanism of Prosurvival and Drug Resistance in Multiple Myeloma. Transl. Oncol. 2018, 11, 1350–1357. [Google Scholar] [CrossRef]
- Ding, W.X.; Ni, H.M.; Gao, W.; Yoshimori, T.; Stolz, D.B.; Ron, D.; Yin, X.M. Linking of autophagy to ubiquitin-proteasome system is important for the regulation of endoplasmic reticulum stress and cell viability. Am. J. Pathol. 2007, 171, 513–524. [Google Scholar] [CrossRef] [Green Version]
- Li, S.; Wang, L.; Hu, Y.; Sheng, R. Autophagy regulators as potential cancer therapeutic agents: A review. Curr. Top. Med. Chem. 2015, 15, 720–744. [Google Scholar] [CrossRef] [PubMed]
- Frassanito, M.A.; De Veirman, K.; Desantis, V.; Di Marzo, L.; Vergara, D.; Ruggieri, S.; Annese, T.; Nico, B.; Menu, E.; Catacchio, I.; et al. Halting pro-survival autophagy by TGFbeta inhibition in bone marrow fibroblasts overcomes bortezomib resistance in multiple myeloma patients. Leukemia 2016, 30, 640–648. [Google Scholar] [CrossRef] [PubMed]
- Hideshima, T.; Bradner, J.E.; Wong, J.; Chauhan, D.; Richardson, P.; Schreiber, S.L.; Anderson, K.C. Small-molecule inhibition of proteasome and aggresome function induces synergistic antitumor activity in multiple myeloma. Proc. Natl. Acad. Sci. USA 2005, 102, 8567–8572. [Google Scholar] [CrossRef] [Green Version]
- Amaravadi, R.K.; Lippincott-Schwartz, J.; Yin, X.M.; Weiss, W.A.; Takebe, N.; Timmer, W.; DiPaola, R.S.; Lotze, M.T.; White, E. Principles and current strategies for targeting autophagy for cancer treatment. Clin. Cancer Res. 2011, 17, 654–666. [Google Scholar] [CrossRef] [PubMed] [Green Version]
- Hui, B.; Shi, Y.H.; Ding, Z.B.; Zhou, J.; Gu, C.Y.; Peng, Y.F.; Yang, H.; Liu, W.R.; Shi, G.M.; Fan, J. Proteasome inhibitor interacts synergistically with autophagy inhibitor to suppress proliferation and induce apoptosis in hepatocellular carcinoma. Cancer 2012, 118, 5560–5571. [Google Scholar] [CrossRef] [PubMed] [Green Version]
- Jia, L.; Gopinathan, G.; Sukumar, J.T.; Gribben, J.G. Blocking autophagy prevents bortezomib-induced NF-kappaB activation by reducing I-kappaBalpha degradation in lymphoma cells. PLoS ONE 2012, 7, e32584. [Google Scholar] [CrossRef]
- Milani, M.; Rzymski, T.; Mellor, H.R.; Pike, L.; Bottini, A.; Generali, D.; Harris, A.L. The role of ATF4 stabilization and autophagy in resistance of breast cancer cells treated with Bortezomib. Cancer Res. 2009, 69, 4415–4423. [Google Scholar] [CrossRef] [Green Version]
- Yao, F.; Wang, G.; Wei, W.; Tu, Y.; Tong, H.; Sun, S. An autophagy inhibitor enhances the inhibition of cell proliferation induced by a proteasome inhibitor in MCF-7 cells. Mol. Med. Rep. 2012, 5, 84–88. [Google Scholar] [CrossRef] [Green Version]
- Escalante, A.M.; McGrath, R.T.; Karolak, M.R.; Dorr, R.T.; Lynch, R.M.; Landowski, T.H. Preventing the autophagic survival response by inhibition of calpain enhances the cytotoxic activity of bortezomib in vitro and in vivo. Cancer Chemother. Pharmacol. 2013, 71, 1567–1576. [Google Scholar] [CrossRef] [Green Version]
- Kawaguchi, T.; Miyazawa, K.; Moriya, S.; Ohtomo, T.; Che, X.F.; Naito, M.; Itoh, M.; Tomoda, A. Combined treatment with bortezomib plus bafilomycin A1 enhances the cytocidal effect and induces endoplasmic reticulum stress in U266 myeloma cells: Crosstalk among proteasome, autophagy-lysosome and ER stress. Int. J. Oncol. 2011, 38, 643–654. [Google Scholar] [CrossRef] [Green Version]
- Ding, W.X.; Ni, H.M.; Gao, W.; Chen, X.; Kang, J.H.; Stolz, D.B.; Liu, J.; Yin, X.M. Oncogenic transformation confers a selective susceptibility to the combined suppression of the proteasome and autophagy. Mol. Cancer. Ther. 2009, 8, 2036–2045. [Google Scholar] [CrossRef] [PubMed] [Green Version]
- Amaravadi, R.K.; Yu, D.; Lum, J.J.; Bui, T.; Christophorou, M.A.; Evan, G.I.; Thomas-Tikhonenko, A.; Thompson, C.B. Autophagy inhibition enhances therapy-induced apoptosis in a Myc-induced model of lymphoma. J. Clin. Investig. 2007, 117, 326–336. [Google Scholar] [CrossRef] [PubMed] [Green Version]
- Frieboes, H.B.; Huang, J.S.; Yin, W.C.; McNally, L.R. Chloroquine-mediated cell death in metastatic pancreatic adenocarcinoma through inhibition of autophagy. JOP 2014, 15, 189–197. [Google Scholar] [CrossRef] [PubMed]
- Long, L.; Yang, X.; Southwood, M.; Lu, J.; Marciniak, S.J.; Dunmore, B.J.; Morrell, N.W. Chloroquine prevents progression of experimental pulmonary hypertension via inhibition of autophagy and lysosomal bone morphogenetic protein type II receptor degradation. Circ. Res. 2013, 112, 1159–1170. [Google Scholar] [CrossRef]
- Akdemir, G.; Heimans, L.; Bergstra, S.A.; Goekoop, R.J.; van Oosterhout, M.; van Groenendael, J.; Peeters, A.J.; Steup-Beekman, G.M.; Lard, L.R.; de Sonnaville, P.B.J.; et al. Clinical and radiological outcomes of 5-year drug-free remission-steered treatment in patients with early arthritis: IMPROVED study. Ann. Rheum. Dis. 2018, 77, 111–118. [Google Scholar] [CrossRef]
- Hsu, C.Y.; Lin, Y.S.; Su, Y.J.; Lin, H.F.; Lin, M.S.; Syu, Y.J.; Cheng, T.T.; Yu, S.F.; Chen, J.F.; Chen, T.H. Effect of long-term hydroxychloroquine on vascular events in patients with systemic lupus erythematosus: A database prospective cohort study. Rheumatology (Oxford) 2017, 56, 2212–2221. [Google Scholar] [CrossRef] [Green Version]
- Rempenault, C.; Combe, B.; Barnetche, T.; Gaujoux-Viala, C.; Lukas, C.; Morel, J.; Hua, C. Metabolic and cardiovascular benefits of hydroxychloroquine in patients with rheumatoid arthritis: A systematic review and meta-analysis. Ann. Rheum. Dis. 2018, 77, 98–103. [Google Scholar] [CrossRef]
- Vogl, D.T.; Stadtmauer, E.A.; Tan, K.S.; Heitjan, D.F.; Davis, L.E.; Pontiggia, L.; Rangwala, R.; Piao, S.; Chang, Y.C.; Scott, E.C.; et al. Combined autophagy and proteasome inhibition: A phase 1 trial of hydroxychloroquine and bortezomib in patients with relapsed/refractory myeloma. Autophagy 2014, 10, 1380–1390. [Google Scholar] [CrossRef] [Green Version]
- Mizushima, N.; Yoshimori, T.; Levine, B. Methods in mammalian autophagy research. Cell 2010, 140, 313–326. [Google Scholar] [CrossRef] [Green Version]
- Bjorkoy, G.; Lamark, T.; Pankiv, S.; Overvatn, A.; Brech, A.; Johansen, T. Monitoring autophagic degradation of p62/SQSTM1. Methods Enzymol. 2009, 452, 181–197. [Google Scholar] [CrossRef]
- Roccaro, A.M.; Hideshima, T.; Raje, N.; Kumar, S.; Ishitsuka, K.; Yasui, H.; Shiraishi, N.; Ribatti, D.; Nico, B.; Vacca, A.; et al. Bortezomib mediates antiangiogenesis in multiple myeloma via direct and indirect effects on endothelial cells. Cancer Res. 2006, 66, 184–191. [Google Scholar] [CrossRef] [Green Version]
- Avet-Loiseau, H. Ultra high-risk myeloma. Hematol. Am. Soc. Hematol. Educ. Program. 2010, 2010, 489–493. [Google Scholar] [CrossRef] [Green Version]
- Jarauta, V.; Jaime, P.; Gonzalo, O.; de Miguel, D.; Ramirez-Labrada, A.; Martinez-Lostao, L.; Anel, A.; Pardo, J.; Marzo, I.; Naval, J. Inhibition of autophagy with chloroquine potentiates carfilzomib-induced apoptosis in myeloma cells in vitro and in vivo. Cancer Lett. 2016, 382, 1–10. [Google Scholar] [CrossRef] [PubMed]
- Bianchi, G.; Oliva, L.; Cascio, P.; Pengo, N.; Fontana, F.; Cerruti, F.; Orsi, A.; Pasqualetto, E.; Mezghrani, A.; Calbi, V.; et al. The proteasome load versus capacity balance determines apoptotic sensitivity of multiple myeloma cells to proteasome inhibition. Blood 2009, 113, 3040–3049. [Google Scholar] [CrossRef] [PubMed]
- Racanelli, V.; Leone, P.; Frassanito, M.A.; Brunetti, C.; Perosa, F.; Ferrone, S.; Dammacco, F. Alterations in the antigen processing-presenting machinery of transformed plasma cells are associated with reduced recognition by CD8+ T cells and characterize the progression of MGUS to multiple myeloma. Blood 2010, 115, 1185–1193. [Google Scholar] [CrossRef] [Green Version]
- Kouroku, Y.; Fujita, E.; Tanida, I.; Ueno, T.; Isoai, A.; Kumagai, H.; Ogawa, S.; Kaufman, R.J.; Kominami, E.; Momoi, T. ER stress (PERK/eIF2alpha phosphorylation) mediates the polyglutamine-induced LC3 conversion, an essential step for autophagy formation. Cell Death Differ. 2007, 14, 230–239. [Google Scholar] [CrossRef] [Green Version]
- Ogata, M.; Hino, S.; Saito, A.; Morikawa, K.; Kondo, S.; Kanemoto, S.; Murakami, T.; Taniguchi, M.; Tanii, I.; Yoshinaga, K.; et al. Autophagy is activated for cell survival after endoplasmic reticulum stress. Mol. Cell. Biol. 2006, 26, 9220–9231. [Google Scholar] [CrossRef] [Green Version]
- Kawano, Y.; Moschetta, M.; Manier, S.; Glavey, S.; Gorgun, G.T.; Roccaro, A.M.; Anderson, K.C.; Ghobrial, I.M. Targeting the bone marrow microenvironment in multiple myeloma. Immunol. Rev. 2015, 263, 160–172. [Google Scholar] [CrossRef]
- Ribatti, D.; Vacca, A. New Insights in Anti-Angiogenesis in Multiple Myeloma. Int. J. Mol. Sci. 2018, 19. [Google Scholar] [CrossRef] [Green Version]
- Holczer, M.; Marton, M.; Kurucz, A.; Banhegyi, G.; Kapuy, O. A Comprehensive Systems Biological Study of Autophagy-Apoptosis Crosstalk during Endoplasmic Reticulum Stress. BioMed Res. Int. 2015, 2015, 319589. [Google Scholar] [CrossRef] [Green Version]
- Rao, S.; Tortola, L.; Perlot, T.; Wirnsberger, G.; Novatchkova, M.; Nitsch, R.; Sykacek, P.; Frank, L.; Schramek, D.; Komnenovic, V.; et al. A dual role for autophagy in a murine model of lung cancer. Nat. Commun. 2014, 5, 3056. [Google Scholar] [CrossRef] [Green Version]
- Leone, P.; Di Lernia, G.; Solimando, A.G.; Cicco, S.; Saltarella, I.; Lamanuzzi, A.; Ria, R.; Frassanito, M.A.; Ponzoni, M.; Ditonno, P.; et al. Bone marrow endothelial cells sustain a tumor-specific CD8(+) T cell subset with suppressive function in myeloma patients. Oncoimmunology 2019, 8. [Google Scholar] [CrossRef] [Green Version]
- Frassanito, M.A.; Desantis, V.; Di Marzo, L.; Craparotta, I.; Beltrame, L.; Marchini, S.; Annese, T.; Visino, F.; Arciuli, M.; Saltarella, I.; et al. Bone marrow fibroblasts overexpress miR-27b and miR-214 in step with multiple myeloma progression, dependent on tumour cell-derived exosomes. J. Pathol. 2019, 247, 241–253. [Google Scholar] [CrossRef] [PubMed]
- Solimando, A.G.; Da Via, M.C.; Cicco, S.; Leone, P.; Di Lernia, G.; Giannico, D.; Desantis, V.; Frassanito, M.A.; Morizio, A.; Delgado Tascon, J.; et al. High-Risk Multiple Myeloma: Integrated Clinical and Omics Approach Dissects the Neoplastic Clone and the Tumor Microenvironment. J. Clin. Med. 2019, 8. [Google Scholar] [CrossRef] [PubMed] [Green Version]
- Snel, B.; Lehmann, G.; Bork, P.; Huynen, M.A. STRING: A web-server to retrieve and display the repeatedly occurring neighbourhood of a gene. Nucleic Acids Res. 2000, 28, 3442–3444. [Google Scholar] [CrossRef] [Green Version]
- Szklarczyk, D.; Gable, A.L.; Lyon, D.; Junge, A.; Wyder, S.; Huerta-Cepas, J.; Simonovic, M.; Doncheva, N.T.; Morris, J.H.; Bork, P.; et al. STRING v11: Protein-protein association networks with increased coverage, supporting functional discovery in genome-wide experimental datasets. Nucleic Acids Res. 2019, 47, D607–D613. [Google Scholar] [CrossRef] [Green Version]
- International Myeloma Working Group. Criteria for the classification of monoclonal gammopathies, multiple myeloma and related disorders: A report of the International Myeloma Working Group. Br. J. Haematol. 2003, 121, 749–757. [Google Scholar] [CrossRef] [Green Version]


| Abbreviation | Full Form and Definition |
|---|---|
| MM | Multiple myeloma |
| MGUS | Monoclonal gammopathy of undetermined significance |
| PCs | Plasma cells |
| HCQ | Hydroxychloroquine |
| ECs | Endothelial cells |
| MGECs | Endothelial cells from MGUS patients |
| MMECs | Endothelial cells from MM patients |
| BMMCs | Bone marrow mononuclear cells |
| ATG | Autophagy related |
| MAP1LC3A | Microtubule-associated proteins 1A/1B light chain 3A |
| MAP1LC3B | Microtubule-associated proteins 1A/1B light chain 3B or LC3 |
| LC3B | Microtubule-associated protein light chain beta |
| LC3-I | Cytosolic form of LC3 |
| LC3-II | Membrane-bound form of LC3, phosphatidylethanolamine conjugated |
| RPMI 8226 | Human myeloma cell line |
| JJN3 | Human myeloma cell line |
| HUVECs | Human umbilical vein endothelial cells |
| ER | Endoplasmic reticulum |
| PKR-like | Protein kinase R-like |
| STRING | Biological database and web resource of known and predicted protein–protein interactions |
| SQSTM-1 | Sequestosome-1 also known as p62 |
| KRAS | Kirsten rat sarcoma viral oncogene homolog |
| MAF1 | Repressor of RNA polymerase III transcription |
| CDKN2A | Cyclin-dependent kinase Inhibitor 2A |
| TP53 | Tumoral protein 53 |
| BCL2 | B-cell lymphoma 2. Apoptosis regulator |
| MYC | Family of regulator genes and proto-oncogenes that code for transcription factors |
| EGFR2 | Epidermal growth factor receptor 2 |
| ERBB2 | Erythroblastic oncogene B2. Receptor tyrosine kinase |
| RAF-1 | Proto-oncogene, serine/threonine kinase |
© 2020 by the authors. Licensee MDPI, Basel, Switzerland. This article is an open access article distributed under the terms and conditions of the Creative Commons Attribution (CC BY) license (http://creativecommons.org/licenses/by/4.0/).
Share and Cite
Di Lernia, G.; Leone, P.; Solimando, A.G.; Buonavoglia, A.; Saltarella, I.; Ria, R.; Ditonno, P.; Silvestris, N.; Crudele, L.; Vacca, A.; et al. Bortezomib Treatment Modulates Autophagy in Multiple Myeloma. J. Clin. Med. 2020, 9, 552. https://doi.org/10.3390/jcm9020552
Di Lernia G, Leone P, Solimando AG, Buonavoglia A, Saltarella I, Ria R, Ditonno P, Silvestris N, Crudele L, Vacca A, et al. Bortezomib Treatment Modulates Autophagy in Multiple Myeloma. Journal of Clinical Medicine. 2020; 9(2):552. https://doi.org/10.3390/jcm9020552
Chicago/Turabian StyleDi Lernia, Giuseppe, Patrizia Leone, Antonio Giovanni Solimando, Alessio Buonavoglia, Ilaria Saltarella, Roberto Ria, Paolo Ditonno, Nicola Silvestris, Lucilla Crudele, Angelo Vacca, and et al. 2020. "Bortezomib Treatment Modulates Autophagy in Multiple Myeloma" Journal of Clinical Medicine 9, no. 2: 552. https://doi.org/10.3390/jcm9020552