Corticospinal Control of Human Locomotion as a New Determinant of Age-Related Sarcopenia: An Exploratory Study

 , ,
, ,
Abstract
:1. Introduction
2. Experimental Section
2.1. Participants
2.2. Experimental Protocol
2.3. Sarcopenia Screening
2.3.1. Body Composition
2.3.2. Muscle Strength
2.3.3. Physical Performance
2.3.4. Operational Definition of Sarcopenia
2.4. Experimental Protocol
2.5. Electrophysiology
2.5.1. Data Acquisition
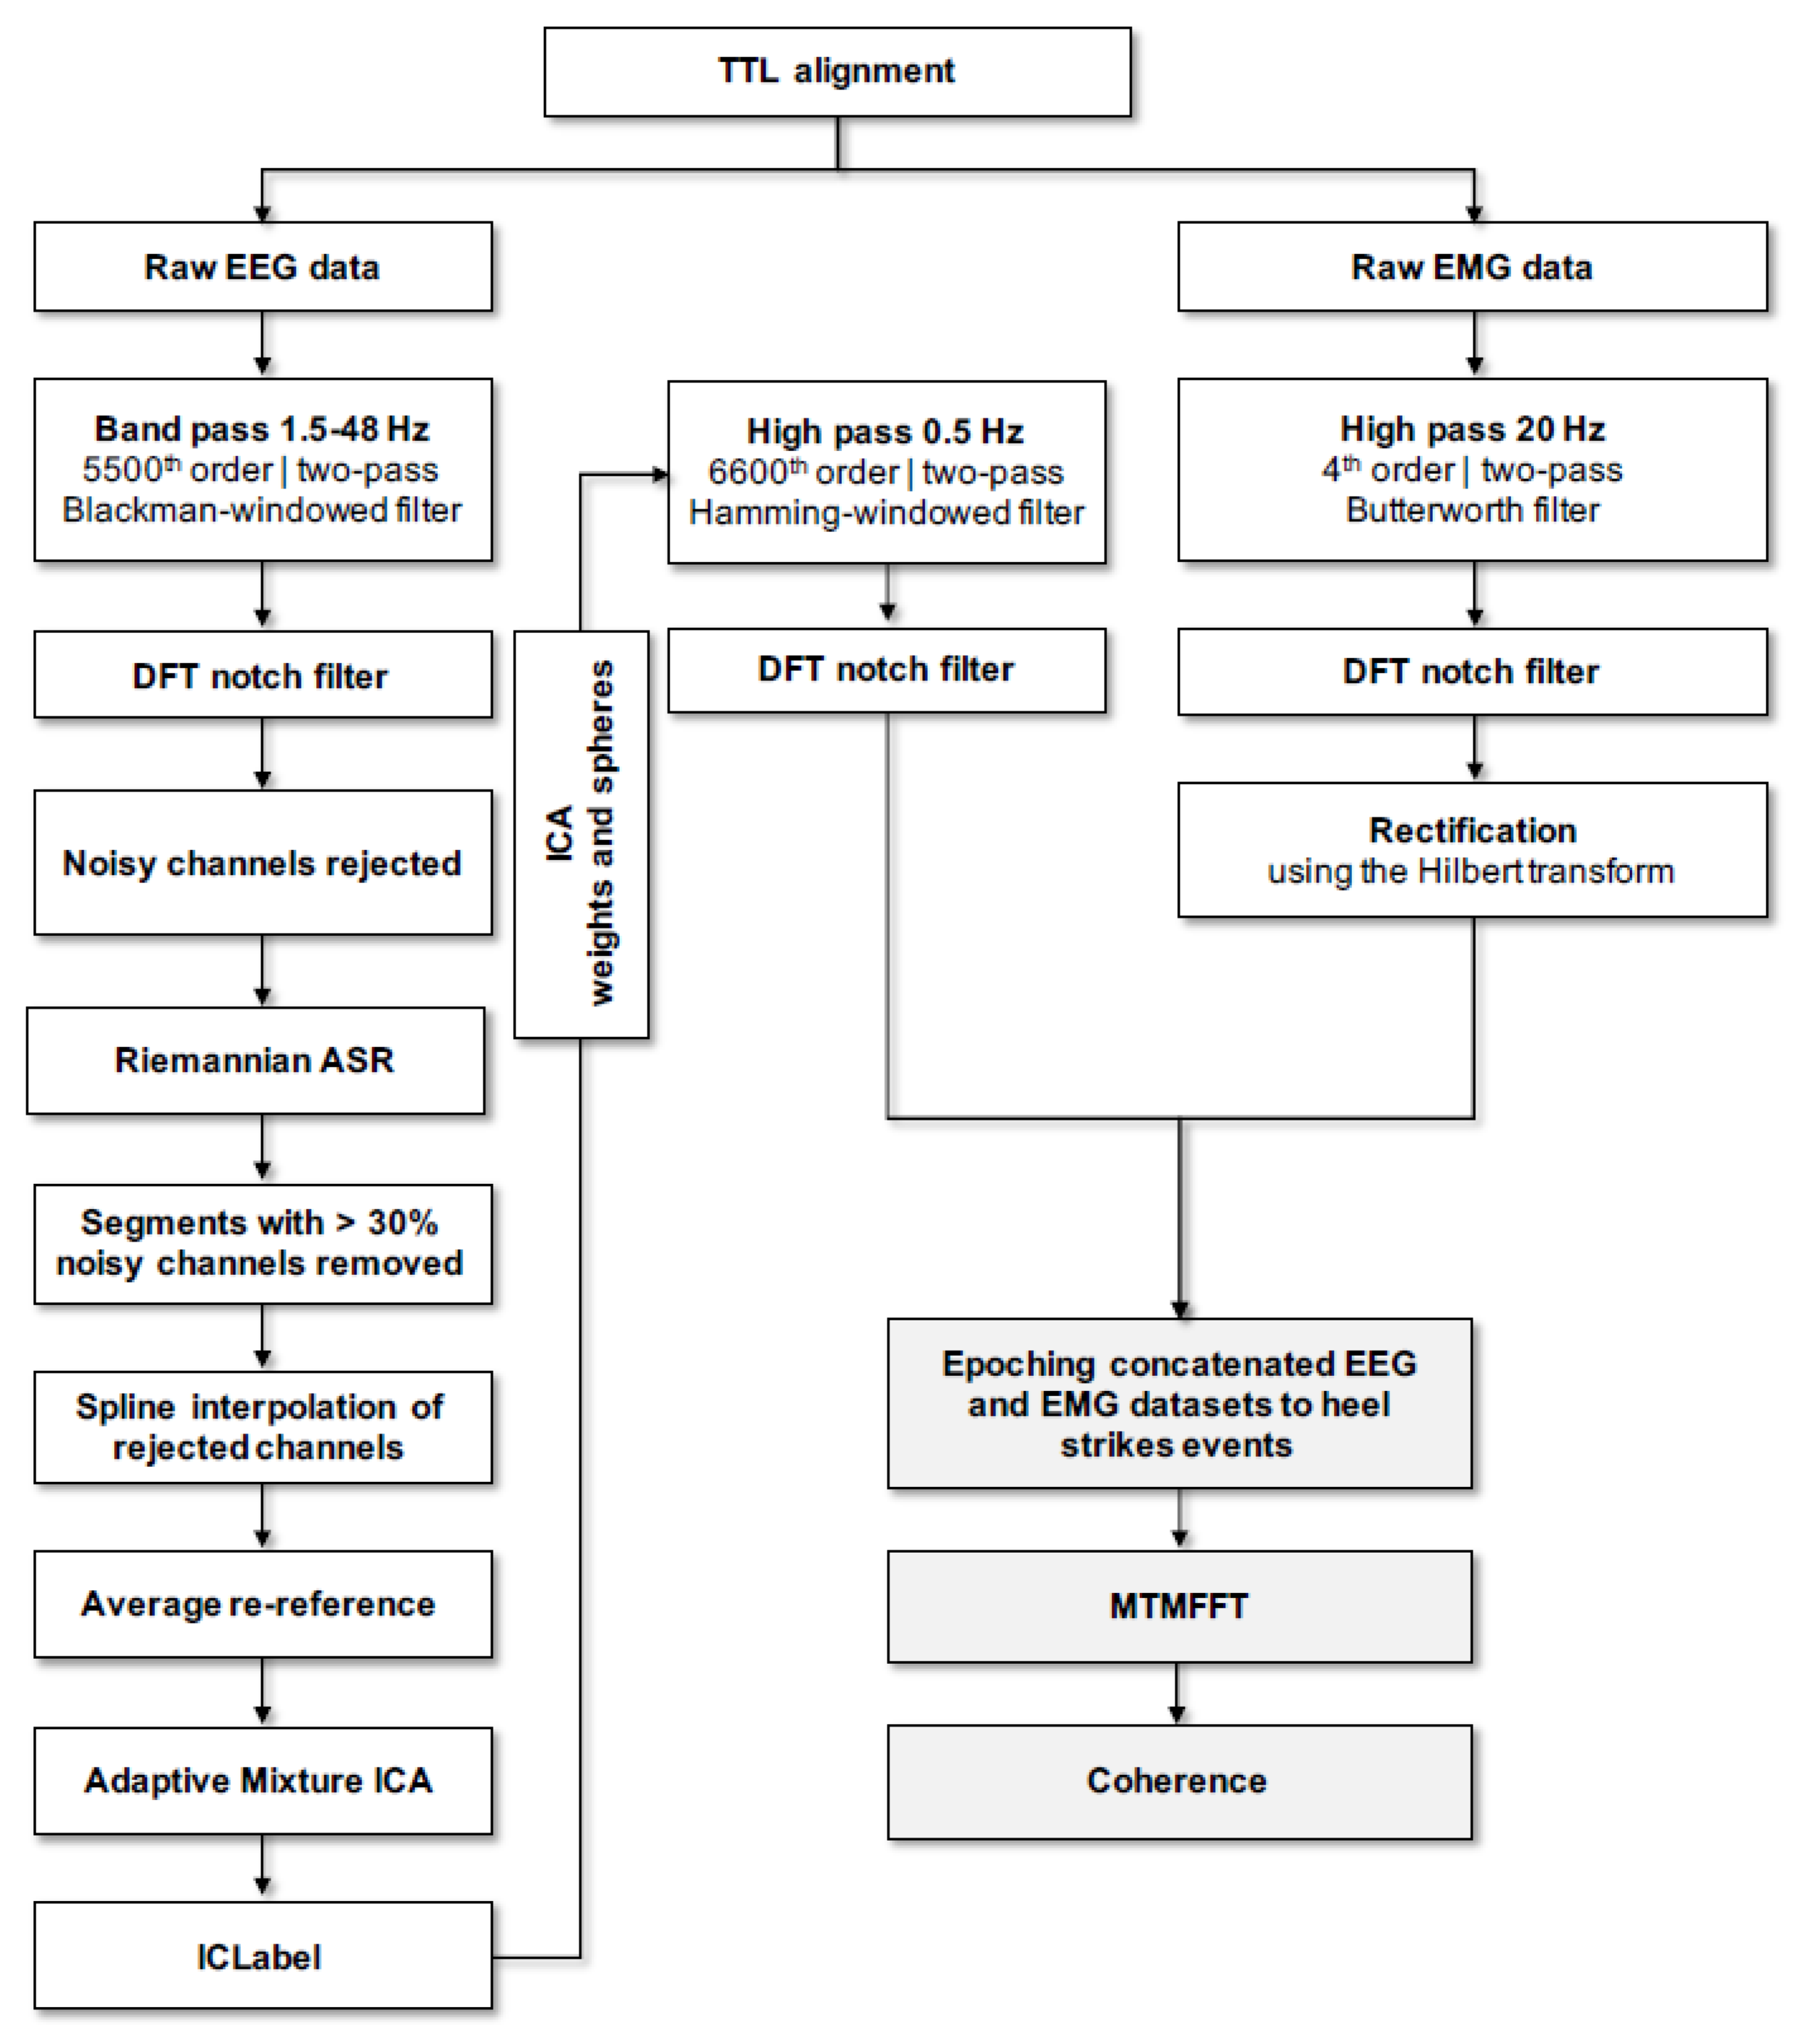
2.5.2. Data Pre-Processing
2.5.3. Spectral Analysis
2.6. Statistics
3. Results
4. Discussion
5. Conclusions
Author Contributions
Funding
Acknowledgments
Conflicts of Interest
References
- Clark, B.C.; Manini, T.M. Sarcopenia≠ dynapenia. J. Gerontol. Ser. A Biol. Sci. Med. Sci. 2008, 63, 829–834. [Google Scholar] [CrossRef]
- Falcon, L.J.; Harris-Love, M.O. Sarcopenia and the New ICD-10-CM Code: Screening, Staging, and Diagnosis Considerations. Fed. Pract. 2017, 34, 24–32. [Google Scholar]
- Rosenberg, I.H. Sarcopenia: Origins and clinical relevance. J. Nutr. 1997, 127, 990S–991S. [Google Scholar] [CrossRef] [Green Version]
- Cruz-Jentoft, A.J.; Baeyens, J.P.; Bauer, J.M.; Boirie, Y.; Cederholm, T.; Landi, F.; Martin, F.C.; Michel, J.P.; Rolland, Y.; Schneider, S.M.; et al. Sarcopenia: European consensus on definition and diagnosis: Report of the European Working Group on Sarcopenia in Older People. Age Ageing. 2010, 39, 412–423. [Google Scholar] [CrossRef] [Green Version]
- Cruz-Jentoft, A.J.; Bahat, G.; Bauer, J.; Boirie, Y.; Bruyere, O.; Cederholm, T.; Cooper, C.; Landi, F.; Rolland, Y.; Sayer, A.A.; et al. Sarcopenia: Revised European consensus on definition and diagnosis. Age Ageing 2019, 48, 16–31. [Google Scholar] [CrossRef] [Green Version]
- Fielding, R.A.; Vellas, B.; Evans, W.J.; Bhasin, S.; Morley, J.E.; Newman, A.B.; Abellan van Kan, G.; Andrieu, S.; Bauer, J.; Breuille, D.; et al. Sarcopenia: An undiagnosed condition in older adults. Current consensus definition: Prevalence, etiology, and consequences. International working group on sarcopenia. J. Am. Med. Dir. Assoc. 2011, 12, 249–256. [Google Scholar] [CrossRef] [Green Version]
- Morley, J.E.; Abbatecola, A.M.; Argiles, J.M.; Baracos, V.; Bauer, J.; Bhasin, S.; Cederholm, T.; Coats, A.J.; Cummings, S.R.; Evans, W.J.; et al. Sarcopenia with limited mobility: An international consensus. J. Am. Med. Dir. Assoc. 2011, 12, 403–409. [Google Scholar] [CrossRef] [PubMed] [Green Version]
- Studenski, S.A.; Peters, K.W.; Alley, D.E.; Cawthon, P.M.; McLean, R.R.; Harris, T.B.; Ferrucci, L.; Guralnik, J.M.; Fragala, M.S.; Kenny, A.M.; et al. The FNIH sarcopenia project: Rationale, study description, conference recommendations, and final estimates. J. Gerontol. A Biol. Sci. Med. Sci. 2014, 69, 547–558. [Google Scholar] [CrossRef] [PubMed]
- Yoshida, D.; Suzuki, T.; Shimada, H.; Park, H.; Makizako, H.; Doi, T.; Anan, Y.; Tsutsumimoto, K.; Uemura, K.; Ito, T.; et al. Using two different algorithms to determine the prevalence of sarcopenia. Geriatr. Gerontol. Int. 2014, 14, 46–51. [Google Scholar] [CrossRef] [PubMed]
- Bischoff-Ferrari, H.A.; Orav, J.E.; Kanis, J.A.; Rizzoli, R.; Schlogl, M.; Staehelin, H.B.; Willett, W.C.; Dawson-Hughes, B. Comparative performance of current definitions of sarcopenia against the prospective incidence of falls among community-dwelling seniors age 65 and older. Osteoporos. Int. 2015, 26, 2793–2802. [Google Scholar] [CrossRef]
- Locquet, M.; Beaudart, C.; Reginster, J.Y.; Petermans, J.; Bruyere, O. Comparison of the performance of five screening methods for sarcopenia. Clin. Epidemiol. 2018, 10, 71–82. [Google Scholar] [CrossRef] [PubMed] [Green Version]
- Manini, T.M.; Visser, M.; Won-Park, S.; Patel, K.V.; Strotmeyer, E.S.; Chen, H.; Goodpaster, B.; De Rekeneire, N.; Newman, A.B.; Simonsick, E.M.; et al. Knee extension strength cutpoints for maintaining mobility. J. Am. Geriatr. Soc. 2007, 55, 451–457. [Google Scholar] [CrossRef] [PubMed]
- von Haehling, S.; Morley, J.E.; Anker, S.D. An overview of sarcopenia: Facts and numbers on prevalence and clinical impact. J. Cachexia Sarcopenia Muscle 2010, 1, 129–133. [Google Scholar] [CrossRef] [PubMed]
- Clark, B.C.; Manini, T.M. What is dynapenia? Nutrition 2012, 28, 495–503. [Google Scholar] [CrossRef] [Green Version]
- Clark, B.C.; Manini, T.M. Functional consequences of sarcopenia and dynapenia in the elderly. Curr. Opin. Clin. Nutr. Metab. Care 2010, 13, 271–276. [Google Scholar] [CrossRef] [Green Version]
- Manini, T.M.; Clark, B.C. Dynapenia and aging: An update. J. Gerontol. A Biol. Sci. Med. Sci. 2012, 67, 28–40. [Google Scholar] [CrossRef] [Green Version]
- Kwon, Y.N.; Yoon, S.S. Sarcopenia: Neurological Point of View. J. Bone Metab. 2017, 24, 83–89. [Google Scholar] [CrossRef] [Green Version]
- Manini, T.M.; Hong, S.L.; Clark, B.C. Aging and muscle: A neuron’s perspective. Curr. Opin. Clin. Nutr. Metab. Care 2013, 16, 21–26. [Google Scholar] [CrossRef]
- Halliday, D.M.; Conway, B.A.; Farmer, S.F.; Rosenberg, J.R. Using electroencephalography to study functional coupling between cortical activity and electromyograms during voluntary contractions in humans. Neurosci. Lett. 1998, 241, 5–8. [Google Scholar] [CrossRef]
- Farmer, S.F.; Bremner, F.D.; Halliday, D.M.; Rosenberg, J.R.; Stephens, J.A. The frequency content of common synaptic inputs to motoneurones studied during voluntary isometric contraction in man. J. Physiol. 1993, 470, 127–155. [Google Scholar] [CrossRef]
- Pfurtscheller, G. Central beta rhythm during sensorimotor activities in man. Electroencephalogr. Clin. Neurophysiol. 1981, 51, 253–264. [Google Scholar] [CrossRef]
- Schoffelen, J.-M.; Oostenveld, R.; Fries, P. Neuronal coherence as a mechanism of effective corticospinal interaction. Science 2005, 308, 111–113. [Google Scholar] [CrossRef] [PubMed] [Green Version]
- Schoffelen, J.M.; Poort, J.; Oostenveld, R.; Fries, P. Selective movement preparation is subserved by selective increases in corticomuscular gamma-band coherence. J. Neurosci. 2011, 31, 6750–6758. [Google Scholar] [CrossRef] [PubMed]
- Kamp, D.; Krause, V.; Butz, M.; Schnitzler, A.; Pollok, B. Changes of cortico-muscular coherence: An early marker of healthy aging? Age 2013, 35, 49–58. [Google Scholar] [CrossRef] [PubMed]
- Johnson, A.N.; Shinohara, M. Corticomuscular coherence with and without additional task in the elderly. J. Appl. Physiol. 2012, 112, 970–981. [Google Scholar] [CrossRef] [PubMed] [Green Version]
- Bayram, M.B.; Siemionow, V.; Yue, G.H. Weakening of Corticomuscular Signal Coupling During Voluntary Motor Action in Aging. J. Gerontol. A Biol. Sci. Med. Sci. 2015, 70, 1037–1043. [Google Scholar] [CrossRef]
- Al-Yahya, E.; Dawes, H.; Smith, L.; Dennis, A.; Howells, K.; Cockburn, J. Cognitive motor interference while walking: A systematic review and meta-analysis. Neurosci. Biobehav. Rev. 2011, 35, 715–728. [Google Scholar] [CrossRef]
- Petersen, T.H.; Willerslev-Olsen, M.; Conway, B.A.; Nielsen, J.B. The motor cortex drives the muscles during walking in human subjects. J. Physiol. 2012, 590, 2443–2452. [Google Scholar] [CrossRef]
- Artoni, F.; Fanciullacci, C.; Bertolucci, F.; Panarese, A.; Makeig, S.; Micera, S.; Chisari, C. Unidirectional brain to muscle connectivity reveals motor cortex control of leg muscles during stereotyped walking. Neuroimage 2017, 159, 403–416. [Google Scholar] [CrossRef]
- Tolea, M.I.; Galvin, J.E. Sarcopenia and impairment in cognitive and physical performance. Clin. Interv. Aging 2015, 10, 663–671. [Google Scholar] [CrossRef] [Green Version]
- Nishiguchi, S.; Yamada, M.; Fukutani, N.; Adachi, D.; Tashiro, Y.; Hotta, T.; Morino, S.; Shirooka, H.; Nozaki, Y.; Hirata, H.; et al. Differential association of frailty with cognitive decline and sarcopenia in community-dwelling older adults. J. Am. Med. Dir. Assoc. 2015, 16, 120–124. [Google Scholar] [CrossRef] [PubMed] [Green Version]
- Huang, C.Y.; Hwang, A.C.; Liu, L.K.; Lee, W.J.; Chen, L.Y.; Peng, L.N.; Lin, M.H.; Chen, L.K. Association of Dynapenia, Sarcopenia, and Cognitive Impairment Among Community-Dwelling Older Taiwanese. Rejuvenation Res. 2016, 19, 71–78. [Google Scholar] [CrossRef] [PubMed]
- Hsu, Y.H.; Liang, C.K.; Chou, M.Y.; Liao, M.C.; Lin, Y.T.; Chen, L.K.; Lo, Y.K. Association of cognitive impairment, depressive symptoms and sarcopenia among healthy older men in the veterans retirement community in southern Taiwan: A cross-sectional study. Geriatr. Gerontol. Int. 2014, 14, 102–108. [Google Scholar] [CrossRef] [PubMed] [Green Version]
- Ojagbemi, A.; D’Este, C.; Verdes, E.; Chatterji, S.; Gureje, O. Gait speed and cognitive decline over 2 years in the Ibadan study of aging. Gait Posture 2015, 41, 736–740. [Google Scholar] [CrossRef] [PubMed] [Green Version]
- Gennaro, F.; de Bruin, E.D. Assessing Brain-Muscle Connectivity in Human Locomotion through Mobile Brain/Body Imaging: Opportunities, Pitfalls, and Future Directions. Front Public Health 2018, 6, 39. [Google Scholar] [CrossRef] [Green Version]
- Makeig, S.; Gramann, K.; Jung, T.-P.; Sejnowski, T.J.; Poizner, H. Linking brain, mind and behavior. Int. J. Psychophysiol. 2009, 73, 95–100. [Google Scholar] [CrossRef]
- Bulea, T.C.; Kim, J.; Damiano, D.L.; Stanley, C.J.; Park, H.-S. Prefrontal, posterior parietal and sensorimotor network activity underlying speed control during walking. Front. Hum. Neurosci. 2015, 9, 247. [Google Scholar] [CrossRef] [Green Version]
- De Sanctis, P.; Butler, J.S.; Malcolm, B.R.; Foxe, J.J. Recalibration of inhibitory control systems during walking-related dual-task interference: A mobile brain-body imaging (MOBI) study. Neuroimage 2014, 94, 55–64. [Google Scholar] [CrossRef] [Green Version]
- Castermans, T.; Duvinage, M. Corticomuscular coherence revealed during treadmill walking: Further evidence of supraspinal control in human locomotion. J. Physiol. 2013, 591, 1407–1408. [Google Scholar] [CrossRef] [Green Version]
- Malcolm, B.R.; Foxe, J.J.; Butler, J.S.; De Sanctis, P. The aging brain shows less flexible reallocation of cognitive resources during dual-task walking: A mobile brain/body imaging (MoBI) study. Neuroimage 2015, 117, 230–242. [Google Scholar] [CrossRef] [Green Version]
- Barthelemy, D.; Willerslev-Olsen, M.; Lundell, H.; Conway, B.A.; Knudsen, H.; Biering-Sorensen, F.; Nielsen, J.B. Impaired transmission in the corticospinal tract and gait disability in spinal cord injured persons. J. Neurophysiol. 2010, 104, 1167–1176. [Google Scholar] [CrossRef] [PubMed] [Green Version]
- Larsen, L.H.; Zibrandtsen, I.C.; Wienecke, T.; Kjaer, T.W.; Christensen, M.S.; Nielsen, J.B.; Langberg, H. Corticomuscular coherence in the acute and subacute phase after stroke. Clin. Neurophysiol. 2017, 128, 2217–2226. [Google Scholar] [CrossRef] [PubMed] [Green Version]
- Willerslev-Olsen, M.; Petersen, T.H.; Farmer, S.F.; Nielsen, J.B. Gait training facilitates central drive to ankle dorsiflexors in children with cerebral palsy. Brain 2015, 138, 589–603. [Google Scholar] [CrossRef] [PubMed]
- Roeder, L.; Boonstra, T.W.; Kerr, G.K. Corticomuscular control of walking in older people and people with Parkinson’s disease. Sci. Rep. 2020, 10, 2980. [Google Scholar] [CrossRef]
- von Carlowitz-Ghori, K.; Bayraktaroglu, Z.; Hohlefeld, F.U.; Losch, F.; Curio, G.; Nikulin, V.V. Corticomuscular coherence in acute and chronic stroke. Clin. Neurophysiol. 2014, 125, 1182–1191. [Google Scholar] [CrossRef]
- Fisher, K.M.; Zaaimi, B.; Williams, T.L.; Baker, S.N.; Baker, M.R. Beta-band intermuscular coherence: A novel biomarker of upper motor neuron dysfunction in motor neuron disease. Brain 2012, 135, 2849–2864. [Google Scholar] [CrossRef] [Green Version]
- Jensen, P.; Frisk, R.; Spedden, M.E.; Geertsen, S.S.; Bouyer, L.J.; Halliday, D.M.; Nielsen, J.B. Using Corticomuscular and Intermuscular Coherence to Assess Cortical Contribution to Ankle Plantar Flexor Activity During Gait. J. Mot. Behav. 2019, 51, 668–680. [Google Scholar] [CrossRef] [Green Version]
- Spedden, M.E.; Choi, J.T.; Nielsen, J.B.; Geertsen, S.S. Corticospinal control of normal and visually guided gait in healthy older and younger adults. Neurobiol. Aging 2019, 78, 29–41. [Google Scholar] [CrossRef]
- Roeder, L.; Boonstra, T.W.; Smith, S.S.; Kerr, G.K. Dynamics of corticospinal motor control during overground and treadmill walking in humans. J. Neurophysiol. 2018, 120, 1017–1031. [Google Scholar] [CrossRef]
- Spedden, M.E.; Nielsen, J.B.; Geertsen, S.S. Oscillatory Corticospinal Activity during Static Contraction of Ankle Muscles Is Reduced in Healthy Old versus Young Adults. Neural. Plast. 2018, 2018, 3432649. [Google Scholar] [CrossRef]
- Krauth, R.; Schwertner, J.; Vogt, S.; Lindquist, S.; Sailer, M.; Sickert, A.; Lamprecht, J.; Perdikis, S.; Corbet, T.; Millan, J.D.R.; et al. Cortico-Muscular Coherence Is Reduced Acutely Post-stroke and Increases Bilaterally During Motor Recovery: A Pilot Study. Front. Neurol. 2019, 10, 126. [Google Scholar] [CrossRef] [Green Version]
- Doldersum, E.; van Zijl, J.C.; Beudel, M.; Eggink, H.; Brandsma, R.; Pina-Fuentes, D.; van Egmond, M.E.; Oterdoom, D.L.M.; van Dijk, J.M.C.; Elting, J.W.J.; et al. Intermuscular coherence as biomarker for pallidal deep brain stimulation efficacy in dystonia. Clin. Neurophysiol. 2019, 130, 1351–1357. [Google Scholar] [CrossRef]
- Michel, J.P. Sarcopenia: There is a need for some steps forward. J. Am. Med. Dir. Assoc. 2014, 15, 379–380. [Google Scholar] [CrossRef]
- Gonzalez, M.C.; Heymsfield, S.B. Bioelectrical impedance analysis for diagnosing sarcopenia and cachexia: What are we really estimating? J. Cachexia Sarcopenia Muscle 2017, 8, 187–189. [Google Scholar] [CrossRef]
- He, Q.; Jiang, J.; Xie, L.; Zhang, L.; Yang, M. A sarcopenia index based on serum creatinine and cystatin C cannot accurately detect either low muscle mass or sarcopenia in urban community-dwelling older people. Sci. Rep. 2018, 8, 11534. [Google Scholar] [CrossRef] [Green Version]
- Hars, M.; Biver, E.; Chevalley, T.; Herrmann, F.; Rizzoli, R.; Ferrari, S.; Trombetti, A. Low Lean Mass Predicts Incident Fractures Independently From FRAX: A Prospective Cohort Study of Recent Retirees. J. Bone Miner. Res. 2016, 31, 2048–2056. [Google Scholar] [CrossRef]
- Baumgartner, R.N.; Koehler, K.M.; Gallagher, D.; Romero, L.; Heymsfield, S.B.; Ross, R.R.; Garry, P.J.; Lindeman, R.D. Epidemiology of sarcopenia among the elderly in New Mexico. Am. J. Epidemiol. 1998, 147, 755–763. [Google Scholar] [CrossRef]
- Delmonico, M.J.; Harris, T.B.; Lee, J.S.; Visser, M.; Nevitt, M.; Kritchevsky, S.B.; Tylavsky, F.A.; Newman, A.B.; Health, A.; Body Composition, S. Alternative definitions of sarcopenia, lower extremity performance, and functional impairment with aging in older men and women. J. Am. Geriatr. Soc. 2007, 55, 769–774. [Google Scholar] [CrossRef]
- Delmonico, M.J.; Harris, T.B.; Visser, M.; Park, S.W.; Conroy, M.B.; Velasquez-Mieyer, P.; Boudreau, R.; Manini, T.M.; Nevitt, M.; Newman, A.B.; et al. Longitudinal study of muscle strength, quality, and adipose tissue infiltration. Am. J. Clin. Nutr. 2009, 90, 1579–1585. [Google Scholar]
- Chatrian, G.E.; Lettich, E.; Nelson, P.L. Ten Percent Electrode System for Topographic Studies of Spontaneous and Evoked EEG Activities. Am. J. EEG Technol. 2015, 25, 83–92. [Google Scholar] [CrossRef]
- Hermens, H.J.; Freriks, B.; Disselhorst-Klug, C.; Rau, G. Development of recommendations for SEMG sensors and sensor placement procedures. . J. Electromyogr. Kinesiol. 2000, 10, 361–374. [Google Scholar] [CrossRef]
- Oostenveld, R.; Fries, P.; Maris, E.; Schoffelen, J.M. FieldTrip: Open source software for advanced analysis of MEG, EEG, and invasive electrophysiological data. Comput. Intell. Neurosci. 2011, 2011, 156869. [Google Scholar] [CrossRef]
- Boonstra, T.W.; Breakspear, M. Neural mechanisms of intermuscular coherence: Implications for the rectification of surface electromyography. J. Neurophysiol. 2012, 107, 796–807. [Google Scholar] [CrossRef]
- Blum, S.; Jacobsen, N.S.J.; Bleichner, M.G.; Debener, S. A Riemannian Modification of Artifact Subspace Reconstruction for EEG Artifact Handling. Front Hum. Neurosci. 2019, 13, 141. [Google Scholar] [CrossRef]
- Chang, C.Y.; Hsu, S.H.; Pion-Tonachini, L.; Jung, T.P. Evaluation of Artifact Subspace Reconstruction for Automatic Artifact Components Removal in Multi-channel EEG Recordings. IEEE Trans. Biomed. Eng. 2019. [Google Scholar] [CrossRef]
- Pion-Tonachini, L.; Hsu, S.H.; Chang, C.Y.; Jung, T.P.; Makeig, S. Online automatic artifact rejection using the real-time EEG source-mapping toolbox (REST). In Proceedings of the 2018 40th Annual International Conference of the IEEE Engineering in Medicine and Biology Society (EMBC), Honolulu, HI, USA, 18–21 July 2018. [Google Scholar]
- Arad, E.; Bartsch, R.P.; Kantelhardt, J.W.; Plotnik, M. Performance-based approach for movement artifact removal from electroencephalographic data recorded during locomotion. PLoS ONE 2018, 13, e0197153. [Google Scholar] [CrossRef]
- Peterson, S.M.; Ferris, D.P. Group-level cortical and muscular connectivity during perturbations to walking and standing balance. Neuroimage 2019, 198, 93–103. [Google Scholar] [CrossRef]
- Kline, J.E.; Huang, H.J.; Snyder, K.L.; Ferris, D.P. Isolating gait-related movement artifacts in electroencephalography during human walking. J. Neural. Eng. 2015, 12, 046022. [Google Scholar] [CrossRef]
- Nathan, K.; Contreras-Vidal, J.L. Negligible Motion Artifacts in Scalp Electroencephalography (EEG) During Treadmill Walking. Front. Hum. Neurosci. 2015, 9, 708. [Google Scholar] [CrossRef] [Green Version]
- Delorme, A.; Palmer, J.; Onton, J.; Oostenveld, R.; Makeig, S. Independent EEG sources are dipolar. PLoS ONE 2012, 7, e30135. [Google Scholar] [CrossRef]
- Pion-Tonachini, L.; Kreutz-Delgado, K.; Makeig, S. ICLabel: An automated electroencephalographic independent component classifier, dataset, and website. Neuroimage 2019, 198, 181–197. [Google Scholar] [CrossRef] [Green Version]
- Bridwell, D.A.; Rachakonda, S.; Silva, R.F.; Pearlson, G.D.; Calhoun, V.D. Spatiospectral Decomposition of Multi-subject EEG: Evaluating Blind Source Separation Algorithms on Real and Realistic Simulated Data. Brain Topogr. 2018, 31, 47–61. [Google Scholar] [CrossRef]
- Ritterband-Rosenbaum, A.; Herskind, A.; Li, X.; Willerslev-Olsen, M.; Olsen, M.D.; Farmer, S.F.; Nielsen, J.B. A critical period of corticomuscular and EMG-EMG coherence detection in healthy infants aged 9–25 weeks. J. Physiol. 2017, 595, 2699–2713. [Google Scholar] [CrossRef] [Green Version]
- Yoshida, T.; Masani, K.; Zabjek, K.; Chen, R.; Popovic, M.R. Dynamic cortical participation during bilateral, cyclical ankle movements: Effects of aging. Sci. Rep. 2017, 7, 44658. [Google Scholar] [CrossRef] [Green Version]
- Gennaro, F.; de Bruin, E.D. A pilot study assessing reliability and age-related differences in corticomuscular and intramuscular coherence in ankle dorsiflexors during walking. Physiol. Rep. 2020, 8, e14378. [Google Scholar] [CrossRef]
- Jensen, P.; Jensen, N.J.; Terkildsen, C.U.; Choi, J.T.; Nielsen, J.B.; Geertsen, S.S. Increased central common drive to ankle plantar flexor and dorsiflexor muscles during visually guided gait. Physiol. Rep. 2018, 6, e13598. [Google Scholar] [CrossRef] [Green Version]
- Gwin, J.T.; Ferris, D.P. Beta- and gamma-range human lower limb corticomuscular coherence. Front. Hum. Neurosci. 2012, 6, 258. [Google Scholar] [CrossRef] [Green Version]
- Norton, J.A.; Gorassini, M.A. Changes in cortically related intermuscular coherence accompanying improvements in locomotor skills in incomplete spinal cord injury. J. Neurophysiol. 2006, 95, 2580–2589. [Google Scholar] [CrossRef] [Green Version]
- de Bruin, E.D.; Patt, N.; Ringli, L.; Gennaro, F. Playing Exergames Facilitates Central Drive to the Ankle Dorsiflexors During Gait in Older Adults; a Quasi-Experimental Investigation. Front. Aging Neurosci. 2019, 11, 263. [Google Scholar] [CrossRef] [Green Version]
- Kitatani, R.; Ohata, K.; Aga, Y.; Mashima, Y.; Hashiguchi, Y.; Wakida, M.; Maeda, A.; Yamada, S. Descending neural drives to ankle muscles during gait and their relationships with clinical functions in patients after stroke. Clin. Neurophysiol. 2016, 127, 1512–1520. [Google Scholar] [CrossRef] [Green Version]
- Goksuluk, D.; Korkmaz, S.; Zararsiz, G.; Karaagaoglu, A.E. easyROC: An Interactive Web-tool for ROC Curve Analysis Using R Language Environment. R. J. 2016, 8, 213–230. [Google Scholar] [CrossRef] [Green Version]
- Ho, J.; Tumkaya, T.; Aryal, S.; Choi, H.; Claridge-Chang, A. Moving beyond P values: Data analysis with estimation graphics. Nat. Methods. 2019, 16, 565–566. [Google Scholar] [CrossRef]
- de Bruin, E.D.; Schmidt, A. Walking behaviour of healthy elderly: Attention should be paid. Behav. Brain Funct. 2010, 6, 59. [Google Scholar] [CrossRef] [Green Version]
- Kristeva, R.; Patino, L.; Omlor, W. Beta-range cortical motor spectral power and corticomuscular coherence as a mechanism for effective corticospinal interaction during steady-state motor output. Neuroimage 2007, 36, 785–792. [Google Scholar] [CrossRef]
- Mendez-Balbuena, I.; Huethe, F.; Schulte-Monting, J.; Leonhart, R.; Manjarrez, E.; Kristeva, R. Corticomuscular coherence reflects interindividual differences in the state of the corticomuscular network during low-level static and dynamic forces. Cereb. Cortex 2012, 22, 628–638. [Google Scholar] [CrossRef] [Green Version]
- Mima, T.; Toma, K.; Koshy, B.; Hallett, M. Coherence between cortical and muscular activities after subcortical stroke. Stroke 2001, 32, 2597–2601. [Google Scholar] [CrossRef]
- Fang, Y.; Daly, J.J.; Sun, J.; Hvorat, K.; Fredrickson, E.; Pundik, S.; Sahgal, V.; Yue, G.H. Functional corticomuscular connection during reaching is weakened following stroke. Clin. Neurophysiol. 2009, 120, 994–1002. [Google Scholar] [CrossRef] [Green Version]
- Rossiter, H.E.; Eaves, C.; Davis, E.; Boudrias, M.H.; Park, C.H.; Farmer, S.; Barnes, G.; Litvak, V.; Ward, N.S. Changes in the location of cortico-muscular coherence following stroke. Neuroimage Clin. 2012, 2, 50–55. [Google Scholar] [CrossRef] [Green Version]
- Zheng, Y.; Peng, Y.; Xu, G.; Li, L.; Wang, J. Using Corticomuscular Coherence to Reflect Function Recovery of Paretic Upper Limb after Stroke: A Case Study. Front. Neurol. 2017, 8, 728. [Google Scholar] [CrossRef]
- Belardinelli, P.; Laer, L.; Ortiz, E.; Braun, C.; Gharabaghi, A. Plasticity of premotor cortico-muscular coherence in severely impaired stroke patients with hand paralysis. Neuroimage Clin. 2017, 14, 726–733. [Google Scholar] [CrossRef]
- Caviness, J.N.; Adler, C.H.; Sabbagh, M.N.; Connor, D.J.; Hernandez, J.L.; Lagerlund, T.D. Abnormal corticomuscular coherence is associated with the small amplitude cortical myoclonus in Parkinson’s disease. Mov. Disord. 2003, 18, 1157–1162. [Google Scholar] [CrossRef]
- Clark, B.C.; Woods, A.J.; Clark, L.A.; Criss, C.R.; Shadmehr, R.; Grooms, D.R. The Aging Brain & the Dorsal Basal Ganglia: Implications for Age-Related Limitations of Mobility. Adv. Geriatr. Med. Res. 2019, 1, e190008. [Google Scholar]
- Wu, T.; Hallett, M.; Chan, P. Motor automaticity in Parkinson’s disease. Neurobiol. Dis. 2015, 82, 226–234. [Google Scholar] [CrossRef] [Green Version]
- Casati, M.; Costa, A.S.; Capitanio, D.; Ponzoni, L.; Ferri, E.; Agostini, S.; Lori, E. The Biological Foundations of Sarcopenia: Established and Promising Markers. Front. Med. 2019, 6, 184. [Google Scholar] [CrossRef]
- Witham, C.L.; Riddle, C.N.; Baker, M.R.; Baker, S.N. Contributions of descending and ascending pathways to corticomuscular coherence in humans. J. Physiol. 2011, 589, 3789–3800. [Google Scholar] [CrossRef] [Green Version]
- Bijlsma, J.W.; Berenbaum, F.; Lafeber, F.P. Osteoarthritis: An update with relevance for clinical practice. Lancet 2011, 377, 2115–2126. [Google Scholar] [CrossRef]
- Felson, D.T.; Naimark, A.; Anderson, J.; Kazis, L.; Castelli, W.; Meenan, R.F. The prevalence of knee osteoarthritis in the elderly. The Framingham Osteoarthritis Study. Arthritis Rheum. 1987, 30, 914–918. [Google Scholar] [CrossRef]
- Guccione, A.A.; Felson, D.T.; Anderson, J.J.; Anthony, J.M.; Zhang, Y.; Wilson, P.W.; Kelly-Hayes, M.; Wolf, P.A.; Kreger, B.E.; Kannel, W.B. The effects of specific medical conditions on the functional limitations of elders in the Framingham Study. Am. J. Public Health 1994, 84, 351–358. [Google Scholar] [CrossRef] [Green Version]
- Centers for Disease Control and Prevention. Prevalence and most common causes of disability among adults--United States, 2005. MMWR Morb. Mortal. Wkly. Rep. 2009, 58, 421–426. [Google Scholar]
- Woolf, A.D.; Pfleger, B. Burden of major musculoskeletal conditions. Bull World Health Organ. 2003, 81, 646–656. [Google Scholar]
- Berger, M.J.; Chess, D.G.; Doherty, T.J. Vastus medialis motor unit properties in knee osteoarthritis. BMC Musculoskelet. Disord. 2011, 12, 199. [Google Scholar] [CrossRef] [Green Version]
- Fink, B.; Egl, M.; Singer, J.; Fuerst, M.; Bubenheim, M.; Neuen-Jacob, E. Morphologic changes in the vastus medialis muscle in patients with osteoarthritis of the knee. Arthritis Rheum. 2007, 56, 3626–3633. [Google Scholar] [CrossRef]
- Tieland, M.; Trouwborst, I.; Clark, B.C. Skeletal muscle performance and ageing. J. Cachexia Sarcopenia Muscle 2018, 9, 3–19. [Google Scholar] [CrossRef]
- Gandevia, S.C. Spinal and supraspinal factors in human muscle fatigue. Physiol. Rev. 2001, 81, 1725–1789. [Google Scholar] [CrossRef]
- Taylor, J.L. Point: The interpolated twitch does/does not provide a valid measure of the voluntary activation of muscle. J. Appl. Physiol. 2009, 107, 354–355. [Google Scholar] [CrossRef]
- Clark, B.C.; Taylor, J.L. Age-related changes in motor cortical properties and voluntary activation of skeletal muscle. Curr. Aging Sci. 2011, 4, 192–199. [Google Scholar] [CrossRef]
- Harridge, S.D.R.; Kryger, A.; Stensgaard, A. Knee extensor strength, activation, and size in very elderly people following strength training. Muscle Nerve 1999, 22, 831–839. [Google Scholar] [CrossRef]
- Stevens, J.E.; Stackhouse, S.K.; Binder-Macleod, S.A.; Snyder-Mackler, L. Are voluntary muscle activation deficits in older adults meaningful? Muscle Nerve 2003, 27, 99–101. [Google Scholar] [CrossRef]
- Clark, D.J.; Fielding, R.A. Neuromuscular contributions to age-related weakness. J. Gerontol. A. Biol. Sci. Med. Sci. 2012, 67, 41–47. [Google Scholar] [CrossRef] [Green Version]
- Fields, D.P.; Roberts, B.M.; Simon, A.K.; Judge, A.R.; Fuller, D.D.; Mitchell, G.S. Cancer cachexia impairs neural respiratory drive in hypoxia but not hypercapnia. J. Cachexia Sarcopenia Muscle 2019, 10, 63–72. [Google Scholar] [CrossRef] [Green Version]
- Clark, B.C. Neuromuscular Changes with Aging and Sarcopenia. J Frailty Aging 2019, 8, 7–9. [Google Scholar]
- Tsekoura, M.; Billis, E.; Tsepis, E.; Dimitriadis, Z.; Matzaroglou, C.; Tyllianakis, M.; Panagiotopoulos, E.; Gliatis, J. The Effects of Group and Home-Based Exercise Programs in Elderly with Sarcopenia: A Randomized Controlled Trial. J. Clin. Med. 2018, 7, 480. [Google Scholar] [CrossRef] [Green Version]
- Yoshimura, Y.; Wakabayashi, H.; Yamada, M.; Kim, H.; Harada, A.; Arai, H. Interventions for Treating Sarcopenia: A Systematic Review and Meta-Analysis of Randomized Controlled Studies. J. Am. Med. Dir. Assoc. 2017, 18, 553.e1–553.e16. [Google Scholar] [CrossRef]
- Unhjem, R.; Lundestad, R.; Fimland, M.S.; Mosti, M.P.; Wang, E. Strength training-induced responses in older adults: Attenuation of descending neural drive with age. Age 2015, 37, 9784. [Google Scholar] [CrossRef]
- Unhjem, R.; Nygard, M.; van den Hoven, L.T.; Sidhu, S.K.; Hoff, J.; Wang, E. Lifelong strength training mitigates the age-related decline in efferent drive. J. Appl. Physiol. 2016, 121, 415–423. [Google Scholar] [CrossRef]
- Franzon, K.; Zethelius, B.; Cederholm, T.; Kilander, L. The impact of muscle function, muscle mass and sarcopenia on independent ageing in very old Swedish men. BMC Geriatr 2019, 19, 153. [Google Scholar] [CrossRef] [Green Version]
- Eggenberger, P.; Wolf, M.; Schumann, M.; de Bruin, E.D. Exergame and balance training modulate prefrontal brain activity during walking and enhance executive function in older adults. Front. Aging Neurosci. 2016, 8, 66. [Google Scholar] [CrossRef] [Green Version]
- McCaskey, M.A.; Schattin, A.; Martin-Niedecken, A.L.; de Bruin, E.D. Making More of IT: Enabling Intensive Motor Cognitive Rehabilitation Exercises in Geriatrics Using Information Technology Solutions. Biomed. Res. Int. 2018, 2018, 4856146. [Google Scholar] [CrossRef]
- Schättin, A.; Arner, R.; Gennaro, F.; de Bruin, E.D. Adaptations of prefrontal brain activity, executive functions, and gait in healthy elderly following exergame and balance training: A randomized-controlled study. Front. Aging Neurosci. 2016, 8, 278. [Google Scholar] [CrossRef] [Green Version]
- Nagano, Y.; Ishida, K.; Tani, T.; Kawasaki, M.; Ikeuchi, M. Short and long-term effects of exergaming for the elderly. Springerplus 2016, 5, 793. [Google Scholar] [CrossRef] [Green Version]
- Sato, K.; Kuroki, K.; Saiki, S.; Nagatomi, R. Improving Walking, Muscle Strength, and Balance in the Elderly with an Exergame Using Kinect: A Randomized Controlled Trial. Games Health J. 2015, 4, 161–167. [Google Scholar] [CrossRef]
- Peterson, S.J.; Braunschweig, C.A. Prevalence of Sarcopenia and Associated Outcomes in the Clinical Setting. Nutr. Clin. Pract. 2016, 31, 40–48. [Google Scholar] [CrossRef] [Green Version]


| Total (n = 198) | Women (n = 120) | Men (n = 78) | |
|---|---|---|---|
| Age (years) | 73 (6) | 73 (6) | 74 (6) |
| Height (m) | 1.65 (0.09) | 1.61 (0.06) | 1.73 (0.06) |
| Weight (kg) | 67 (11) | 62 (8) | 75 (9) |
| BMI (kg/m2) | 24.5 (2.8) | 24.1 (2.9) | 25.2 (2.6) |
| Total Body fat (kg) | 19 (6) | 20 (6) | 18 (5) |
| ALM (kg) | 19 (4) | 16 (2) | 24 (3) |
| Muscle strength (kg) | 32 (10) | 26 (5) | 42 (7) |
| Gait speed (m·s−1) | 1.08 (0.21) | 1.05 (0.21) | 1.14 (0.20) |
| Operational Definition | Skeletal Muscle Mass ① | Muscle Strength ② | Physical Performance ③ | Definition Criteria | Prevalence (%) |
|---|---|---|---|---|---|
| Low ALM Cut-Off Points | Low Handgrip (kg) | Low Gait Speed (m/s) | |||
| FNIH | ALM/BMI: ♀ ≤ 0.512 | ♂ ≤ 0.789 | ♀ < 16 | ♂ < 26 | — | ① + ② | — |
| EWGSOP1BAUM | ALM/height2: ♀ ≤ 5.45 kg/m2 | ♂ ≤ 7.26 kg/m2 | ♀ < 20 | ♂ < 30 | <0.8 | ① + ② + ③ | 4 (~2) |
| EWGSOP1DELM1 | ALM/height2: ♀ ≤ 5.67 kg/m2 | ♂ ≤ 7.25 kg/m2 | ♀ < 20 | ♂ < 30 | <0.8 | ① + ② + ③ | 6 (~3) |
| EWGSOP1DELM2 | ALM − ALMPLM < 20th percentile of the gender-specific * distribution of residuals | ♀ < 20 | ♂ < 30 | <0.8 | ① + ② + ③ | 8 (~4) |
| EWGSOP2 | ALM/height2: ♀ ≤ 6.00 kg/m2 | ♂ ≤ 7.00 kg/m2 | ♀ < 16 | ♂ < 27 | ≤0.8 | ① + ② + ③ | 2 (~1) |
| IWGS | ALM/height2: ♀ ≤ 5.67 kg/m2 | ♂ ≤ 7.23 kg/m2 | — | <1.0 | ① + ③ | 8 (~4) |
| SCWD | ALM/height2: ♀ ≤ 5.18 kg/m2 | ♂ ≤ 6.81 kg/m2 | — | <1.0 | ① + ③ | 3 (~2) |
| FNIH + EWGSOP1BAUMGARTNER + EWGSOP1DELMONICO1 + EWGSOP1DELMONICO2 + EWGSOP2 + IWGS + SCWD | 17 (~9) | ||||
| Sarcopenic (n = 11) | Non-Sarcopenic (n = 11) | |||||
|---|---|---|---|---|---|---|
| Total (n = 11) | Women (n = 9) | Men (n = 2) | Total (n = 11) | Women (n = 6) | Men (n = 5) | |
| Age (years) | 75 (7) | 73 (6) | 85 (1) | 72 (4) | 74 (4) | 71 (4) |
| Height (m) | 1.57 (0.09) | 1.54 (0.07) | 1.69 (0.04) | 1.69 (0.07) | 1.64 (0.07) | 1.74 (0.03) |
| Weight (kg) | 57 (9) | 55 (7) | 68 (12) | 69 (11) | 64 (9) | 75 (12) |
| BMI (kg/m2) | 23.2 (3.1) | 23 (3.2) | 23.9 (3.3) | 24.2 (2.8) | 23.7 (2.4) | 24.8 (3.3) |
| Total Body fat (kg) | 18 (5) | 18 (5) | 20 (9) | 18 (6) | 19 (5) | 17 (7) |
| ALM (kg) | 15 (3) | 14 (2) | 19 (2) | 21 (4) | 18 (3) | 24 (2) |
| Muscle strength (kg) | 23 (5) | 22 (4) | 31 (4) | 36 (11) | 28 (4) | 46 (6) |
| Gait speed (m·s−1) | 0.82 (0.10) | 0.79 (0.09) | 0.94 (0.04) | 1.07 (0.08) | 1.04 (0.07) | 1.10 (0.08) |
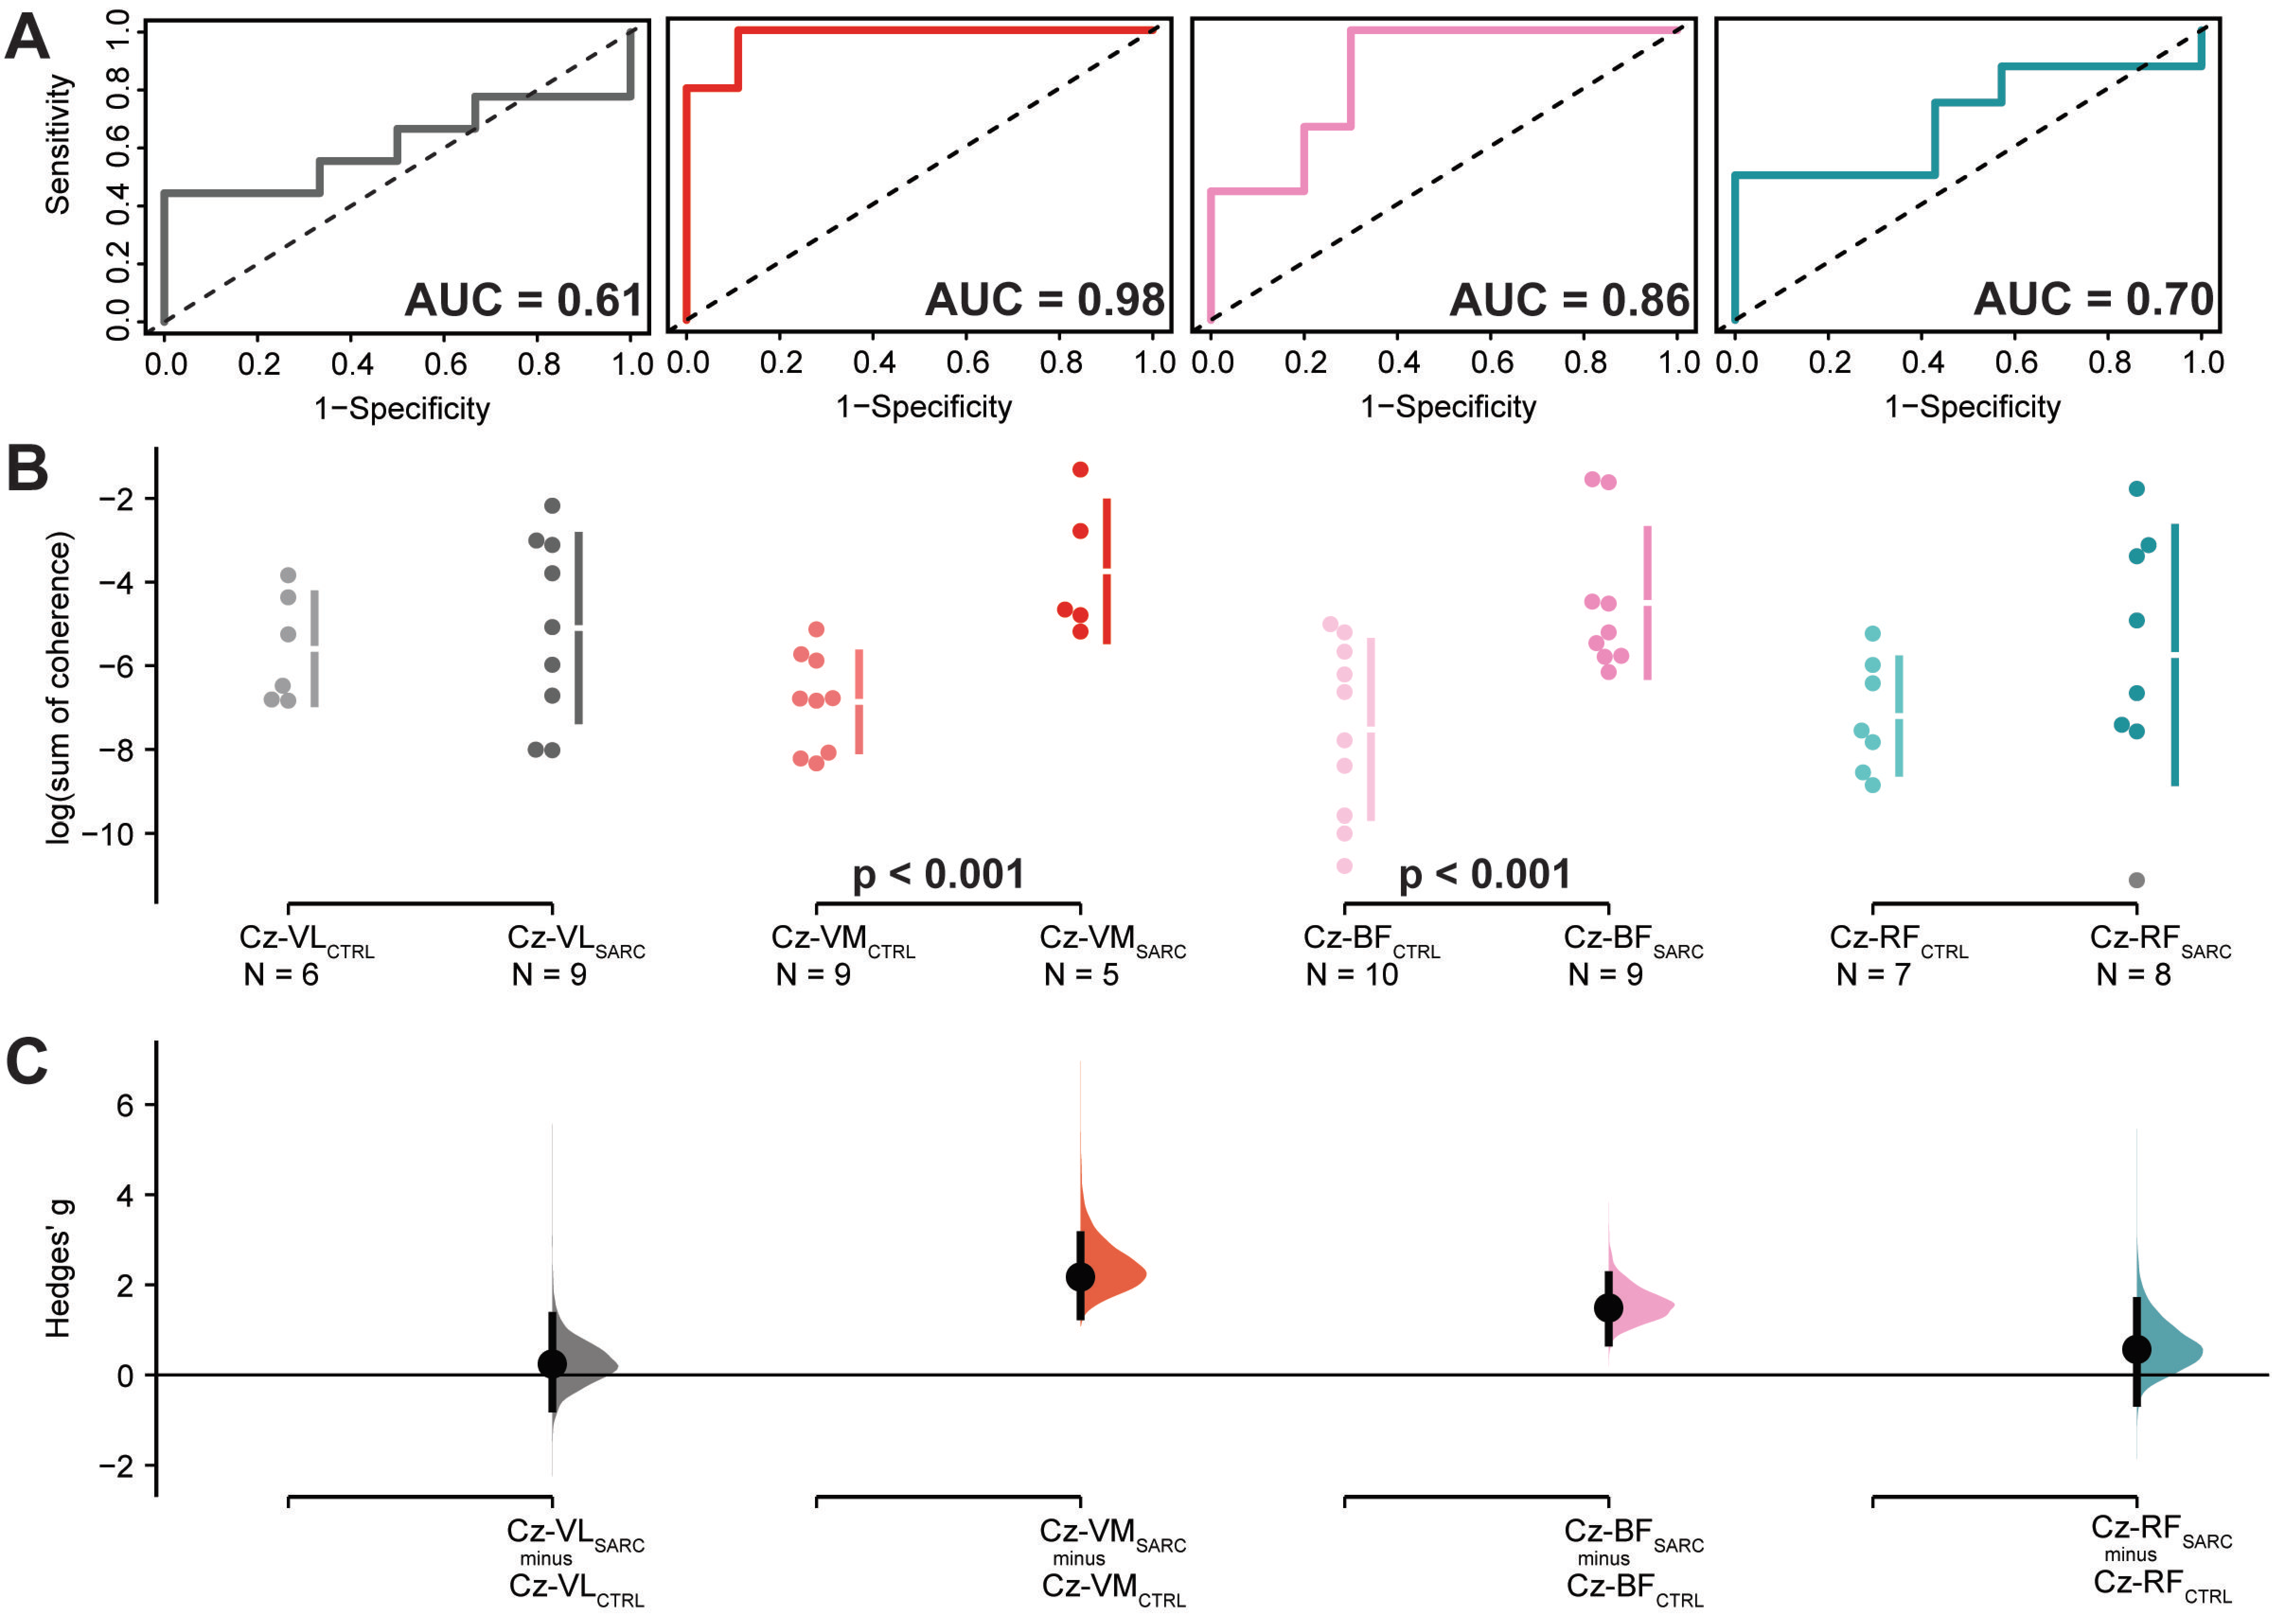
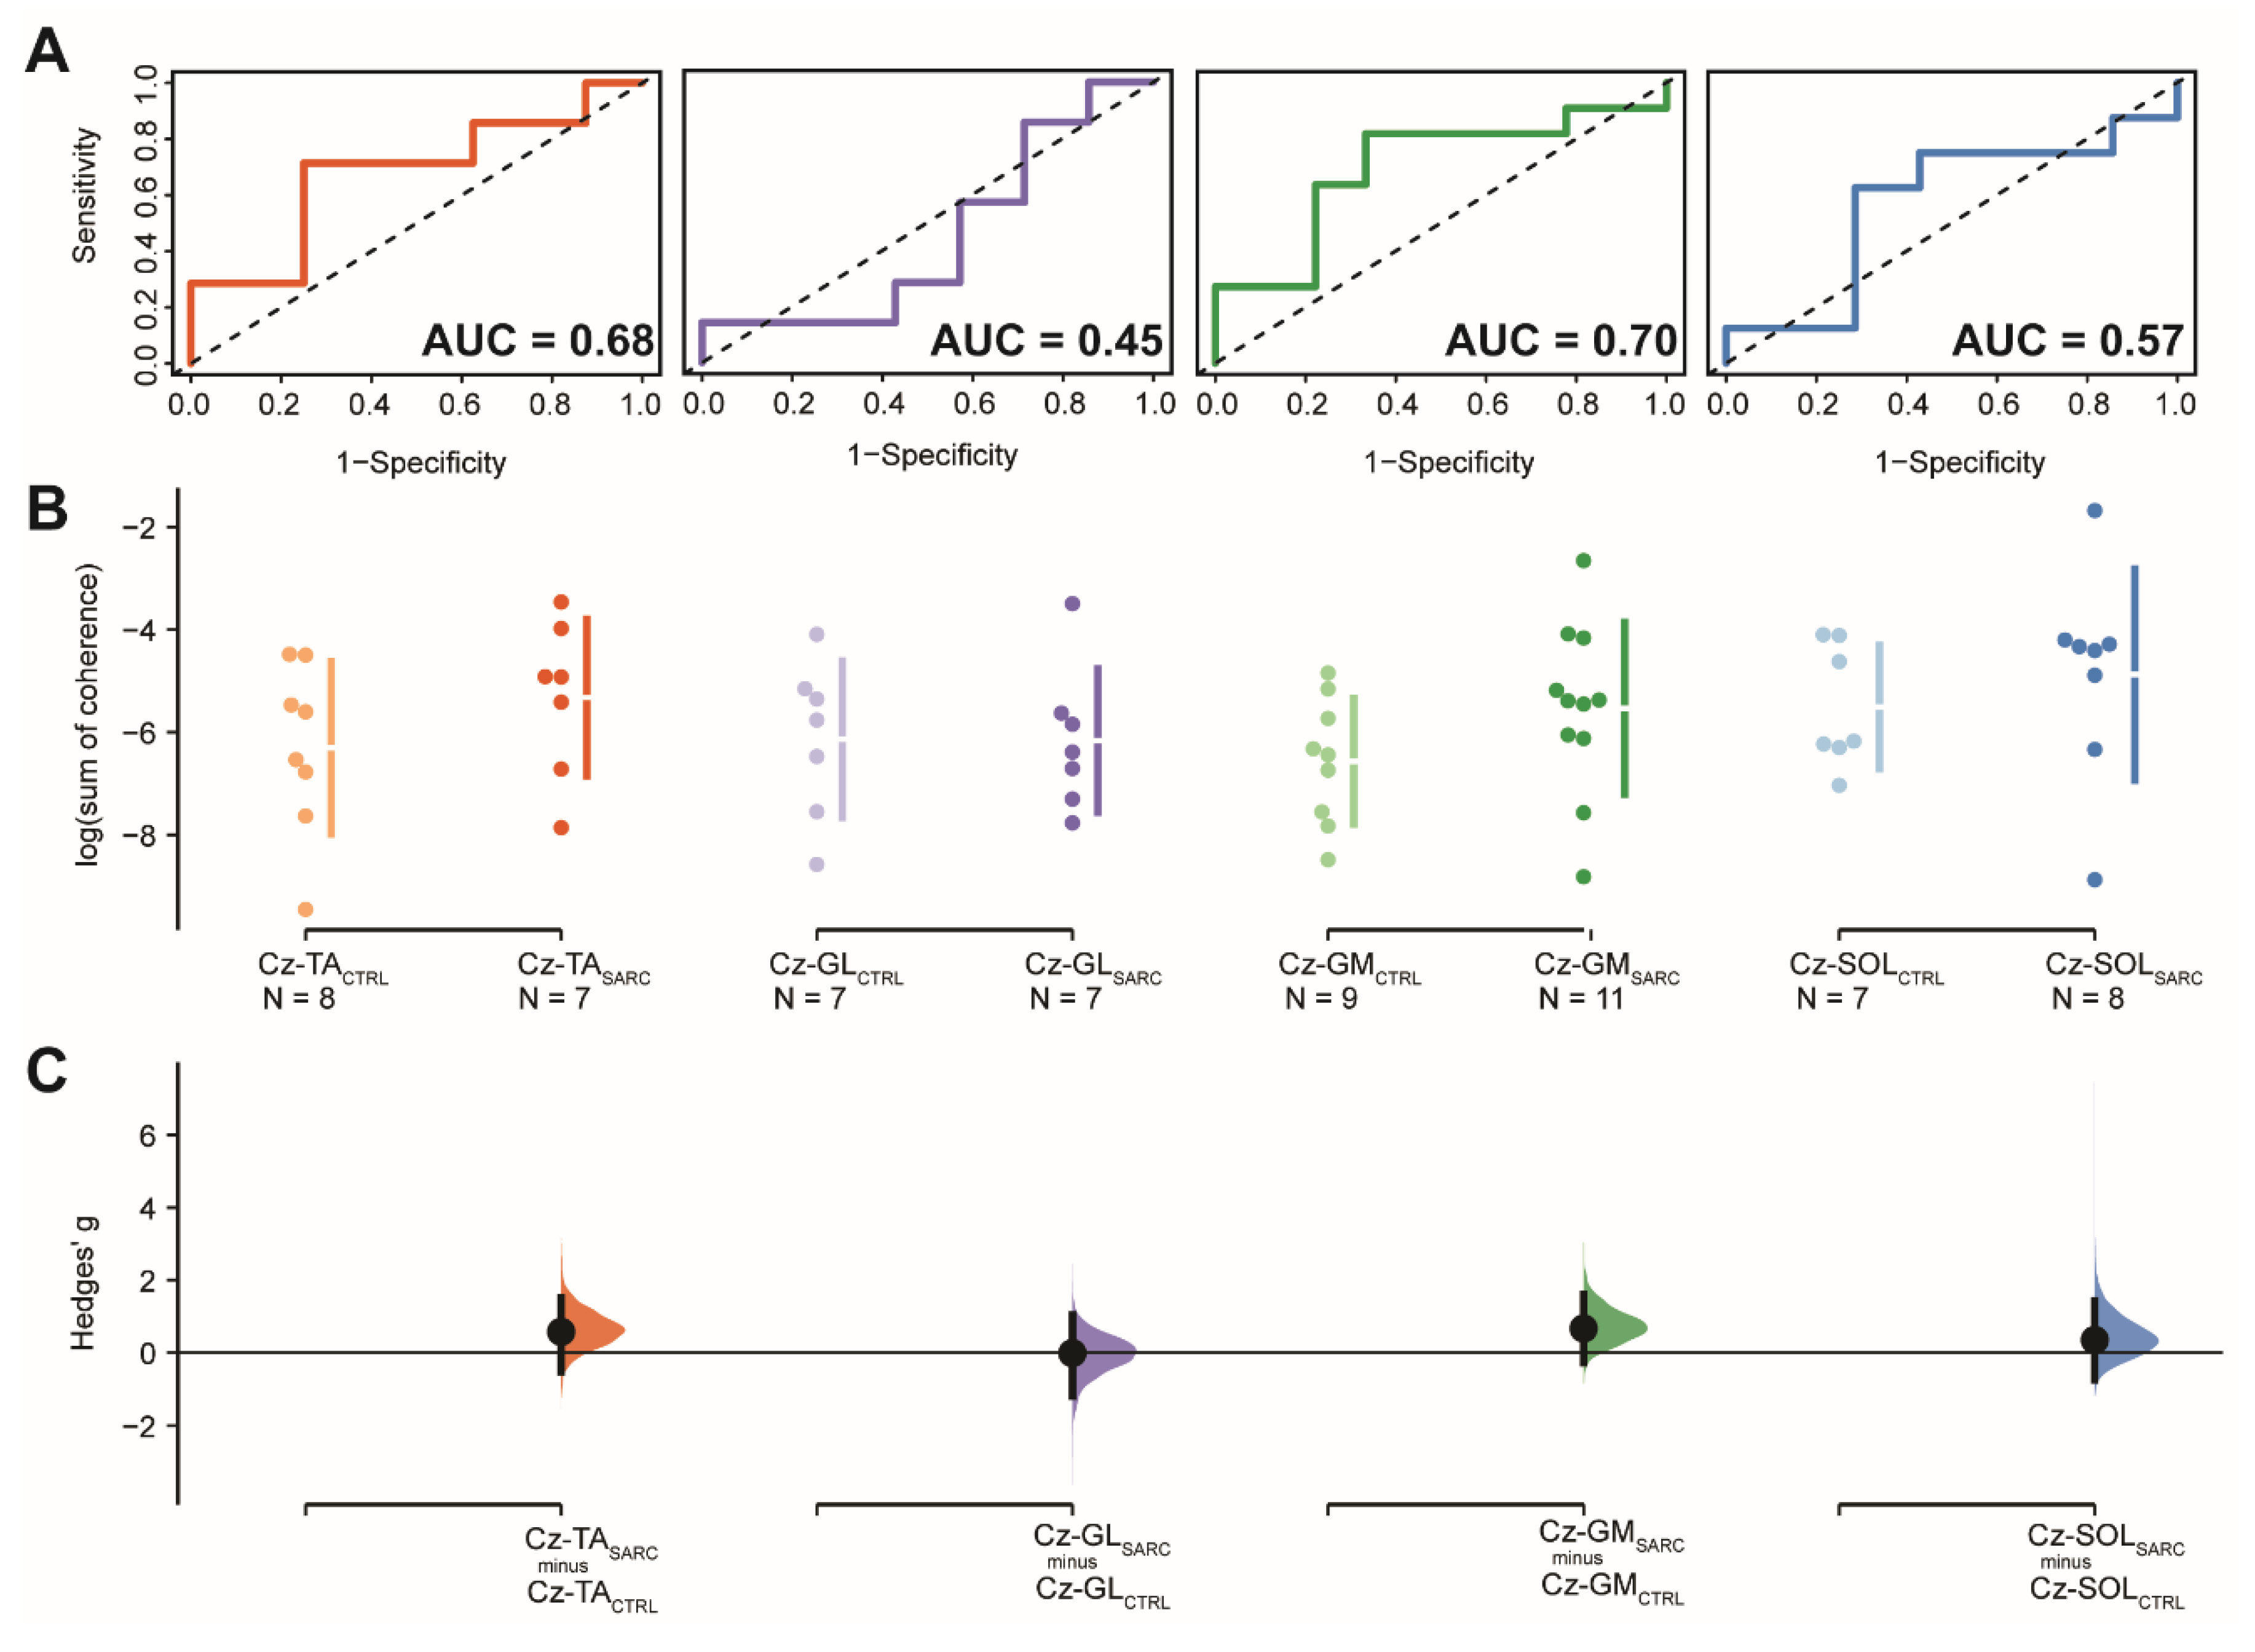
| Log (Sum of Coherence) | Sensitivity | 1-Specificity | Cut-Off | AUC (95.0%CI) | SE | z | p-Value | Hedge’s (95.0%CI) | p-Value | ||
|---|---|---|---|---|---|---|---|---|---|---|---|
| Control | Sarcopenic | ||||||||||
| Cz-TA | −6.3 (1.7) | −5.3 (1.5) | 0.71 | 0.75 | −5.4 (0.46) | 0.68 (0.38–0.98) | 0.15 | 1.17 | 0.242 | 0.57 (−0.53–1.52) | 0.272 |
| Cz-GL | −6.1 (1.5) | −6.2 (1.4) | 1.00 | 0.14 | −7.8/−7.3/−3.5 (0.14) b | 0.45 (0.11–0.79) | 0.17 | −0.29 | 0.768 | −0.02 (−1.20–1.04) | 0.798 |
| Cz-GM | −6.6 (1.2) | −5.5 (1.7) | 0.82 | 0.67 | −6.1 (0.48) | 0.70 (0.45 – 0.95) | 0.13 | 1.54 | 0.123 | 0.66 (−0.28–1.61) | 0.149 |
| Cz-SOL | −5.5 (1.2) | −4.9 (2.1) | 0.63 | 0.71 | −3.8 (0.44) | 0.57 (0.24–0.90) | 0.17 | 0.43 | 0.669 | 0.35 (−0.75–1.42) | 0.685 |
| Cz-VL | −5.6 (1.3) | −5.1 (2.2) | 0.44 | 1.00 | −4.9 (0.50) | 0.61 (0.31–0.91) | 0.15 | 0.72 | 0.473 | 0.2 (−0.7–1.3) | 0.517 |
| Cz-VM | −6.9 (1.2) | −3.7 (1.6) | 1.00 | 0.89 | −5.2 (0.89) | 0.98 (0.92–1.04) a | 0.03 | 15.20 | <0.001 | 2.2 (1.3–3.1) | 0.005 |
| Cz-BF | −7.5 (2.1) | −4.5 (1.7) | 1.00 | 0.70 | −6.2 (0.70) | 0.86 (0.68–1.03) a | 0.09 | 3.97 | <0.001 | 1.5 (0.7–2.2) | 0.010 |
| Cz-RF | −7.2 (1.4) | −5.7 (3.0) | 0.50 | 1.00 | −4.4 (0.34) | 0.70 (0.40–0.99) | 0.15 | 1.32 | 0.187 | 0.6 (−0.6–1.6) | 0.224 |
© 2020 by the authors. Licensee MDPI, Basel, Switzerland. This article is an open access article distributed under the terms and conditions of the Creative Commons Attribution (CC BY) license (http://creativecommons.org/licenses/by/4.0/).
Share and Cite
Gennaro, F.; Maino, P.; Kaelin-Lang, A.; De Bock, K.; de Bruin, E.D. Corticospinal Control of Human Locomotion as a New Determinant of Age-Related Sarcopenia: An Exploratory Study. J. Clin. Med. 2020, 9, 720. https://doi.org/10.3390/jcm9030720
Gennaro F, Maino P, Kaelin-Lang A, De Bock K, de Bruin ED. Corticospinal Control of Human Locomotion as a New Determinant of Age-Related Sarcopenia: An Exploratory Study. Journal of Clinical Medicine. 2020; 9(3):720. https://doi.org/10.3390/jcm9030720
Chicago/Turabian StyleGennaro, Federico, Paolo Maino, Alain Kaelin-Lang, Katrien De Bock, and Eling D. de Bruin. 2020. "Corticospinal Control of Human Locomotion as a New Determinant of Age-Related Sarcopenia: An Exploratory Study" Journal of Clinical Medicine 9, no. 3: 720. https://doi.org/10.3390/jcm9030720