Article

Axonopathy and Reduction of Membrane Resistance: Key Features in a New Murine Model of Human GM1-Gangliosidosis

1
Department of Pathology, University of Veterinary Medicine Hannover, D-30559 Hannover, Germany
2
Department of Physiological Chemistry, University of Veterinary Medicine Hannover, D-30559 Hannover, Germany
3
c/o Faculty of Veterinary Science, Prince of Sonkla University, 5 Karnjanavanich Rd., Hat Yai, Songkhla 90110, Thailand
4
Villa Metabolica, University of Mainz, Langenbeckstraße 2, D-55131 Mainz, Germany
5
Department for Physiology and Cell Biology, University of Veterinary Medicine Hannover, 30559 Hannover, Germany
*
Author to whom correspondence should be addressed.
J. Clin. Med. 2020, 9(4), 1004; https://doi.org/10.3390/jcm9041004
Submission received: 5 March 2020 / Revised: 29 March 2020 / Accepted: 30 March 2020 / Published: 2 April 2020

Abstract

:
GM1-gangliosidosis is caused by a reduced activity of β-galactosidase (Glb1), resulting in intralysosomal accumulations of GM1. The aim of this study was to reveal the pathogenic mechanisms of GM1-gangliosidosis in a new Glb1 knockout mouse model. Glb1−/− mice were analyzed clinically, histologically, immunohistochemically, electrophysiologically and biochemically. Morphological lesions in the central nervous system were already observed in two-month-old mice, whereas functional deficits, including ataxia and tremor, did not start before 3.5-months of age. This was most likely due to a reduced membrane resistance as a compensatory mechanism. Swollen neurons exhibited intralysosomal storage of lipids extending into axons and amyloid precursor protein positive spheroids. Additionally, axons showed a higher kinesin and lower dynein immunoreactivity compared to wildtype controls. Glb1−/− mice also demonstrated loss of phosphorylated neurofilament positive axons and a mild increase in non-phosphorylated neurofilament positive axons. Moreover, marked astrogliosis and microgliosis were found, but no demyelination. In addition to the main storage material GM1, GA1, sphingomyelin, phosphatidylcholine and phosphatidylserine were elevated in the brain. In summary, the current Glb1−/− mice exhibit a so far undescribed axonopathy and a reduced membrane resistance to compensate the functional effects of structural changes. They can be used for detailed examinations of axon–glial interactions and therapy trials of lysosomal storage diseases.

1. Introduction

GM1-gangliosidosis is a lysosomal storage disease belonging to the sphingolipidoses caused by β-galactosidase (Glb1) deficiency [1]. In addition to humans, it is described in cats [2,3,4,5,6,7,8], dogs [9,10,11,12], sheep [13,14,15,16], cattle [17,18], emus [19,20], American black bears [21], and different mouse models [22,23,24]. In humans, three different forms are distinguished depending on the age of onset, the clinical course, and affected organs. The infantile form (type 1) (OMIM# 230500) causes psychomotor disorders and seizures, damage to the central nervous system (CNS), hepatosplenomegaly, skeletal malformations, and early death during the first year of age. The late infantile or juvenile form (type 2) (OMIM#230600) manifests between seven months and three years of age, also with CNS and psychomotor symptoms and seizures. However, this form progresses more slowly than the infantile one. The adult form (type 3) (OMIM# 230650) emerges late, and causes CNS disturbances including speech and walking disorders, as well as skeletal malformations [25,26].
The disease develops due to lysosomal accumulation of the ganglioside GM1 and other lipids in the CNS and other tissues [26]. Storage is caused by a non-functional, lysosomal β-galactosidase due to numerous different mutations in humans [25,26,27,28,29] and other species like dogs [11]. Lysosomal accumulation of the ganglioside seems to lead to neuronal apoptosis and endocytoplasmic stress response [30,31], as well as axonal transport impairment in combination with loss of myelin [32]. Moreover, a neuronal and oligodendroglial miscommunication is also discussed [33]. Furthermore, a mitochondrial disorder due to autophagic processes was discussed in a Glb1 knockout mouse model [34]. Apoptosis in a murine model of GM1-gangliosidosis can be caused by an accumulation of GM1-ganglioside in the glycosphingolipid-enriched microdomain fractions of mitochondria-associated endoplasmic reticulum (ER) membranes. This leads to an influx of Ca2+ originating from the ER into mitochondria, and an activation of the mitochondrial apoptotic pathway due to a Ca2+ overload of this organelle [35]. Neuroinflammatory changes with increased MHC class II expression, infiltration of CD4+ and CD8+ cells, elevated cytokine levels (TNFα, IL1β and TGFβ1), alterations in the blood–brain barrier permeability and apoptosis have been described in other mice affected by GM1-gangliosidosis [36]. Additionally, neuroinflammation results in the release of chemokines including stromal-cell-derived factor 1 (SDF-1), macrophage inflammatory protein 1-α (MIP-1α) and MIP-1β attracting peripheral immune cells [37].
Gangliosides represent sphingolipids composed of oligosaccharides connected to ceramide [38]. Their synthesis starts in the endoplasmic reticulum (ER) and continues in the Golgi apparatus. Subsequently, they are transported to the outer layer of the plasma membrane primarily via vesicle-mediated pathways [39,40]. They take part in signal transduction, cell adhesion, cell proliferation, cell differentiation, cell recognition, apoptosis, and regulation of the cytoplasmic and intranuclear calcium homeostasis [41,42]. The breakdown of GM1-ganglioside occurs on intra-endosomal and intra-lysosomal membranes and starts with the enzyme β-galactosidase degrading GM1-ganglioside to GM2-ganglioside. Further degradation steps produce GM3, lactosylceramide, glucosylceramide, ceramide, and sphingosine [43]. In mice, an increased alternative degradation pathway of GM1 mediated by the murine neuraminidase is described, leading to an increment of GA1 accumulation in Glb1-deficient (Glb1−/−) mice compared to humans [22]. Thus, murine neuraminidase seems to have a higher affinity towards GM1 compared to the human neuraminidase [22]. Different degradation pathways of gangliosides in mice are also known from Tay–Sachs mouse models [44,45].
The progressive lysosomal accumulation of periodic acid-Schiff (PAS) positive material causes cytoplasmic vacuolation, mainly of neurons. In the early onset forms of human GM1-gangliosidosis, storage material is also described in the liver, spleen, lung, heart valves, intestine, thymus, lymph nodes, and bone marrow [46]. Destruction of neuronal tissue in infantile and late infantile GM1-gangliosidosis is characterized by neuronal cell death, including axonal damage and demyelination with oligodendrocytic loss accompanied by astrogliosis and microgliosis [26,32,47]. Demyelination was also described in Alaskan Huskies [48] and cats [49,50]. As pathomechanisms for demyelination in lysosomal storage diseases, oligodendrocytic malfunction, disturbance of neuronal–oligodendroglial communication, and neuronal and axonal loss have been discussed [46].
Substrate reduction therapy, chaperone-based therapy [51,52,53,54], bone marrow transplantation [55], enzyme replacement [56], and symptomatic and supportive treatment are currently available treatment strategies for lysosomal storage diseases in humans [57]. Gene therapy certainly provides the most promising results when applied early enough but has predominantly been studied in animal models yet so far [49,50,58,59,60,61,62]. Despite characterization of several animal models and detailed studies in human patients, various aspects of the pathogenesis of murine GM1-gangliosidosis, particularly regarding functional aspects, axonal damage and lack of demyelination partly remain uncertain.
Different mouse models for GM1-gangliosidosis have been generated and investigated previously [22,23,24]. Hahn et al. (1997) created Glb1 knockout mice by inserting a neomycin resistance gene into the middle of exon 6 [22]. Another Glb1 knockout mouse model was created by Matsuda et al. (1997) by inserting a neomycin resistance cassette into exon 15 [23]. Przybilla et al. (2019) targeted exon 8 of the murine Glb1 to generate a knockout mouse model [24]. All mouse models developed lesions characteristic of GM1-gangliosidosis [22,23,24]. Furthermore, feline models have been utilized in therapy trials, particularly gene therapy [49,50]. The mouse models were classified as [23] or compared with [22,24] the infantile or juvenile form of GM1-gangliosidosis despite the late onset of the disease. Moreover, myelin changes have not been described so far. The aim of the present study was to analyze the development of clinical signs, histological and immunohistochemical changes with special emphasis on axonopathy, lipid metabolism and associated electrophysiological changes in a new murine model created by an innovative gene targeting approach. Gaining a better understanding of this lysosomal storage disease will facilitate the development of innovative treatment strategies in the future.

2. Materials and Methods

2.1. Animals

Animals were housed in individually ventilated cages (Tecniplast Deutschland GmbH, Hohenpeißenberg, Germany) with 12 h light and 12 h darkness at 22–24 °C and 50%–60% humidity. Food for maintenance and breeding (ssniff Spezialdiäten GmbH, Soest, Germany) as well as water were provided ad libitum. Enrichment of the cages included mouse houses (Tecniplast Deutschland GmbH) and nesting material (ssniff Spezialdiäten GmbH).

2.2. Generation of Transgenic Mice

Glb1−/− transgenic mice were generated by inserting a 636 bp fragment of a lacZ gene into the murine Glb1 exon 15. Transcription activator-like effector nucleases (TALENs) and a knock-in vector, constructed by the company Eurofins Genomics GmbH, Ebersberg, Germany, was used to insert the fragment into the genome of murine oocytes of C57BL/6 mice in cooperation with the company Cellectis SA, Paris, France and the Laboratory of Transgenic Models of Diseases from the Institute of Molecular Genetics of the ASCR v.v.i. (Prague, the Czech Republic). The validation of the insert in exon 15 of the murine Glb1 gene (NM_009752.2, GeneID: 12091) after creating the Glb1−/− mice was performed using standard PCR methods with the forward primer GLB1TG_1_MI14 (5′-CAG CAC ACT CCT TAA ATC TCA GC-3′) in intron 14, the reverse primer GLB1TG_10_MI15 (5′-CTC AGT ACC GAG AAG GAA TCA G-3′) in intron 15 and Phusion® HF DNA-Polymerase (New England Biolabs GmbH, Frankfurt, Germany). Gel electrophoresis revealed heterozygous animals for the Glb1 knockout, which were further examined by cloning the transgene amplicon into a pCR® 4-TOPO® Vector (Invitrogen™, Life Technologies Ltd., Paisley, UK). To generate the TA-overhang necessary for the TOPO-cloning, a second PCR with 30 cycles using the Advantage® HF PCR Kit (Takara Bio Europe/Clontech S.A.S., Saint-Germain-en-Laye, France) was performed using the same primers. Ligation of the segment in the pCR® 4-TOPO® Vector was performed by using the TOPO TA cloning kit (Invitrogen™). One clone per Glb1−/− mouse was sequenced by using the primers M13 forward (5′-GTA AAA CGA CGG CCA G-3′) and M13 reverse (5′-CAG GAA ACA GCT ATG AC-3′). Sequences were analyzed using CLC Main Workbench 7 (CLC Bio, Qiagen GmbH, Hilden, Germany).

2.3. Genotyping of Mice

DNA was extracted from ear punch tissue taken from three-week-old mice. Digestion of the tissue was performed with digestion buffer 5 mM Ethylenediaminetetraacetic acid (EDTA), pH 8.0; 200 mM sodium chloride (NaCl), 100 mM 2-Amino-2-(hydroxymethyl) propane-1,3-diol (Tris), pH 8.0; 0.2% sodium dodecyl sulfate (SDS); 0.4 mg proteinase K/mL (Carl Roth GmbH & Co. KG, Karlsruhe, Germany) overnight. Standard genotyping of the mice was performed using PCR with the forward primer Glb1 Primer 0 fwd (5′-CTG TTG GCT TGA GAC CAG TGT AGT C-3′) binding in intron 14 and the reverse primer Glb1 Primer 0 rev (5′-GAT GCA TAC CTT GGA CCA CCC AG-3′) binding in exon 15 of the Glb1 gene. Subsequently, gel electrophoresis was performed in a 2% ethidium bromide gel for visualization of the PCR fragments.

2.4. Cell Culture of Fibroblasts

Murine fibroblasts from the subcutis of the abdomen and thorax of Glb1−/− and wildtype mice were isolated during necropsy as previously described [63,64] and used for the analysis of Glb1 mRNA and a β-galactosidase enzyme assay [48,65]. For this purpose, explants from the subcutis were transferred to petri dishes (Nunc GmbH, Wiesbaden, Germany) and cultured in high glucose Dulbecco’s Modified Eagle Medium (DMEM, Gibco®, Thermo Electron LED GmbH, Langenselbold, Germany) with 30% fetal calf serum (FCS) and 1% penicillin/streptomycin at 37 °C and 5% CO2. At 80% confluency, cells were passaged and used for further analysis.

2.5. Analysis of Glb1 mRNA

Glb1 mRNA was isolated from cultured murine Glb1−/− fibroblasts using TRIzol™ Reagent (ThermoFisher Scientific Inc., Carlsbad, CA, USA) in accordance with the manufacturer’s protocol. Reverse transcription was performed with random primers (Promega GmbH, Mannheim, Germany) and the Omniscript® Reverse Transcription Kit (Qiagen GmbH) following the manufacturer’s instructions. PCR of resulting cDNA was accomplished with the forward primer p864_Glb1_Exon14_Mus_S (5′-TGG TGG AGA ACA TGG GGC-3′) binding in exon 14 and the reverse primer p865_Glb1_Exon16_Mus_AS (5′-GTA TCG GCC GAG GTT AAA GC-3′) binding in exon 16 of the Glb1 gene (primers by Eurofins Genomics GmbH) and a Taq Polymerase (InvitrogenTM, Life Technologies Ltd.). The PCR product was sequenced at Seqlab Sequence Laboratories GmbH (Göttingen, Germany) for comparison to the WT sequence published in pubmed (NC_000075.6).

2.6. Enzyme Activity and Protein Determination

In cooperation with the Villa Metabolica from the University of Medicine in Mainz, the β-galactosidase enzyme activity in fibroblasts derived from Glb1−/− and WT mice was determined using the substrate 4-methylumbelliferyl-β-d-galactopyranoside (Sigma-Aldrich Chemie GmbH, Taufkirchen, Germany) and the Hitachi fluorescence photometer (F-2000, Scientific Instruments, Schwäbisch Gmünd, Germany) as described [66]. The endogenous β-galactosidase activity was measured in nmol enzymatically hydrolyzed 4-methylumbelliferyl-β-d-galactopyranoside/mg/minute. Protein quantitation was performed in accordance with the Lowry protocol [67].

2.7. Experimental Design and Scoring

24 Glb1−/− mice and 24 wildtype mice of both genders were examined for general appearance and posture, behavior and activity, and gait. Further examinations included detection of weight, parachute test [68], righting reflex [68], walking on a grid [68], hang test [69], avoidance behavior after pinching of the base of the tail, and correction of the body position after turning onto the back [68,70] (Table 1). Three male and three female Glb1−/− mice and an equal number of wildtype mice were humanely killed at two, four, six and eight months of age (n = 3 mice/gender/group). The study was approved by the Local Institutional Animal Care and Research Advisory committee and permitted by the appropriate authority (LAVES, Oldenburg, Germany, permission number: 33.9-42502-04-14/1532).

2.8. Histology

After euthanasia, tissue samples were fixed with formalin, decalcified with EDTA (only spinal cord with adjacent vertebral bodies), and embedded in paraffin as previously described [71,72]. Four µm sections were stained with hematoxylin and eosin (HE) [48,73]. The accumulation of stored material was scored semiquantitatively in the cerebral cortex, hippocampus, thalamus, cerebellum with molecular, Purkinje, and granular cell layer and medullary center of the cerebellum, and brainstem [74]: 0 = no accumulation of ballooning vacuoles, 1 = less than 10%, 2 = less than 30%, 3 = less than 50%, 4 = less than 70%, and 5 = more than 70% of the affected neurons. Moreover, coronal sections from the thoracic, lumbar, and sacral spinal cord were investigated. Furthermore, neurons in cervical dorsal root ganglia, trigeminal ganglia, and intramural ganglia of the stomach and small and large intestine as well as tissue samples of the lung, heart, thymus, pancreas, liver, bladder, kidneys, uterus and ovaries, testes, epididymides, vesicular gland, striated muscle and femur were evaluated.

2.9. Immunohistochemistry

Immunohistochemistry was performed on paraffin sections applying the avidin–biotin–peroxidase complex method (Vector Laboratories Inc., Burlingame, CA, USA) with the chromogen 3.3′-diaminobenzidine-tetrahydrochloride (DAB) as previously described [75,76,77,78]. Primary antibodies directed against GFAP, CNPase, APP, MBP, Iba1, and PRX were used to investigate mice of all ages (two females and two males/time point/group) (Table 1).
Immunostainings were analyzed by counting the number of GFAP positive astrocytes, APP positive spheroids, PRX positive Schwann cells, and Iba1 positive microglia/macrophages in four high power fields (400×) using an ocular grid (1 HPF: 0.0625 mm2, entire area: 0.25 mm2, Kpl-W×/18, Carl Zeiss Meditec AG, Oberkochen, Germany) in each region of interest (ROI) in the brain. CNPase and MBP stainings were scored semiquantitatively (0 = no demyelination, 1 = mild demyelination, 2 = moderate demyelination, 3 = severe demyelination). pNF, nNF, kinesin and dynein were also examined semiquantitatively (0 = no alterations between Glb1−/− and WT, 1 = mild differences, 2 = moderate differences, 3 = marked differences) and accumulations in swollen axons were counted.

2.10. Transmission Electron Microscopy

After fixation in 5% glutaraldehyde in cacodylate buffer, samples of the cerebrum, cerebellum, spinal cord, liver, and kidney were fixed in 1% osmium tetroxide, dehydrated in graded series of alcohol, and embedded in epoxy resin as described [72,73,78]. Semithin sections (0.5–1 µm) were stained with toluidine blue and examined under a light microscope (Carl Zeiss Meditec AG). From each ROI, 70 nm ultrathin sections were cut. Contrast enhancement was performed using uranyl acetate (Merck KGaA) and lead citrate. For visualization, a transmission electron microscope (Zeiss EM 10C electron microscope; Zeiss Meditec AG) was used.

2.11. Electrophysiology and Single Cell Electroporation

Electrophysiological experiments and single cell electroporation were carried out as described [80,81,82]. WT and Glb1−/− mice, 3.5–five-months-of-age-old WT and Glb1−/− mice were humanely killed and their brains were rapidly removed in an ice cold dissection solution containing (in mM): d-saccharose 120, NaCl 25, NaHCO3 25, NaH2PO4 1.25, KCl 2.5, d-glucose 25, l-ascorbic acid 0.4, myo-inositol 3, Na-pyruvate 2, MgCl2 3, CaCl2 0.1 (oxygenated with 95% O2 and 5% CO2 to obtain a pH of 7.4). Brains were trimmed and 200 µm thick transversal (brainstem) or sagittal (cerebellum) sections taken (Leica VT1200, Leica Microsystems GmbH, Wetzlar, Germany). Slices were incubated for 45 min at 34 °C in a recording solution containing (in mM): NaCl 125, NaHCO3 25, NaH2PO4 1.25, KCL 2.5, d-glucose 25, l-ascorbic acid 0.4, myo-inositol 3, Na-pyruvate 2, MgCl2 1, CaCl2 2 (oxygenated with 95% O2 and 5% CO2).
200 µm thick transversal (brainstem) or sagittal (cerebellum) sections of four-month-old WT and Glb1−/− mice were prepared and continuously perfused with a recording solution. Recordings and electroporation were carried out at 34–36 °C under visual control of a Retiga200DC camera mounted on an upright microscope (BX51WI, Olympus SE & Co. KG, Hamburg, Germany), equipped with gradient contrast illumination. For electroporation, a glass patch pipette filled with 1 mM Alexa FluorTM 594 sodium hydrazide was pressed onto a cell and a single 10–15 ms long voltage pulse of 10–15 V was applied. Cell loading was verified with a monochromator system (Till Photonics GmbH, Gräfelfing, Germany). Slices containing loaded cells were fixed in 4% paraformaldehyde overnight. After 2× 5 min washing with PBS, slices were mounted in Vectrashield (H-100, Vector Laboratories Inc., Axxora, Lörach, Germany) and sealed under a coverslip with nail polish. Confocal image stacks of fluorescently labeled cells were obtained with a SP5 System (Leica Microsystems GmbH) using a 40× or 63× objective leading to a final voxel size of 720 or 480 nm3. Images were processed using ImageJ. For electrophysiological experiments, neurons of the medial nucleus of the trapezoid body (MNTB) were patched in whole-cell configuration and recorded with an EPSC10/2 (HEKA Elektronik GmbH, Lambrecht, Germany). The internal solution consisted of (in mM): K-gluconate 145, KCl 4.5, HEPES 15, Mg-ATP 2, K-ATP 2, Na2-GTP 0.3, Na2-phosphocreatine 7, K-EGTA 0.5, Alexa 488/594 0.05, adjusted with KOH to a pH of 7.2. Data were acquired with 50 kHz, and filtered at 3 kHz. Access resistance was compensated in a voltage clamp before switching to a current clamp, where bridge balance was set at 100%. For estimating the cell capacitance in the voltage clamp, data were recorded uncompensated without filtering. Data were not corrected for the liquid junction potential of about 15 mV. Data were analyzed in IgorPro and Excel. Statistical analysis was performed in GraphPad Prism (GraphPad Software Inc., San Diego, CA, USA). Significance was given at p < 0.05. Average data were presented as mean ± sem.

2.12. Lipid Analysis

Samples were weighed and homogenized using an ultra turex in 1 mL of lysis buffer (950 µL 1% Triton X-100, Tris HCl, NaCl, sodium deoxycholate, plus 50 µL protease inhibitor mix, pH 7.4). Samples were divided into three fractions for protein and lipid quantification. The first fraction was used for protein quantification with the Bradford assay [83]. The second fraction was used to isolate lipids based on a previously published chloroform–methanol-based method [84]. The third fraction was used for sphingosine and sphinganine determination and was analyzed by HPLC coupled with a fluorescence detector as previously described with minor alterations [84].

2.13. Lipid Raft Isolation and Western Blotting

Lipid rafts were isolated from fibroblasts as described previously [85]. All solutions, materials, and handling were performed at 0-4 °C. After two washes with phosphate buffered saline, pH 7.4 (PBS), cells were scraped into 500 µL raft buffer (1% Triton X 100 in PBS) containing protease inhibitors. Homogenization was carried out by passing the cell lysate 20 times through a 21G needle. The homogenates were then kept rocking for three hours at 4 °C. Thereafter, the lysates were adjusted to 40% w/v sucrose by adding of a volume of 80% w/v sucrose prepared in PBS. A discontinuous gradient was formed: (1 mL 80% w/v sucrose, 1 mL 40% w/v lysate, 7 mL 30% w/v sucrose, and 1 mL 5% w/v sucrose). Gradients were centrifuged at 4 °C for 18 h at 100,000× g using a Beckman SW40 rotor. Nine fractions were collected at 0–4 °C from bottom to top; fractions nine and eight typically contained the detergent-soluble cell pellet, and fractions one to four contained the lipid raft fractions.
Immunoblotting was performed using 50 µL of each sucrose density gradient fraction as described [84]. After denaturing in Laemmli buffer containing 100 mM DTT for 5 min at 95 °C, proteins were separated on 12% polyacrylamide gels and subsequently transferred onto PVDF membranes. The membranes were incubated in either anti-flotillin 2 antibody (Santa Cruz, 1:1000) or anti-RhoA antibody (Santa Cruz, 1:500) for one hour at 22 °C. After washing, the membranes were incubated with the secondary anti-mouse antibody conjugated to horse radish peroxidase for one hour in 2% milk (Thermo Fisher Scientific GmbH, Dreieich, Germany, 1:5000). Protein bands were visualized using SuperSignal™ West Femto maximum sensitivity western blot chemiluminescence substrate (Thermo Fisher Scientific GmbH) and a ChemiDoc XRS System (Bio-Rad Laboratories GmbH, Munich, Germany) in accordance with the manufacturer’s protocol. Quantification of protein levels was performed with ImageJ.

2.14. Statistical Examination and Design of Figures

For statistical analysis of non-normal distributed data (histology, immunohistochemistry, enzyme assay) Mann–Whitney U-tests were performed. Statistical significance was set at p < 0.05. For statistical analysis, IBM SPSS version 25® for Windows (SPSS Inc., Chicago, IL, USA) was used. Graphs were designed with GraphPad Prism 7® for Windows (GraphPad Software Inc.).

3. Results

3.1. Glb1−/− Mice Produced Shortened Dysfunctional β-Galactosidase Due to Skipping of Exon 15

Standard genotyping by PCR analysis on the Glb1 gene demonstrated a single band of 1171 base pairs (bp) in homozygous Glb1−/− mice (with 636 bp insert), whereas a second band of 541 bp was present in heterozygous mice. WTs revealed only one band of 541 bp. Sequencing of cDNA showed skipping of exon 15 resulting in a shortened mRNA. The 636 bp insert was introduced at the position + 1640 of the cDNA (position + 63,007 of the DNA) of exon 15 (Figure 1). At this position, 6 bp from the original DNA were deleted when introducing the insert and therefore an abbreviated protein with 562 amino acids missing 85 amino acids was assumed (647 amino acids in the WT Glb1 protein; also see Figure S1, Supplementary Materials). The sequence of the protein was translated from the sequenced cDNA applying CLC Main Workbench (Qiagen Bioinformatics). Nevertheless, the protein sequence remains an assumption. Fibroblasts isolated from Glb1−/− mice aged two to six months, revealed a significantly decreased β-galactosidase activity (0.03 to 0.98 nmol/mg/min) compared to fibroblasts derived from WT control mice (3.69 to 7.91 nmol/mg/min; Figure 1).

3.2. Glb1−/− Mice Showed Increasing Neurological Disorder Starting at the Age of 3.5 to Four Months

At the age of 3.5 to four months, Glb1−/− mice developed a neurologic disorder worsening until the age of 7.5 to eight months. This age was chosen as the terminal point due to the development of severe disease. Neurologic signs included tail flipping towards the back, mild ataxia with imbalanced steps and lateral rotation of the hind limbs and shuffling gait, difficulties in walking on a horizontal grid, a delayed correction of the body position, pulling of limbs toward the trunk in the parachute test and falling off the turned grid earlier in the hang test. Neurologic tests and scores are listed in Table 2.

3.3. Significant Neuronal Storage in Glb1−/− Mice

Glb1−/− mice showed significant vacuolation and ballooning of all investigated neurons (Figure 2). The most severe lesions were present in the brainstem, thalamus as well as the medullary center and Purkinje cell layer of the cerebellum, and were also prominent in spinal cord gray matter (Figure 2). Mild vacuolation of neurons was already present in clinically unremarkable two-month-old mice (Figure 2(b1–b5)). Accumulation of the storage material in neurons continuously increased until eight months of age. At this time point, the cytoplasm of neurons in the CNS and ganglia was nearly completely filled with large vacuoles containing PAS positive material (Figure S2; Supplementary Materials).

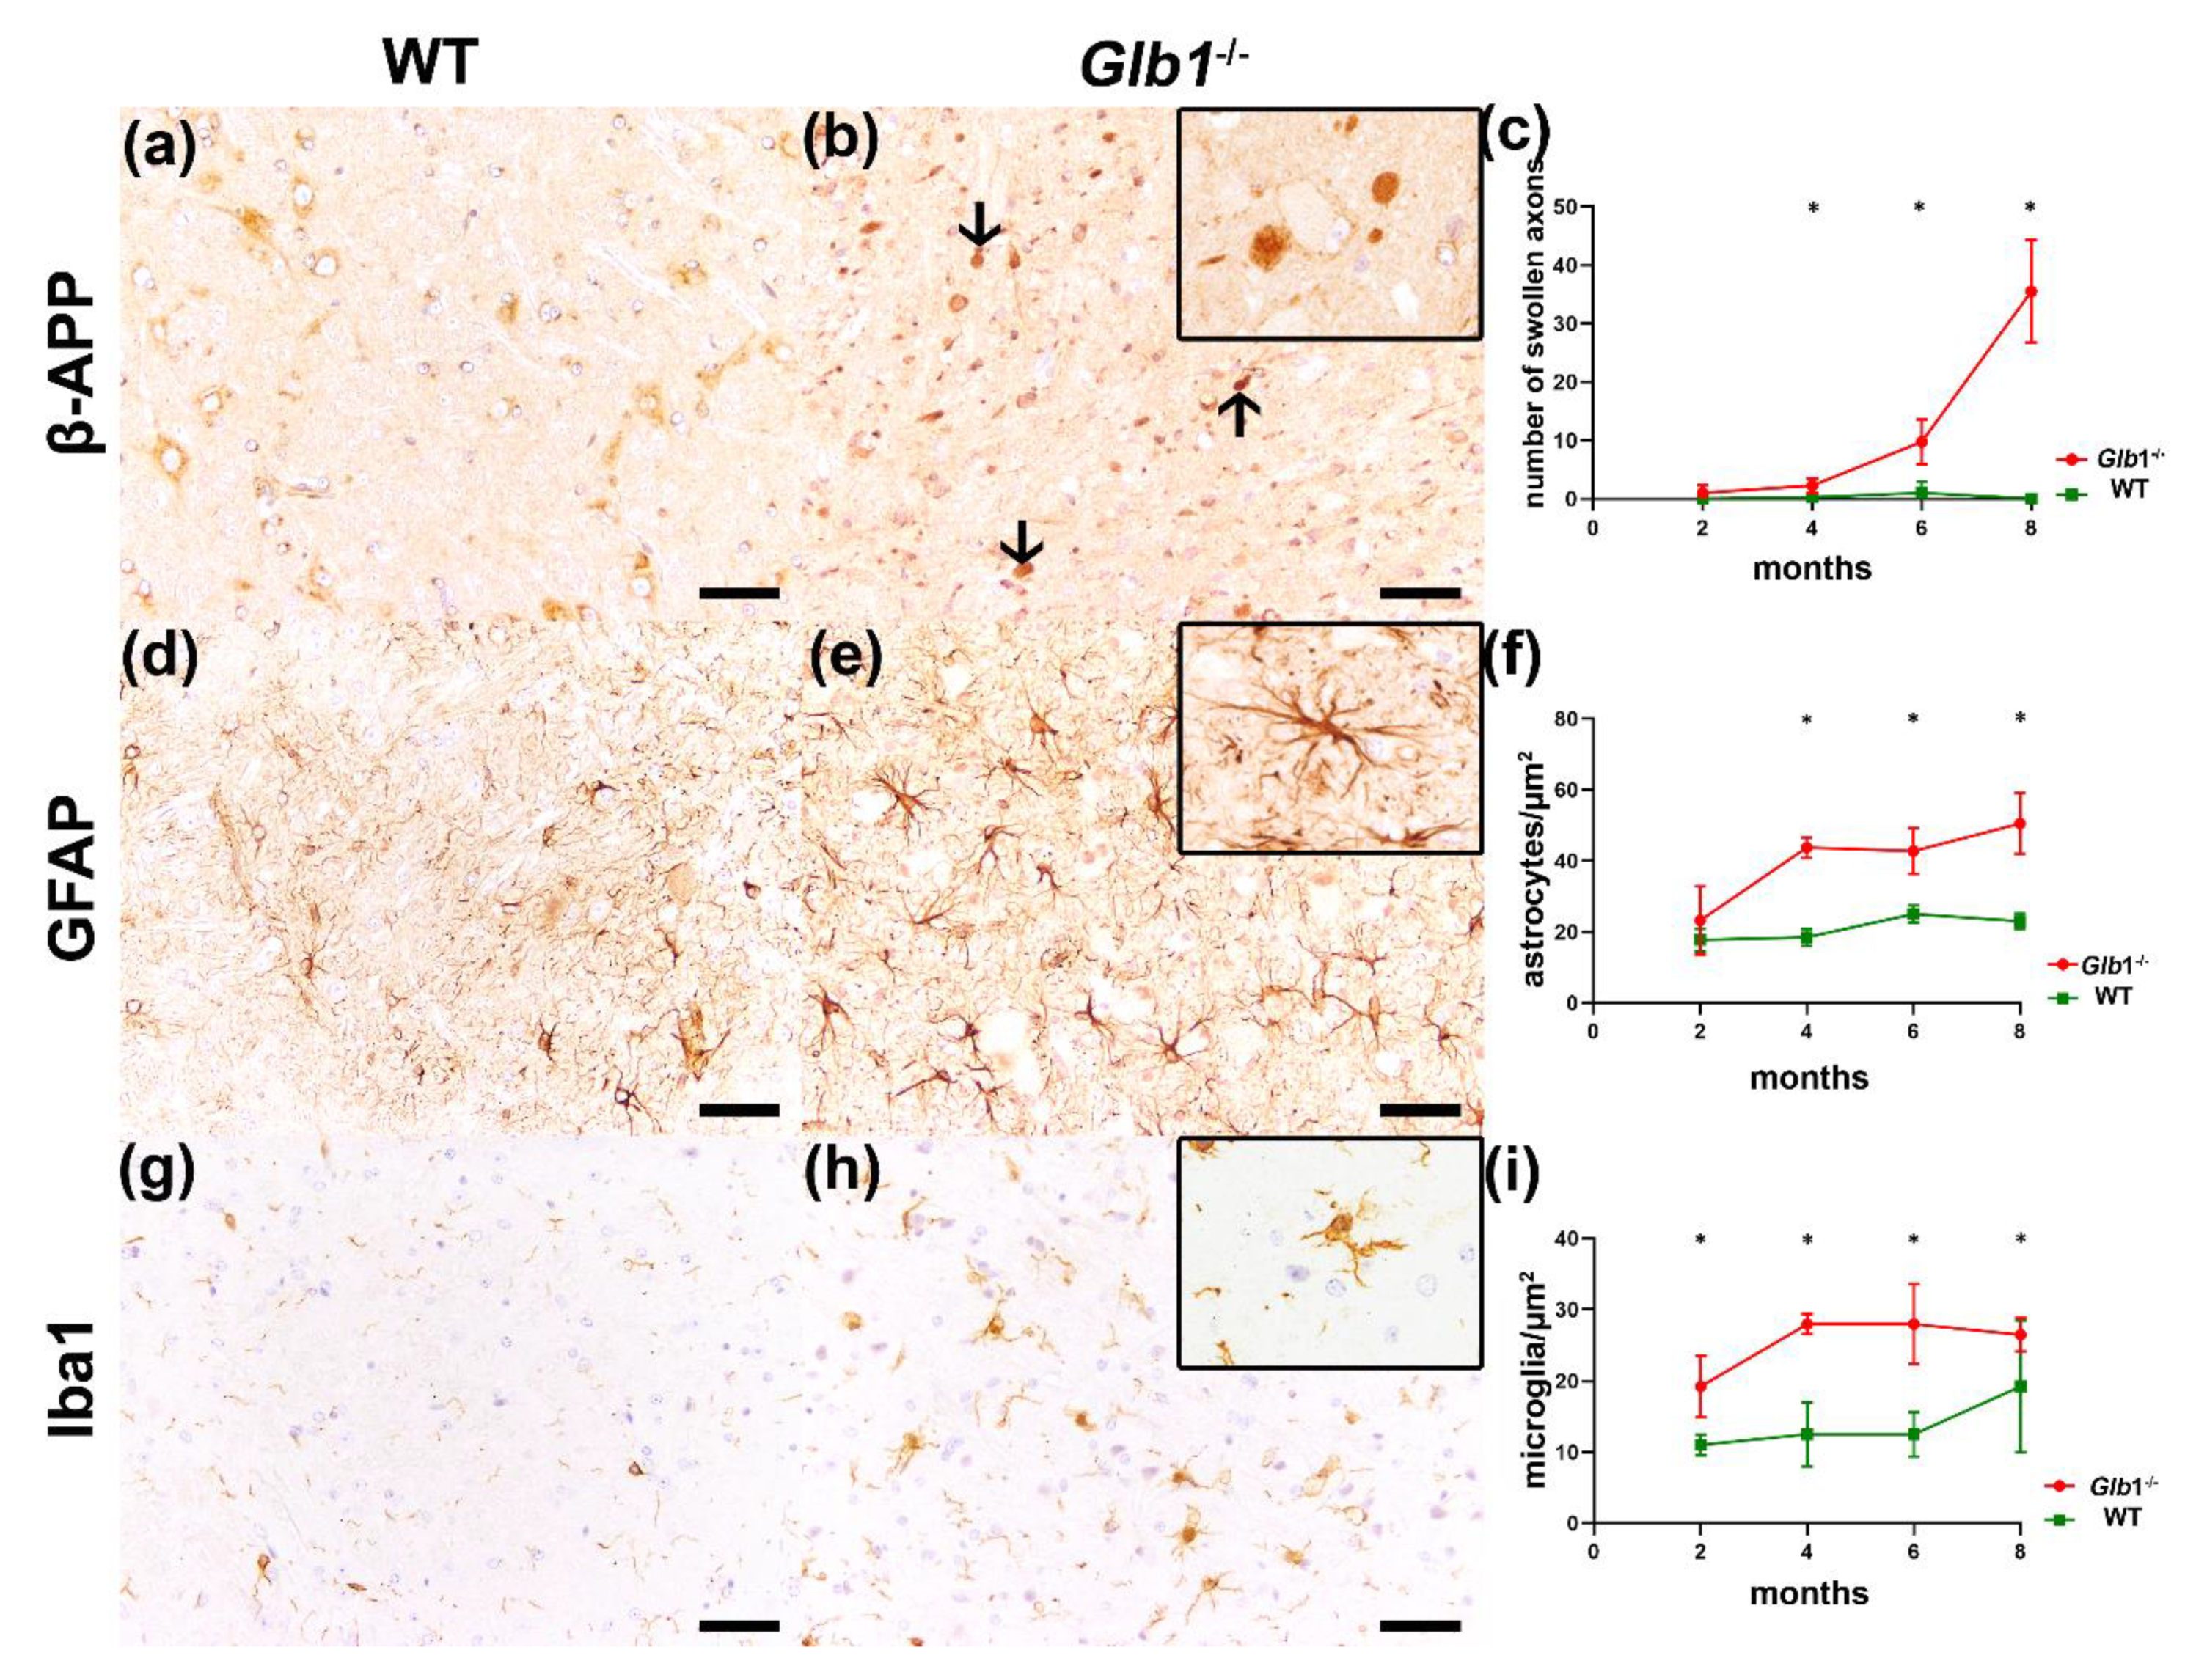
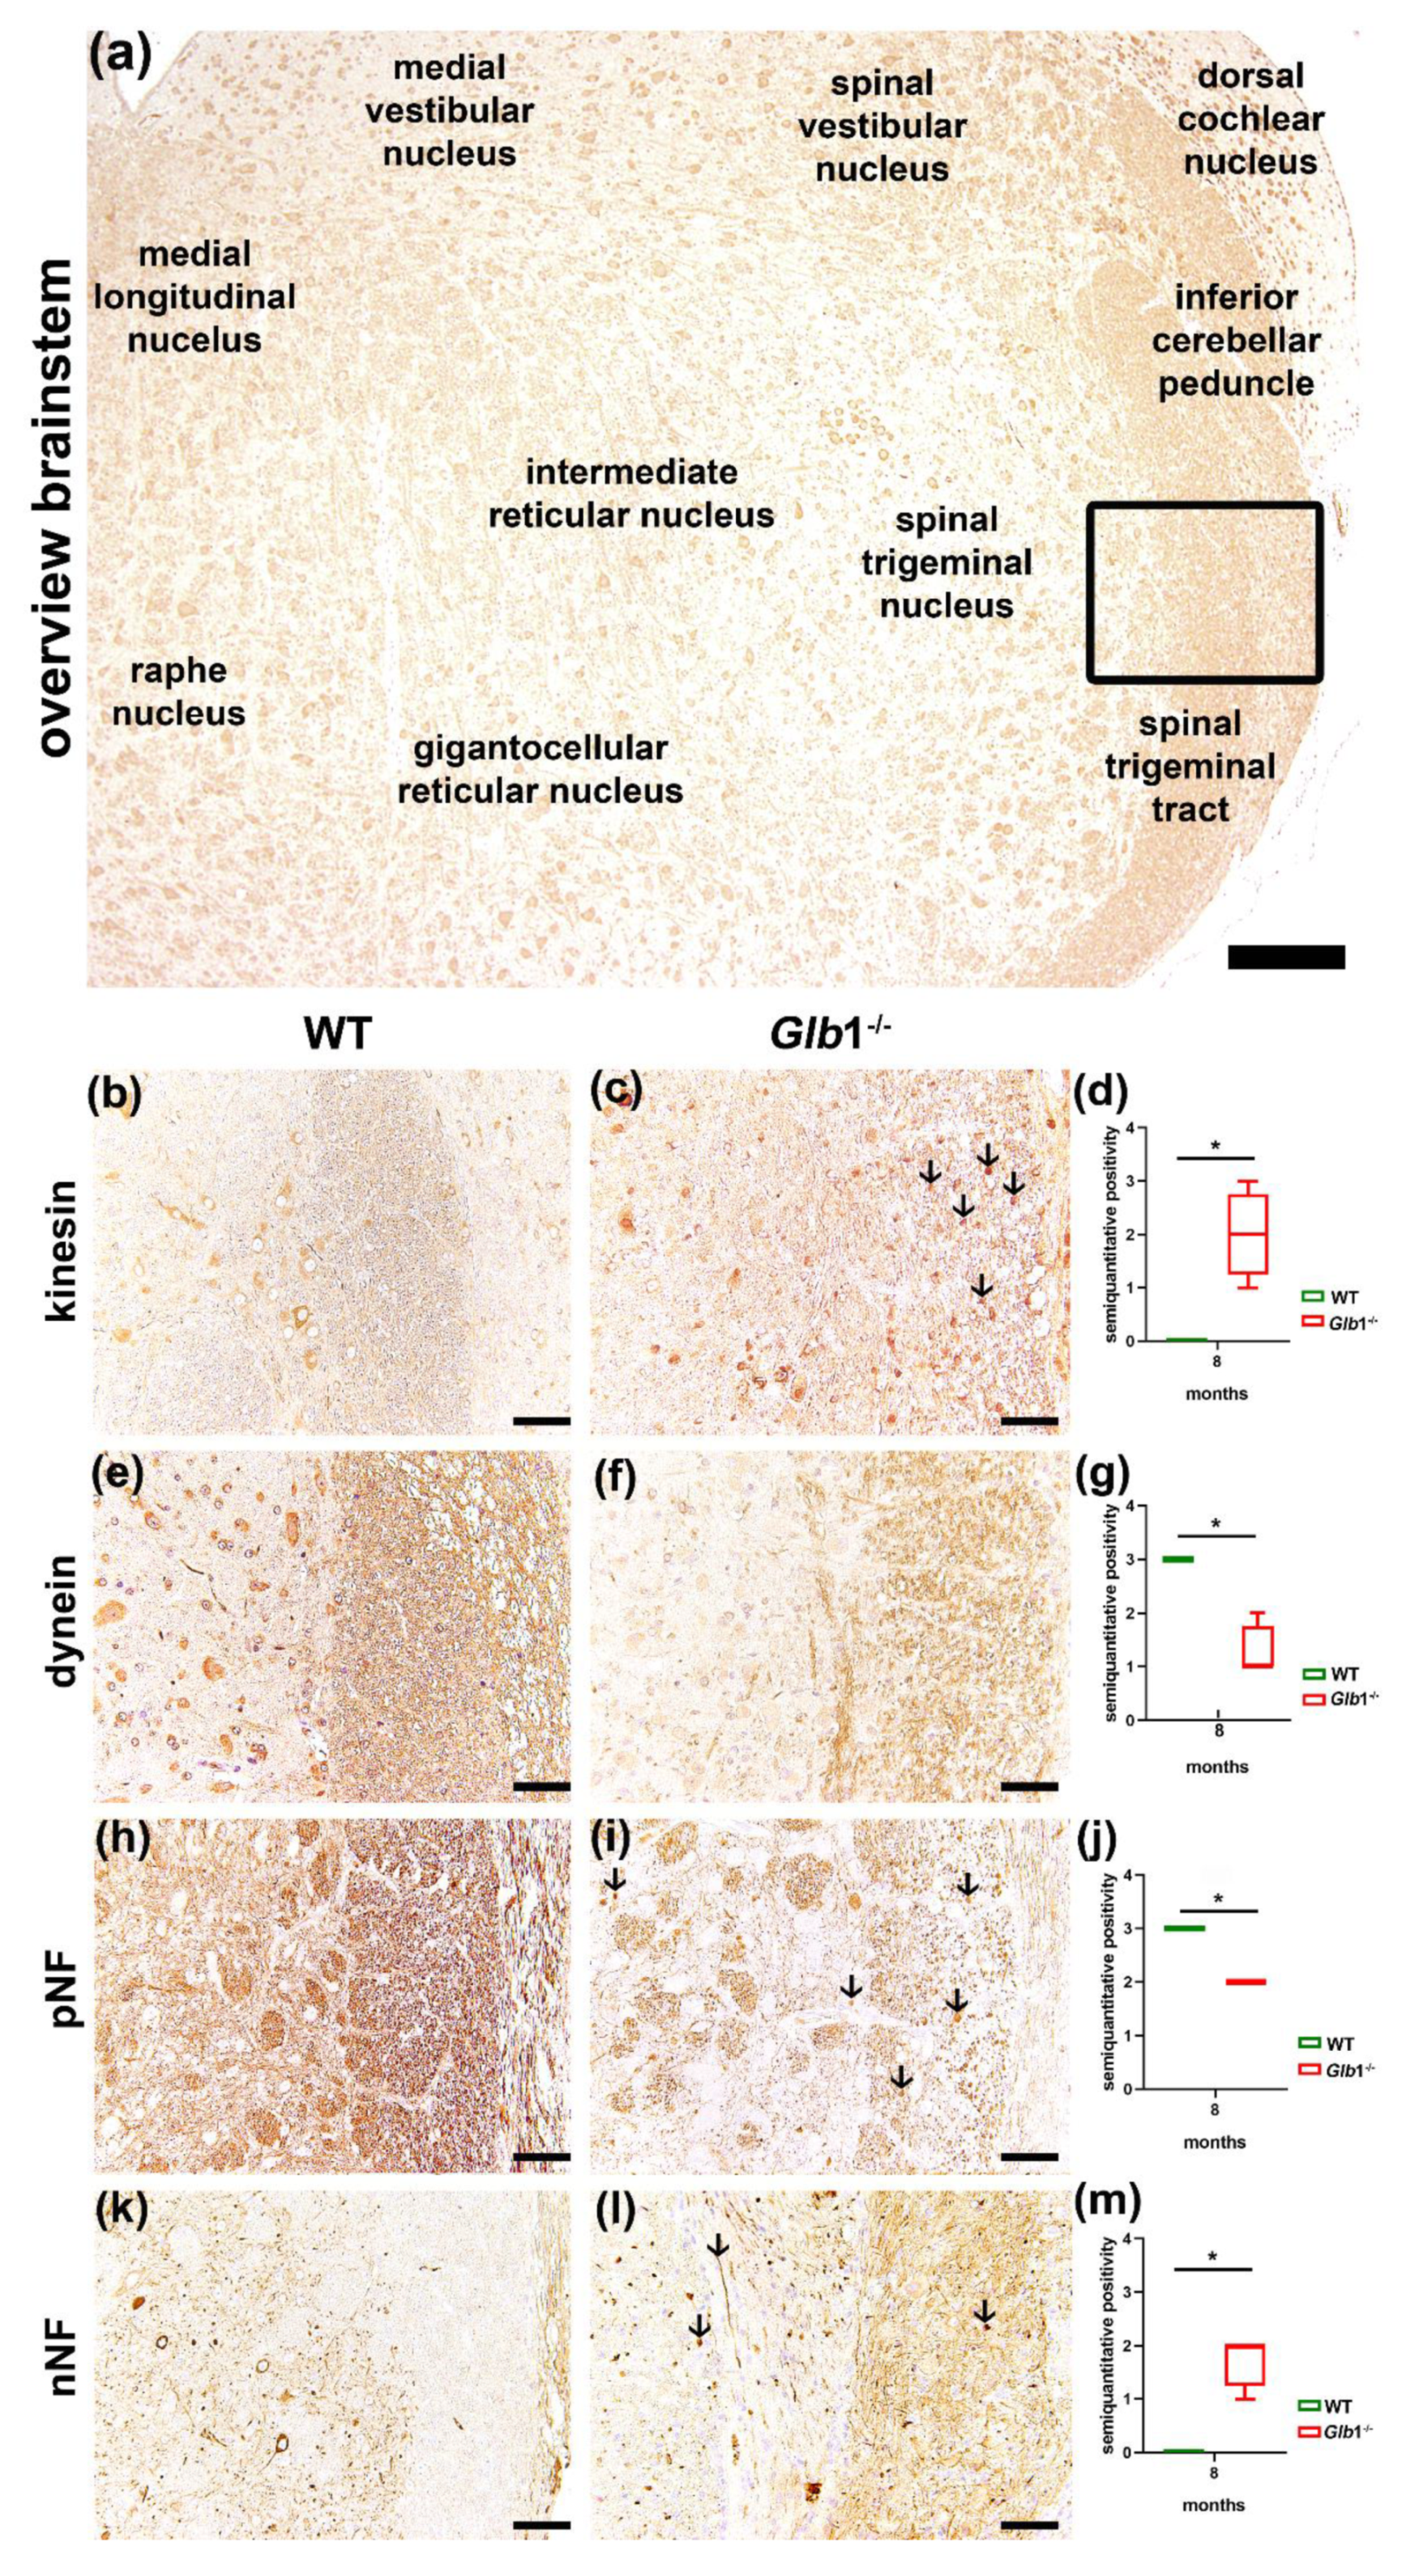
3.4. Detection of Axonal Damage and Myelin Loss

Immunohistochemistry demonstrated swollen axons, astrogliosis and microgliosis (Figure 3). β-Amyloid precursor protein (β-APP) positive swollen axons were frequently present in the medullary center of the cerebellum in all age groups, additionally in the brainstem of four to eight-month-old mice and furthermore in the cortex, the thalamus, and the cerebellar granular cell layer in eight-month-old mice (also see Figure S3, Supplementary Materials). The number of glial fibrillary acidic protein (GFAP) positive astrocytes was severely increased in the cortex, the thalamus, the granular cell layer, and the brainstem from four months of age onwards (also see Figure S4, Supplementary Materials). In the medullary center of the cerebellum, an astrogliosis was present at six and eight months of age. The brainstem showed higher numbers of ionized calcium-binding adapter molecule (Iba1) positive microglia/macrophages already at two months of age, whereas the number of Iba1 positive cells was unchanged in the thalamus, and the molecular and granular layer as well as the medullary center of the cerebellum until four months of age (Figure S5).
In eight-month-old Glb1−/− mice, a significant loss of phosphorylated neurofilament (pNF) (p < 0.05) positive axons was found in the cerebellar and brainstem white matter. Nevertheless, the thalamus, brainstem, granular cell layer and cerebellar white matter showed a significant (p < 0.05) increase in pNF positive spheroids. Furthermore, a significantly (p < 0.05) higher number of non-phosphorylated neurofilament (nNF) positive axons were found in the brainstem of Glb1−/− mice compared to wildtype controls (Figure 4). Glb1−/− mice also presented an increased number of kinesin positive axons in the brainstem and in the cerebellar white matter (p < 0.05). Moreover, a loss of dynein staining intensity was found in the subcortical white matter, the corpus callosum, the white matter around thalamic and brainstem nuclei and the cerebellar white matter (p < 0.05; Figure 4).
Immunohistochemistry using antibodies directed against myelin basic protein (MBP) and 2′,3′-cyclic-nucleotide 3′-phosphodiesterase (CNPase) did not detect myelin damage (Figure S6). Furthermore, periaxin-positive Schwann cells were not present in the CNS of Glb1−/− mice and WTs.

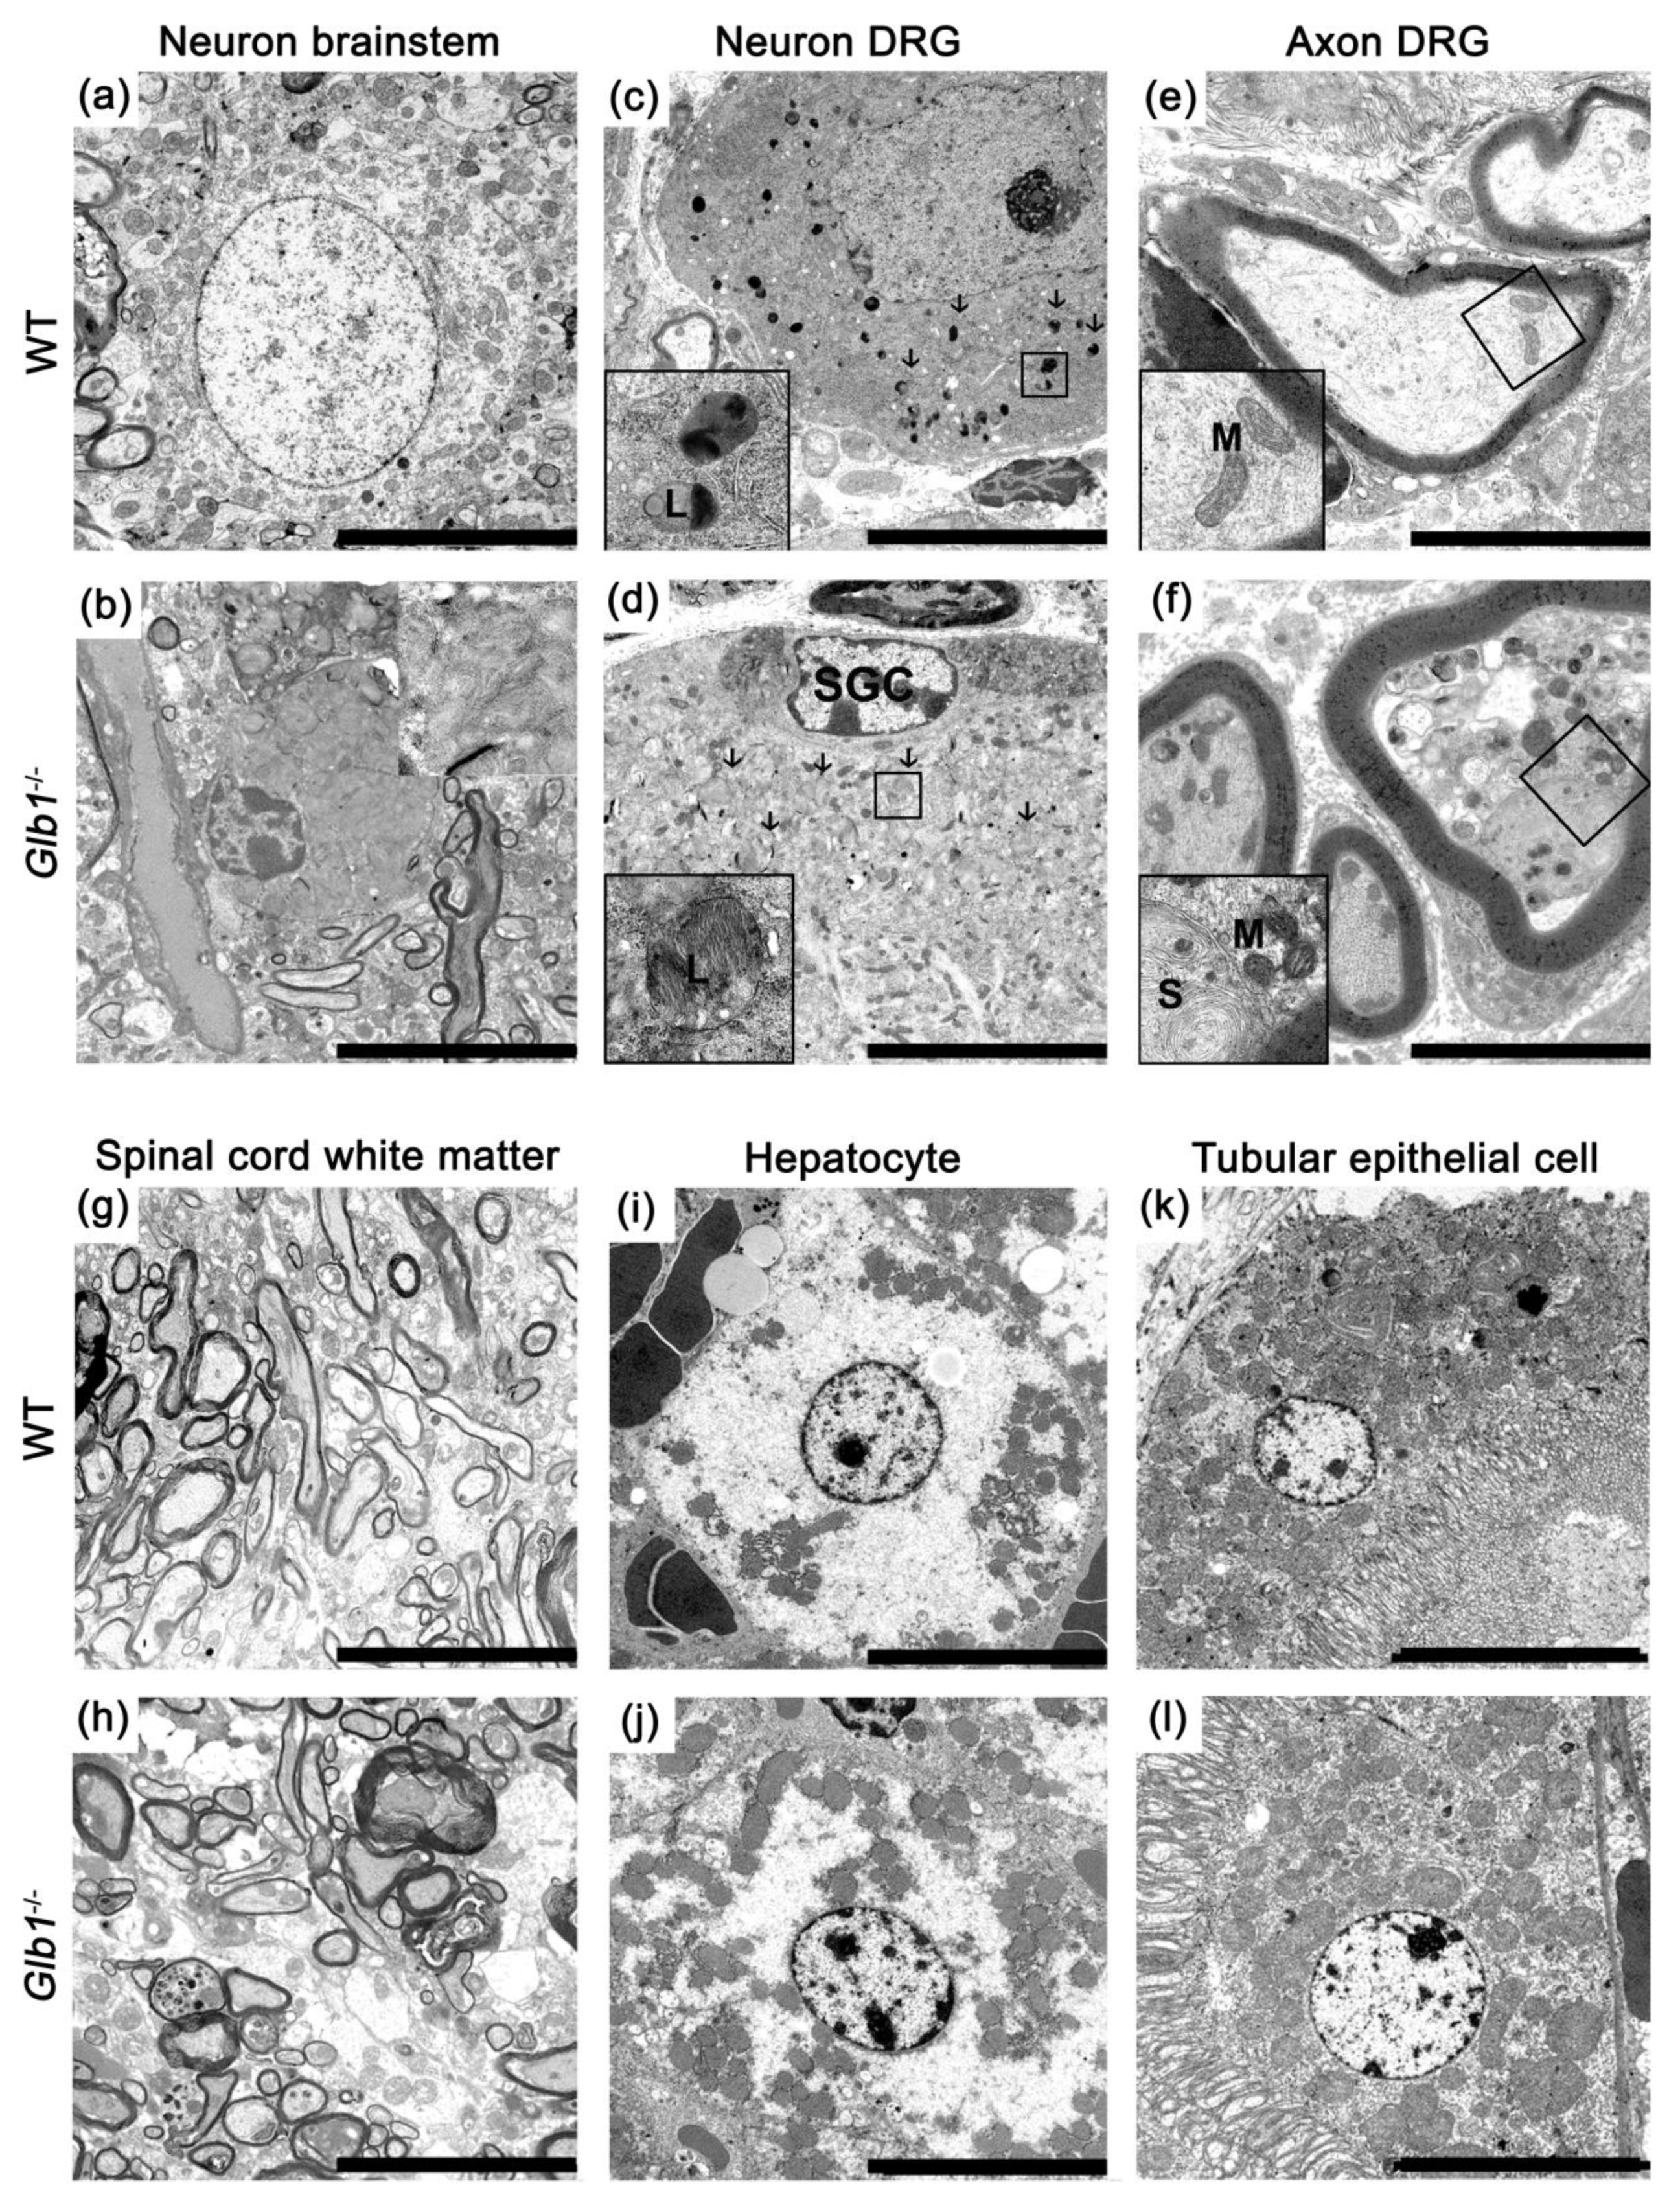
3.5. Glb1−/− Mice Showed Lamellar Storage Material in Lysosomes of Soma and Axons

Neurons of the brain, dorsal root ganglia, and spinal cord of Glb1−/− mice investigated with transmission electron microscopy (TEM) demonstrated enlarged lysosomes containing lamellar, partly concentrically arranged storage material compared to WT controls (Figure 5).
Nuclei of neurons were displaced to the margins of the cells in Glb1−/− mice and displayed a condensed chromatin. The Nissl substance was compressed towards the nuclei. In axons, intralysosomal lamellated concentrically arranged storage material was present, displacing microtubules and neurofilaments. Additionally, dense bodies interpreted as lysosomes containing a low amount of storage material were present. Electron dense bodies were identified as lamellated, lysosomal storage material and autophagosomes within neurons (Figure S7, Supplementary Materials). Interestingly, glial cells such as astrocytes, oligodendrocytes, Schwann cells and satellite glial cells did not reveal lysosomal accumulations (Figure S8, Supplementary Materials). Glb1−/− mice also showed a relatively high number of mitochondria in axons. Myelin sheaths were normal in Glb1−/− and WT mice (Figure 5). No lysosomal storage was found in renal tubular epithelial cells and hepatocytes (Figure 5).

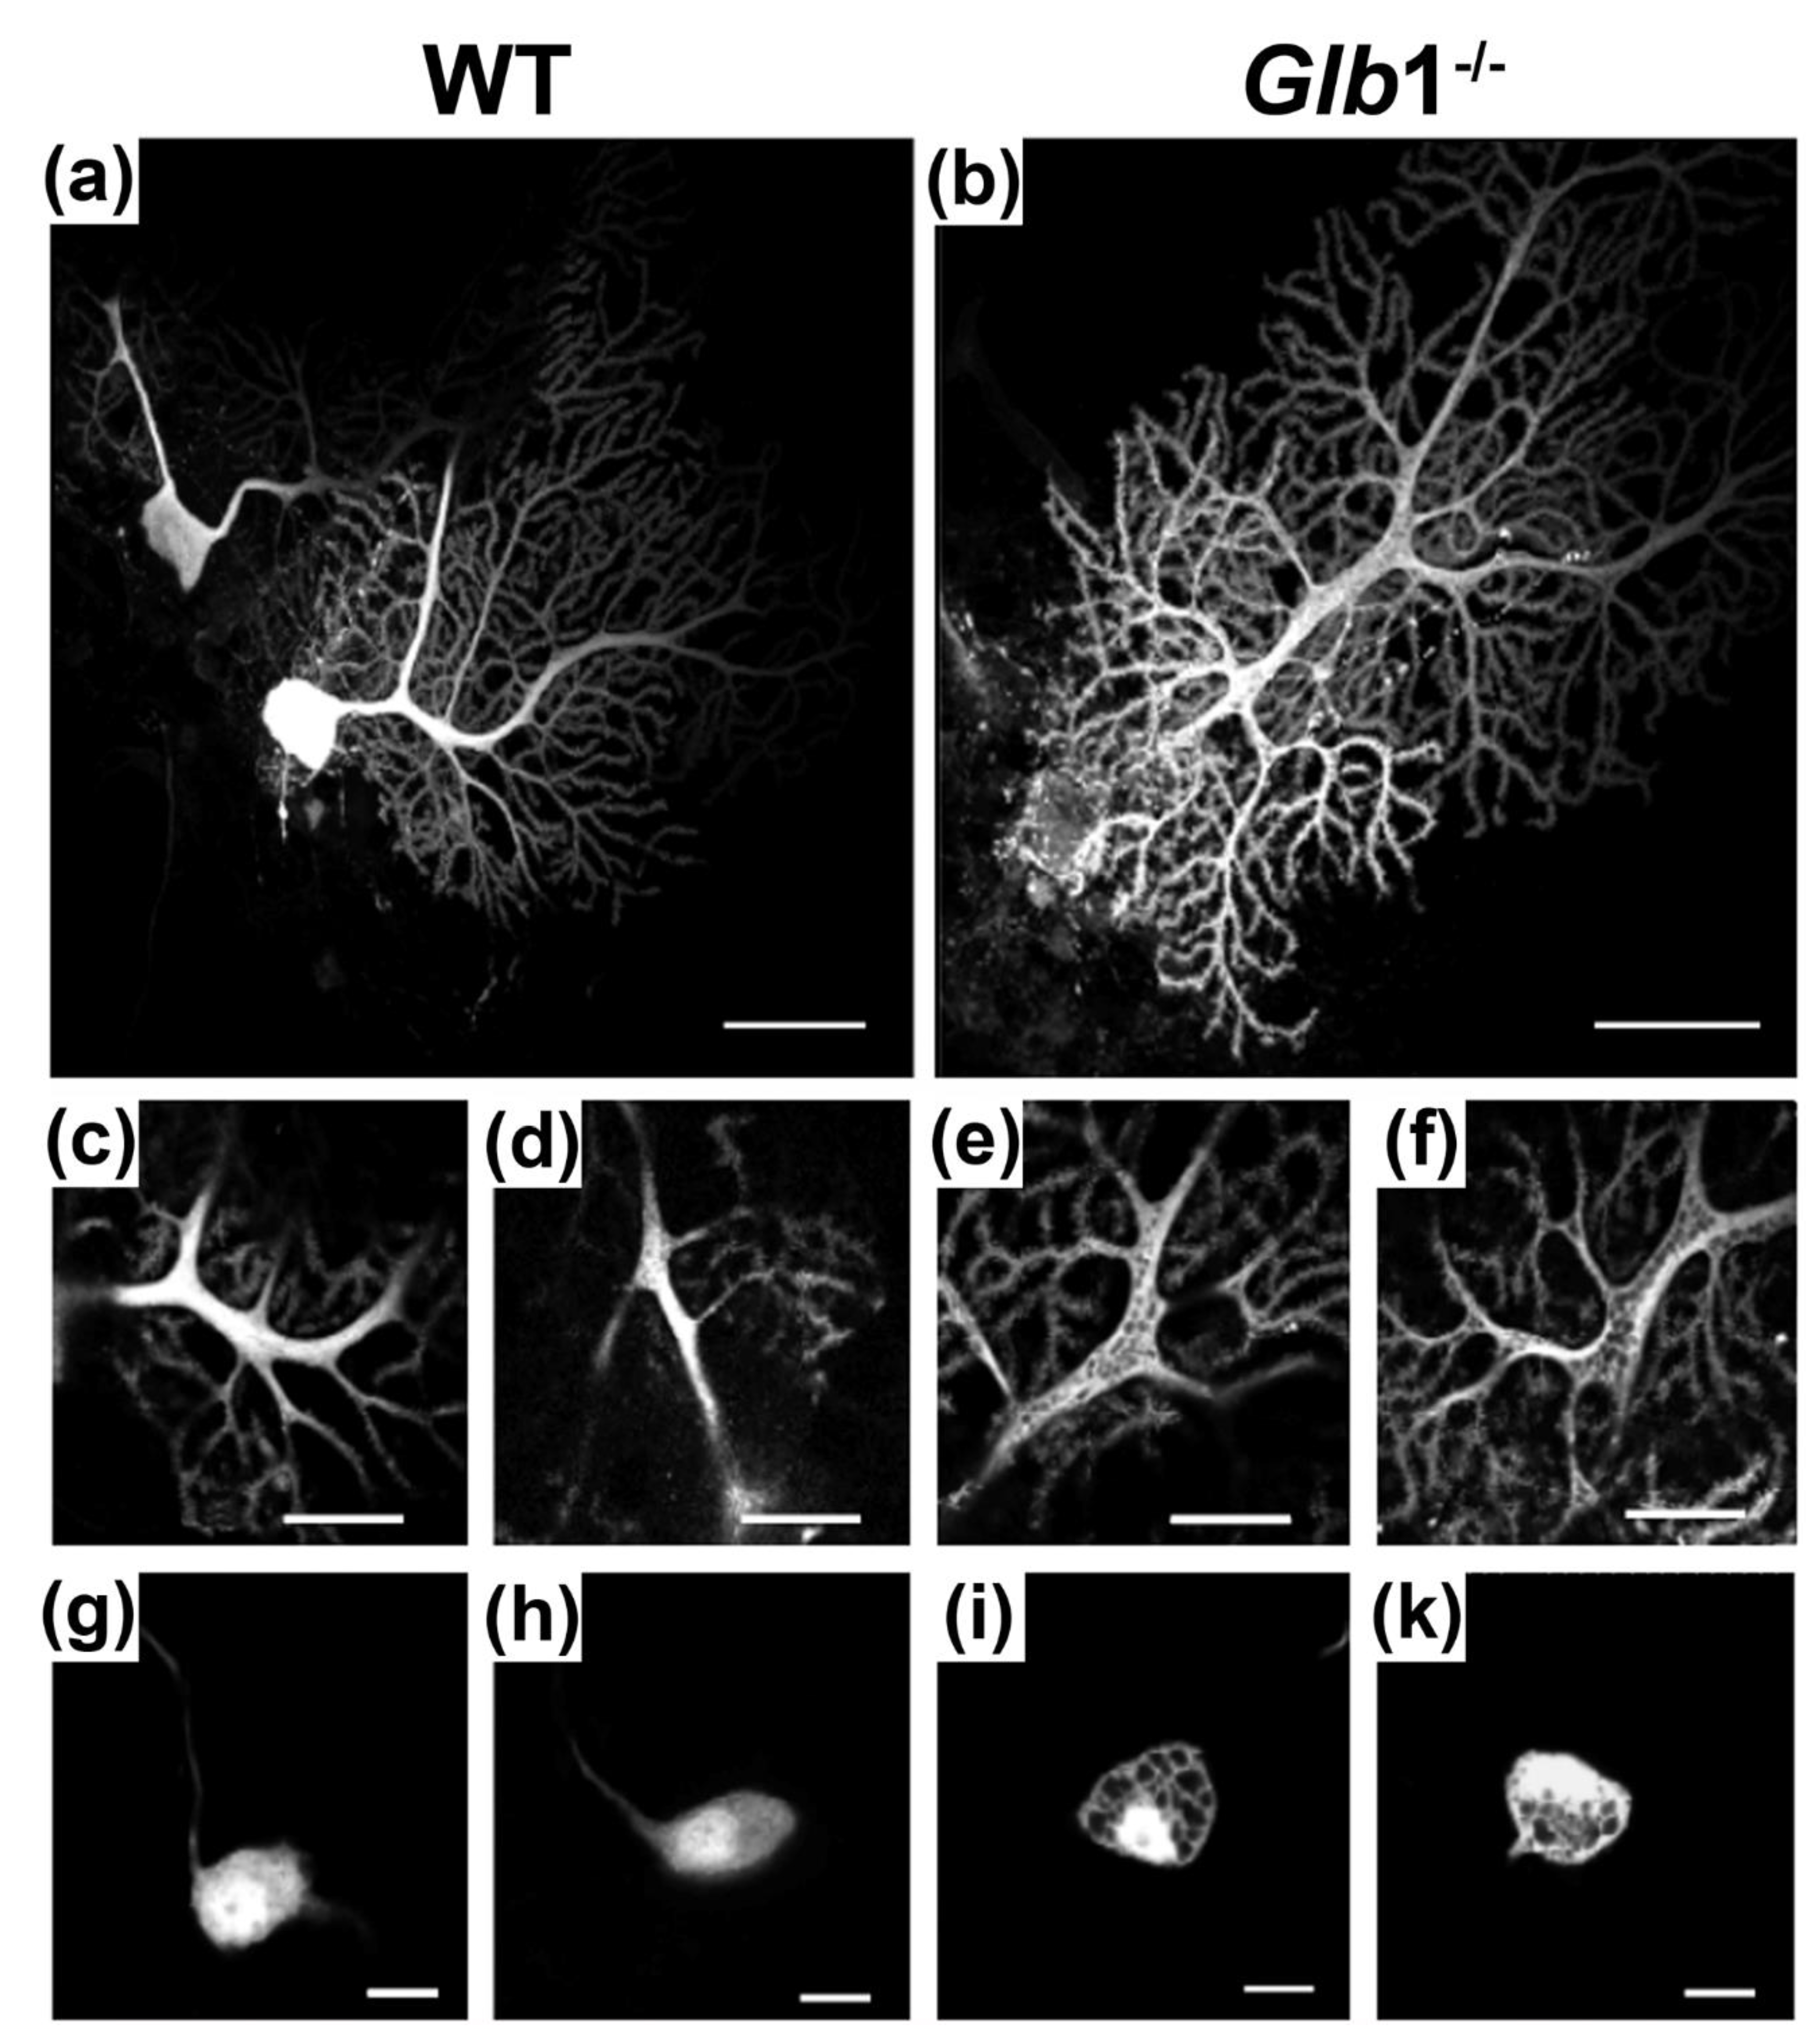
3.6. Neurons of Glb1−/− Mice Showed Abundant Vacuolar Structures in Their Soma and Dendrites

The loss of Glb1 function led to swelling of the somata by vacuolar structures. To test whether such vacuolar structures are also present in other cellular compartments, dendrites of Purkinje neurons in the cerebellum were investigated using single cell electroporation (Figure 6). The electroporated dye is supposed to evenly distribute in the cytoplasm of neurons. Since the used Alexa dye does not cross membranes to load vacuolar structures, their presence was revealed by dark, dye-less spots in the maximal projection of Purkinje neurons of Glb1−/− mice. In single optical sections of dendrites, these vacuolar structures become clearly visible. In contrast, WT Purkinje neurons showed an even dye distribution in the maximal projection as well as in single optical sections of dendrites. This fluorescence pattern was observed in all tested cells (Glb1−/−: n = 5; WT: n = 4; obtained from two animals each). To highlight the presence of vacuolar structures also in the neurons of sensory pathways, neurons of the medial nucleus of the trapezoid body (MNTB) and auditory brainstem structure, were electroporated. Purkinje cells and neurons from the brainstem were chosen for electroporation and electrophysiological examination as histology and immunohistochemistry revealed the most prominent lesions in these regions. In Glb1−/− mice, all neurons (n = 8) showed dark, dye-less spots, while control neurons (n = 5) of WT mice displayed an evenly distributed dye. Thus, MNTB neurons also showed the phenotypic presence of vacuolar structures in Glb1−/− mice.

3.7. Biophysical Consequences of Loss of β-Galactosidase Function

To assess the functional impact of altered membrane trafficking and intracellular vacuolar structures, electrophysiological recordings were obtained from MNTB neurons (Figure 7). This rather homogenous auditory nucleus is ideal, as the synaptic input to these globular neurons is dominated by the calyx of Held, a giant somatic synapse. Thus, somatic recordings target the compartment important for synaptic integration. From this charging transient, the cell capacitance, hence the effective cell size, was estimated. Five-times the weighted decay time of a bi-exponential fit was used to define the time course from which the transferred charge was extracted. From these data, the cell capacitance was found to be significantly larger (p = 0.0147) in Glb1−/− mice (59.2 ± 16.9 pC, n = 12) compared to WT animals (42.8 ± 16.9, n = 22). The higher cell capacitance in Glb1−/− mice implicates a greater cell surface due to cellular enlargement. Thus, our electrophysiological analysis corroborates the morphologic findings. Furthermore, the average, effective cell size of neurons is larger after functional loss of the β-galactosidase.
In a second stimulation paradigm, a −10 pA current injection led to a small hyperpolarization (Figure 7). From these data, the resting potential (baseline), the membrane time constant (exponential fit) and the input resistance were extracted. The resting potential was −54.2 ± 4.9 mV and −55.9 ± 5.8 mV in Glb1−/− (n = 12) and WT (n = 22) neurons, and displayed no significant difference (p = 0.4869). The input resistance was however significantly lowered in Glb1−/− compared to WT MNTB neurons (p = 0.0128). In Glb1−/−, the input resistance was 112.5 ± 42 MOhm (n = 12) compared to 165.9 ± 73.7 Mohm (n = 22) in WT neurons. The membrane time constant of MNTB neurons Glb1−/− mice (5.09 ± 2.7 ms; n = 12) and WT mice (5.9 ± 3.4 ms; n = 22) was not significantly affected by the loss of β-galactosidase function (p = 0.4196). This indicates that the increase in cell membrane does not affect the integration time constants, as the input resistance compensates for the larger cell leading to a similar membrane time constant, resembling an unchanged specific membrane resistance of neurons.
To investigate further biophysical properties of these neurons, a 300 ms long square current injection with increasing amplitude was applied (Figure 7). The induced change in membrane potential was similar in Glb1−/− and WT neurons and showed a sag response to hyperpolarizations and an onset action potential for depolarizations. In Glb1−/− MNTB neurons, the peak and steady state hyperpolarization was significantly smaller compared to WT mice (p < 0.05; between −500 and −100 pA, n = 12 and 19 for Glb1−/− and WT, respectively). The reduced hyperpolarization in Glb1−/− neurons was consistent with a smaller input resistance that allowed for more injected current to dissipate. The subthreshold depolarization peak and steady state amplitudes were however not changed, indicating that no changes in the action of low voltage gated potassium channels occurred.
Since auditory neurons are exquisitely precise in the temporal aspect of input–output functions, the jitter of action potential generation at the current threshold was examined (Figure 7). The amplitude of current injections was set to generate on average 35.7% ± 13.2% and 39.1% ± 21.1% supra-threshold events in 11 Glb1−/− and 18 WT MNTB neurons, respectively. No difference was found in the action potential waveform (height, width, de- and repolarization speed) between both genotypes. The temporal precision, jitter, was quantified as the standard deviation of the time of action potential generation. No significant difference (p = 0.654; Glb1−/−: 138 ± 48 µs; WT: 148 ± 62 µs) was apparent between Glb1−/− and WT neurons. Since the time course of sub-threshold voltage deflection is indicative of the jitter [80,81], also the time the sub-threshold events spent close to the threshold was extracted. The time these events stayed within 5% of the peak amplitude was not significantly different (p = 0.0935; Glb1−/−: 346 ± 131 µs; WT: 455 ± 137 µs) between both genotypes.

3.8. Glb1−/− Fibroblasts Show Lipid Accumulations and Membrane Alterations

Biochemical characterization of fibroblasts, cultured from Glb1−/− and WT mice, revealed accumulations of phospholipids and significant accumulations of four glycolipids, including GM1, GA1 and two unknown glycolipids in Glb1−/− mice. GM1 and GA1 were not detectable in WT mice. (Figure 8; also see Figures S9 and S10, Supplementary Materials). However, no change in the concentration of cholesterol between Glb1−/− and WT cells was evident.
Interestingly, the structure of the plasma membrane was shown to be altered. Distribution of flotillin 2, RhoA and cholesterol was assessed by separating Triton X-100 cellular extracts on sucrose density gradients. The floating fractions 1–3, contained predominately cholesterol- and sphingolipid enriched lipid raft fractions, whereas the non-lipid raft fractions were retained in the lower part of the gradient (usually fractions 8–10). In WT fibroblasts, flotillin 2 was predominately found in the lipid raft associated fractions 1 and 2, with a smaller amount present in the non-raft fractions 9 and 10. Glb1−/− cells, however, revealed a significant shift in the location of flotillin 2 towards fractions 2 and 3. Furthermore, a higher concentration of flotillin 2 was also evident in the non-lipid fractions compared to the WT. Interestingly, although no difference in the total cellular amount of cholesterol was evident, a shift in the location of cholesterol in Glb1−/− cells could be seen from the 8th to the 9th fraction.

3.9. Tissue-Specific Phospho- and Glycolipid Accumulations Present in Glb1−/− Mice

Phospholipids and cholesterol were analyzed in five brain compartments, the spinal cord, liver, kidney and serum (Figure 9). Glb1−/− mice demonstrated significant accumulations of sphingomyelin, phosphatidylcholine and phosphatidylserine in the cerebral cortex. Significant accumulations of sphingomyelin were also present in the thalamus, whereas significantly lower levels of phosphatidylcholine were present in the brainstem of Glb1−/− mice. Levels of GM1 and GA1 were significantly higher in neuronal tissues in Glb1−/− mice. Levels of GM1 were below the minimum detection levels in the hippocampus, brainstem, liver and spinal cord in WT mice. Similarly, GA1 was not found in the hippocampus, cerebellum, brainstem, liver, kidney and spinal cord of WT mice, whereas GM1 and GA1 were present in all analyzed tissues derived from Glb1−/− mice (Figure S10, Supplementary Materials). No significant differences in sphingosine and sphinganine concentrations were detected.

4. Discussion

A new mouse model for human GM1-gangliosidosis has been characterized revealing hitherto undescribed axonal lesions and functional neuronal changes. Marked cytoplasmic neuronal vacuolization was already present in clinically unremarkable two-month-old animals, suggesting that either a low amount of storage material does not cause functional damage or potential compensatory mechanisms can prevent neurologic dysfunctions in the first months of age. Clinical signs, including movement disorders, loss of righting reflex and emaciation developed at approximately four months of age, similar to previously described mouse models [22,23,24,68,70]. Ultrastructurally, neuronal vacuoles were found to be composed of concentric and partly lamellated material as described before in mice [22,23], American black bears [21], Alaskan Huskies [48], and humans [47].
Lysosomal storage was detected not only in neuronal somata but also in axons and dendrites. The presence of lysosomes with lamellated storage material and the presence of autophagosomes might be caused by alterations in the autophagic flux, which could be an important topic in future investigations. For a better mechanistic comprehension, investigations in vitro could be performed applying fluorescence microscopy [86]. Storage in dendrites and axons was associated with abnormal distribution of APP, kinesin, dynein, pNF and nNF. nNF, pNF, dynein and kinesin are typical structural components of axons [87] and they represent typical immunohistochemical markers for axonal damage [88,89]. β-APP represents an integral membrane protein [90], which is synthesized in the soma and transported via fast kinesin-mediated axonal transport [91]. Accumulations of β-APP are commonly found in damaged axons, and antibodies against β-APP have been applied successfully for the detection of axonal lesions [88,92]. Other structural components of axons include microtubules and intermediate filaments such as actin and neurofilaments [93]. Kinesin is a motor molecule, which mediates ATP-dependent fast anterograde transport along microtubules [94,95]. Impairment of kinesin function also interferes with the fast retrograde transport mediated by dynein [87]. While membranous organelles are transported by these fast axonal transport mechanisms in both directions, cytoskeletal proteins are only moved by an independent slow anterograde transport. An altered neurofilament (NF) phosphorylation pattern is a commonly found feature in axonopathies and neurodegenerative diseases [96,97]. NFs are obligate heteropolymers composed of heavy, medium and light chains as subunits [98]. Healthy axons contain 80% highly phosphorylated NFs integrated into the axoskeleton and 20% less extensively phosphorylated NFs as a “dynamic pool” [98,99]. NF phosphorylation also controls the association of NFs with kinesin and dynein, and thereby their own axonal transport [100,101]. Thus, alterations in the amount and distribution of β-APP, pNF, nNF, kinesin, and dynein can be used as surrogate markers for axonal damage and disturbed axonal transport [75,76,88,102,103]. Furthermore, the antibodies are restricted to axons only in the CNS. Therefore, it can be assumed that their immunoreactivity indicates their axonal localization. These findings indicate that the accumulation of lysosomal storage material might influence axonal transport and neurofilament phosphorylation status [75,76,88,89,103]. A disturbance in the kinesin-mediated transport of dynein could also affect dynein distribution, because dynein transport is also partly dependent on kinesin (direct transport) [104]. A disrupted fast retrograde transport could also affect the transport of neurotrophins and removal of damaged proteins and cell organelles from the axon terminal for recycling [93]. Furthermore, Glb1−/− mice showed variations in the distribution and amount of pNF and nNF, indicating changes in the neurofilament phosphorylation status. Altered neurofilament phosphorylation can disrupt their transport and induce local accumulations, which are commonly found in several neurodegenerative diseases [97]. Nevertheless, further examinations are needed to analyze the impact of lysosomal GM1 storage on axonal transport and neurofilament phosphorylation dynamics in detail. The observed astrogliosis and microgliosis in this current Glb1−/− mouse model can be interpreted as secondary reactive lesions and have been described in human GM1-gangliosidosis as well [26]. However, the present findings suggest that axonopathy contributes considerably to the clinical signs found in the current model of murine GM1-gangliosidosis. Axonopathy in lysosomal storage diseases, particularly in GM1-gangliosidosis, was previously described also in a feline model [105]. In diseased cats, postnatal development of meganeurites was observed in cortical pyramidal neurons [105]. Interestingly, a myelin loss was described in different publications investigating feline GM1-gangliosidosis [8,50]. Contrary to cats, dogs [48] and early onset forms of human GM1-gangliosidosis [33,106,107], the current Glb1−/− mice did not reveal a decreased amount of myelin.
Single cell electroporation confirmed that functional loss of β-galactosidase affects more than just the somatic compartment of neurons, since large caliber dendrites contained the same phenotype of vacuolar structures. Consequently, neither lipid metabolism in neurons with large dendrites takes place exclusively in the soma, nor do excessively generated vacuoles translocate into neuronal processes. Functionally, the major effect of Glb1 deficiency is a reduction in the membrane resistance, since the resting membrane potential and the membrane time constant remained similar. The reduction in input resistance together with a maintenance of the membrane time constant can be explained by an increase in cell surface, where the same number of channels per surface area are incorporated. Thereby, the leak and the capacitance become larger, maintaining a balanced membrane time constant. A similar membrane time constant is potentially the main mechanism that leads to the similarity of action potentials between WT and Glb1−/− animals. Thus, excitability is hardly affected by Glb1 deficiency and this mechanism might also be suitable for keeping the action potential generation precise in Glb1−/− mice. Compensating the capacitance by the input resistance represents an interesting mechanism, because decreasing the input resistance often sharpens the subthreshold depolarization and tends to make firing temporally more precise [80,81,108,109,110]. Manipulating the input resistance without causing any change in capacitance also altered the membrane time constant in these previous reports. Thus, the major membrane parameter defining the action potential generation seems to be the membrane time constant and not the input resistance. Moreover, the present Glb1−/− mice show that at least at the outset of lysosomal storage of GM1, neurons successfully compensates for electrophysiological changes caused by the increased cell size. However, during the progression of the disease, the compensatory mechanisms are unable to sustain the functionality and integrity of the affected neurons and thus, the neurologic phenotype becomes evident.
Clinical signs and neuropathologic alterations in the Glb1−/− mice are mainly caused by neuronal storage and axonal damage. Alterations in myelin amount and structure were not found when using immunohistochemistry and electron microscopy. The increased amounts of sphingomyelin, phosphatidylcholine and phosphatidylserine imply a shift from the production of gangliosides towards sphingolipids and phospholipids, due to massive ganglioside storage and consecutive inhibition of ganglioside synthesis. Sphingolipids and phospholipids are mainly produced in the endoplasmatic reticulum [111,112] and then transported to the plasma membrane via transport vesicles [111]. Increased deposition of sphingomyelin and phospholipids probably affects the structure of the cellular plasma membranes, which might influence excitability as shown by electrophysiological examination. The dry mass of myelin in situ consists of approximately 15%–30% proteins and 70%–85% lipids [113], of which cerebroside, phospholipids, cholesterol and glycosphingolipids are mostly represented [114], and complex gangliosides are also present [115]. The cellular accumulation of several phospholipids and bulky glycolipids coupled with the structural alteration of lipid rafts probably contributes to changes in neuronal function and perhaps also to the maintenance of the membrane time constant. Interestingly, a significant shift in the location of flotillin 2 towards fractions 2 and 3 revealed a redistribution of flotillin-2 in the lipid raft fractions of GM1-gangliosidosis cells. Flotillin 2 is a highly conserved protein isolated from caveolae/lipid raft domains responsible for signaling and trafficking of molecules within a cell [116], and abnormalities have been attributed to the pathophysiology in several lysosomal storage diseases [117]. Furthermore, it is well known that lipid rafts play a critical role in neuronal function, synapse density and morphology [118]. Alterations in the flotillin 2 distribution indicate that the membrane and in particular the organization and function of lipids rafts are altered, as has also been shown in other lysosomal storage diseases, namely Fabry disease [85]. Biochemical analyses of the current mouse model confirm that the intralysosomal storage is definitely composed of GM1 with a smaller amount of GA1. Interestingly, the increased presence of asialo-GM1 (GA1) is compatible with an alternative degradation pathway for GM1 and GA1. The presence of a higher amount of GA1 indicates that murine enzymes exhibit a different affinity towards degradation products, which is also described in another model for GM1-gangliosidosis [22] and for murine neuraminidases in a model for Morbus Tay–Sachs [44].
In the current Glb1−/− mice, an insertion into exon 15 resulted in exon skipping and consequently generation of a shortened dysfunctional protein. Exon 15 is located in the beta domain 2 of β-galactosidase [25], which is necessary for proteolytic processing and enzyme activity, but not for the transport to lysosomes in dogs and humans [119]. In humans, various mutations of the β-galactosidase have been described [25,26,27,28,120,121,122], many of which affect mRNA splicing [123], frequently resulting in exon skipping [11] and a non-functional enzyme. Very low enzymatic activities of the murine β-galactosidase were present in the current mouse model resembling human [25,26,124], canine [9,11,65] and murine [22,23] GM1-gangliosidosis. Nevertheless, lack of a functional enzyme did not cause GM1 accumulations in the liver and kidneys. Histologically, the liver, kidney and bone lesions were also absent in the current Glb1−/− mice, with this being similar to the adult form of human GM1-gangliosidosis.
Regarding the quality and onset of clinical signs, the current Glb1−/− mice resemble previously described mouse models [22,24,68,70]. All previously published knockout mouse lines reveal very low activities of the β-galactosidase in different organs [22,23,24]. Whereas histological lesions such as neuronal vacuolation are similar in previously published mouse models and the present Glb1−/− mice [22,23,24,74], axonal damage without myelin affection has not been described before in murine GM1-gangliosidosis. Lamellated storage material in neurons was also found in other Glb1 knockout models in the CNS [22,23] and in the retina [125]. Electroretinograms of wildtype and Glb1−/− mice did not reveal a functional impairment of retinas due to lysosomal storage [125]. Nevertheless, visual evoked potentials (VEP) were abnormal in the knockout mice, with this indicating functional and visual restrictions [125]. Electrophysiological examinations of the current Glb1−/− mice demonstrated that the excitability of their auditory neurons is hardly affected by lysosomal storage due to the maintenance of the membrane time constant. Such studies have not been performed previously in other Glb1 knockout models. An increase in GM1 and GA1 was found in the CNS of the current Glb1−/− mice as well as in the CNS [24,58], optic and sciatic nerves [126] and in the retina [125] of other Glb1 knockout mouse models. Moreover, the increase in phosphatidylserine in the CNS of the current Glb1−/− mice resembles the findings of Heinecke et al. (2015) in the optic nerve [126]. Nevertheless, current Glb1−/− mice also revealed accumulations of sphingomyelin and phosphatidylcholine, which might stabilize cell membrane integrity. In summary, current Glb1−/− mice expand the existing knowledge concerning the murine disease, complementing previously described Glb1 knockout mouse models, particularly regarding electrophysiological changes and lipid composition. The murine disease does not seem to reflect the early onset form of human GM1-gangliosidosis due to its late onset of clinical signs and lack of myelin loss. In contrast, the late onset of clinical signs and the fact that lesions are primarily restricted to neuronal tissue suggests that this model rather resembles the adult form of human GM1-gangliosidosis.

5. Conclusions

The detection of axonopathy and functional compensating mechanisms in this mouse model of GM1-gangliosidosis gives novel insights into the pathogenesis of this lysosomal storage disease, which might assist in the design of therapeutic strategies in the future. Furthermore, this model might allow investigations of axon–myelin–glia interactions in future experiments.

Supplementary Materials

The following are available online at https://www.mdpi.com/2077-0383/9/4/1004/s1. Figure S1: Assumed amino acid sequence of wildtype (WT) C57BL/6 (top row) in comparison to the Glb1−/− sequence. Figure S2: PAS positive storage material in neurons. Figure S3: β-APP reactivity in WT and Glb1−/− mice. Figure S4: GFAP reactivity in WT and Glb1−/− mice. Figure S5: Iba1 reactivity in WT and Glb1−/− mice. Figure S6: Intact myelin in WT and Glb1−/− mice. Figure S7: Details of cytoplasmic structures in neurons. Figure S8: Lack of storage material in glial cells. Figure S9: Glycolipid content of fibroblasts from four-month-old WT and Glb1−/− mice. Figure S10: Glycolipid concentration of tissues.

Author Contributions

Conceptualization, K.H., A.H., and W.B.; Methodology, D.E., A.L., G.B., K.H., A.H., J.B.H., H.Y.N., F.F., and I.G.; validation, I.G. and W.B.; formal analysis, D.E., A.L., G.B., K.H., A.H., J.B.H., F.F., and I.G.; investigation, D.E., A.L., G.B., W.T., K.H., A.H., J.B.H., and F.F.; resources, J.B.H., H.Y.N., F.F., and W.B.; data curation, D.E., G.B., F.F., and I.G.; writing—original draft preparation, D.E., G.B., and F.F.; writing—review and editing, A.L., G.B., K.H., J.B.H., H.Y.N., F.F., W.B., and I.G.; visualization, D.E., G.B., F.F., and I.G.; supervision, A.L., I.G. and W.B.; project administration, W.B.; funding acquisition, W.B. All authors have read and agreed to the published version of the manuscript.

Funding

This research was funded in part by the German Research Foundation (DFG; https://www.dfg.de/), grant number BA815/12-1, which was awarded to W. Baumgärtner. This publication was supported by Deutsche Forschungsgemeinschaft and University of Veterinary Medicine Hannover, Foundation within the funding programme Open Access Publishing.

Acknowledgments

The authors wish to thank Danuta Waschke, Bettina Buck, Caroline Schütz, Petra Grünig, Kerstin Rohn, Julia Baskas, Claudia Herrmann, Christiane Namneck, Katharina Lange, Kerstin Schöne, Sabine Täffner, Mansure Famian, Franziska Lueg and Angela Karl for their excellent technical assistance.

Conflicts of Interest

The authors declare no conflict of interest. The funders had no role in the study design; in the collection, analyses, or interpretation of data; in the writing of the manuscript, or in the decision to publish the results.

References

  1. Okada, S.; O’Brien, J.S. Generalized Gangliosidosis: Beta-Galactosidase Deficiency. Science 1968, 160, 1002–1004. [Google Scholar] [CrossRef] [PubMed]
  2. Baker, H.J.; Lindsey, J.R. Animal Model: Feline Gm1 Gangliosidosis. Am. J. Pathol. 1974, 74, 649–652. [Google Scholar] [PubMed]
  3. Barker, C.G.; Blakemore, W.F.; Dell, A.; Palmer, A.C.; Tiller, P.R.; Winchester, B.G. Gm1 Gangliosidosis (Type 1) in a Cat. Biochem. J. 1986, 235, 151–158. [Google Scholar] [CrossRef] [PubMed] [Green Version]
  4. Baker, H.J., Jr.; Lindsey, J.R.; McKhann, G.M.; Farrell, D.F. Neuronal Gm1 Gangliosidosis in a Siamese Cat with Beta-Galactosidase Deficiency. Science 1971, 174, 838–839. [Google Scholar] [CrossRef]
  5. De Maria, R.; Divari, S.; Bo, S.; Sonnio, S.; Lotti, D.; Capucchio, M.T.; Castagnaro, M. Β-Galactosidase Deficiency in a Korat Cat: A New Form of Feline Gm1-Gangliosidosis. Acta Neuropathol. 1998, 96, 307–314. [Google Scholar] [CrossRef]
  6. Uddin, M.M.; Hossain, M.A.; Rahman, M.M.; Chowdhury, M.A.; Tanimoto, T.; Yabuki, A.; Hye-Sook, C.; Osamu, Y. Identification of Bangladeshi Domestic Cats with Gm1 Gangliosidosis Caused by the c.1448G<C Mutation of the Feline Glb1 Gene: Case Study. J. Vet. Med. Sci. 2013, 75, 395–397. [Google Scholar]
  7. Uddin, M.M.; Tanimoto, T.; Yabuki, A.; Kotani, T.; Kuwamura, M.; Chang, H.S.; Yamato, O. Mutation Analysis of Gm1 Gangliosidosis in a Siamese Cat from Japan in the 1960s. J. Feline Med. Surg. 2012, 14, 900–902. [Google Scholar] [CrossRef]
  8. Ueno, H.; Yamato, O.; Sugiura, T.; Kohyama, M.; Yabuki, A.; Miyoshi, K.; Matsuda, K.; Uchide, T. Gm1 Gangliosidosis in a Japanese Domestic Cat: A New Variant Identified in Hokkaido, Japan. J. Vet. Med. Sci. 2016, 78, 91–95. [Google Scholar] [CrossRef] [Green Version]
  9. Alroy, J.; Orgad, U.; DeGasperi, R.; Richard, R.; Warren, C.D.; Knowles, K.; Thalhammer, J.G.; Raghavan, S.S. Canine Gm1-Gangliosidosis. A Clinical, Morphologic, Histochemical, and Biochemical Comparison of Two Different Models. Am. J. Pathol. 1992, 140, 675–689. [Google Scholar]
  10. Uddin, M.M.; Arata, S.; Takeuchi, Y.; Chang, H.S.; Mizukami, K.; Yabuki, A.; Rahman, M.M.; Kohyama, M.; Hossain, M.A.; Takayama, K.; et al. Molecular Epidemiology of Canine Gm1 Gangliosidosis in the Shiba Inu Breed in Japan: Relationship between Regional Prevalence and Carrier Frequency. BMC Vet. Res. 2013, 9, 132–137. [Google Scholar] [CrossRef] [Green Version]
  11. Kreutzer, R.; Leeb, T.; Müller, G.; Moritz, A.; Baumgärtner, W. A Duplication in the Canine Beta-Galactosidase Gene Glb1 Causes Exon Skipping and Gm1-Gangliosidosis in Alaskan Huskies. Genetics 2005, 170, 1857–1861. [Google Scholar] [CrossRef] [PubMed] [Green Version]
  12. Read, D.H.; Harrington, D.D.; Keenana, T.W.; Hinsman, E.J. Neuronal-Visceral Gm1 Gangliosidosis in a Dog with Β-Galactosidase Deficiency. Science 1976, 194, 442–445. [Google Scholar] [CrossRef] [PubMed]
  13. Ahern-Rindell, A.J.; Prieur, D.J.; Murnane, R.D.; Raghavan, S.S.; Daniel, P.F.; McCluer, R.H.; Walkley, S.U.; Parish, S.M. Inherited Lysosomal Storage Disease Associated with Deficiencies of Beta-Galactosidase and Alpha-Neuraminidase in Sheep. Am. J. Med. Genet. 1988, 31, 39–56. [Google Scholar] [CrossRef] [PubMed]
  14. Murnane, R.D.; Prieur, D.J.; Ahern-Rindell, A.J.; Holler, L.D.; Parish, S.M. Clinical and Clinicopathologic Characteristics of Ovine Gm-1 Gangliosidosis. J. Vet. Intern. Med. 1994, 8, 221–223. [Google Scholar] [CrossRef]
  15. Skelly, B.J.; Jeffrey, M.; Franklin, R.J.; Winchester, B.G. A New Form of Ovine Gm1-Gangliosidosis. Acta Neuropathol. 1995, 89, 374–379. [Google Scholar] [CrossRef]
  16. Ryder, S.J.; Simmons, M.M. A Lysosomal Storage Disease of Romney Sheep That Resembles Human Type 3 Gm1 Gangliosidosis. Acta Neuropathol. 2001, 101, 225–228. [Google Scholar] [CrossRef]
  17. Donnelly, W.J.; Sheahan, B.J.; Kelly, M. Β-Galactosidase Deficiency in Gm1 Gangliosidosis of Friesian Calves. Res. Vet. Sci. 1973, 15, 139–141. [Google Scholar] [CrossRef]
  18. Sheahan, B.J.; Donnelly, W.J. Enzyme Histochemical and Ultrastructural Alterations in the Brains of Friesian Calves with Gm1 Gangliosidosis. Acta Neuropathol. 1974, 30, 73–84. [Google Scholar] [CrossRef]
  19. Bermudez, A.J.; Johnson, G.C.; Vanier, M.T.; Schroder, M.; Suzuki, K.; Stogsdill, P.L.; Johnson, G.S.; O’Brien, D.; Moore, C.P.; Fry, W.W. Gangliosidosis in Emus (Dromaius Novaehollandiae). Avian Dis. 1995, 39, 292–303. [Google Scholar] [CrossRef]
  20. Bermudez, A.J.; Freischütz, B.; Yu, R.K.; Nonneman, D.; Johnson, G.S.; Boon, G.D.; Stogsdill, P.L.; Ledoux, D.R. Heritability and Biochemistry of Gangliosidosis in Emus (Dromaius Novaehollandiae). Avian Dis. 1997, 41, 838–849. [Google Scholar] [CrossRef]
  21. Muthupalani, S.; Torres, P.A.; Wang, B.C.; Zeng, B.J.; Eaton, S.; Erdelyi, I.; Ducore, R.; Maganti, R.; Keating, J.; Perry, B.J.; et al. Gm1-Gangliosidosis in American Black Bears: Clinical, Pathological, Biochemical and Molecular Genetic Characterization. Mol. Genet. Metab. 2014, 111, 513–521. [Google Scholar] [CrossRef] [PubMed]
  22. Hahn, C.N.; Martin, M.d.; Schroder, M.; Vanier, M.T.; Hara, Y.; Suzuki, K.; Suzuki, K.; d’Azzo, A. Generalized Cns Disease and Massive Gm1-Ganglioside Accumulation in Mice Defective in Lysosomal Acid Beta-Galactosidase. Hum. Mol. Genet. 1997, 6, 205–211. [Google Scholar] [CrossRef] [PubMed]
  23. Matsuda, J.; Suzuki, O.; Oshima, A.; Ogura, A.; Noguchi, Y.; Yamamoto, Y.; Asano, T.; Takimoto, K.; Sukegawa, K.; Suzuki, Y.; et al. Β-Galactosidase-Deficient Mouse as an Animal Model for Gm1-Gangliosidosis. Glycoconj J. 1997, 14, 729–736. [Google Scholar] [CrossRef] [PubMed]
  24. Przybilla, M.J.; Ou, L.; Tabaran, A.F.; Jiang, X.; Sidhu, R.; Kell, P.J.; Ory, D.S.; O’Sullivan, M.G.; Whitley, C.B. Comprehensive Behavioral and Biochemical Outcomes of Novel Murine Models of Gm1-Gangliosidosis and Morquio Syndrome Type B. Mol. Genet. Metab. 2019, 126, 139–150. [Google Scholar] [CrossRef] [PubMed]
  25. Bidchol, A.M.; Dalal, A.; Trivedi, R.; Shukla, A.; Nampoothiri, S.; Sankar, V.H.; Danda, S.; Gupta, N.; Kabra, M.; Hebbar, S.A.; et al. Recurrent and Novel Glb1 Mutations in India. Gene 2015, 567, 173–181. [Google Scholar] [CrossRef] [PubMed]
  26. Brunetti-Pierri, N.; Scaglia, F. Gm1 Gangliosidosis: Review of Clinical, Molecular, and Therapeutic Aspects. Mol. Genet. Metab. 2008, 94, 391–396. [Google Scholar] [CrossRef] [PubMed]
  27. Caciotti, A.; Garman, S.C.; Rivera-Colon, Y.; Procopio, E.; Catarzi, S.; Ferri, L.; Guido, C.; Martelli, P.; Parini, R.; Antuzzi, D.; et al. Gm1 Gangliosidosis and Morquio B Disease: An Update on Genetic Alterations and Clinical Findings. Biochim. Biophys. Acta 2011, 1812, 782–790. [Google Scholar] [CrossRef]
  28. Celtikci, B.; Aydin, H.I.; Sivri, S.; Sönmez, M.; Topcu, M.; Özkara, H.A. Four Novel Mutations in the Β-Galactosidase Gene Identified in Infantile Type of Gm1 Gangliosidosis. Clin. Biochem. 2012, 45, 571–574. [Google Scholar] [CrossRef]
  29. Karimzadeh, P.; Naderi, S.; Modarresi, F.; Dastsooz, H.; Nemati, H.; Farokhashtiani, T.; Shamsian, B.S.; Inaloo, S.; Faghihi, M.A. Case Reports of Juvenile Gm1 Gangliosidosisis Type Ii Caused by Mutation in Glb1 Gene. BMC Med. Genet. 2017, 18, 73. [Google Scholar] [CrossRef] [Green Version]
  30. Tessitore, A.; del, P.M.M.; Sano, R.; Ma, Y.; Mann, L.; Ingrassia, A.; Laywell, E.D.; Steindler, D.A.; Hendershot, L.M.; d’Azzo, A. Gm1-Ganglioside-Mediated Activation of the Unfolded Protein Response Causes Neuronal Death in a Neurodegenerative Gangliosidosis. Mol. Cell 2004, 15, 753–766. [Google Scholar] [CrossRef]
  31. D’Azzo, A.; Tessitore, A.; Sano, R. Gangliosides as Apoptotic Signals in Er Stress Response. Cell Death Differ. 2006, 13, 404–414. [Google Scholar] [CrossRef] [Green Version]
  32. van der Voorn, J.P.; Kamphorst, W.; van der Knaap, M.S.; Powers, J.M. The Leukoencephalopathy of Infantile Gm1 Gangliosidosis: Oligodendrocytic Loss and Axonal Dysfunction. Acta Neuropathol. 2004, 107, 539–545. [Google Scholar] [CrossRef]
  33. Folkerth, R.D. Abnormalities of Developing White Matter in Lysosomal Storage Diseases. J. Neuropathol. Exp. Neurol. 1999, 58, 887–902. [Google Scholar] [CrossRef] [Green Version]
  34. Takamura, A.; Higaki, K.; Kajimaki, K.; Otsuka, S.; Ninomiya, H.; Matsuda, J.; Ohno, K.; Suzuki, Y.; Nanba, E. Enhanced Autophagy and Mitochondrial Aberrations in Murine Gm1-Gangliosidosis. Biochem. Biophys. Res. Commun. 2008, 367, 616–622. [Google Scholar] [CrossRef] [Green Version]
  35. Sano, R.; Annunziata, I.; Patterson, A.; Moshiach, S.; Gomero, E.; Opferman, J.; Forte, M.; d’Azzo, A. Gm1-Ganglioside Accumulation at the Mitochondria-Associated Er Membranes Links Er Stress to Ca2+-Dependent Mitochondrial Apoptosis. Mol. Cell 2009, 36, 500–511. [Google Scholar] [CrossRef] [Green Version]
  36. Jeyakumar, M. Central Nervous System Inflammation Is a Hallmark of Pathogenesis in Mouse Models of Gm1 and Gm2 Gangliosidosis. Brain 2003, 126, 974–987. [Google Scholar] [CrossRef] [Green Version]
  37. Sano, R.; Tessitore, A.; Ingrassia, A.; d’Azzo, A. Chemokine-Induced Recruitment of Genetically Modified Bone Marrow Cells into the Cns of Gm1-Gangliosidosis Mice Corrects Neuronal Pathology. Blood 2005, 106, 2259–2268. [Google Scholar] [CrossRef] [Green Version]
  38. Berg, J.M.; Tymoczko, J.L.; Stryer, L. Stryer Biochemie, 6th ed.; Elsevier GmbH: Munich, Germany, 2007. [Google Scholar]
  39. Futerman, A.H. Intracellular Trafficking of Sphingolipids: Relationship to Biosynthesis. Biochim. Biophys. Acta 2006, 1758, 1885–1892. [Google Scholar] [CrossRef] [Green Version]
  40. Kolter, T.; Sandhoff, K. Principles of Lysosomal Membrane Digestion: Stimulation of Sphingolipid Degradation by Sphingolipid Activator Proteins and Anionic Lysosomal Lipids. Annu. Rev. Cell Dev. Biol. 2005, 21, 81–103. [Google Scholar] [CrossRef] [Green Version]
  41. Skaper, S.D.; Leon, A.; Toffano, G. Ganglioside Function in the Development and Repair of the Nervous System. From Basic Science to Clinical Application. Mol. Neurobiol. 1989, 3, 173–199. [Google Scholar] [CrossRef]
  42. Skaper, S.D.; Facci, L.; Milani, D.; Leon, A. Monosialoganglioside Gm1 Protects against Anoxia-Induced Neuronal Death in Vitro. Exp. Neurol. 1989, 106, 297–305. [Google Scholar] [CrossRef]
  43. Sandhoff, K.; Harzer, K. Gangliosides and Gangliosidoses: Principles of Molecular and Metabolic Pathogenesis. J. Neurosci. 2013, 33, 10195–10208. [Google Scholar] [CrossRef] [PubMed]
  44. Timur, Z.K.; Demir, S.A.; Marsching, C.; Sandhoff, R.; Seyrantepe, V. Neuraminidase-1 Contributes Significantly to the Degradation of Neuronal B-Series Gangliosides but Not to the Bypass of the Catabolic Block in Tay-Sachs Mouse Models. Mol. Genet. Metab. Rep. 2015, 4, 72–82. [Google Scholar] [CrossRef] [PubMed]
  45. Phaneuf, D.; Wakamatsu, N.; Huang, J.Q.; Borowski, A.; Peterson, A.C.; Fortunato, S.R.; Ritter, G.; Igdoura, S.A.; Morales, C.R.; Benoit, G.; et al. Dramatically Different Phenotypes in Mouse Models of Human Tay-Sachs and Sandhoff Diseases. Hum. Mol. Genet. 1996, 5, 1–14. [Google Scholar] [CrossRef]
  46. Folkerth, R.D.; Alroy, J.; Bhan, I.; Kaye, E.M. Infantile Gm1 Gangliosidosis: Complete Morphology and Histochemistry of Two Autopsy Cases, with Particular Reference to Delayed Central Nervous System Myelination. Pediatr. Dev. Pathol. 2000, 3, 73–86. [Google Scholar] [CrossRef]
  47. Nada, R.; Gupta, K.; Lal, S.B.; Vasishta, R.K. An Autopsy Case of Infantile Gm1 Gangliosidosis with Adrenal Calcification. Metab. Brain Dis. 2011, 26, 307–310. [Google Scholar] [CrossRef]
  48. Müller, G.; Alldinger, S.; Moritz, A.; Zurbriggen, A.; Kirchhof, N.; Sewell, A.; Baumgärtner, W. Gm1-Gangliosidosis in Alaskan Huskies: Clinical and Pathologic Findings. Vet. Pathol. 2001, 38, 281–290. [Google Scholar] [CrossRef]
  49. Gray-Edwards, H.L.; Jiang, X.; Randle, A.N.; Taylor, A.R.; Voss, T.L.; Johnson, A.K.; McCurdy, V.J.; Sena-Esteves, M.; Ory, D.S.; Martin, D.R. Lipidomic Evaluation of Feline Neurologic Disease after Aav Gene Therapy. Mol. Ther. Methods Clin. Dev. 2017, 6, 135–142. [Google Scholar] [CrossRef] [Green Version]
  50. Gray-Edwards, H.L.; Regier, D.S.; Shirley, J.L.; Randle, A.N.; Salibi, N.; Thomas, S.E.; Latour, Y.L.; Johnston, J.; Golas, G.; Maguire, A.S.; et al. Novel Biomarkers of Human Gm1 Gangliosidosis Reflect the Clinical Efficacy of Gene Therapy in a Feline Model. Mol. Ther. 2017, 25, 892–903. [Google Scholar] [CrossRef] [Green Version]
  51. Schalli, M.; Weber, P.; Tysoe, C.; Pabst, B.M.; Thonhofer, M.; Paschke, E.; Stutz, A.E.; Tschernutter, M.; Windischhofer, W.; Withers, S.G. A New Type of Pharmacological Chaperone for Gm1-Gangliosidosis Related Human Lysosomal Beta-Galactosidase: N-Substituted 5-Amino-1-Hydroxymethyl-Cyclopentanetriols. Bioorg. Med. Chem. Lett. 2017, 27, 3431–3435. [Google Scholar] [CrossRef]
  52. Schalli, M.; Tysoe, C.; Fischer, R.; Pabst, B.M.; Thonhofer, M.; Paschke, E.; Rappitsch, T.; Stutz, A.E.; Tschernutter, M.; Windischhofer, W.; et al. N-Substituted 5-Amino-1-Hydroxymethyl-Cyclopentanetriols: A New Family of Activity Promotors for a Gm1-Gangliosidosis Related Human Lysosomal Beta-Galactosidase Mutant. Carbohydr. Res. 2017, 443, 15–22. [Google Scholar] [CrossRef]
  53. Suzuki, Y. Chaperone Therapy Update: Fabry Disease, Gm1-Gangliosidosis and Gaucher Disease. Brain Dev. 2013, 35, 515–523. [Google Scholar] [CrossRef]
  54. Deodato, F.; Procopio, E.; Rampazzo, A.; Taurisano, R.; Donati, M.A.; Dionisi-Vici, C.; Caciotti, A.; Morrone, A.; Scarpa, M. The Treatment of Juvenile/Adult Gm1-Gangliosidosis with Miglustat May Reverse Disease Progression. Metab. Brain Dis. 2017, 32, 1529–1536. [Google Scholar] [CrossRef]
  55. Shield, J.P.; Stone, J.; Steward, C.G. Bone Marrow Transplantation Correcting Β-Galactosidase Activity Does Not Influence Neurological Outcome in Juvenile Gm1-Gangliosidosis. J. Inherit. Metab. Dis. 2005, 28, 797–798. [Google Scholar] [CrossRef]
  56. Condori, J.; Acosta, W.; Ayala, J.; Katta, V.; Flory, A.; Martin, R.; Radin, J.; Cramer, C.L.; Radin, D.N. Enzyme Replacement for Gm1-Gangliosidosis: Uptake, Lysosomal Activation, and Cellular Disease Correction Using a Novel Β-Galactosidase:Rtb Lectin Fusion. Mol. Genet. Metab. 2016, 117, 199–209. [Google Scholar] [CrossRef]
  57. Beck, M. Treatment Strategies for Lysosomal Storage Disorders. Dev. Med. Child. Neurol. 2018, 60, 13–18. [Google Scholar] [CrossRef] [Green Version]
  58. Broekman, M.L.; Baek, R.C.; Comer, L.A.; Fernandez, J.L.; Seyfried, T.N.; Sena-Esteves, M. Complete Correction of Enzymatic Deficiency and Neurochemistry in the Gm1-Gangliosidosis Mouse Brain by Neonatal Adeno-Associated Virus-Mediated Gene Delivery. Mol. Ther. 2007, 15, 30–37. [Google Scholar] [CrossRef]
  59. Baek, R.C.; Broekman, M.L.; Leroy, S.G.; Tierney, L.A.; Sandberg, M.A.; d’Azzo, A.; Seyfried, T.N.; Sena-Esteves, M. Aav-Mediated Gene Delivery in Adult Gm1-Gangliosidosis Mice Corrects Lysosomal Storage in Cns and Improves Survival. PLoS ONE 2010, 5, e13468. [Google Scholar] [CrossRef] [Green Version]
  60. Hayward, C.; Patel, H.C.; Manohar, S.G.; Lyon, A.R. Gene Therapy for Gm1 Gangliosidosis: Challenges of Translational Medicine. Ann. Transl. Med. 2015, 3 (Suppl. 1), S28. [Google Scholar]
  61. Takaura, N.; Yagi, T.; Maeda, M.; Nanba, E.; Oshima, A.; Suzuki, Y.; Yamano, T.; Tanaka, A. Attenuation of Ganglioside Gm1 Accumulation in the Brain of Gm1 Gangliosidosis Mice by Neonatal Intravenous Gene Transfer. Gene Ther. 2003, 10, 1487–1493. [Google Scholar] [CrossRef] [Green Version]
  62. Weismann, C.M.; Ferreira, J.; Keeler, A.M.; Su, Q.; Qui, L.; Shaffer, S.A.; Xu, Z.; Gao, G.; Sena-Esteves, M. Systemic Aav9 Gene Transfer in Adult Gm1 Gangliosidosis Mice Reduces Lysosomal Storage in Cns and Extends Lifespan. Hum. Mol. Genet. 2015, 24, 4353–4364. [Google Scholar] [CrossRef] [Green Version]
  63. Gröne, A.; Alldinger, S.; Baumgärtner, W. Interleukin-1beta, -6, -12 and Tumor Necrosis Factor-Alpha Expression in Brains of Dogs with Canine Distemper Virus Infection. J. Neuroimmunol. 2000, 110, 20–30. [Google Scholar] [CrossRef]
  64. Vangipuram, M.; Ting, D.; Kim, S.; Diaz, R.; Schule, B. Skin Punch Biopsy Explant Culture for Derivation of Primary Human Fibroblasts. J. Vis. Exp. 2013, 77, e3779. [Google Scholar] [CrossRef]
  65. Kreutzer, R.; Kreutzer, M.; Sewell, A.C.; Techangamsuwan, S.; Leeb, T.; Baumgärtner, W. Impact of Beta-Galactosidase Mutations on the Expression of the Canine Lysosomal Multienzyme Complex. Biochim. Biophys. Acta 2009, 1792, 982–987. [Google Scholar] [CrossRef] [Green Version]
  66. Herzog, A.; Hartung, R.; Reuser, A.J.; Hermanns, P.; Runz, H.; Karabul, N.; Gökce, S.; Pohlenz, J.; Kampmann, C.; Lampe, C.; et al. A Cross-Sectional Single-Centre Study on the Spectrum of Pompe Disease, German Patients: Molecular Analysis of the Gaa Gene, Manifestation and Genotype-Phenotype Correlations. Orphanet J. Rare Dis. 2012, 7, 35. [Google Scholar] [CrossRef] [Green Version]
  67. Lowry, O.H.; Rosebrough, N.J.; Farr, A.L.; Randall, R.J. Protein Measurement with the Folin Phenol Reagent. J. Biol. Chem. 1951, 193, 265–275. [Google Scholar]
  68. Ichinomiya, S.; Watanabe, H.; Maruyama, K.; Toda, H.; Iwasaki, H.; Kurosawa, M.; Matsuda, J.; Suzuki, Y. Motor and Reflex Testing in Gm1-Gangliosidosis Model Mice. Brain Dev. 2007, 29, 210–216. [Google Scholar] [CrossRef]
  69. Crawley, J.N. Behavioral Phenotyping of Transgenic and Knockout Mice: Experimental Design and Evaluation of General Health, Sensory Functions, Motor Abilities, and Specific Behavioral Tests. Brain Res. 1999, 835, 18–26. [Google Scholar] [CrossRef]
  70. Matsuda, J.; Suzuki, O.; Oshima, A.; Ogura, A.; Naiki, M.; Suzuki, Y. Neurological Manifestations of Knockout Mice with Β-Galactosidase Deficiency. Brain Dev. 1997, 19, 19–20. [Google Scholar] [CrossRef]
  71. Gerhauser, I.; Alldinger, S.; Baumgärtner, W. Ets-1 Represents a Pivotal Transcription Factor for Viral Clearance, Inflammation, and Demyelination in a Mouse Model of Multiple Sclerosis. J. Neuroimmunol. 2007, 188, 86–94. [Google Scholar] [CrossRef]
  72. Kummerfeld, M.; Meens, J.; Haas, L.; Baumgärtner, W.; Beineke, A. Generation and Characterization of a Polyclonal Antibody for the Detection of Theiler’s Murine Encephalomyelitis Virus by Light and Electron Microscopy. J. Virol. Methods 2009, 160, 185–188. [Google Scholar] [CrossRef]
  73. Gerhauser, I.; Li, L.; Li, D.; Klein, S.; Elmarabet, S.A.; Deschl, U.; Kalkuhl, A.; Baumgärtner, W.; Ulrich, R.; Beineke, A. Dynamic Changes and Molecular Analysis of Cell Death in the Spinal Cord of Sjl Mice Infected with the Bean Strain of Theiler’s Murine Encephalomyelitis Virus. Apoptosis 2018, 23, 170–186. [Google Scholar] [CrossRef]
  74. Itoh, M.; Matsuda, J.; Suzuki, O.; Ogura, A.; Oshima, A.; Tai, T.; Suzuki, Y.; Takashima, S. Development of Lysosomal Storage in Mice with Targeted Disruption of the Β-Galactosidase Gene: A Model of Human Gm1-Gangliosidosis. Brain Dev. 2001, 23, 379–384. [Google Scholar] [CrossRef]
  75. Kreutzer, M.; Seehusen, F.; Kreutzer, R.; Pringproa, K.; Kummerfeld, M.; Claus, P.; Deschl, U.; Kalkul, A.; Beineke, A.; Baumgärtner, W.; et al. Axonopathy Is Associated with Complex Axonal Transport Defects in a Model of Multiple Sclerosis. Brain Pathol. 2012, 22, 454–471. [Google Scholar] [CrossRef]
  76. Nadeem, M.; Spitzbarth, I.; Haist, V.; Rohn, K.; Tauscher, K.; Rohn, K.; Bossers, A.; Langeveld, J.; Papasavva-Stylianou, P.; Groschup, M.H.; et al. Immunolabelling of Non-Phosphorylated Neurofilament Indicates Damage of Spinal Cord Axons in Tse-Infected Goats. Vet. Rec. 2016, 178, 141. [Google Scholar] [CrossRef]
  77. Herder, V.; Gerhauser, I.; Klein, S.K.; Almeida, P.; Kummerfeld, M.; Ulrich, R.; Seehusen, F.; Rohn, K.; Schaudien, D.; Baumgärtner, W.; et al. Interleukin-10 Expression During the Acute Phase Is a Putative Prerequisite for Delayed Viral Elimination in a Murine Model for Multiple Sclerosis. J. Neuroimmunol. 2012, 249, 27–39. [Google Scholar] [CrossRef]
  78. Tongtako, W.; Lehmbecker, A.; Wang, Y.; Hahn, K.; Baumgärtner, W.; Gerhauser, I. Canine Dorsal Root Ganglia Satellite Glial Cells Represent an Exceptional Cell Population with Astrocytic and Oligodendrocytic Properties. Sci Rep. 2017, 7, 13915. [Google Scholar] [CrossRef] [Green Version]
  79. Hortobagyi, T.; Wise, S.; Hunt, N.; Cary, N.; Djurovic, V.; Fegan-Earl, A.; Shorrock, K.; Rouse, D.; Al-Sarraj, S. Traumatic Axonal Damage in the Brain Can Be Detected Using Beta-App Immunohistochemistry within 35 Min after Head Injury to Human Adults. Neuropathol. Appl. Neurobiol. 2007, 33, 226–237. [Google Scholar] [CrossRef]
  80. Ammer, J.J.; Grothe, B.; Felmy, F. Late Postnatal Development of Intrinsic and Synaptic Properties Promotes Fast and Precise Signaling in the Dorsal Nucleus of the Lateral Lemniscus. J. Neurophysiol. 2012, 107, 1172–1185. [Google Scholar] [CrossRef] [Green Version]
  81. Franzen, D.L.; Gleiss, S.A.; Berger, C.; Kümpfbeck, F.S.; Ammer, J.J.; Felmy, F. Development and Modulation of Intrinsic Membrane Properties Control the Temporal Precision of Auditory Brain Stem Neurons. J. Neurophysiol. 2015, 113, 524–536. [Google Scholar] [CrossRef] [Green Version]
  82. Rautenberg, P.L.; Grothe, B.; Felmy, F. Quantification of the Three-Dimensional Morphology of Coincidence Detector Neurons in the Medial Superior Olive of Gerbils During Late Postnatal Development. J. Comp. Neurol. 2009, 517, 385–396. [Google Scholar] [CrossRef] [PubMed]
  83. Bradford, M.M. A Rapid and Sensitive Method for the Quantitation of Microgram Quantities of Protein Utilizing the Principle of Protein-Dye Binding. Anal. Biochem. 1976, 72, 248–254. [Google Scholar] [CrossRef]
  84. Brogden, G.; Husein, D.M.; Steinberg, P.; Naim, H.Y. Isolation and Quantification of Sphingosine and Sphinganine from Rat Serum Revealed Gender Differences. Biomolecules 2019, 9, 459. [Google Scholar] [CrossRef] [PubMed] [Green Version]
  85. Brogden, G.; Shammas, H.; Maalouf, K.; Naim, S.L.; Wetzel, G.; Amiri, M.; von Köckritz-Blickwede, M.; Das, A.M.; Naim, H.Y. Case Study on the Pathophysiology of Fabry Disease: Abnormalities of Cellular Membranes Can Be Reversed by Substrate Reduction in Vitro. Biosci. Rep. 2017, 37, BSR20160402. [Google Scholar] [CrossRef]
  86. Loos, B.; Toit, A.d.; Hofmeyr, J.H. Defining and Measuring Autophagosome Flux-Concept and Reality. Autophagy 2014, 10, 2087–2096. [Google Scholar] [CrossRef]
  87. Kandel, E.; Schwartz, H.; Jessell, T. Principles of Neural Science, 4th ed.; Butler, J., Lebowitz, H., Eds.; McGraw-Hill Education Ltd.: New York, NY, USA, 2000. [Google Scholar]
  88. Seehusen, F.; Baumgärtner, W. Axonal Pathology and Loss Precede Demyelination and Accompany Chronic Lesions in a Spontaneously Occurring Animal Model of Multiple Sclerosis. Brain Pathol. 2010, 20, 551–559. [Google Scholar] [CrossRef]
  89. Lempp, C.; Spitzbarth, I.; Puff, C.; Cana, A.; Kegler, K.; Techangamsuwan, S.; Baumgärtner, W.; Seehusen, F. New Aspects of the Pathogenesis of Canine Distemper Leukoencephalitis. Viruses 2014, 6, 2571–2601. [Google Scholar] [CrossRef] [Green Version]
  90. Guo, Q.; Wang, Z.; Li, H.; Wiese, M.; Zheng, H. App Physiological and Pathophysiological Functions: Insights from Animal Models. Cell Res. 2012, 22, 78–89. [Google Scholar] [CrossRef] [Green Version]
  91. Coleman, M.P.; Adalbert, R.; Beirowski, B. Neuroprotective Strategies in Ms: Lessons from C57bl/Wlds Mice. J. Neurol. Sci. 2005, 233, 133–138. [Google Scholar] [CrossRef]
  92. Gudi, V.; Gai, L.; Herder, V.; Tejedor, L.S.; Kipp, M.; Amor, S.; Suhs, K.W.; Hansmann, F.; Beineke, A.; Baumgärtner, W.; et al. Synaptophysin Is a Reliable Marker for Axonal Damage. J. Neuropathol. Exp. Neurol. 2017, 76, 109–125. [Google Scholar] [CrossRef]
  93. Maday, S.; Twelvetrees, A.E.; Moughamian, A.J.; Holzbaur, E.L. Axonal Transport: Cargo-Specific Mechanisms of Motility and Regulation. Neuron 2014, 84, 292–309. [Google Scholar] [CrossRef] [Green Version]
  94. Hirokawa, N.; Noda, Y. Intracellular Transport and Kinesin Superfamily Proteins, Kifs: Structure, Function, and Dynamics. Physiol. Rev. 2008, 88, 1089–1118. [Google Scholar] [CrossRef] [Green Version]
  95. Hirokawa, N.; Noda, Y.; Tanaka, Y.; Niwa, S. Kinesin Superfamily Motor Proteins and Intracellular Transport. Nat. Rev. Mol. Cell Biol. 2009, 10, 682–696. [Google Scholar] [CrossRef]
  96. Bock, P.; Spitzbarth, I.; Haist, V.; Stein, V.M.; Tipold, A.; Puff, C.; Beineke, A.; Baumgärtner, W. Spatio-Temporal Development of Axonopathy in Canine Intervertebral Disc Disease as a Translational Large Animal Model for Nonexperimental Spinal Cord Injury. Brain Pathol. 2013, 23, 82–99. [Google Scholar] [CrossRef]
  97. Dale, J.M.; Garcia, M.L. Neurofilament Phosphorylation During Development and Disease: Which Came First, the Phosphorylation or the Accumulation? J. Amino Acids 2012, 2012, e382107. [Google Scholar] [CrossRef] [Green Version]
  98. Petzold, A. Neurofilament Phosphoforms: Surrogate Markers for Axonal Injury, Degeneration and Loss. J. Neurol. Sci. 2005, 233, 183–198. [Google Scholar] [CrossRef] [Green Version]
  99. Grant, P.; Pant, H.C. Neurofilament Protein Synthesis and Phosphorylation. J. Neurocytol. 2000, 29, 843–872. [Google Scholar] [CrossRef]
  100. Yabe, J.T.; Jung, C.; Chan, W.K.; Shea, T.B. Phospho-Dependent Association of Neurofilament Proteins with Kinesin in Situ. Cell Motil. Cytoskelet. 2000, 45, 249–262. [Google Scholar] [CrossRef]
  101. Motil, J.; Chan, W.K.; Dubey, M.; Chaudhury, P.; Pimenta, A.; Chylinski, T.M.; Ortiz, D.T.; Shea, T.B. Dynein Mediates Retrograde Neurofilament Transport within Axons and Anterograde Delivery of Nfs from Perikarya into Axons: Regulation by Multiple Phosphorylation Events. Cell Motil. Cytoskelet. 2006, 63, 266–286. [Google Scholar] [CrossRef]
  102. Kummerfeld, M.; Seehusen, F.; Klein, S.; Ulrich, R.; Kreutzer, R.; Gerhauser, I.; Herder, V.; Baumgartner, W.; Beineke, A. Periventricular Demyelination and Axonal Pathology Is Associated with Subependymal Virus Spread in a Murine Model for Multiple Sclerosis. Intervirology 2012, 55, 401–416. [Google Scholar] [CrossRef]
  103. Spitzbarth, I.; Lempp, C.; Kegler, K.; Ulrich, R.; Kalkuhl, A.; Deschl, U.; Baumgartner, W.; Seehusen, F. Immunohistochemical and Transcriptome Analyses Indicate Complex Breakdown of Axonal Transport Mechanisms in Canine Distemper Leukoencephalitis. Brain Behav. 2016, 6, e00472. [Google Scholar] [CrossRef]
  104. Twelvetrees, A.E.; Pernigo, S.; Sanger, A.; Guedes-Dias, P.; Schiavo, G.; Steiner, R.A.; Dodding, M.P.; Holzbaur, E.L. The Dynamic Localization of Cytoplasmic Dynein in Neurons Is Driven by Kinesin-1. Neuron 2016, 90, 1000–1015. [Google Scholar] [CrossRef] [Green Version]
  105. Walkley, S.U.; Baker, H.J.; Rattazzi, M.C. Initiation and Growth of Ectopic Neurites and Meganeurites During Postnatal Cortical Development in Ganglioside Storage Disease. Dev. Brain Res. 1990, 51, 167–178. [Google Scholar] [CrossRef]
  106. Di Rocco, M.; Rossi, A.; Parenti, G.; Allegri, A.E.; Filocamo, M.; Pessagno, A.; Tortori-Donati, P.; Minetti, C.; Biancheri, R. Different Molecular Mechanisms Leading to White Matter Hypomyelination in Infantile Onset Lysosomal Disorders. Neuropediatrics 2005, 36, 265–269. [Google Scholar] [CrossRef]
  107. Erol, I.; Alehan, F.; Pourbagher, M.A.; Canan, O.; Yildirim, S.V. Neuroimaging Findings in Infantile Gm1 Gangliosidosis. Eur. J. Paediatr. Neurol. 2006, 10, 245–248. [Google Scholar] [CrossRef]
  108. Cathala, L.; Brickley, S.; Cull-Candy, S.; Farrant, M. Maturation of Epscs and Intrinsic Membrane Properties Enhances Precision at a Cerebellar Synapse. J. Neurosci. 2003, 23, 6074–6085. [Google Scholar] [CrossRef]
  109. Rodriguez-Molina, V.M.; Aertsen, A.; Heck, D.H. Spike Timing and Reliability in Cortical Pyramidal Neurons: Effects of Epsc Kinetics, Input Synchronization and Background Noise on Spike Timing. PLoS ONE 2007, 2, e319. [Google Scholar] [CrossRef]
  110. Zsiros, V.; Hestrin, S. Background Synaptic Conductance and Precision of Epsp-Spike Coupling at Pyramidal Cells. J. Neurophysiol. 2005, 93, 3248–3256. [Google Scholar] [CrossRef] [Green Version]
  111. van Meer, G.; Lisman, Q. Sphingolipid Transport: Rafts and Translocators. J. Biol. Chem. 2002, 277, 25855–25858. [Google Scholar] [CrossRef] [Green Version]
  112. Vance, J.E. Phospholipid Synthesis and Transport in Mammalian Cells. Traffic 2015, 16, 1–18. [Google Scholar] [CrossRef]
  113. Norton, W.T.; Poduslo, S.E. Myelination in Rat Brain: Method of Myelin Isolation. J. Neurochem. 1973, 21, 749–757. [Google Scholar] [CrossRef] [PubMed]
  114. Jackman, N.; Ishii, A.; Bansal, R. Oligodendrocyte Development and Myelin Biogenesis: Parsing out the Roles of Glycosphingolipids. Physiology 2009, 24, 290–297. [Google Scholar] [CrossRef] [PubMed] [Green Version]
  115. Ueno, K.; Ando, S.; Yu, R.K. Gangliosides of Human, Cat, and Rabbit Spinal Cords and Cord Myelin. J. Lipid Res. 1978, 19, 863–871. [Google Scholar] [PubMed]
  116. Ikonen, E. Roles of Lipid Rafts in Membrane Transport. Curr. Opin. Cell Biol. 2001, 13, 470–477. [Google Scholar] [CrossRef]
  117. Kuech, E.M.; Brogden, G.; Naim, H.Y. Alterations in Membrane Trafficking and Pathophysiological Implications in Lysosomal Storage Disorders. Biochimie 2016, 130, 152–162. [Google Scholar] [CrossRef]
  118. Hering, H.; Lin, C.C.; Sheng, M. Lipid Rafts in the Maintenance of Synapses, Dendritic Spines, and Surface Ampa Receptor Stability. J. Neurosci. 2003, 23, 3262–3271. [Google Scholar] [CrossRef] [Green Version]
  119. Kreutzer, R.; Kreutzer, M.; Propsting, M.J.; Sewell, A.C.; Leeb, T.; Naim, H.Y.; Baumgärtner, W. Insights into Post-Translational Processing of Beta-Galactosidase in an Animal Model Resembling Late Infantile Human G-Gangliosidosis. J. Cell Mol. Med. 2008, 12, 1661–1671. [Google Scholar] [CrossRef] [Green Version]
  120. Lei, H.L.; Ye, J.; Qiu, W.J.; Zhang, H.W.; Han, L.S.; Wang, Y.; Gu, X.F. Beta-Galactosidase Deficiencies and Novel Glb1 Mutations in Three Chinese Patients with Morquio B Disease or Gm1 Gangliosidosis. World J. Pediatrics 2012, 8, 359–362. [Google Scholar] [CrossRef] [PubMed]
  121. Pierson, T.M.; Adams, D.A.; Markello, T.; Golas, G.; Yang, S.; Sincan, M.; Simeonov, D.R.; Fajardo, K.F.; Hansen, N.F.; Cherukuri, P.F.; et al. Exome Sequencing as a Diagnostic Tool in a Case of Undiagnosed Juvenile-Onset Gm1-Gangliosidosis. Neurology 2012, 79, 123–126. [Google Scholar] [CrossRef] [Green Version]
  122. Coutinho, M.F.; Lacerda, L.; Macedo-Ribeiro, S.; Baptista, E.; Ribeiro, H.; Prata, M.J.; Alves, S. Lysosomal Multienzymatic Complex-Related Diseases: A Genetic Study among Portuguese Patients. Clin. Genet. 2012, 81, 379–393. [Google Scholar] [CrossRef]
  123. Cartegni, L.; Chew, S.L.; Krainer, A.R. Listening to Silence and Understanding Nonsense: Exonic Mutations That Affect Splicing. Nat. Rev. Genet. 2002, 3, 285–298. [Google Scholar] [CrossRef]
  124. Kwak, J.E.; Son, M.Y.; Son, Y.S.; Son, M.J.; Cho, Y.S. Biochemical and Molecular Characterization of Novel Mutations in Glb1 and Neu1 in Patient Cells with Lysosomal Storage Disorders. Biochem. Biophys. Res. Commun. 2015, 457, 554–560. [Google Scholar] [CrossRef]
  125. Denny, C.A.; Alroy, J.; Pawlyk, B.S.; Sandberg, M.A.; d’Azzo, A.; Seyfried, T.N. Neurochemical, Morphological, and Neurophysiological Abnormalities in Retinas of Sandhoff and Gm1 Gangliosidosis Mice. J. Neurochem. 2007, 101, 1294–1302. [Google Scholar] [CrossRef]
  126. Heinecke, K.A.; Luoma, A.; d’Azzo, A.; Kirschner, D.A.; Seyfried, T.N. Myelin Abnormalities in the Optic and Sciatic Nerves in Mice with Gm1-Gangliosidosis. ASN Neuro 2015, 7, e1759091415568913. [Google Scholar] [CrossRef]
Figure 1. Sequence of the Glb1−/− mice in exon 15 with the insert and enzyme activity of the β-galactosidase. (a) DNA sequence of parts of the exon 15 (yellow) with the knock-in (black). (b) Minimal β-galactosidase enzyme activity in Glb1−/− mice compared to wildtype (WT) control mice. ** p < 0.01. Graphs represent mean ± SD; n = 2 (WT at two and four months of age, Glb1−/− at four and six months of age), n = 3 (Glb1−/− at two months of age), n = 4 (WT at six months of age).
Jcm 09 01004 g001
Figure 2. Histology of the brain in all examined areas in two- and eight-month-old mice. (a1a5, c1c5): Neurons of wildtype (WT) mice; (b1b5, d1d5): Neurons of Glb1−/− mice with vacuolated neurons in all areas of the brain. Bars: 20 µm.
Jcm 09 01004 g002
Figure 3. Axonal alterations, astrogliosis and microgliosis in Glb1−/− mice. (ac) β-APP protein in the brainstem: (a) Eight-month-old wildtype (WT); (b) eight-month-old Glb1−/− mouse, arrows indicate β-APP positive spheroids; (c) quantification of β-APP positive spheroids in WT and Glb1−/− mice from two to eight-months of age. (df) GFAP protein in the brainstem: (d) Eight-month-old WT; (e) eight-month-old Glb1−/− mouse with an increase of GFAP positive astrocytes; (f) quantification of GFAP positive astrocytes in WT and Glb1−/− mice from two to eight-months of age. (gi) Iba1 protein in the brainstem: (g) Eight-month-old WT; (h) eight-month-old Glb1−/− mouse with an increase of Iba1 positive microglia/macrophages; (i) quantification of Iba1 positive microglia/macrophages in WT and Glb1−/− mice from two to eight months of age. Bars: 50 µm. red: Glb1−/− mice, green: WT. * p < 0.05. Graphs represent mean ± SD; n = 4.
Jcm 09 01004 g003
Figure 4. Immunohistochemistry of the brainstem with axonal damage. (a) Overview of the brainstem (eight-month-old wildtype (WT), kinesin). (bm): Brainstem of an eight-month-old Glb1−/− mouse compared to an eight-month-old WT. (bd) Kinesin protein in brainstem axons; (b) eight-month-old WT; (c) eight-month-old Glb1−/− mouse with several swollen axons (arrows); (d) quantification of kinesin positive axons in eight-month-old WT and Glb1−/− mice; (eg) Dynein protein in brainstem axons: (e) eight-month-old WT; (f) eight-month-old Glb1−/− with decreased dynein-positivity; (g) quantification of dynein positive axons in eight-month-old WT and Glb1−/− mice; (hj) pNF in brainstem axons: (h) eight-month-old WT; (i) eight-month-old Glb1−/− with decreased pNF positive axons; (j) quantification of pNF positive axons in eight-month-old WT and Glb1−/− mice; (km) nNF in brainstem axons: (k) Eight-month-old WT; (l) eight-month-old Glb1−/− with increased nNF positive axons; (m) quantification of nNF positive axons in eight-month-old WT and Glb1−/− mice. Bars: (a): 200 µm; (b), (c), (e), (f), (h), (i), (k), (l): 50 µm. red: Glb1−/− mice, green: WT. * p < 0.05. Box plots are used to show data; n = 4.
Jcm 09 01004 g004
Figure 5. Transmission electron microscopy. (a) Brainstem neuron of a wildtype (WT); (b) brainstem neuron of an eight-month-old Glb1−/− mouse; (c) dorsal root ganglion (DRG) neuron of a WT with normal lysosomes (L, insert); (d) DRG neuron of a Glb1−/− mouse with lysosomal lamellated storage material (arrows and insert); adjacent satellite glial cell (SGC) without storage material; (e) axons from WT DRG with regularly structured neurofilaments and microtubules with few mitochondria (M, insert); (f) axons in a DRG from an 8-month-old Glb1−/− mouse with lamellar storage material in lysosomes (S) and a relatively high number of mitochondria (M, insert); (g, h) myelin in the spinal cord white matter of eight-month-old WT and Glb1−/− mice; (i, j) hepatocytes of eight-month-old WT and Glb1−/− mice; (k, l) renal tubular epithelial cells of eight-month-old WT and Glb1−/− mice. Bars: (ad), (gl): 10 µm, (e, f): 5 µm.
Jcm 09 01004 g005
Figure 6. Electroporation: Single cell stainings of 3.5 to five-month-old Glb1−/− and wildtype (WT) neurons. (a) Purkinje cell of a WT mouse; (b) Purkinje cell of a Glb1−/− mouse; (c, d) single optical sections of Purkinje cell dendrites of the WT animal; (e, f) single optical sections of Purkinje cell dendrites of the Glb1−/− animal; (g, h) dendrites of principal cells of the medial nucleus of the trapezoid body of the WT; (i, k) vacuolation of dendrites of principal cells of the medial nucleus of the trapezoid body of the Glb1−/− mouse. Bars: (a, b): 60 µm, (cf): 20 µm, (gi, k): 10 µm.
Jcm 09 01004 g006
Figure 7. Electrophysiological characterization of GM1-gangliosidosis-associated lesions. Sub- and supra-threshold properties of 3.5 to five-month-old Glb1−/− and WT neurons of the medial nucleus of the trapezoid body. (a) Voltage steps from −60 to −65 mV (top) induce a charging transient (bottom) used to calculate the cell capacitance (b). The gray shaded area indicates the region of the charge transfer (tauweighted × 5) that was used to calculate the membrane capacitance. The gray dotted line represents the bi-exponential fit to the average trace. * p = 0.0147 (b) Cell capacitance of WT and Glb1−/− MNTB neurons. Round symbols represent single cells, and open squares the average (mean ± sem). (c) Current injections of −10 pA (top) induce a small hyperpolarization (bottom) used to extract the membrane resistance (e) and the time constant (f). Trace represents the average of 100 repetitions; the gray dotted line is an exponential fit from start to the maximal deflection. (d) Resting membrane potential of WT and Glb1−/− MNTB neurons. (e) Membrane resistance of WT and Glb1−/− MNTB neurons. Symbols as in (b), * p = 0.0128. (f) Membrane time constant (τmem) of WT and Glb1−/− MNTB neurons. Symbols as in (b). (g) Sub- and supra-threshold voltage response to current injections. Gray trace represents first supra-threshold current injection. (h) Sub-threshold input–output function of WT (black) and Glb1−/− (red) MNTB neurons extracted from voltage response shown in (g). Closed symbols depict the maximal voltage deflection; open symbols the voltage response of the steady state level at the end of the current injection. (i) Threshold current injection trigger supra- (black) and sub- (gray) threshold voltage responses. (j) Action potential jitter, defined as the standard deviation of the peak time of supra-threshold events of experiments as shown in (i). Symbols as in (b). (k) Time the sub-threshold events stay above the top 5% of the voltage amplitude. Symbols as in (b).
Jcm 09 01004 g007
Figure 8. Biochemical characterization of fibroblasts. (a) TLC analysis of 3.5 to five-month-old Glb1−/− and wildtype (WT) fibroblasts for phosphatidylserine (PS), phosphatidylcholine (PC) and sphingomyelin (SM); (b) presence of Gb3, GM1 and GA1 in Glb1−/− mice and Gb3 in WT mice; (c) cholesterol concentration in WT and Glb1−/− mice determined by HPLC; (d) Western blot of sucrose density gradient fractions for flotillin 2 and RhoA; (e, f) HPLC analysis of the same fractions for flotillin 2 and cholesterol distribution. * p < 0.05. Box plots are used to show data; n = 4.
Jcm 09 01004 g008
Figure 9. Lipid content of tissues. (ae) TLC analysis of four-month-old Glb1−/− and wildtype (WT) fibroblasts; (f) HPLC analysis for cholesterol. * p < 0.05; ** p < 0.01. Box plots are used to show data; n = 4.
Jcm 09 01004 g009
Table 1. Antibodies used for immunohistochemistry.
1st AntibodyClonalityDilutionManufacturer2nd Antibody
Amyloid precursor protein (APP), MAB348; 22C11Mouse monoclonal1:2000Millipore, Burlington, USAGoat-anti- mouse (GAM, BioLogo, BA-9200)
2′,3′-Cyclic-nucleotide-3′-phosphodiesterase (CNPase), 11-5B1:100
Dynein, MMS-400P1:25Covance Inc., Princeton, USANone
Non-phosphorylated neurofilament (nNF), SMI-3111:8000Calbiochem, Merck KGaA, Darmstadt, GermanyGoat-anti- mouse (GAM, BioLogo, BA-9200)
Phosphorylated neurofilament (pNF), SMI-3121:8000Sternberger Monoclonals Incorporated, MD, USA
Glial fibrillary acidic protein (GFAP), 6F2Rabbit polyclonal1:1000Dako/Agilent Technologies, Santa Clara, CA, USAGoat-anti- rabbit (GAR, 1:200, BioLogo, BA-1000)
Iba1, PA5-274361:1000Thermo Electron LED GmbH, Langenselbold, Germany
Kinesin, K0889-100UG1:400Sigma-Aldrich Chemie GmbH, Taufkirchen, Germany
Myelin basic protein (MBP), AB9801:500Millipore, Burlington, USA
Periaxin (PRX), HPA0018681:5000Sigma-Aldrich, Taufkirchen, Germany
β-APP is a reliable marker for axonal damage [79] and was used for a first detection of axonal alterations present in the current Glb1−/− mice. Axonal damage of eight-month-old mice (two females and two males/group) was further characterized using antibodies directed against pNF, nNF, kinesin and dynein (Table 1). Goat-anti-mouse IgG (1:200, BA-9200) and goat-anti-rabbit IgG (GAR, 1:200, BA-1000, BioLogo Dr. Harmut Schultheiss e.K, Kronshagen, Germany) were used as secondary antibodies. However, dynein immunoreactivity was visualized by using the kit Dako REAL™ EnVision™ Detection System (K5007, Dako Denmark A/S, Glostrup, Denmark) instead of using a secondary antibody. Brains from analogous numbers of wild type age-matched mice were used as control tissue.
Table 2. Scoring of clinic and behavioral changes of Glb1−/− mice.
Tests for General Health Condition
TestGradePoints
General appearanceNormal posture, smooth and shiny hair0
Normal posture, dull and shaggy hair1
Mildly crooked back, dull and shaggy hair2
Severely crooked back, dull, shaggy and dirty hair, incontinence3
Behavior and activityAttentive and curious0
Very calm, mildly reduced spontaneous activity, unreduced induced activity1
Apathy, moderately reduced spontaneous activity, mildly reduced, induced activity2
Stupor, no spontaneous activity, little induced activity3
GaitNormal gait0
Mild ataxia, occasionally mild unsteady gait1
Moderate ataxia, frequently mild to moderate unsteady gait, mild staggering and stumbling2
Severe ataxia, frequently moderate to severe unsteady gait3
Neurologic Tests for the Characterization of GM1-Gangliosidosis
TestGradePoints
“Parachute” reflexExtension and abduction of the hindlimbs, extension of the knee0
Mildly delayed reaction, intermitting extension of the knee1
Moderately delayed reaction, flexion and adduction of the hind limbs, slow movement2
No reaction, continuous flexing and adducting of the hind limbs3
Grid walkingAnimal does not step into mesh circuit0
21–30 s until stepping into mesh circuit1
11–20 s until stepping into mesh circuit2
0–10 s until stepping into mesh circuit3
Hang testMouse is able to hang horizontally upside down at a grid for more than 30 s0
Mouse adheres for 21–30 s1
Mouse adheres for 11–20 s2
Mouse adheres for 10–0 s3
Avoidance behavior after pinching the base of the tailStrong reaction, squeaking0
Mildly delayed reaction1
Turning of the trunk, extension of the hindlimbs2
No reaction3
Correction of the body position after turning onto the backImmediate correction0
Mildly delayed correction1
Moderate to severely delayed correction2
No correction3
Total24
General health condition was determined by scoring “General appearance”, “Behavior and activity” and “Gait”. Three points in one of these categories were defined as the endpoint for the experiment, which was generally observed at the age of eight months. Parachute reflex, grid walking, hang test, avoidance behavior and correction of the body position were analyzed for a more detailed characterization of neurologic deficits during disease development of GM1-gangliosidosis.

