Concept Paper

Nonstop Selection for High and Stable Crop Yield by Two Prognostic Equations to Reduce Yield Losses

by
Dionysia A. Fasoula
Department of Plant Breeding, Agricultural Research Institute, P.O. Box 22016, 1516 Nicosia, Cyprus
Agriculture 2012, 2(3), 211-227; https://doi.org/10.3390/agriculture2030211
Submission received: 18 June 2012 / Revised: 21 August 2012 / Accepted: 23 August 2012 / Published: 7 September 2012
(This article belongs to the Special Issue The Impact of Plant Disease on Food Security)

Abstract

:
Yield losses occurring at the field level, whether due to plant diseases or abiotic stresses, reveal reduced stability of the crop yield potential. The paper argues that the stability of crop yield potential is a trait with a clear genetic component, which can be successfully selected for at the single-plant level and incorporated into high-yielding cultivars. Two novel selection equations with prognostic power are presented, capable to objectively phenotype and evaluate individual plants in real field conditions in the absence of the masking effects of interplant competition and soil heterogeneity. The equations predict performance at the crop stand through the key concept of coefficient of homeostasis and are equally useful for early generation selection and for nonstop selection within finished cultivars in order to continuously incorporate the adaptive (genetic or epigenetic) responses of plants. Exploitation of adaptive responses acquires particular importance in view of the climate change effects on crop productivity and the changing biotic or abiotic micro-environments. Cotton is used as a case study to highlight the potential of nonstop selection for increasing crop yield and for the gradual build-up of disease resistance. In addition, the paper envisions and proposes the formation of international networks of researchers focusing on specific diseases as, for example, the cereal root-rot or the cotton Verticillium wilt that will concurrently use the proposed strategy in their respective environments to select for resistant genotypes, while gaining a deeper understanding of the nature of the genetic or epigenetic changes at the phenotypic and genomic levels.

1. Introduction

Over the past years the observed difference between potential and actual crop yields globally has emerged as a key issue demanding further consideration and action by the scientific community in order to improve food security [1,2,3]. On top of this, there have been many reports documenting a decrease in the annual yield gain and a stagnation of yields of major crops globally, because of either genetic or environmental reasons, including farm management practices [4,5,6,7,8]. Even in reports where the cause of stagnation is attributed primarily to environmental reasons, it becomes apparent that the high yields of the modern genetically improved cultivars cannot be stably maintained across seasons, years, and countries. The interaction between genetic composition and environment is such that the high potential yields are realized only in a limited range of optimal growing conditions or seasonal environments. In other words, a majority of cultivated, improved genotypes are not able to sustain their potential for high yields under a wider range of growing and often challenging conditions, where it actually is needed most.
To this, one can add the effects of global climate change that are certain to exacerbate the problem, for a variety of well-documented reasons extensively treated in recent literature, including increase in number and intensity of pest attacks, radical change in rainfall patterns, CO2 emissions, and others (e.g., [9,10,11]). The role of plant breeding to provide a range of solutions to the problem is pivotal and well recognized: Plant breeding is able to generate huge value relative to investment and offers an effective approach to improving food security [12].
Crop yield losses at the field level may be reduced by ensuring ideal growing conditions throughout the growing period or by developing genotypes that most efficiently exploit available resources. The second goal is certainly more relevant to the low-input conditions of the resource-poor farmers, who are primarily threatened by food insecurity, and will be the focus of the present article. The purpose is twofold: To provide insights into novel breeding concepts and equations whose application can accurately assess and incorporate genotypic stability of yield under field conditions, and to bring attention to the critical roles of yield stability and nonstop selection in mitigating and reducing crop losses. Cotton is used as a case study to illustrate both the potential to gradually incorporate resistance to pathogens much faster than in conventional breeding and the necessity of nonstop selection to improve the yield and homeostasis of cultivated varieties, especially during the annual propagation of breeder seed.
Research that led to the identification of yield stability as the critical factor that connects yield potential at the single-plant level with crop yield conditions has its origins in the development and applications of the Honeycomb field selection designs [13]. The time course of this research, through some key publications that defined the principles which underlie the present cotton case study, can be briefly described as follows: An early important article [14] demonstrated the existence of a negative correlation between a plant’s yielding and competitive ability and showed that because of this, progress through selection in a breeding program is achieved when the evaluated plants are grown at distances excluding any interplant competition. Consequently, the unit of selection ceases to be the conventional, densely sown plot, becoming the individual plant grown in the absence of interplant competition. Subsequent work [15] measured for the first time the correlation between yielding and competitive ability, which was found to be high and negative. This negative correlation was interpreted as the main cause of variety degeneration and of selection inefficiency during the early, segregating generations of a breeding program. In the traditional densely-sown plots, where cultivar reproduction commonly occurs, there is preferential and gradual proliferation of genotypic forms that are high competitors-reduced yielders at the expense of high yielders-weak competitors. Another key finding was that the conditions, which maximize crop yield are those that minimize interplant competition.
The unique properties and establishment process of the Honeycomb field selection designs (Figure 1 and Figure 2), conceived to accurately evaluate individual plants through elimination of the masking effects of soil heterogeneity and interplant competition, have been extensively treated in [13]. A subsequent article [16] defined interplant competition as the interference with the equal sharing of growth resources among plants because of genetic and acquired differences. It was demonstrated that in the crop stand, the gains from competition do not overcompensate for the losses from it. In the prevalence of big genetic or acquired differences in the crop stand, crop yields are reduced, a concept of great relevance as to the reasons for the observed gap between actual and potential yields. The article established the use of the Coefficient of Variation (CV) of single-plant yields to measure the acquired and the genetic competition. Under dense stands, CV strongly correlates with crop yield (the lower the CV, the lower the unequal sharing of resources within the crop stand, the more uniform the stand, and the higher the yield). An early verification of this notion appeared in [17] and [18]. Under conditions that exclude interplant competition, CV was found to reflect the departure from normality of the yield distribution and to estimate the load of deleterious genes in breeding populations [16].
A further essential point was the analysis of the crop yield potential into three independent genetic components [19,20] estimated reliably in the absence of the masking effects of interplant competition and soil heterogeneity. The three components were defined as (i) the yield potential per plant, estimated by the mean progeny yield Agriculture 02 00211 i001, (ii) the stability, estimated by the standardized progeny mean yield Agriculture 02 00211 i002, where Agriculture 02 00211 i003 and Agriculture 02 00211 i004 represent the mean and the standard deviation of the entry/line where each plant belongs, and (iii) the adaptability or responsiveness to inputs, estimated by the standardized selection differential Agriculture 02 00211 i005. The independence among the three genetic components was key for predicting for the first time the possibility to develop monogenotypic cultivars that are density-neutral (i.e., capable to attain maximal yields under a wide range of planting densities), while simultaneously possessing high yields per hectare under standard crop stands. The existence of density-neutral cultivars, further verified in maize [21], a crop whose hybrid performance is known to be highly density-dependent, demonstrated conclusively that density ceases to represent a component of crop yield potential, an idea that had been a widespread working assumption during the recent past (e.g., [22]). The same article [19] first presented the concept of ‘nonstop’ selection as an essential component of a comprehensive breeding procedure.
Figure 1. The replicated R-7 design evaluates a maximum of seven lines. The unique property where every single plant occupies the center of a complete moving replicate in any field position is characteristic of all honeycomb selection designs. Another unique and characteristic property is the placement of all plants of each line in the corners of a triangular grid pattern, illustrated for Line 3, which samples soil heterogeneity more efficiently than random allocation [13]. The triangular arrangement extends across the field for all lines and permits to capitalize on soil heterogeneity to select for stability of performance by the line coefficient of homeostasis. Importantly, all plants have equal opportunities to be selected, and selected plants come of any field position, regardless of soil fertility trends.
Agriculture 02 00211 g001
Figure 2. The replicated R-31 design evaluates 31 lines. The complete moving replicate and the triangular grid are illustrated for plants of Line 4. Plants are arranged in horizontal rows in an ascending order and the number set is repeated regularly. The starting number is different in each row, an essential property for the formation of moving replicates [13]. This unique arrangement allows using the Plant Yield Index to express the individual plant yields as a ratio to a common denominator, i.e., to the average of a complete moving replicate, and remove the confounding effect of soil heterogeneity on single plant yields. Plants are objectively ranked according to their yielding capacity avoiding the bias of the visual evaluation, commonly known as the “breeder’s eye”. The arrangement and the practically unlimited number of replications (>30) afforded by all honeycomb selection designs offer unbiased and precise estimations of the components of crop yield potential.
Agriculture 02 00211 g002
The partitioning of crop yield potential was incorporated in a novel software package designed to analyze data from honeycomb breeding experiments [23].
Through exploitation of the unique properties of the Honeycomb designs, it was subsequently possible to condense the three components of crop yield potential to two [24,25,26]. The two components are the Plant Yield Index PYI = Agriculture 02 00211 i008 
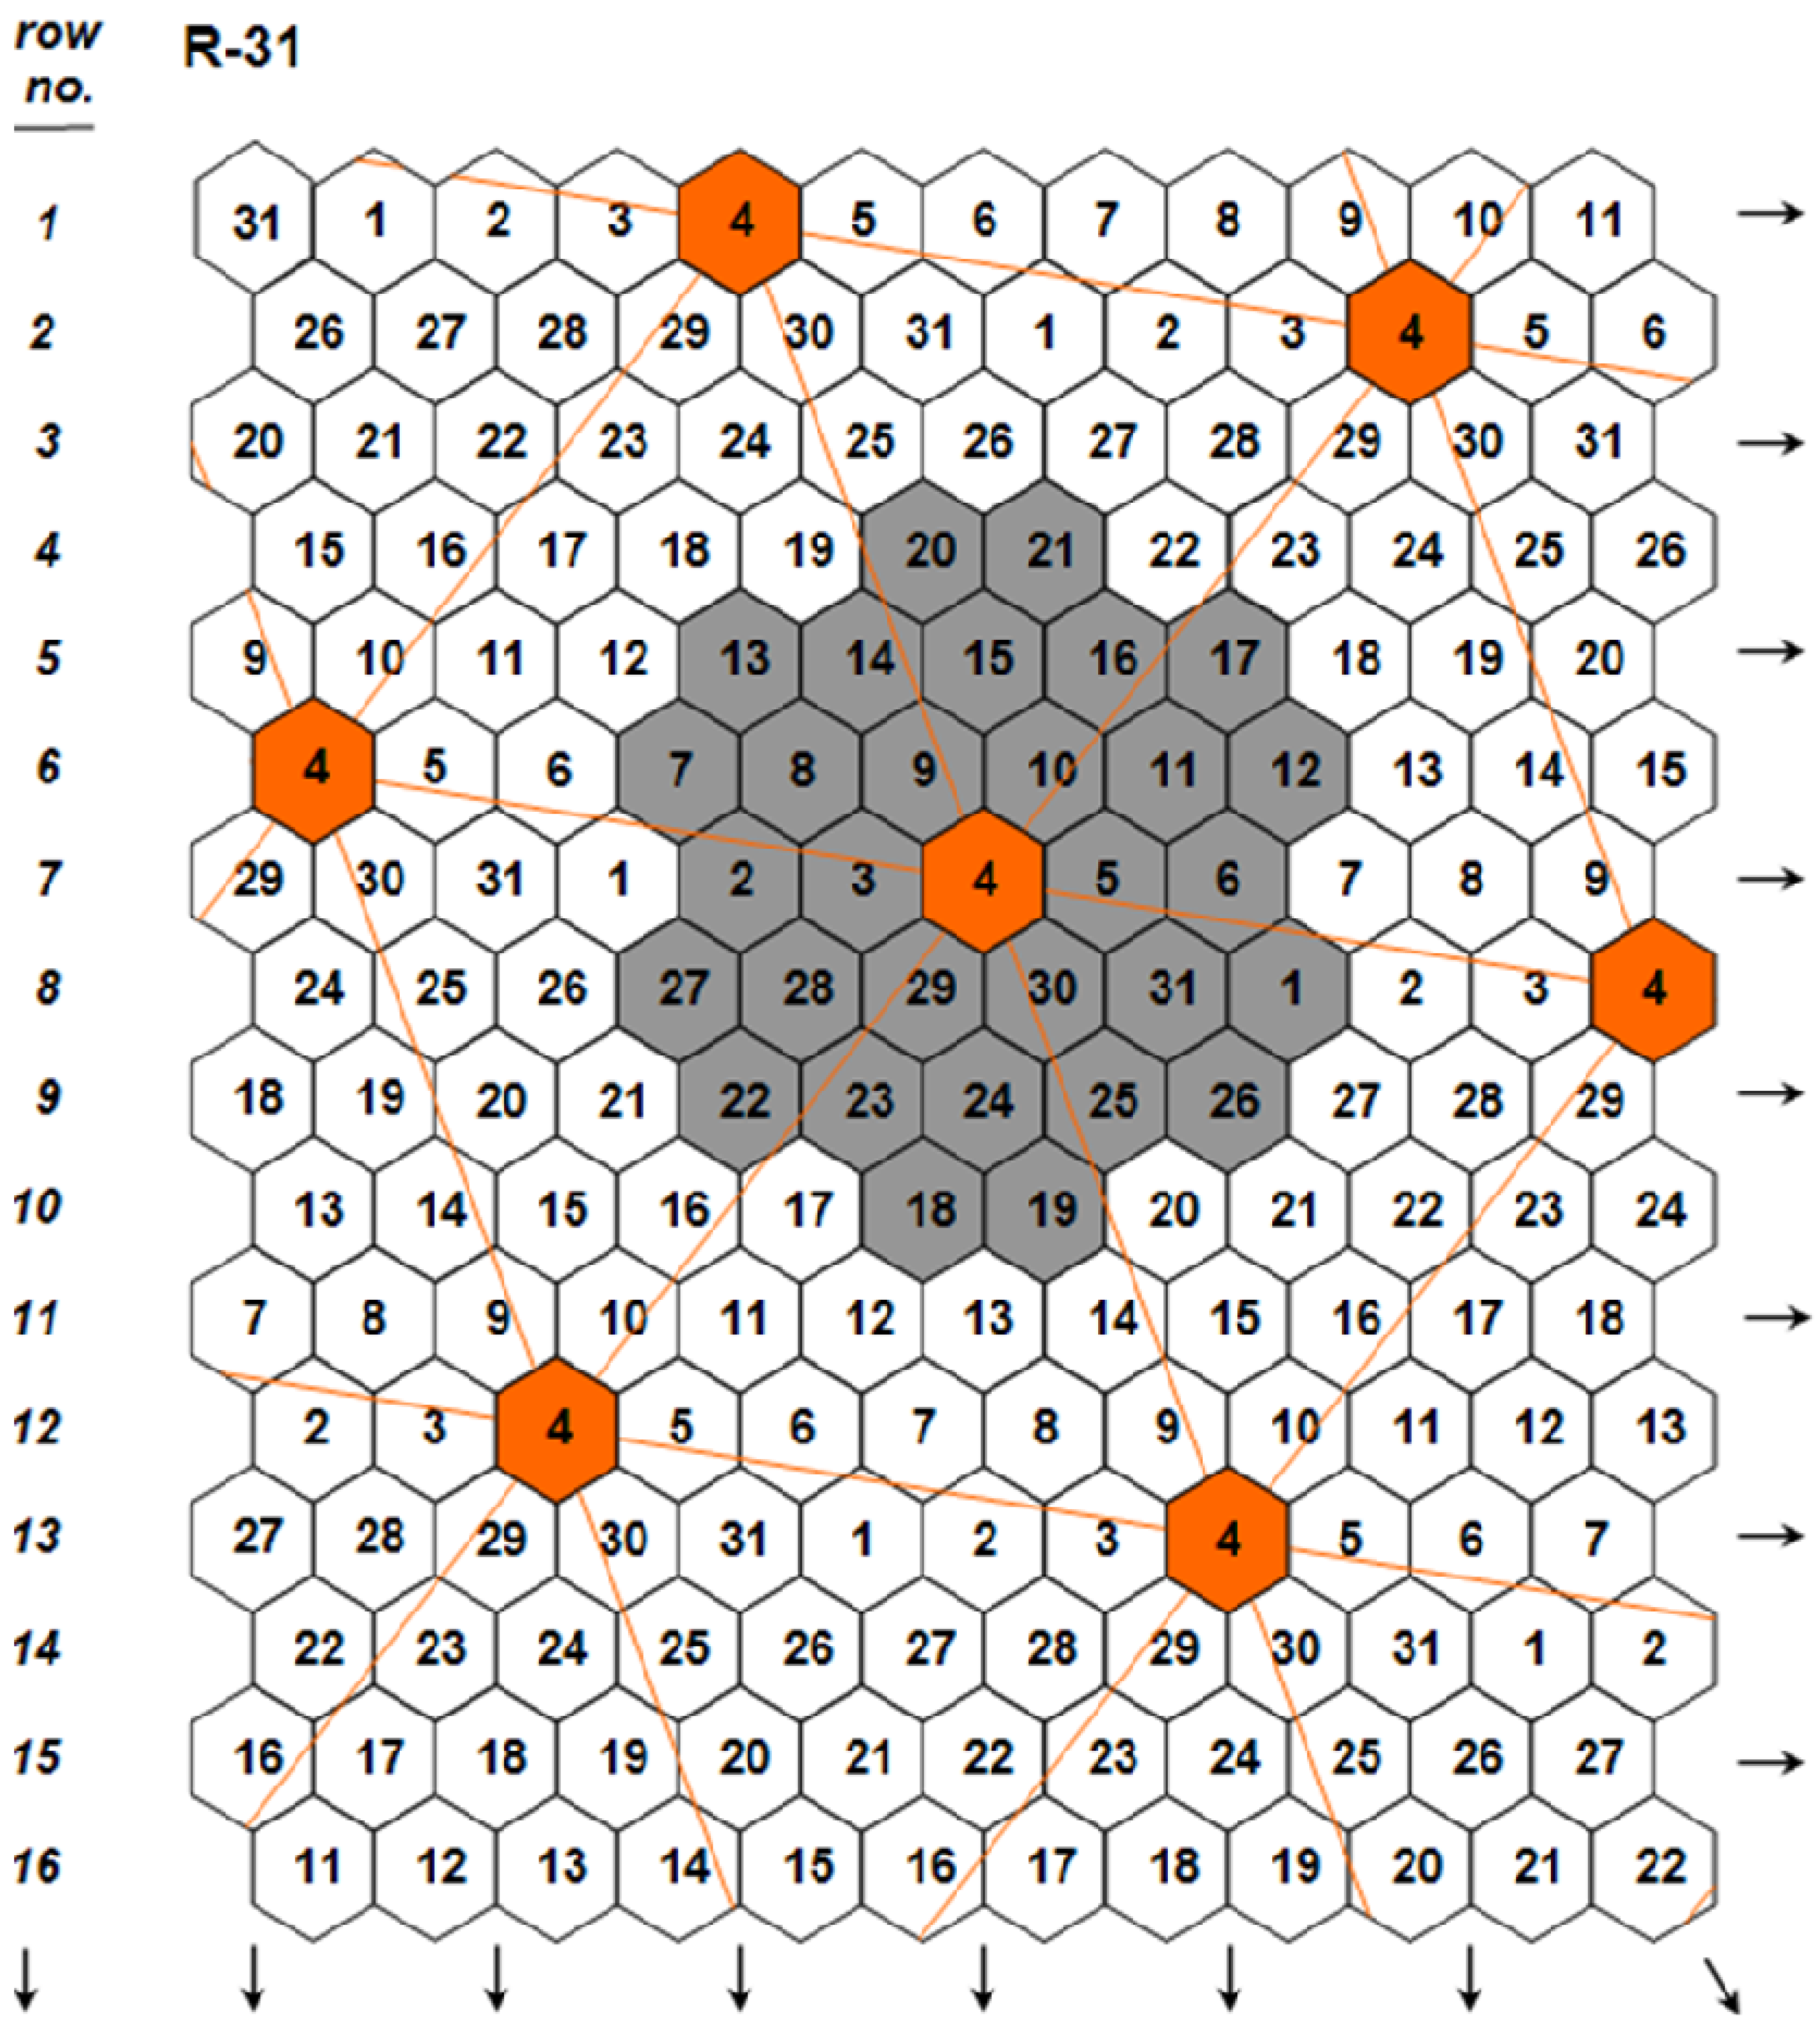
(Figure 2; Design Code 4 exemplifies plants whose yield per plant Agriculture 02 00211 i009is compared to the mean yield Agriculture 02 00211 i010 of the surrounding plants of the 30 remaining entries in the grey area), measuring with accuracy individual plant yield potential, and the Coefficient of Homeostasis CH = Agriculture 02 00211 i011, measuring yield stability or homeostasis. The CH incorporates every factor affecting stability of performance, including heritability, heterozygosity, biotic and abiotic stresses, high planting densities, and any other source contributing to yield variability. The product of the two components measures the plant’s crop yield potential and constitutes the first of two novel equations used in the selection process.
Agriculture 02 00211 i017
The second equation results by replacing the parameter PYI by the Line Yield Index LYI = Agriculture 02 00211 i012, where Agriculture 02 00211 i013 is the mean yield of the progeny line (lines 1 to 31 in this case) and Agriculture 02 00211 i014 the mean yield of all plants in the trial:
Agriculture 02 00211 i018
The concept of nonstop selection finds additional substantiation to the wealth of earlier and recent data pointing to the high fluidity of plant genomes, which are capable to sense and respond to environmental stimuli by several mechanisms, releasing heritable de novo adaptive genetic or epigenetic variation [27,28,29,30,31,32,33,34,35,36]. Extensive analysis of the use of variance in selection experiments is given in [37,38].
This concept paper uses cotton as a case study, drawing from two different sets of experimental data. In the first set, the aim was to expose and effectively exploit this newly generated adaptive variation for breeding purposes. For this, it was necessary to control the effects of interplant competition, soil heterogeneity, and genotype-by-environment interactions on selection efficiency. The equations were used effectively to identify and select superior lines within a leading elite cotton cultivar, revealing big differences in yield and stability even within this very uniform, by conventional standards, material. In another, earlier study, the efficiency of selection using the concepts of honeycomb breeding led to the build-up of resistance to cotton soil pathogens in the comparative very short time of one selection year. Both studies demonstrate the necessity and the means for nonstop improvement of crop yield and stability mechanisms, one of which is resistance to biotic stresses, and testify to the existence of untapped plasticity in the cotton genome. This yet unexploited genome plasticity is not unique to cotton, as it has become evident in other crops, legumes and cereals alike [15,39,40,41,42]. Thus, it can be beneficially exploited to bridge the gap between potential and actual crop yield in a wide array of cases.

2. Key Attributes Underlying the Supremacy of the Two Prognostic Equations

  • 1. The choice of the individual plant grown under ultra-wide plant spacings as unit of evaluation and selection to eliminate the confounding effects of density and competition on single-plant yields.
  • 2. The partition of the plant crop yield potential into two components: (1) the plant yield potential, and (2) the plant stability of performance. The invention of the honeycomb selection designs permits the formulation of two parameters measuring the two components with high precision and accuracy.
  • 3. The realization of accurate and precision whole-plant field phenotyping for crop yield potential.
  • 4. The possibility of applying ultra-high selection pressures (1 to 0.5%, meaning less than 1% plants retained after the comparative evaluation) and the resulting attainment of high advance through selection without sacrificing accuracy of selection. Although in theory [43], the higher the selection pressures, the higher the expected progress through selection, in conventional breeding practice, the working selection pressures are commonly at the level of 10% or more.
  • 5. The growing of plants in the absence of competition cancels the undesirable correlation between the CV and the mean that confounds predictions and permits the use of CV to select for stability of performance.
  • 6. The predictive power of the two equations is further increased due to the possibility to select in the same generation plants characterized by high and stable crop yield potential, as opposed to progeny testing requiring at least two successive generations.
  • 7. The increase of the genetic gain per annum from the average 1% genetic gain attained by conventional breeding, to a two-digit percentage.
  • 8. The production of density-neutral cultivars possessing a number of advantages, including avoidance of reseeding in case of non-satisfactory germination and increased tolerance to drought stress through use of lower seeding rates.
  • 9. The increase of the effectiveness of molecular breeding by enabling to rank an unlimited number of plants for crop yield potential with equal accuracy of assessment.
  • 10. The unit of selection in honeycomb breeding is the individual plant, while the unit of analysis in molecular breeding is also the individual plant genome. This offers the possibility to successfully marry phenotyping with genotyping and to bridge the so-called genotype-phenotype gap [44].

3. Results and Discussion

3.1. Intra-Cultivar Selection for Yield and Stability within Elite Cotton Cultivars

The first set of experiments lasted four years and focused on one leading cotton cultivar, Celia, after a preliminary evaluation of seven cotton varieties using a replicated-7 honeycomb selection design (Figure 1). This first-year trial allowed selection of 30 out of the 133 total plants representing Celia based on the Plant Yield Index. In the next year, the 30 plants along with the original cultivar formed 31 progeny lines and were grown as a replicated-31 honeycomb selection design (Figure 2) with 28 plants (replications) per line. The next two years the top selected lines were tried in standard Randomized Complete Block (RCB) trials, along with the original cultivar, to assess selection outcome and genetic gain.
Table 1 shows the ranking of the 31 lines of the replicated-31 honeycomb selection design based on the values of Coefficient of Homeostasis, ranging from 3.2 to 23.7. Importantly, the higher CH values belong to Lines 5 and 3, which outperformed others in the RCB trials of the subsequent years (Table 3, Table 4), testifying to the importance of stability as a genetic component in the selection process. The corresponding Equation A unitless values are the mean values of the five best plants per line. The wide range of these values and the fact that Lines 3 and 5, which excelled in subsequent RCB trials (Table 3, Table 4), also possess the highest Equation values, testify to its high resolving and predicting power, unraveling a tremendous variation for crop yield genetic potential among progeny lines. Further, although Lines 5 and 3 possess almost equal Equation A values, they differ in the values of the two components. Line 5 was superior in homeostasis, i.e., in stability of performance, and inferior in yield potential, whereas the opposite was the case for Line 3. This difference was reflected in the line performance in RCB trials. Line 5, possessing the higher stability of performance, retained the average 20% superiority over Celia in the two years (Table 4), whereas Line 3 only during the first year. This emphasizes the importance of giving increased weight to the genetic component of homeostasis any time the breeder has to decide among entries with equal Equation A values.
Table 1. Ranking of the 31 cotton lines of the replicated R-31 honeycomb design based on their Coefficient of Homeostasis (CH) values. The corresponding unitless values of Equation A represent the mean value of the five best plants per line.
Line
Rank no.Design code no.CH ValueEquation A valueRank no.Design code no.CH ValueEquation A valueRank no.Design code no.CH ValueEquation A value
1523.745112211.22221107.213
2320.849127101422147.28
31620.33913219.71623127.116
4616.3331499.41824276.813
5816.1261549.31925116.18
61914.52716299.22126265.84
7114.42517258.81627135.29
82312.72018308.42028174.98
92812.12019187.82129244.810
101511.22120Original cultivar7.5123023.87
31203.217
The efficiency of selection is also evidenced as the CH and equation values of the original cultivar are up to three and four times lower, respectively, than the top selected lines. Notably, a high CH value does not necessarily correspond to a similarly high Equation A value, as is the case with Line 16. This line, although similar in homeostasis to Line 3, had a lower equation value, which was reflected in its inferior performance at the RCB trials of the following season.
Two unappreciated sources of genetic variation exist within elite cultivars [20]. The first stems from the negative correlation between yielding and competitive ability, which leads to a gradual cultivar degradation because of the gradual proliferation of low yielding-strong competing plants (yC) at the expense of high yielding-weak competing plants (Yc). This happens during the standard process of cultivar reproduction under dense stand [15,41]. The second overlooked source is the one produced by the interaction between genotype and environment, since the genome is capable of releasing adaptive variation by triggering off genetic or epigenetic mechanisms in response to environmental changes [27,28,29,30,31,32,33,34,35,36]. All the above justify the application of nonstop selection on the basis of Equation A to exploit this seemingly endlessly released variation for breeding purposes. In this way, the crop yield genetic potential of Celia, instead of remaining at the level of 12 Equation units, could have steadily increased above the 49 units of Line 3.
Table 2 ranks the top 30 of 868 cotton plants of the replicated R-31 honeycomb design on the basis of their unique and unitless Equation A values ranging from 36 to 65 units. Importantly, only four lines (5, 3, 16, and 6) are represented in the top 15 plants. These four lines are those with the highest CH values in Table 1, testifying again to the significance of selecting for the genetic component of stability of performance with reliable selection tools. Apparently, Equation A can be a more sensitive indicator during selection, as its resolution range is larger than the ranges of CH and PYI.
Table 2. Ranking of the top 15 plants of the replicated R-31 honeycomb design based on their Equation A values. Only four of the 31 lines (i.e., 5, 3, 16, and 6) are represented in the top 15 plants.
Line no. of top plantsEquation A ValuesCH Agriculture 02 00211 i015PYI Agriculture 02 00211 i016
36520.83.13
55523.72.31
35520.82.66
35520.82.62
65116.33.17
54923.72.04
54623.71.96
164620.32.28
164020.31.96
53923.71.63
33720.81.80
53623.71.53
53623.71.51
53623.71.51
163620.31.77
Table 3 shows the results of a Randomized Complete Block trial in 2006, designed to verify under standard crop stands the identified differences among the top selected lines in the honeycomb trials. Mixtures of five plants from each of the top six lines were formed and compared to the original cultivar. Line 5, possessing the highest CH value, indicating higher stability of yield potential, significantly outyielded the original cultivar by 18.5%.
To further validate this superiority, a second RCB trial was grown in 2007 with six replicates and three treatments, i.e., Line-5 and Line-3 along with the original cultivar. Table 4 shows that Line 5 consistently and significantly outyielded the control with a superiority of 21.6% during the second testing season. Thus, the average across-year superiority of Line 5 over the original cultivar corresponds to a 20%.
Table 3. Results of the Randomized Complete Block (RCB) trial in 2006. Seedcotton yield (t/ha) in the four replicates together with the mean yield per line and the gain compared to the control.
Line code no.Replicates
IIIIIIIVMeanGain
56.586.506.826.706.65 a118.5
36.605.506.905.806.18 ab110.2
166.245.826.505.265.96 ab106.2
196.605.504.705.745.64 b100.5
Original cultivar5.845.106.105.405.61 b100.0
15.266.105.704.605.42 b96.6
65.385.165.305.805.41 b96.4
CV = 9%, LSD0.05 = 0.78
Table 4. Results of the RCB trial in 2007. Seedcotton yield (t/ha) in the six replicates together with the mean yield per line and the gain compared to the control.
Line code no.Replicates
IIIIIIIVVVIMeanGain
55.885.385.885.506.757.006.07 a121.6
34.634.885.634.385.005.885.07 b101.6
Original cultivar5.204.375.255.004.885.254.99 b100.0
CV = 7.4%, LSD0.05 = 0.56
This percentage acquires further significance compared to the commonly recorded 1% annual genetic gain in earlier and recent literature for crops like barley, oats, wheat, soybean, cotton, rice, potato, and even maize [4,6,45,46,47,48,49,50,51,52,53,54]. Its significance increases even more considering the reality of climate change, affecting differentially various areas in the globe, and the necessity to effectively keep up with its accelerating genetic progress.
The results point to some important inferences with wider significance for breeding programs: The potential genetic variation for productivity and stability within cultivars seems to be large and inexhaustible, but goes undetected without the appropriate resolving tools. In order to effectively exploit this variation, avoid degeneration, and secure constant genetic gain, the nonstop intracultivar selection emerges as an essential process. The new selection and whole-plant field phenotyping equations offer unique properties for predicting the crop yield and stability of individual plants. This also involves the nonstop exploitation and incorporation of genes for resistance to biotic and abiotic stresses, permitting to effectively face pathogen selection pressure.

3.2. Intra-Cultivar Selection for Yield and Resistance to Cotton Verticillium Wilt

In the second set of experimental data, the application of the honeycomb selection for three consecutive years within Sindos-80 led to the development of the experimental variety Macedonia, which outyielded Sindos-80 by an average of 10% when tested at sixteen locations across Greece in standard RCB trials for two additional years [55]. Although the variety Macedonia was developed using very high selection pressures (1.5%), its progeny lines retained the ability to further generate high genetic diversity. This was evident when honeycomb selection for yield potential per plant was simultaneously applied for one year in a site heavily infected with Verticillium and in a non-infected field. The process allowed the isolation of two lines with similar degree of Verticillium resistance as the resistant controls Acala S.J.5 and S.J.2. The two lines outyielded all controls (Acala S.J.5 and S.J.2, Macedonia, and Sindos-80) in both contrasting environments. In particular, they outyielded the more resistant Acala control (Acala S.J.5) by 140% in the non-infected field and by 40% in the infected field. The original mother variety, Sindos-80, is susceptible to Verticillium wilt, while Macedonia exhibited resistance similar to that of the Acala S.J.2. Importantly, the one year of selection in the infected site also revealed the existence of two low-yielding lines within the variety Macedonia, whose yield per plant was inferior to Acalas by 65%. These lines were even more susceptible to Verticillium than the original mother variety Sindos-80.

4. Experimental Section

4.1. Intra-Cultivar Selection for Yield Stability and Crop Yield Potential

In this set of experiments, the material used for applying selection was a leading, elite cotton cultivar, Celia. The study lasted four years, the first two were devoted to single-plant and progeny line selection within Celia and the subsequent two to the implementation of standard Randomized Complete Block (RCB) trials to assess the efficiency of selection in comparison to the original cultivar. All trials were grown at the Farm of the Aristotelian University at Thessalonica [56] under standard agronomic practices for the region and appropriate weed management.
First growing season-2004: Seven cotton cultivars, coded from 1 to 7, were grown in a replicated-7 honeycomb trial [Figure 1, code 13] with 133 plant positions per cultivar and 100 cm plant-to-plant spacing to exclude interplant competition. Seedcotton from all plants was picked up individually, weighed, and the individual plant seedcotton yields were transformed into unitless values based on the Plant Yield Index component of Equation A. Thirty plants from cultivar coded 3, i.e., Celia, were selected and advanced to the next year’s trials.
Second growing season-2005: Thirty progeny lines belonging to the 30 plants obtained after intracultivar selection and the original cultivar as control, were grown in a replicated-31 honeycomb trial [Figure 2, codes 1 to 31, 13] with 28 plant positions per line, for a total of 868 plants spaced at 100 cm. Using the selection equations and a selection pressure of 3.2%, seed was saved from the six superior lines in order to compose the material for the RCB trial of the following year.
Third growing season-2006: The selected six progeny lines, together with the original cultivar were tested in RCB trial of 3-row plots, 5 meters long, replicated four times in order to assess the genetic gain under standard crop stands. Plots were overseeded to be thinned later to 12 plants per m2. Only the central row was harvested.
Fourth growing season-2007: The two best lines in the RCB trial of the previous year, i.e., Lines 3 and 5, together with the control cultivar, were tested in a new RCB trial replicated six times to assess consistency of performance during a second year. Plots were overseeded to be thinned later to 12 plants per m2. Only the central row was harvested.

4.2. Intra-Cultivar Selection for Yield and Resistance to Cotton Verticillium Wilt

The second set of experiments concern selection for yield within the prevalence for many years in Greece cotton cultivar Sindos-80. Yield selection on a single-plant basis was combined with concurrent selection for resistance to Verticillium wilt. The experimental procedure is described in [55]. Because of its overall significance, it is summarized here and the link to this concept article is outlined.
Intra-cultivar honeycomb selection was applied within Sindos-80 for three years leading to the development of the experimental variety Macedonia. Further honeycomb selection within Macedonia was applied for one year simultaneously in two contrasting environments, in a field heavily infected with cotton Verticillium wilt and in an infection-free site, using 150 × 150 cm plant spacing to exclude the masking effect of interplant competition. During the next year, a total of forty five (45) progeny lines originating from both selection environments, along with four controls (Acala S.J.5 and S.J.2, Macedonia, and Sindos-80), were grown in two environments, a heavily infected and a non-infected field.

5. Conclusions

This concept paper focuses on a new approach that can be used effectively during the early or later generations of a breeding program and, notably, in a nonstop manner to secure the continuous adaptation of cultivars to their target environments. The homeostasis or yield stability of a cultivar is a genetically controlled trait that can be selected for without sacrificing higher yields, and it is essential to bridge the gap between actual and potential yields, particularly in resource-poor farming areas. The concept of Coefficient of Homeostasis incorporates tolerance to a multitude of biotic and abiotic stresses, including the stress of higher planting densities. Genotypes that possess improved homeostasis are better able to exploit randomly distributed environmental resources (e.g., in rainfed agriculture where erratic rainfalls can nevertheless sustain production), and respond better to even limited amounts of fertilizers or chemical interventions for plant protection.
Importantly for the resource-poor farming areas, the new Equation A permits unbiased selection for high and stable yield on a single plant basis, a concept that leads to the creation of density-neutral cultivars. The denser the seeding rates in low-input agriculture, the higher the possibility that many plants in the crop stand will not make it to the end of their cycle to produce seeds because of the intense competition for resources within the stand. However, a genotype with improved homeostasis is capable of satisfactory production even under low seeding rates, thus, exploiting limited resources in a most efficient manner. Cultivars that are density-neutral have the capacity to fully exploit lower planting densities, maintaining high crop yields at lower seeding rates. This implies that farmers in resource-limiting environments can achieve high crop yields using a wider density range. An advantage that enables to avoid reseeding in the case of not-satisfactory stands and most importantly, to effectively exploit drought-prone fields using lower seeding rates. It is envisioned that the crop performance of the varieties of the future will be density-independent.
Of particular interest also is that the superiority of genotypes selected in the absence of interplant competition is linked to their ability to develop deep and extensive root systems and exhibit fast early germination and growth [16]. These properties enable plants to better withstand drought conditions and suffer less from weeds by covering the field before emergence and establishment of the weed majority.
In light of the growing evidence about the frequency, importance, and heritable nature of adaptive variation as a result of the genotype by environment (GE) interaction, the process of nonstop selection emerges as a key step to capture the plasticity of the genome and exploit this untapped, yet big reservoir of yield increasing potential. Even without considering the harsh reality of climate change, target environments are in a constant, often unpredictable, flux, and cultivated genotypes should be given the opportunity to keep up with adapting to their ever-changing microenvironments. The evidence is strong that the annual genetic gain from implementation of nonstop intracultivar selection can be larger compared to the average 1% annual genetic gain reported by most conventional programs [4,6,45,46,47,48,49,50,51,52,53,54]. As selection on a single plant basis is rather inefficient with conventional methods, the unique properties of the new equations can increase the efficiency of selection facing the confounding effects of competition, soil heterogeneity, heterozygosity, and GE interaction on single plant yields, while exploiting the constantly released adaptive variation. The outlined concepts demonstrate also a new dimension in breeding methodology, where the critical role of the environment is fully recognized and exploited during the selection process, since field selections based on the values of the two equations, bypass the subjective visual human evaluation, even during the earliest segregating generations. Further, the equations are very appropriate for accurately phenotyping whole plants under real field conditions, bridging the gap between molecular-genomic and phenotypic data.
Overall, three essential, yet unappreciated reasons for the observed gaps between actual and potential crop yield, concern reduced stability of performance that should have been incorporated during the early segregating stages of cultivar creation through appropriate breeding methodology, any prevalence of big genetic or acquired differences in the crop stand that increases the CV of individual plant yield, and failure to practice nonstop selection after the release of cultivar to avoid degeneration and incorporate useful adaptive (genetic or epigenetic) de novo variation.

Acknowledgments

The author gratefully acknowledges stimulating discussions with Apostolos C. Fasoulas, Aristotelian University, Greece, which contributed to the final form of the manuscript.

References

  1. Lobell, D.B.; Cassman, K.G.; Field, C.B. Crop yield gaps: Their importance, magnitudes, and causes. Annu. Rev. Environ. Resour. 2009, 34, 179–204. [Google Scholar] [CrossRef]
  2. Licker, R.; Johnston, M.; Foley, J.A.; Barford, C.; Kucharik, C.J.; Monfreda, C.; Ramankutty, N. Mind the gap: How do climate and agricultural management explain the “yield gap” of croplands around the world? Glob. Ecol. Biogeogr. 2010, 19, 769–782. [Google Scholar] [CrossRef]
  3. Edmeades, G.; Fisher, T.; Byerlee, D. Can We Feed the World in 2050? Food Security from Sustainable Agriculture, Proceedings of the 15th ASA Conference, Lincoln, New Zealand, 15–19 November 2010. 2010. Available online: http://www.regional.org.au/au/asa/2010/plenary/climate-change/7384_edmeades.htm (accessed on 31 August 2012).
  4. Fok, A.C.M. Cotton yield stagnation: Addressing a Common Effect of Various Causes. In New Frontiers in Cotton Research, Proceedings of the 2nd World Cotton Research Conference, Athens, Greece, 6–12 September 1998; Gillham, F.M., Ed.; Petridis: Thessaloniki, Greece, 2000; pp. 38–45. [Google Scholar]
  5. Peltonen-Sainio, P.; Jauhiainen, L.; Laurila, I.P. Cereal yield trends in northern European conditions: Changes in yield potential and its realization. Field Crop. Res. 2009, 110, 85–90. [Google Scholar] [CrossRef]
  6. Graybosch, R.A.; Peterson, C.J. Genetic improvement in winter wheat yields in the great plains of North America, 1959-2008. Crop Sci. 2010, 50, 1882–1890. [Google Scholar] [CrossRef]
  7. Brisson, N.; Gate, P.; Gouache, D.; Charmet, G.; Oury, F.X.; Huard, F. Why are wheat yields stagnating in Europe? A comprehensive data analysis for France. Field Crop. Res. 2010, 119, 201–212. [Google Scholar] [CrossRef]
  8. Gregory, P.J.; George, T.S. Feeding nine billion: The challenge to sustainable crop production. J. Exp. Bot. 2011, 62, 5233–5239. [Google Scholar] [CrossRef]
  9. Gornall, J.; Betts, R.; Burke, E.; Clark, R.; Camp, J.; Willett, K.; Wiltshire, A. Implications of climate change for agricultural productivity in the early twenty-first century. Philos. Trans. R. Soc. B 2010, 365, 2973–2989. [Google Scholar]
  10. Jaggard, K.W.; Qi, A.; Ober, E.S. Possible changes to arable crop yields by 2050. Philos. Trans. R. Soc. B 2010, 365, 2835–2851. [Google Scholar]
  11. Luck, J.; Spackman, M.; Freeman, A.; Tre˛bicki, P.; Griffiths, W.; Finlay, K.; Chakraborty, S. Climate Change and Diseases of Food Crops. Plant Pathol. 2011, 60, 113–121. [Google Scholar] [CrossRef]
  12. Tester, M.; Langridge, P. Breeding technologies to increase crop production in a changing world. Science 2010, 327, 818–822. [Google Scholar] [CrossRef]
  13. Fasoulas, A.C.; Fasoula, V.A. Honeycomb selection designs. Plant Breed. Rev. 1995, 13, 87–139. [Google Scholar]
  14. Kyriakou, D.T.; Fasoulas, A.C. Effects of competition and selection pressure on yield response in winter rye (Secale cereale L.). Euphytica 1985, 34, 833–895. [Google Scholar] [CrossRef]
  15. Fasoula, D.A. Correlations between auto-, all-, and nil-competition and their implications in plant breeding. Euphytica 1990, 50, 57–62. [Google Scholar] [CrossRef]
  16. Fasoula, D.A.; Fasoula, V.A. Competitive ability and plant breeding. Plant Breed. Rev. 1997, 14, 89–138. [Google Scholar]
  17. Janick, J. Exploitation of heterosis: Uniformity and stability. In The Genetics and Exploitation of Heterosis in Crops; ASA-CSSA-SSA: Madison, WI, USA, 1999; pp. 319–333. [Google Scholar]
  18. Tollenaar, M.; Wu, J. Yield improvement in temperate maize is attributable to greater stress tolerance. Crop Sci. 1999, 39, 1597–1604. [Google Scholar] [CrossRef]
  19. Fasoula, V.A.; Fasoula, D.A. Honeycomb breeding: Principles and applications. Plant Breed. Rev. 2000, 18, 177–250. [Google Scholar]
  20. Fasoula, V.A.; Fasoula, D.A. Principles underlying genetic improvement for high and stable crop yield potential. Field Crop. Res. 2002, 75, 191–209. [Google Scholar] [CrossRef]
  21. Tokatlidis, I.S.; Koutsika-Sotiriou, M.; Fasoulas, A.C. The development of density-independent hybrids in maize. Maydica 2001, 46, 21–25. [Google Scholar]
  22. Yan, W.; Wallace, D.H. Breeding for negatively associated traits. Plant Breed. Rev. 1995, 13, 141–177. [Google Scholar]
  23. Mauromoustakos, A.; Fasoula, V.A.; Thompson, K. Honeycomb Designs Computing and Analysis. In Proceedings of International Biometric Society: Eastern North American Region, Tampa, FL, USA, 26-29 March 2006.
  24. Fasoula, V.A. A novel equation paves the way for an everlasting revolution with cultivars characterized by high and stable crop yield and quality. In Proceedings of the 11th National Hellenic Conference in Genetics and Plant Breeding, Orestiada, Greece, 31 October-2 November 2006.
  25. Fasoula, V.A. Two Novel Whole-Plant Field Phenotyping Equations Maximize Selection Efficiency. In Modern Variety Breeding for Present and Future Needs, Proceedings of the 18th Eucarpia General Congress, Valencia, Spain, 9–12 September 2008; Prohens, J., Badenes, M., Eds.; Editorial Universidad Politecnica de Valencia: Valencia, Spain, 2008; pp. 361–365. [Google Scholar]
  26. Fasoula, V.A. Selection of High Yielding Plants Belonging to Entries of High Homeostasis Maximizes Efficiency in Maize Breeding. In Proceedings of the XXI International Eucarpia Conference in Maize and Sorghum Breeding in the Genomics Era, Bergamo, Italy, 21-24 June 2009.
  27. McClintock, B. The significance of the responses of the genome to challenge. Science 1984, 226, 792–801. [Google Scholar]
  28. Rasmusson, D.C.; Phillips, R.L. Plant breeding progress and genetic diversity from de novo variation and elevated epistasis. Crop Sci. 1997, 37, 303–310. [Google Scholar] [CrossRef]
  29. Stokes, T.L.; Kunkel, B.N.; Richards, E.J. Epigenetic variation in Arabidopsis disease resistance. Genes Dev. 2002, 16, 171–182. [Google Scholar] [CrossRef]
  30. Lolle, S.; Victor, J.L.; Young, J.M.; Pruitt, R.E. Genome-wide non-mendelian inheritance of extra-genomic information in Arabidopsis. Nature 2005, 434, 505–509. [Google Scholar] [CrossRef]
  31. Grant-Downton, R.T.; Dickinson, H.G. Epigenetics and its implications for plant biology 2. The “Epigenetic Epiphany”: Epigenetics, evolution and beyond. Ann. Bot. 2006, 97, 11–27. [Google Scholar] [CrossRef]
  32. Richards, E.J. Inherited epigenetic variation-revisiting soft inheritance. Nat. Rev. Genet. 2006, 7, 395–401. [Google Scholar] [CrossRef]
  33. Boyko, A.; Kovalchuk, I. Epigenetic control of plant stress response. Environ. Mol. Mutagen. 2007, 49, 61–72. [Google Scholar]
  34. King, G.J.; Amoah, S.; Kurup, S. Exploring and exploiting epigenetic variation in crops. Genome 2010, 53, 856–868. [Google Scholar] [CrossRef]
  35. Zhang, M.; Kimatu, J.N.; Xu, K.; Liu, B. DNA cytosine methylation in plant development. J. Genet. Genomics 2010, 37, 1–12. [Google Scholar] [CrossRef]
  36. Hauser, M.T.; Aufsatz, W.; Jonak, C.; Luschnig, C. Transgenerational epigenetic inheritance in plants. Biochim. Biophys. Acta 1809, 459–468. [Google Scholar]
  37. Dworkin, I. Canalization, cryptic variation, and developmental buffering: A critical examination and analytical perspective, 2005. Available online: https://www.msu.edu/idworkin/publications/Dworkin%20Book%20chapter%208in%20VARIATIOn.pdf (accessed on 31 August 2012).
  38. Ronnegard, L.; Valdar, W. Detecting major genetic loci controlling phenotypic variability in experimental crosses. Genetics 2011, 188, 435–447. [Google Scholar] [CrossRef]
  39. Fasoula, V.A.; Boerma, H.R. Divergent selection at ultra-low plant density for seed protein and oil content within soybean cultivars. Field Crop. Res. 2005, 91, 217–229. [Google Scholar] [CrossRef]
  40. Fasoula, V.A.; Boerma, H.R. Intra-cultivar variation for seed weight and other agronomic traits within three elite soybean cultivars. Crop Sci. 2007, 47, 367–373. [Google Scholar] [CrossRef]
  41. Fasoula, D.A. An overlooked source of seed degradation and its implications in the efficient exploitation of plant genetic resources. Plant Genet. Resour. 2011, 9, 321–323. [Google Scholar] [CrossRef]
  42. Yates, J.L.; Boerma, H.R.; Fasoula, V.A. SSR-marker analysis of the intracultivar phenotypic variation discovered within 3 soybean cultivars. J. Hered. 2012. [Google Scholar] [CrossRef]
  43. Falconer, D.S. Introduction to Quantitative Genetics; John Wiley and Sons: New York, NY, USA, 1989. [Google Scholar]
  44. Fasoula, D.A. Accurate whole-plant phenotyping: An important component for successful marker assisted selection (MAS). In Genetic variation for Plant Breeding, Proceedings of 17th EUCARPIA General Congress, Tulln, Austria, 8–11 September 2004; Vollmann, J., Grausgruber, H., Ruckenbauer, P., Eds.; BOKU-University of Natural Resources and Applied Life Sciences: Vienna, Austria, 2004; pp. 203–206. [Google Scholar]
  45. Wych, R.D.; Rasmusson, D.C. Genetic improvement in malting barley cultivars since 1920. Crop Sci. 1983, 23, 1037–1040. [Google Scholar]
  46. Wych, R.D.; Stuthman, D.D. Genetic improvement in Minnesota-adapted oat cultivars released since 1923. Crop Sci. 1983, 23, 879–881. [Google Scholar] [CrossRef]
  47. Duvick, D.N. Genetic Contributions to Yield Gains of US Hybrid Maize, 1930-1980. In Genetic Contributions to Yield Gains of Five Major Crop Plants; Fehr, W.R., Ed.; Crop Science Society of America, American Society of Agronomy: Madison, WI, USA, 1984; pp. 15–47. [Google Scholar]
  48. Meredith, W.R.; Bridge, R.R. Genetic Contributions to Yield Changes in Upland Cotton. In Genetic Contributions to Yield Gains of Five Major Crop Plants; Fehr, W.R., Ed.; Crop Science Society of America, American Society of Agronomy: Madison, WI, USA, 1984; pp. 75–87. [Google Scholar]
  49. Schmidt, J.W. Genetic Contributions to Yield Gains in Wheat. In Genetic Contributions to Yield Gains of Five Major Crop Plants; Fehr, W.R., Ed.; Crop Science Society of America, American Society of Agronomy: Madison, WI, USA, 1984; pp. 89–101. [Google Scholar]
  50. Waddington, S.R.; Ransom, J.K.; Osmanzai, M.; Saunders, D.A. Improvement in the yield potential of bread wheat adapted to Northwest Mexico. Crop Sci. 1986, 26, 698–703. [Google Scholar] [CrossRef]
  51. Feil, B. Breeding progress in small grain cereals-A comparison of old and modern cultivars. Plant Breed. 1992, 108, 1–11. [Google Scholar] [CrossRef]
  52. Douches, D.S.; Maas, D.; Jastrzebski, K.; Chase, R.W. Assessment of potato breeding progress in the USA over the last century. Crop Sci. 1996, 36, 1544–1552. [Google Scholar]
  53. Rajaram, S. Approaches for breaching yield stagnation in wheat. Genome 1999, 42, 629–634. [Google Scholar] [CrossRef]
  54. Peng, S.; Cassman, K.G.; Virmani, S.S.; Sheehy, J.; Khush, G.S. Yield potential trends of tropical rice since the release of IR8 and the challenge of increasing rice yield potential. Crop Sci. 1999, 39, 1552–1559. [Google Scholar]
  55. Fasoulas, A.C.; Thessaloniki, P. Building up Resistance to Verticillium Wilt in Cotton through Honeycomb Breeding. In New Frontiers in Cotton Research, Proceedings of the 2nd World Cotton Research Conference, Athens, Greece, 6–12 September 1998; Gillham, F.M., Ed.; Petridis Publishers: Thessaloniki, Greece, 2000; pp. 120–124. [Google Scholar]
  56. Fasoula, D.A.; Lithourgidis, A. Selection within Cotton Cultivars (Gossypium hirsutum L.) under the Hellenic Climatic Conditions Maximizes Crop Yield. In Proceedings of the 12th National Hellenic Conference in Genetics and Plant Breeding, Naousa, Greece, 8-10 October 2008; pp. 51–55.

