Pyrolysis Kinetics of Physical Components of Wood and Wood-Polymers Using Isoconversion Method

Abstract
:1. Introduction
2. Experimental Procedures

 ) and “n” is the order of the reaction:


3. Results and Discussion
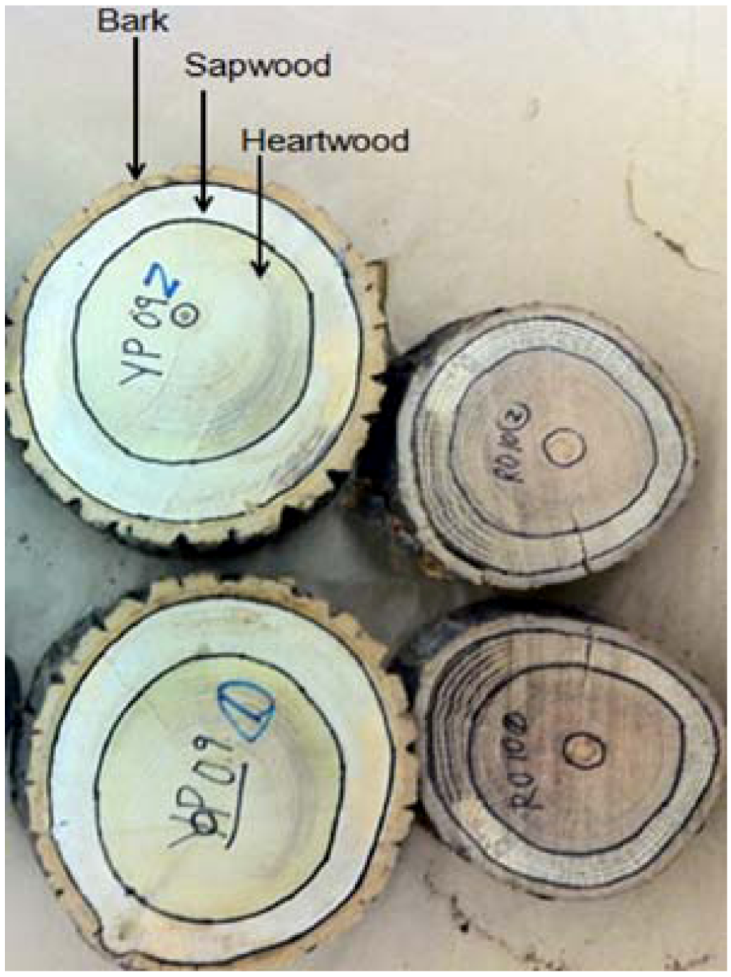
3.1. Feedstock Characterization

| Property | Calorific value (MJ/kg) | Cell wall specific gravity | |
|---|---|---|---|
| Red oak | Bark | 18.86 ± 0.44 | 1.69 ± 0.07 |
| Sapwood | 18.78 ± 0.51 | 1.85 ± 0.18 | |
| Heartwood | 18.38 ± 0.36 | 1.79 ± 0.12 | |
| Yellow-poplar | Bark | 19.54 ± 1.02 | 1.74 ± 0.16 |
| Sapwood | 18.81 ± 0.88 | 1.85 ± 0.14 | |
| Heartwood | 18.65 ± 0.86 | 1.92 ± 0.25 | |
| Wood polymers | Cellulose | - * | 1.27 |
| Xylan | - * | 1.53 | |
| Lignin | 25.79 ± 0.09 | 1.25 | |
| Property | Carbon (%) | Hydrogen (%) | Nitrogen (%) | Sulfur (%) | |
|---|---|---|---|---|---|
| Red oak | Bark | 47.52 ± 1.44 | 5.86 ± 0.25 | 0.56 ± 0.00 | 0.24 ± 0.02 |
| Sapwood | 46.62 ± 0.08 | 5.89 ± 0.01 | 0.26 ± 0.01 | 0.18 ± 0.04 | |
| Heartwood | 46.97 ± 0.21 | 5.87 ± 0.01 | 0.07 ± 0.01 | 0.16 ± 0.01 | |
| Yellow-poplar | Bark | 48.16 ± 0.50 | 5.93 ± 0.04 | 0.76 ± 0.02 | 0.18 ± 0.06 |
| Sapwood | 47.05 ± 0.06 | 5.96 ± 0.01 | 0.21 ± 0.03 | 0.21 ± 0.01 | |
| Heartwood | 47.53 ± 0.30 | 5.93 ± 0.06 | 0.13 ± 0.01 | 0.21 ± 0.01 | |
| Wood polymers | Cellulose | 42.00 ± 0.04 | 6.24 ± 0.06 | 0.99 ± 0.07 | 0.67 ± 0.04 |
| Xylan | 40.14 ± 0.42 | 6.65 ± 0.04 | 0.51 ± 0.09 | 0.64 ± 0.00 | |
| Lignin | 61.68 ± 0.01 | 5.85 ± 0.02 | 1.29 ± 0.10 | 2.06 ± 0.02 | |
| Sample | Red oak | Yellow-poplar | ||||
|---|---|---|---|---|---|---|
| Bark | Sapwood | Heartwood | Bark | Sapwood | Heartwood | |
| Phosphorus | 408 | 127 | <60 | 257 | <60 | <60 |
| Potassium | 3282 | 1875 | 684 | 1977 | 798 | 826 |
| Calcium | 11670 | 450 | 63 | 8530 | 482 | 1016 |
| Magnesium | 601 | 536 | 241 | 668 | 319 | 429 |
| Manganese | 1690 | 309 | 93 | 1415 | 272 | 364 |
| Iron | 109 | 107 | 54 | 105 | 56 | 51 |
| Aluminum | 78 | 14 | 5 | 248 | 22 | 19 |
| Copper | 2.9 | 2.6 | 1.8 | 5.6 | 1.7 | 1.5 |
| Zinc | 13.3 | 5.2 | 6.3 | 13.0 | 5.4 | 5.1 |
| Sodium | 40 | 18 | 58 | 23 | 34 | 19 |
| Property | Moisture (%) | Ash (%) | Volatile (%) | Fixed Carbon (%) | |
|---|---|---|---|---|---|
| Red oak | Bark | 6.94 ± 0.06 | 3.08 ± 0.52 | 77.50 ± 1.20 | 19.43 ± 1.73 |
| Sapwood | 0.42 ± 0.01 | 0.36 ± 0.00 | 81.58 ± 0.02 | 18.07 ± 0.02 | |
| Heartwood | 6.16 ± 0.04 | 0.13 ± 0.01 | 81.84 ± 0.08 | 18.05 ± 0.09 | |
| Yellow-poplar | Bark | 7.53 ± 0.04 | 2.24 ± 0.04 | 77.22 ± 0.17 | 20.55 ± 0.13 |
| Sapwood | 6.76 ± 0.00 | 0.48 ± 0.02 | 83.53 ± 0.20 | 16.00 ± 0.22 | |
| Heartwood | 6.75 ± 0.01 | 0.50 ± 0.02 | 83.60 ± 0.21 | 15.91 ± 0.19 | |
| Wood polymers | Cellulose | 5.29 ± 0.00 | 0.00 ± 0.05 | 87.47 ± 0.17 | 12.56 ± 0.12 |
| Xylan | 0.00 ± 0.01 | 0.00 ± 0.00 | 98.38 ± 0.12 | 1.66 ± 0.13 | |
| Lignin | 3.03 ± 0.01 | 2.19 ± 0.08 | 61.10 ± 0.28 | 36.71 ± 0.37 | |

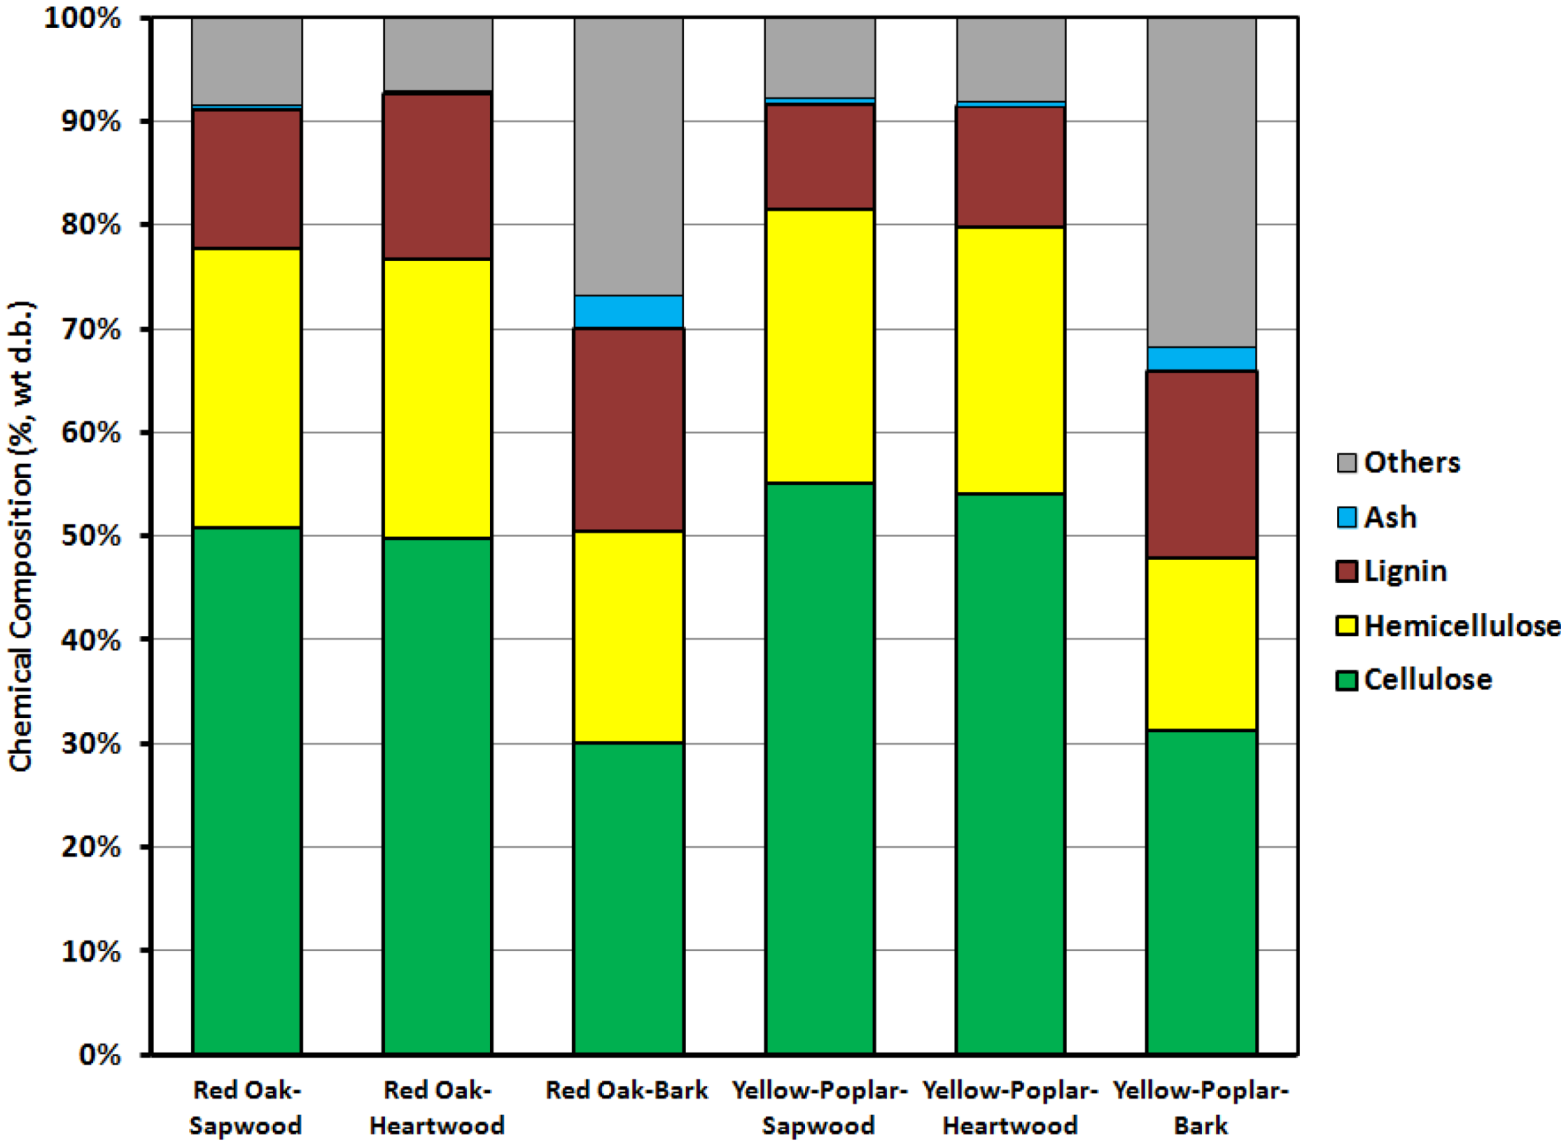
| Property | Cellulose (%) | Hemicellulose (%) | Lignin (%) | Others (%) | |
|---|---|---|---|---|---|
| Red oak | Bark | 30.02 | 20.45 | 19.58 | 26.87 |
| Sapwood | 50.87 | 26.86 | 13.38 | 8.52 | |
| Heartwood | 49.82 | 26.90 | 15.97 | 7.18 | |
| Yellow-poplar | Bark | 31.54 | 16.73 | 17.98 | 31.82 |
| Sapwood | 55.07 | 26.46 | 10.17 | 7.83 | |
| Heartwood | 54.08 | 25.74 | 11.61 | 8.07 | |
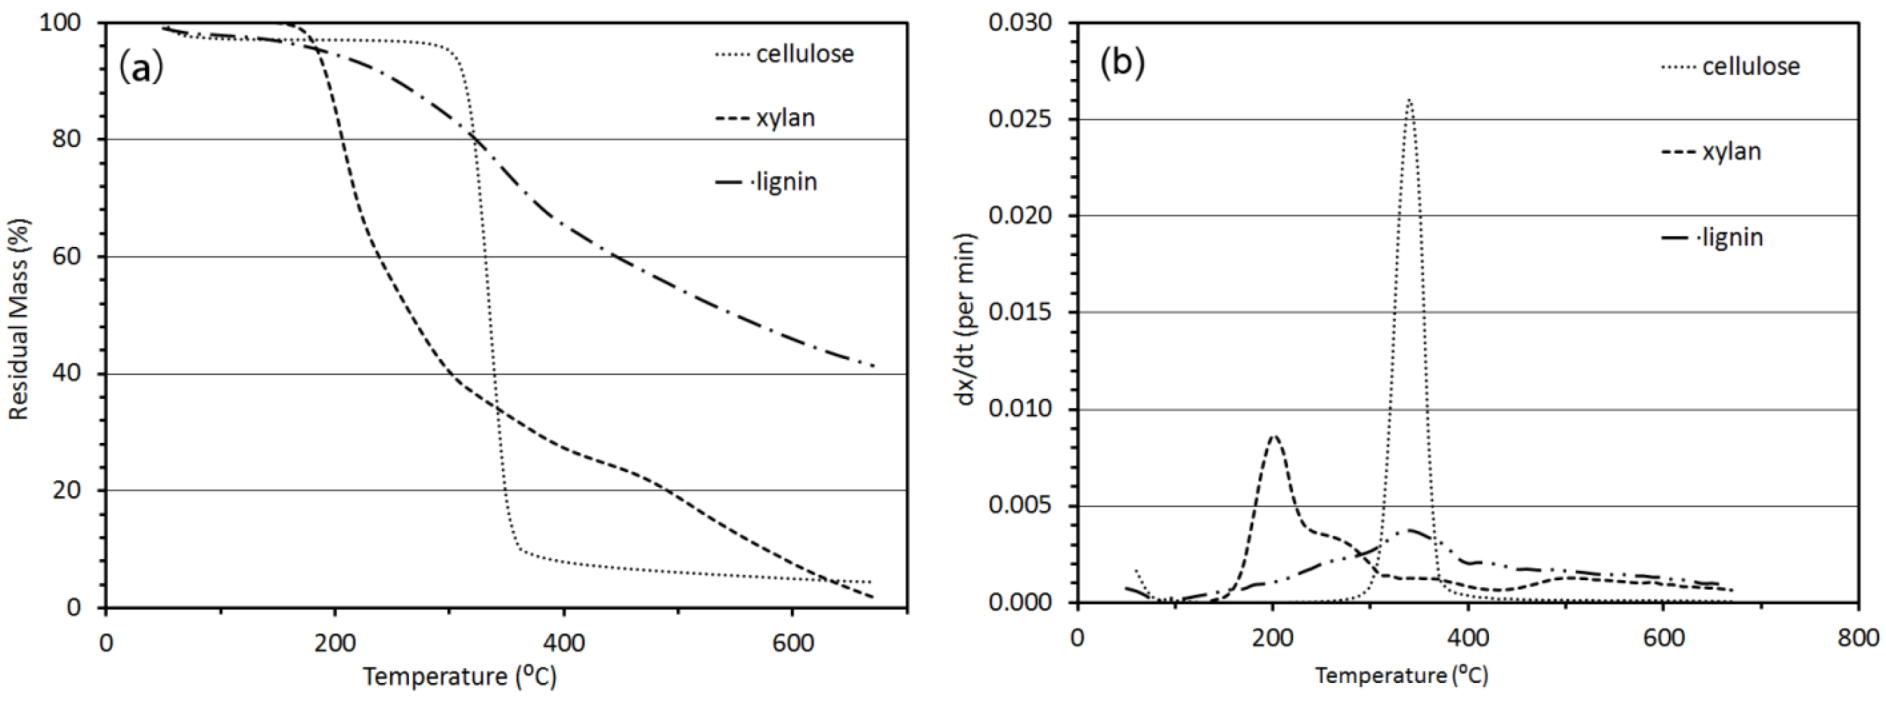
3.2. Thermo-Chemical Decomposition Behavior of Cellulose, Xylan and Lignin
3.2.1. Thermogravimetric Analysis

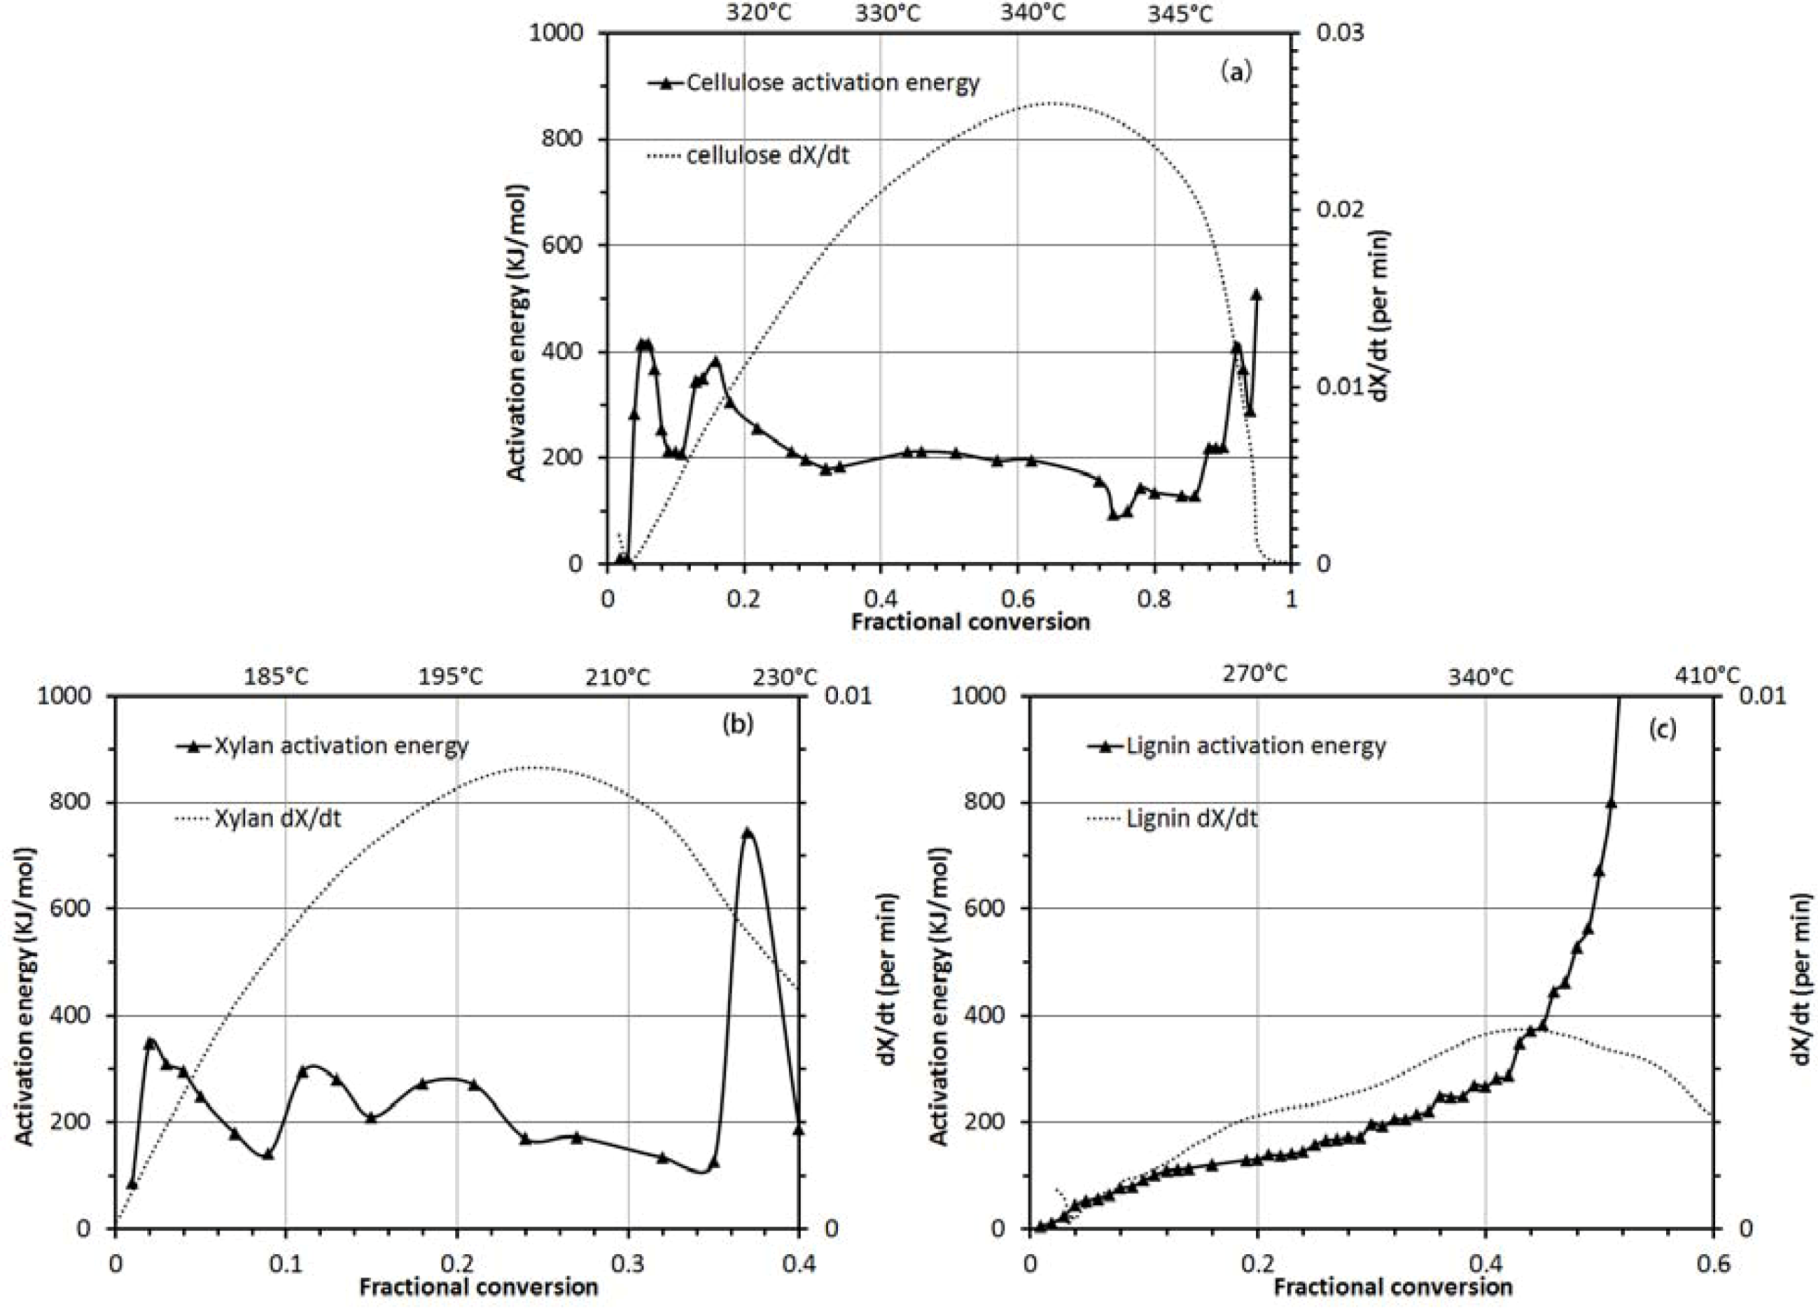
3.2.2. Activation Energy Analysis

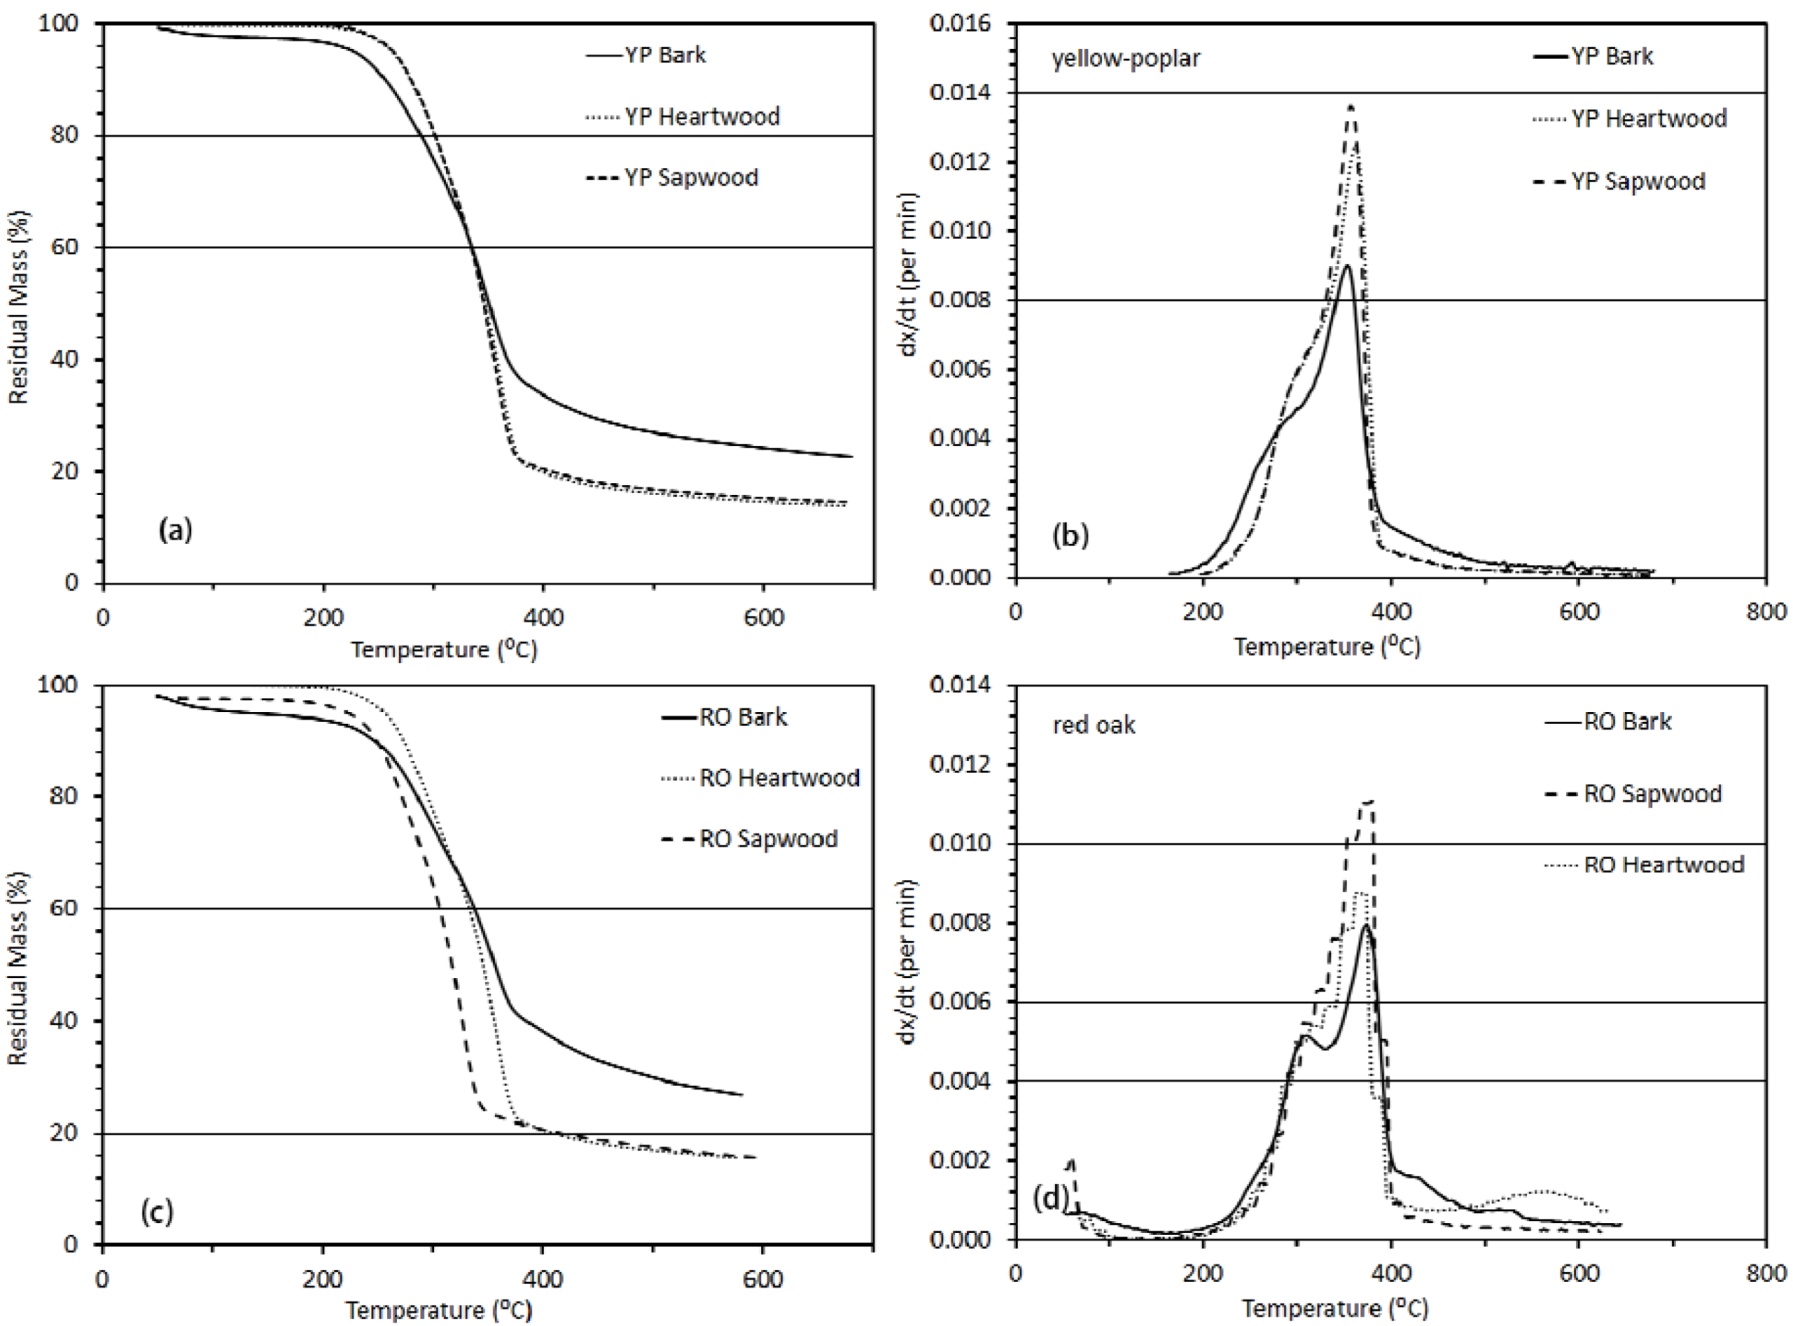
3.3. Thermo-Chemical Decomposition Behavior of Wood Components
3.3.1. Thermogravimetric Analysis

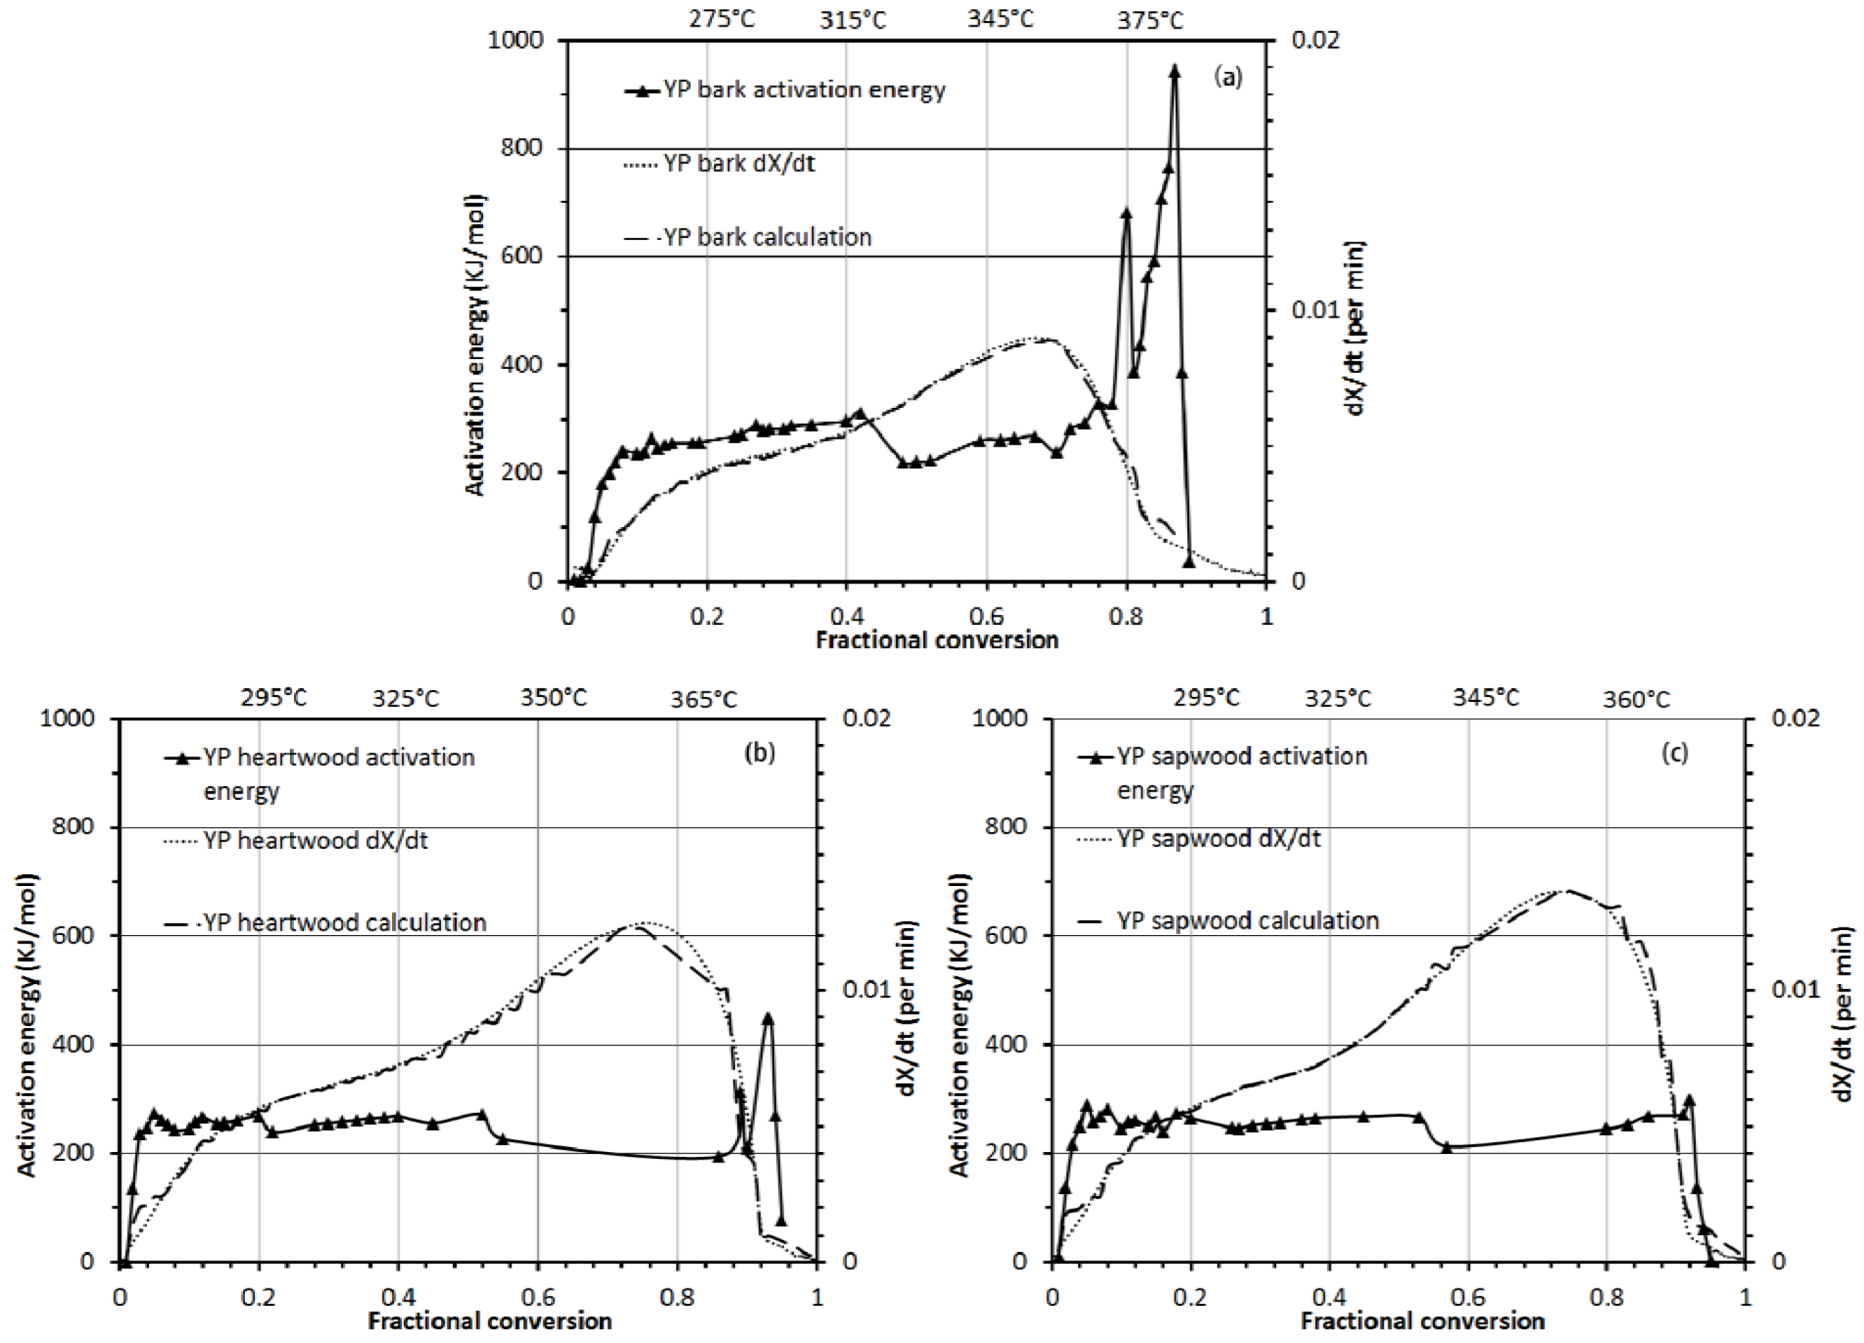
3.3.2. Activation Energy Analysis

4. Conclusions
Acknowledgments
References
- Demirbas, A. Potential applications of renewable energy sources, biomass combustion problems in boiler power systems and combustion related environmental issues. Prog. Energy Combust. Sci. 2005, 31, 171–192. [Google Scholar] [CrossRef]
- Biagini, E.; Barontini, F.; Tognotti, L. Devolatilization of biomass fuels and biomass components studied by TG/FTIR technique. Ind. Eng. Chem. Res. 2006, 45, 4486–4493. [Google Scholar] [CrossRef]
- Lifecycle Greenhouse Gas Emissions Due to Increased Biofuel Production; ICF International: Fairfax, VA, USA, 2009. Available online: http://epa.gov/oms/renewablefuels/rfs2-peer-review-model.pdf (accessed on 9 January 2013).
- Nitschke, C.R.; Innes, J.L. Integrating climate change into forest management in south-central British Columbia: An assessment of landscape vulnerability and development of a climate-smart framework. For. Ecol. Manag. 2008, 256, 313–327. [Google Scholar] [CrossRef]
- Sharma, N.; Rowe, R. Managing the world’s forests. Financ. Dev. 1992, 29, 31. [Google Scholar]
- Annual Energy Outlook 2012; Technical Report DOE/EIA-0383(2012) for EIA: Washington, DC, USA, 2012.
- U.S. Billion-Ton Update: Biomass Supply for a Bioenergy and Bioproducts Industry; Technical Report for U.S. Department of Energy: Oak Ridge, TN, USA, 2011.
- Balat, M. Biomass energy and biochemical conversion processing for fuels and chemicals. Energy Sources Part A Recovery Util. Environ. Eff. 2006, 28, 517–525. [Google Scholar]
- McKendry, P. Energy production from biomass (part 2): Conversion technologies. Bioresour.Technol. 2002, 83, 47–54. [Google Scholar] [CrossRef]
- Panwar, N.L.; Kothari, R.; Tyagi, V.V. Thermo chemical conversion of biomass—Eco friendly energy routes. Renew. Sustain. Energy Rev. 2012, 16, 1801–1816. [Google Scholar] [CrossRef]
- Demirbaş, A. Biomass resource facilities and biomass conversion processing for fuels and chemicals. Energy Convers. Manag. 2001, 42, 1357–1378. [Google Scholar] [CrossRef]
- Balat, M.; Balat, M.; Kırtay, E.; Balat, H. Main routes for the thermo-conversion of biomass into fuels and chemicals. Part 1: Pyrolysis systems. Energy Convers. Manag. 2009, 50, 3147–3157. [Google Scholar]
- Raveendran, K.; Ganesh, A.; Khilar, K.C. Pyrolysis characteristics of biomass and biomass components. Fuel 1996, 75, 987–998. [Google Scholar] [CrossRef]
- Mohan, D.; Pittman, C.U.; Steele, P.H. Pyrolysis of wood/biomass for bio-oil: A critical review. Energy Fuels 2006, 20, 848–889. [Google Scholar] [CrossRef]
- Yaman, S. Pyrolysis of biomass to produce fuels and chemical feedstocks. Energy Convers. Manag. 2004, 45, 651–671. [Google Scholar] [CrossRef]
- Antal, M.J., Jr.; Grønli, M. The art, science, and technology of charcoal production. Ind. Eng. Chem. Res 2003, 42, 1619–1640. [Google Scholar] [CrossRef]
- Beall, F.C.; Eickner, H.W. Thermal Degradation of Wood Components: A Review of the Literature; U.S. Forest Products Laboratory: Madison, WI, USA, 1970. [Google Scholar]
- Gaur, S.; Reed, T.B. Thermal Data for Natural and Synthetic Fuels; Marcel Decker, Inc.: New York, NY, USA, 1998. [Google Scholar]
- Slopiecka, K.; Bartocci, P.; Fantozzi, F. Thermogravimetric analysis and kinetic study of poplar wood pyrolysis. Appl. Energy 2012, 97, 491–497. [Google Scholar] [CrossRef]
- Herrera, A.; Soria, S.; de Araya, C. A kinetic study on the thermal decomposition of six hardwood species. Eur. J. Wood Wood Prod. 1986, 44, 357–360. [Google Scholar] [CrossRef]
- Kim, S.-S.; Jeon, J.-K.; Park, Y.-K.; Kim, S. Thermal pyrolysis of fresh and waste fishing nets. Waste Manag. 2005, 25, 811–817. [Google Scholar]
- Kim, S.-S.; Kim, S. Pyrolysis characteristics of polystyrene and polypropylene in a stirred batch reactor. Chem. Eng. J. 2004, 98, 53–60. [Google Scholar] [CrossRef]
- ASAE Standards S269.4. In Cubes, Pellets, and Crumbles—Definitions and Methods for Determining Density, Durability, and Moisture Content; ASAE: St. Joseph, MI, USA, 1998.
- ASTM Committee on Standards. In Standard Test Method for Gross Calorific Value of Coal and Coke; Standard No. ASTM D5865-98a; The American Society for Tesing and Materials: West Conshohocken, PA, USA, 1998.
- ASTM Committee on Standards. In Standard Test Method for Ash in the Analysis Sample of Coal and Coke from Coal; Standard No. ASTM D3174-12; The American Society for Tesing and Materials: West Conshohocken, PA, USA, 2011.
- Kim, S.-S.; Agblevor, F.A. Pyrolysis characteristics and kinetics of chicken litter. Waste Manag. 2007, 27, 135–140. [Google Scholar] [CrossRef]
- Corder, S.E. Properties and uses of bark as an energy source. In Proceedings of the XVI IUFRO World Congress, Oslo, Norway, 20 June–2 July 1976.
- Adebayo, A.; Wang, J.; Dawson-Andoh, B.; McNeel, J.; Armstrong, J. Assessment of Appalachian hardwood residue properties and potentials for bioenergy utilization. Wood Fiber Sci. 2009, 41, 74–83. [Google Scholar]
- Vincent, J.F. From cellulose to cell. J. Exp. Biol. 1999, 202, 3263–3268. [Google Scholar]
- Miller, R.S.; Bellan, J. Analysis of reaction products and convertion time in the pyrolysis of cellulose and wood particles. Combust. Sci. Technol. 1996, 119, 331–373. [Google Scholar] [CrossRef]
- Fengel, D.; Wegener, G. Wood Chemistry, Ultrastructure, Reactions; Walter de Gruyter: Berlin, Germany, 1984. [Google Scholar]
- Wright, M.M.; Daugaard, D.E.; Satrio, J.A.; Brown, R.C. Techno-economic analysis of biomass fast pyrolysis to transportation fuels. Fuel 2010, 89, S2–S10. [Google Scholar] [CrossRef]
- Xu, C.; Lad, N. Production of heavy oils with high caloric values by direct liquefaction of woody biomass in sub/near-critical water. Energy Fuels 2007, 22, 635–642. [Google Scholar]
- Raveendran, K.; Ganesh, A.; Khilar, K.C. Influence of mineral matter on biomass pyrolysis characteristics. Fuel 1995, 74, 1812–1822. [Google Scholar] [CrossRef]
- Yang, H.; Yan, R.; Chen, H.; Zheng, C.; Lee, D.H.; Liang, D.T. Influence of mineral matter on pyrolysis of palm oil wastes. Combust. Flame 2006, 146, 605–611. [Google Scholar] [CrossRef]
- Ren, Q.; Zhao, C.; Wu, X.; Liang, C.; Chen, X.; Shen, J.; Tang, G.; Wang, Z. Effect of mineral matter on the formation of nox precursors during biomass pyrolysis. J. Anal. Appl. Pyrolysis 2009, 85, 447–453. [Google Scholar] [CrossRef]
- Demirbaş, A. Calculation of higher heating values of biomass fuels. Fuel 1997, 76, 431–434. [Google Scholar] [CrossRef]
- Adebayo, A.B. Pretreatments and Energy Potentials of Appalachian Hardwood Residues for Biofuel Production. Ph.D. Thesis, West Virginia University, Morgantown, WV, USA, 2010. [Google Scholar]
- Usia, M.; Kara, S. The chemical composition of wood and bark of Cedrus libani A. Rich. Eur. J. Wood Wood Prod. 1997, 55, 268–268. [Google Scholar] [CrossRef]
- Schowalter, T.D.; Zhang, Y.L.; Sabin, T.E. Decomposition and nutrient dynamics of oak Quercus spp. logs after five years of decomposition. Ecography 1998, 21, 3–10. [Google Scholar] [CrossRef]
- Yang, H.; Yan, R.; Chen, H.; Lee, D.H.; Zheng, C. Characteristics of hemicellulose, cellulose and lignin pyrolysis. Fuel 2007, 86, 1781–1788. [Google Scholar] [CrossRef]
- Liu, Q.; Zhong, Z.; Wang, S.; Luo, Z. Interactions of biomass components during pyrolysis: A TG-FTIR study. J. Anal. Appl. Pyrolysis 2011, 90, 213–218. [Google Scholar] [CrossRef]
- Qu, T.; Guo, W.; Shen, L.; Xiao, J.; Zhao, K. Experimental study of biomass pyrolysis based on three major components: Hemicellulose, cellulose, and lignin. Ind. Eng. Chem. Res. 2011, 50, 10424–10433. [Google Scholar] [CrossRef]
- Jeon, M.-J.; Jeon, J.-K.; Suh, D.J.; Park, S.H.; Sa, Y.J.; Joo, S.H.; Park, Y.-K. Catalytic pyrolysis of biomass components over mesoporous catalysts using PY-GC/MS. Catal. Today 2012, in press. [Google Scholar]
- Yang, H.; Yan, R.; Chen, H.; Zheng, C.; Lee, D.H.; Liang, D.T. In-depth investigation of biomass pyrolysis based on three major components: Hemicellulose, cellulose and lignin. Energy Fuels 2005, 20, 388–393. [Google Scholar]
- Bradbury, A.G.W.; Sakai, Y.; Shafizadeh, F. A kinetic model for pyrolysis of cellulose. J. Appl. Polym. Sci. 1979, 23, 3271–3280. [Google Scholar] [CrossRef]
- Chen, W.-H.; Kuo, P.-C. Isothermal torrefaction kinetics of hemicellulose, cellulose, lignin and xylan using thermogravimetric analysis. Energy 2011, 36, 6451–6460. [Google Scholar] [CrossRef]
- Alvarez, V.A.; Vázquez, A. Thermal degradation of cellulose derivatives/starch blends and sisal fibre biocomposites. Polym. Degrad. Stab. 2004, 84, 13–21. [Google Scholar] [CrossRef]
- Ramiah, M.V. Thermogravimetric and differential thermal analysis of cellulose, hemicellulose, and lignin. J. Appl. Polym. Sci. 1970, 14, 1323–1337. [Google Scholar] [CrossRef]
- Murugan, P.; Mahinpey, N.; Johnson, K.E.; Wilson, M. Kinetics of the pyrolysis of lignin using thermogravimetric and differential scanning calorimetry methods. Energy Fuels 2008, 22, 2720–2724. [Google Scholar] [CrossRef]
- Mirzaee, E.; Rafiee, S.; Keyhani, A.; Emam-Djomeh, Z. Determining of moisture diffusivity and activation energy in drying of apricots. Res. Agric. Eng. 2009, 55, 114–120. [Google Scholar]
- Singh, K.; Zondlo, J.W.; Wang, J.; Sivanandan, L.; Brar, J.S. Influence of environmental decomposition of logging residues on fuel properties. Biol. Eng. Trans. 2012, 5, 163–176. [Google Scholar]
- Beall, F. Thermogravimetric analysis of wood lignin and hemicelluloses. Wood. Fiber Sci. 1969, 1, 215–226. [Google Scholar]
© 2013 by the authors; licensee MDPI, Basel, Switzerland. This article is an open-access article distributed under the terms and conditions of the Creative Commons Attribution license (http://creativecommons.org/licenses/by/3.0/).
Share and Cite
Jin, W.; Singh, K.; Zondlo, J. Pyrolysis Kinetics of Physical Components of Wood and Wood-Polymers Using Isoconversion Method. Agriculture 2013, 3, 12-32. https://doi.org/10.3390/agriculture3010012
Jin W, Singh K, Zondlo J. Pyrolysis Kinetics of Physical Components of Wood and Wood-Polymers Using Isoconversion Method. Agriculture. 2013; 3(1):12-32. https://doi.org/10.3390/agriculture3010012
Chicago/Turabian StyleJin, Wenjia, Kaushlendra Singh, and John Zondlo. 2013. "Pyrolysis Kinetics of Physical Components of Wood and Wood-Polymers Using Isoconversion Method" Agriculture 3, no. 1: 12-32. https://doi.org/10.3390/agriculture3010012