Article

Rapid Development of Microsatellite Markers for Plantago ovata Forsk.: Using Next Generation Sequencing and Their Cross-Species Transferability

1
Department of Agriculture Biotechnology, Anand Agricultural University, Anand-388 110, India
2
Department of Animal Biotechnology, College of Veterinary Science and Animal Husbandry, Anand Agricultural University, Anand, Gujarat 388 001, India
*
Author to whom correspondence should be addressed.
Agriculture 2014, 4(2), 199-216; https://doi.org/10.3390/agriculture4020199
Submission received: 7 February 2014 / Revised: 6 May 2014 / Accepted: 6 June 2014 / Published: 20 June 2014

Abstract

:
Isabgol (Plantago ovata Forsk.) is an important medicinal plant having high pharmacological activity in its seed husk, which is substantially used in the food, beverages and packaging industries. Nevertheless, isabgol lags behind in research, particularly for genomic resources, like molecular markers, genetic maps, etc. Presently, molecular markers can be easily developed through next generation sequencing technologies, more efficiently, cost effectively and in less time than ever before. This study was framed keeping in view the need to develop molecular markers for this economically important crop by employing a microsatellite enrichment protocol using a next generation sequencing platform (ion torrent PGM™) to obtain simple sequence repeats (SSRs) for Plantago ovata for the very first time. A total of 3447 contigs were assembled, which contained 249 SSRs. Thirty seven loci were randomly selected for primer development; of which, 30 loci were successfully amplified. The developed microsatellite markers showed the amplification of the expected size and cross-amplification in another six species of Plantago. The SSR markers were unable to show polymorphism within P. ovata, suggesting that low variability exists within genotypes of P. ovata. This study suggests that PGM™ sequencing is a rapid and cost-effective tool for developing SSR markers for non-model species, and the markers so-observed could be useful in the molecular breeding of P. ovata.

1. Introduction

Plantago ovata Forsk. (2n = 2x = 8), commonly known as Isabgol and blond psyllium, is an important medicinal plant of the family, Plantaginaceae [1]. The seeds are rich in secondary metabolites and contain mucilage, fatty oil, large quantities of albuminous matter, the pharmacologically inactive glucoside viz. aucubin and a plantiose sugar [2]. The husk constitutes 25%–30% (by weight) of the total seed yield and is the most economical part. Their husk has the property of absorbing and retaining water, which accounts for its utility in stopping diarrhea. It is a diuretic, alleviates kidney and bladder complaints, gonorrhea, arthritis and hemorrhoids [3,4]. It is used in food industries for high fiber breakfast cereals. The by-products of dehusking, rich in starch and fatty acids, are used as cattle and pig feed in India. It is also used to prevent ice slipping in factories. Isabgol is a major export-oriented medicinal crop in India [5]. Globally, India is the largest producer, as well as exporter of husk worth more than Rs 25 million annually. From the total production of husk in Gujarat province, 75% is exported.
In spite of its immense medicinal and export value, the productivity of isabgol is under the constraints of biotic and abiotic stress, causing heavy losses in seed/husk quality and yield. Moreover, due to limited genetic resources, the efforts for generating genetic variability for its improvement are met with limited success [6]. Furthermore, being an introduced crop to India from the Mediterranean region, the variability for economically important traits in the available gene pool is very narrow [7,8]. With this low variability, different breeding methods, namely selection, hybridization, induced mutations, polyploidy and tissue culture, have been used for the genetic improvement of isabgol [2,7,9,10,11,12]. However, isabgol varieties released through selection so far in India hardly show any phenotypic variations and, hence, are similar in their yield potential. Likewise, the results of other methods of improvement have also not been encouraging.
Plantago ovata has about 200 wild allies, some of which are medicinally important. These wild species are a reservoir of important genes, which if introgressed to cultivated species through marker-assisted breeding could revolutionize the production of isabgol [13]. There are few reports on exploitation of randomly amplified polymorphic DNA (RAPD) [14,15,16] and combined RAPD and inter-simple sequence repeat (ISSR) [17,18,19] markers in assessing genetic diversity in isabgol. Equally, a very small number of microsatellite markers are available for other species of Plantago viz. P. major, P. lanceolata, P. coronopus and P. intermedia [17,20,21,22]. However, no simple sequence repeat (SSR) markers are available for P. ovata. Therefore, researchers are unable exploit the variability available in the secondary gene pool of this crop. Consequently, this industrially important, but resource poor, crop needs attention in terms of developing genetic markers. Microsatellite or simple sequence repeat (SSR) markers, provide a good source for genetic analysis, as proven previously by many researchers [23]. Limited SSR markers with low cross-species transferability are available for Plantago species, but none have been developed so far for Plantago ovata. Microsatellites can either be newly developed, especially for a species having limited genomic information, or can be mined from the sequence repositories available in public databases. Various methods are available for microsatellite development, and most of them employ the targeted enrichment of DNA for microsatellites [24]. The recent development of library enrichment techniques, coupled with second-generation sequencing, has made the development of these markers simple, rapid and cost effective. The semiconductor Ion Torrent Personal Genome sequencer carries out sequencing by synthesis (SBS) by sensing the release of hydrogen ions as part of the base incorporation process [25]. The deployment of such a sequencing-based approach drastically reduces the cost of sequencing and can be used to develop molecular markers.
Through the present study, an attempt was made to generate genomic resources in terms of microsatellite markers for Plantago ovata by combining a microsatellite enrichment method with high throughput sequencing along with evaluation of cross-species amplification of the derived markers.

2. Material and Methods

2.1. Germplasm Collection and DNA Extraction

A total of 12 genotypes, which included six commercially grown varieties of Plantago ovata, and one genotype each from six allied species of P. ovata were used in the present study (Table 1). The genotypes were grown in a polyhouse, and young expanding leaves were harvested for DNA isolation. DNA was isolated by the CTAB method [26], checked for quality on 0.8% agarose gel and quantified using Nanodrop (Thermo Scientific, Wilmington, DE, USA). DNA was diluted to a working concentration of 20 ng/μL with Tris-EDTA buffer and used for PCR amplification.
Table 1. List of Plantago genotypes.
Serial No.SpeciesGenotypesCharacteristics/Features
1Plantago ovataGI-3High yielding, susceptible to downy mildew, aphids, seed shattering
GI-2Susceptible to downy mildew, aphids, seed shattering
RI-89-
DPO13Early maturing mutant
DPO14Early maturing mutant with desirable traits, such as high seed yield, early and uniform seed maturation and high harvest index.
EC124345Resistant to downy mildew; line from Pakistan
2Plantago arneria-Resistant to downy mildew, aphids
3Plantago coronopus-Resistant to downy mildew, aphids, seed shattering
4Plantago psyllium--
5Plantago indica-Resistant to downy mildew, aphids, seed shattering
6Plantago serraria--
7Plantago lanceolata-Resistant to downy mildew, aphids, frost, drought

2.2. Ion Torrent PGM™ Library Preparation, Enrichment of SSR and Sequencing

The whole genome sequencing (WGS) library was prepared from 1 μg DNA of elite isabgol variety, GI-3 (Gujarat Isabgol-3), following the manufacturer’s protocol (Life Technologies, Invitrogen Division, Darmstadt, Germany) to obtain a mean size of 200 bp. Microsatellite enrichment was performed by hybridizing the genomic DNA library (1:1) with custom designed 5′ biotinylated di- and tri-nucleotide repeat SSR probes (MWG, Eurofins) (Supplementary file). Hybridization was performed in 2× hybridization buffer containing 10× SSPE, 10× Denhardt’s, 10 mm EDTA and 0.2% SDS [27] for 24 h at 65 °C followed by enrichment of captured SSR repeats using streptavidin beads (Quiagen, Germany). Captured sequences were eluted and purified using melt solution (100 mm NaOH) and a PCR purification kit following the manufacturer’s protocol (Quiagen, Venlo, Limburg, Netherlands). The microsatellite enriched or captured library was further amplified for eight cycles using primers complementary to the P1 and A adaptors used for library preparation. An amplified enriched library was purified by Ampure XP beads (Beckman Coulter, Brea, CA, USA) and quantified by an Agilent 2100 bioanalyzer high sensitivity chip (Agilent Technologies, Palo Alto, CA, USA). The SSR captured library was diluted to 26 pM for emulsion PCR to get a 18-μL volume of diluted library, and amplification solution (nuclease-free water, 5× PCR Reagent mix, 10× PCR Enzyme Mix and Ion Sphere™ Particles) was added and amplified in a thermal cycler according to the manufacturer’s instructions. The Ion Sphere™ particles were recovered and enriched using the Ion Xpress Template Kit (Part #4467389 Rev. B), according to the manufacturer’s protocol. Ion sphere particles (ISPs) enrichment was confirmed using the Qubit 2.0 fluorometer (Life Technologies, Invitrogen division, Darmstadt, Germany). The sample ISPs were loaded on an Ion 318 chip and sequenced on the Ion Torrent PGM™ for 500 flows/125 cycles.
The sequencing data was obtained in FASTQ format, which was extracted in the form of FASTA files and subjected further to assembly. Adaptor, poly-A tail trimming and quality filtering (threshold quality score = 20) was performed using the software, DNASTAR. Contigs were assembled using the SeqMan NGen 4.0.0 software package (DNASTAR, Madison, WI, USA) specifying a match spacing of 20 nucleotides and a minimum match percentage of 90%.

2.3. Searching for SSR-Containing Sequences and Primer Design

SSRs were mined from the sequence assembly using the Perl-based Microsatellite (MISA) search module [28,29], which is capable of identifying perfect, as well as compound SSRs. The criteria used for the identification of SSRs included a minimum of six repeats for di-(NN) and four repeats for tri-nucleotide (NNN) [30]. Two SSRs separated by a maximum of 100 nucleotide bases were considered as part of a compound SSR. The design of primer pairs for SSRs was done by using Primer3 [31] with default parameters. The primer designing conditions were: 50–60 °C melting temperature, 40%–60% GC content and 18–24 bp primer length. Other parameters were at the default setting of Primer3. The designed primers were further checked for desired characteristics, like hairpin structure, primer dimer using the online Scitool, Oligoanalyzer, Integrated DNA Technologies [32]. The newly developed SSR primers were named with the prefix APOM (Anand Plantago ovata microsatellites) and synthesized from First Base, Germany.

2.4. Validation and Cross-Species Amplification of SSR Markers

To validate and assess the transferability of the newly identified SSRs, a total of 37 microsatellites were randomly selected. These 37 SSRs were first used to assess polymorphism in Plantago ovata. PCR amplification was carried out in a 10-μL volume containing 5 μL DreamTaq Green PCR Master Mix (2×) (Thermo Scientific/Fermentas, India), 3 μL nuclease free water, 0.5 μL primer pairs (10 pmol each) and 1 μL template DNA (20 ng/μL). Thermal amplification was carried out in a Thermal Cycler (Eppendorf Vapo Protect, Hamburg, Germany) by using the following conditions; initial denaturation at 94 °C for four min, 35 cycles of denaturation at 94 °C for 30 s, annealing temperature ranging between 48–60 °C for 45 s, extension at 72 °C for one min and final extension at 72 °C for seven min. The amplified products of SSR were analyzed using 2.5% agarose gel. The separated amplicons were visualized under a UV transilluminator and photographed using the BioRad Gel Documentation system. The primers showing amplification in P. ovata were selected for cross-species amplification with the same conditions as described for P. ovata.

2.5. Characteristics of Microsatellites, SSR Marker Scoring and Data Analysis

The microsatellites were classified depending upon the length of the SSR as Class I (≥20 nucleotides (nts)) and Class II (≥10 but <20 nts), the number of nucleotides per repeat unit viz. di- and tri-nucleotide repeats and the arrangement of nucleotides in the repeat motifs viz. perfect repeats, imperfect repeats and compound repeats.
The amplicon profiles of SSR markers generated in Plantago ovata and the six allied species were scored manually as present (1) or absent (0) for each of the SSR loci. Coefficients of similarity were calculated by using Jaccard’s similarity coefficient by the SIMQUAL function, and cluster analysis was performed by the agglomerative technique using the UPGMA (un-weighted pair group method with arithmetic mean) method by the SAHN clustering function of NTSYS-pc 2.2 [33]. Relationships between the Plantago species were graphically represented in the form of a dendrogram. The polymorphism information content (PIC) values were calculated according to the following formula: PIC = 1 − Σ Pi2, where Pi is the frequency of the ith allele [34].

3. Results and Discussion

3.1. Sequencing by Ion Torrent PGM™

The construction and screening of partial genomic libraries and the sequencing of SSR-positive clones are considered effective methods for microsatellite development [35]. However, these approaches are expensive and labor-intensive processes. Therefore, SSR development through enrichment protocols and next generation sequencing turns out to be more desirable over other methods; being fast and efficient [36]. In particular, the discovery and development of simple sequence repeats (SSRs or microsatellites) is straightforward using NGS technologies [37]. Ongoing improvement in the read lengths of the NGS platforms will reduce the disadvantage of the current short read lengths, particularly for the PGM platform, allowing greater flexibility in primer design coupled with the power of a larger number of sequences. Recently, Elliott et al., 2013 [38] reported that PGM sequencing produced more sequences and a higher number of unique microsatellite sequences than GSFLX sequencing for two gymnosperms and one angiosperm species. In the present study, with the targeted enrichment of DNA for microsatellites development, a total of 176.64 Mb of data and nine, 30 and 940 quality reads were obtained in a single sequencing run from the genomic DNA of P. ovata with an average read length of 190 bp (Table 2). A total of 249 microsatellites were identified from 3447 contigs, and 37 were randomly used for primer designing. The enrichment procedure thus proved to be an efficient way of generating a large number of SSR loci. The contig sequences are provided as a separate Supplementary file.
Table 2. Summary of PGM™ sequencing and assembly.
SequencingReads930,940
Total bases (bp)176,641,378
Average read length (bp)190
Highest read length (bp)324
AssemblyNo. of contigs3,447
Assembled sequence257,993
Unassembled sequences672,947
Contig N50 (bases)1,346
Average lengths contigs659

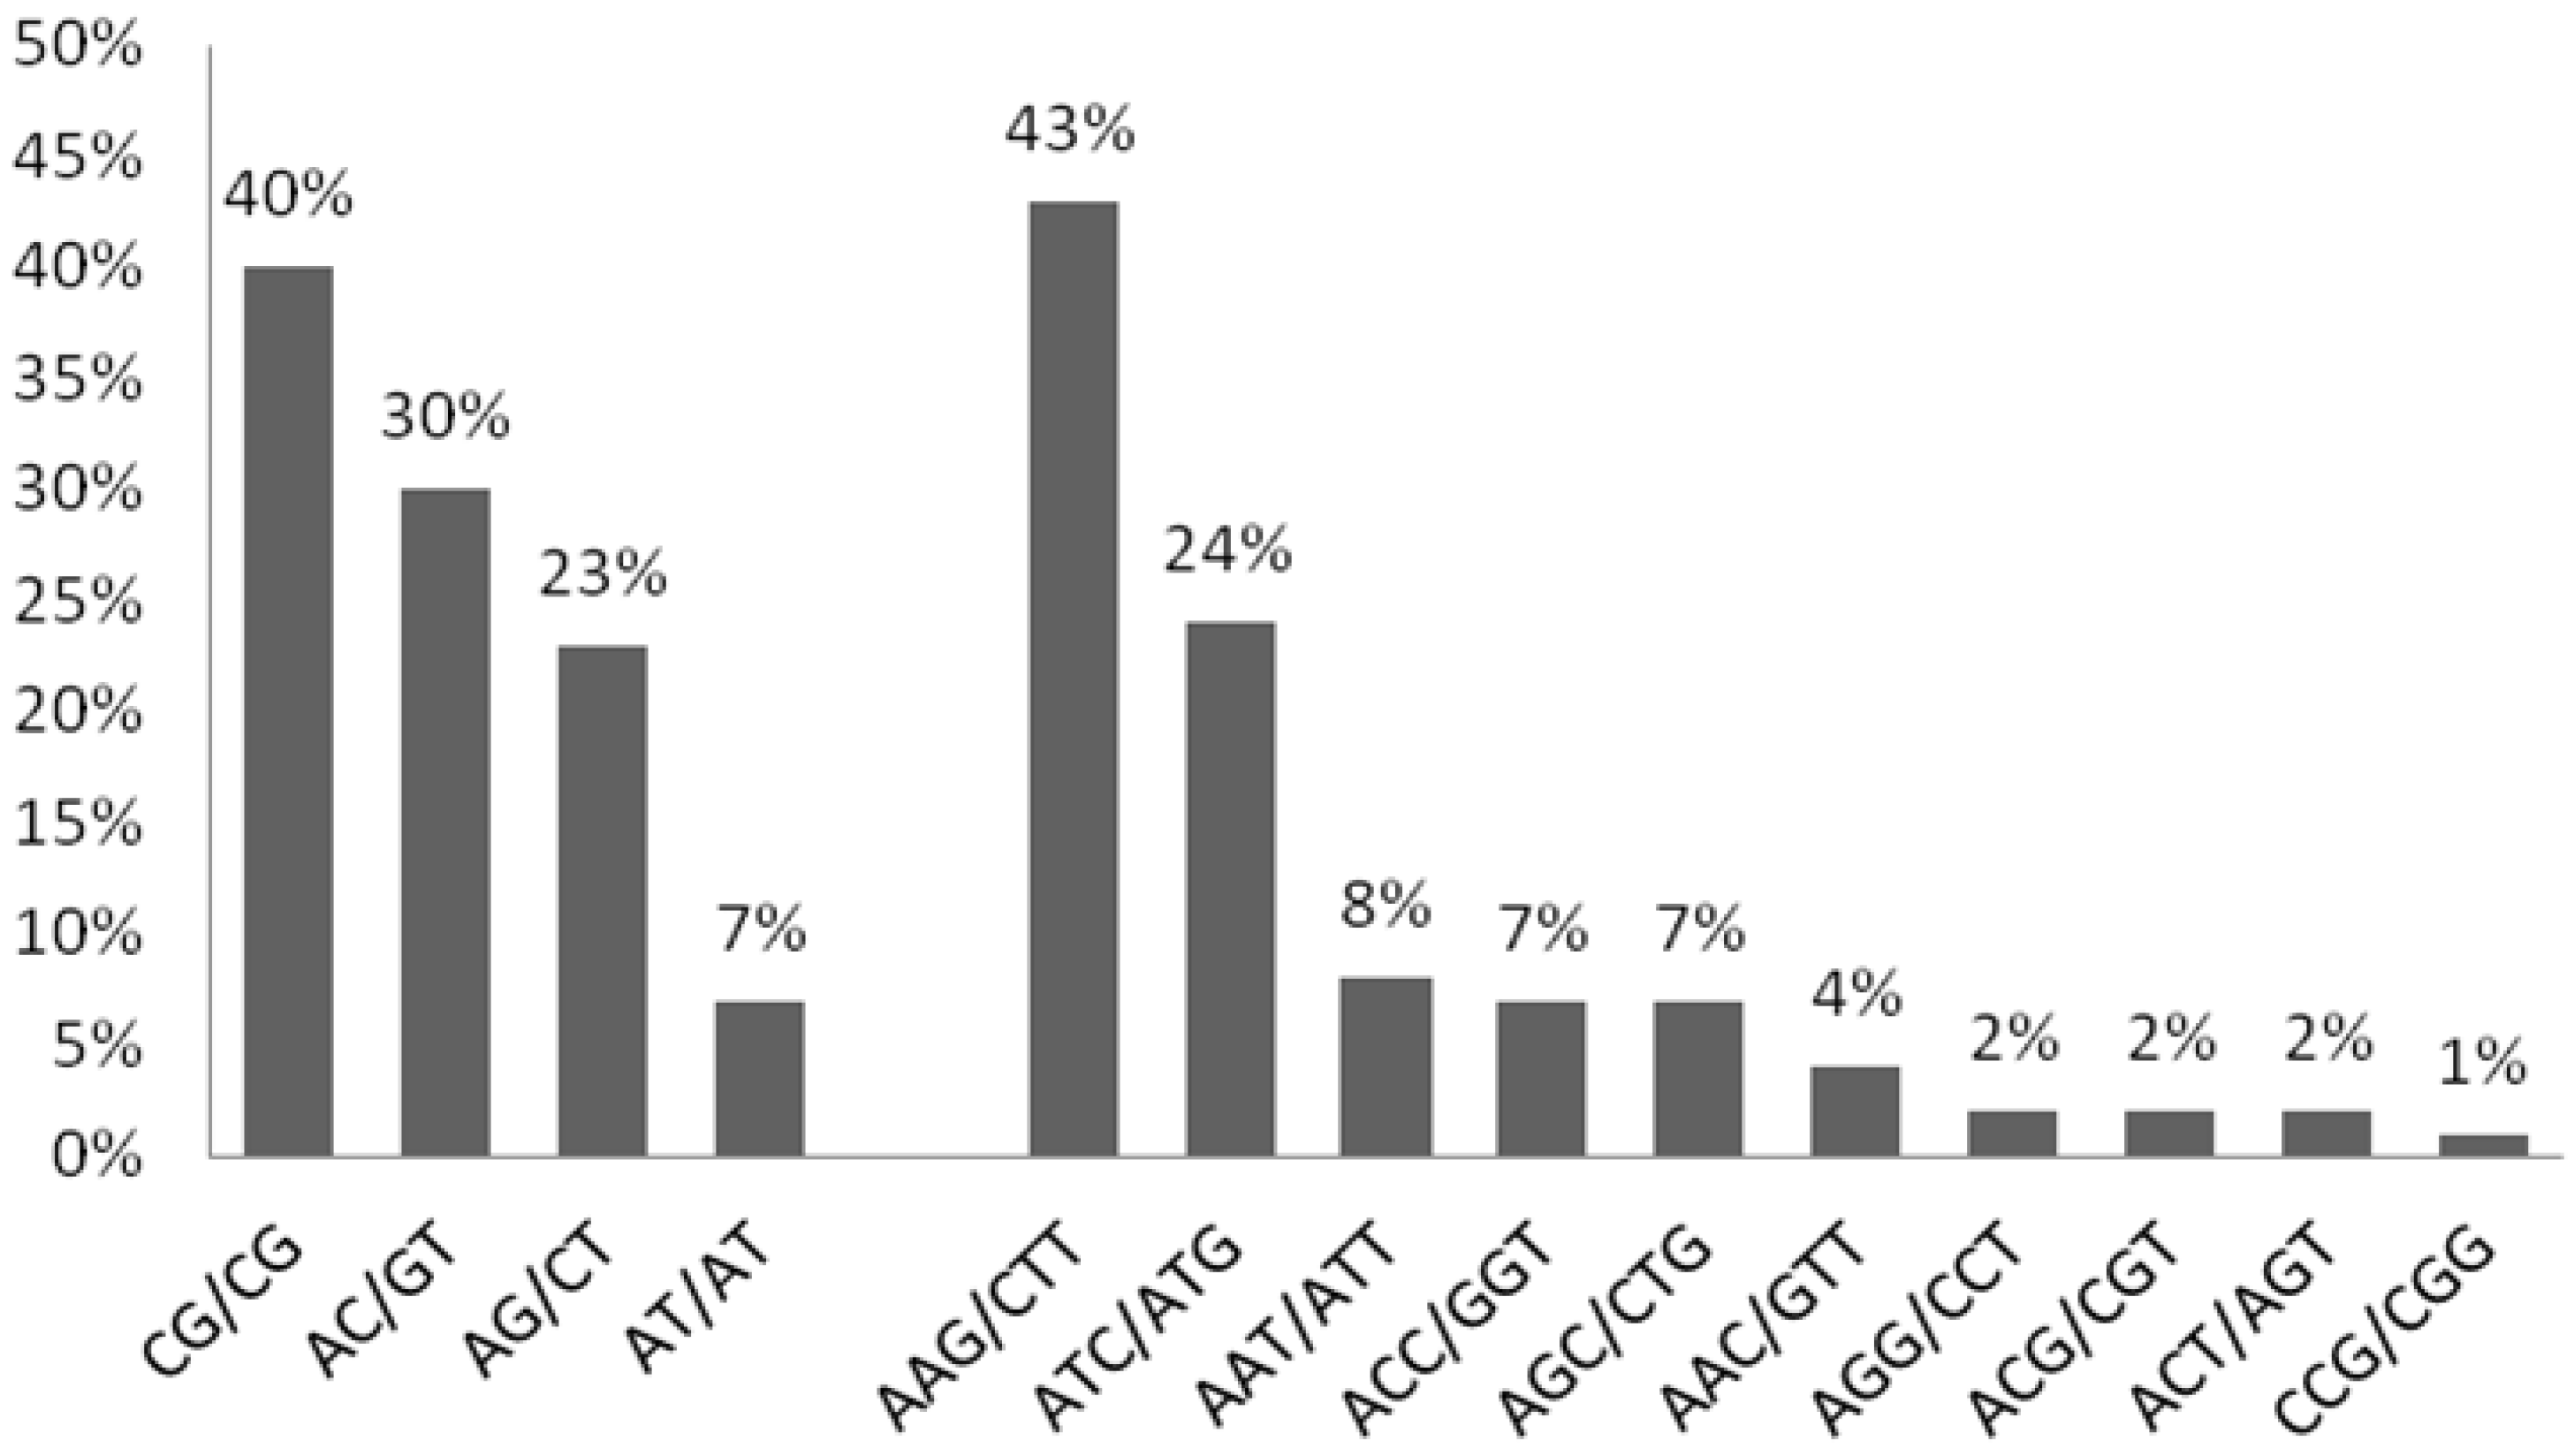
3.2. Summary for SSR-Containing Sequences

The rates of SSR mutation are positively correlated with SSR length [39], and thus, SSRs were divided into two classes based on size (Class I, ≥20 nts; Class II, (≥10, but <20 nts). SSRs with lengths of 20 nucleotides and greater tend to be highly mutable [40], while SSRs with lengths between 10 and 19 nucleotides tend to be moderately mutable [41]. In the case of this study, Class I (≥20 nts) microsatellites were more abundant than in Class II (≥10, but <20 nts) in the enriched DNA of P. ovata. Taken together, perfect (94%) repeat motif SSRs dominated over compound repeats (6%).
Depending on the number of nucleotides per repeat unit, di-nucleotides comprised 11.6% and tri-nucleotides comprised 88.35% (Table 3). The tri-nucleotides were the most common SSR type in the Plantago genomic sequence, representing nearly 88% of all SSRs, followed by dinucleotides (12%) (Table 3). This higher percentage of trinucleotide SSR in Plantago was almost similar to that of most monocot species (pearl millet, rice and sorghum) and Arabidopsis, which were by far the most frequent repeat type [42]. The results contrast with that of the trinucleotide repeat distribution in poplar, grapevine and cucumber, where tetranucleotides are the most common SSR type [43,44]. A possible explanation for the relative abundance of trinucleotides microsatellites in Plantago may rely on the fact that enrichment was performed with a greater number of trinucleotides probes than dinucleotides.
Table 3. Frequency distribution of two repeat types (di- and tri- motif units) microsatellites identified in contigs from the PGM™ sequencing of genomic DNA from P. ovata.
RepeatNumber of Loci IdentifiedPercentage (%)Frequency (%)
Class IDinucleotide2510.9610.04
≥20 ntsTrinucleotide20389.0381.52
Class IIDinucleotide419.041.60
≥10 but <20 ntsTrinucleotide1780.956.82
In the di-nucleotide repeat category, the distribution of SSRs in different motif types was not uniform, and the most frequent motif type was represented by CG/GC (40%) and AC/GT (30%), followed by AG/CT and AT/AT (Figure 1). By contrast, the CG/GC motif was reported as the least frequent dinucleotide in dicots [45]. This difference may account for different genomes being tested or the use of different SSR isolation strategies with varying affinities [46]. AT repeats were least unlike other reports on the abundance of AT repeats in plant genomes [40]. The high frequency of CG repeats can be ascribed to the high level of heterochromatin present in Plantago species [47]. SSR markers with a GC-rich motif would show higher polymorphism than SSR markers with other dinucleotide motifs [48]. Moreover, taxon-specific accumulation of repeats in eukaryotic genomes has been reported for several species [49]. It can be inferred that the accumulation of CG repeat can be species specific.
Figure 1. Frequency distribution of microsatellites in P. ovata based on the di-repeat and tri-repeat motif sequence types.
Agriculture 04 00199 g001
The most frequently occurring microsatellites were AAG/CTT and ATC/ATG followed by AAT/ATT, ACC/GGT, AGC/CTG, AAC/GTT, AGG/CCT, ACG/CGT, ACT/AGT and CCG/CGG. In dicots, trinucleotides with repeat motifs AAG/CTT accounted for the highest percentage of total trinucleotide repeats in genomic sequences. The abundance of AAG/CTT and ATC/ATG repeats might be a species-specific feature and related to high frequencies of certain amino acids [50]. In the present study, GGC was the least repeat motif, which was observed more frequently in all of the monocot species and lower plants [51,52]. Trinucleotides with repeat motifs CCG/GGC were dominant only in monocots and contributed to 51.5% of the total trinucleotide repeats identified in monocots, whereas only 1.9% of these repeats were present in dicots [45]. This conclusion is supported by the observation that the trimer motif, CCG/CGG, is predominant in the algae, Chlamydomonas reinhardtii, and the model moss, Physcomitrella patens, and could reflect the high GC content in these species. Such a dominance of triplets over other repeats in coding regions may be explained on the basis of the suppression of non-trimeric SSRs in coding regions, possibly due to a change in the reading frame with the increase or decrease in the number of repeat units [50].

3.3. SSR Amplification and Cross-Species Amplification

Out of the selected 37 primers, 30 showed amplification and generated a total of 32 amplicons in Plantago ovata. Hence, the overall amplification rate was high (81%) without any non-specific amplification. The amplicon length ranged from 126 bp (APOM24) to 715 bp (APOM20). All microsatellites genotyped amplified alleles within the expected size range. However, only one or two alleles were observed at each one of the 30 SSRs (Table 4). All microsatellites were monomorphic, displaying a single allele in the P. ovata accessions (Figure 2) analyzed in spite of the expected multiallelic nature of these hypervariable markers. The results of the microsatellite analysis in P. ovata are well in line with other studies that dealt with RAPD and ISSR [15,19]. The narrow variation and lack of inherent genetic diversity among the different P. ovata genotypes has also been revealed by both RAPD and ISSR markers [19,53]. Another important result rendered by the microsatellite analysis is a very high rate of homozygosity in contrast to the preferentially outcrossing mating system for P. ovata. As a protogynous species with a temporal difference in anthesis, it is expected that most loci in P. ovata would be heterozygous, due to the preferential occurrence of outcrossing.
Figure 2. Agarose gel image showing amplification patterns of SSR markers, APOM 23 and APOM 25, among six genotypes of P. ovata and allied species. M, 100 bp plus ladder (Thermo Scientific); 1, GI-3; 2: GI-2; 3, RI-89; 4, DPO13; 5, DPO13; 6, EC124345; 7, Plantago arneria; 8, Plantago coronopus; 9, Plantago psyllium; 10, Plantago indica; 11, Plantago serraria, 12, Plantago lanceolata.
Agriculture 04 00199 g002
Table 4. Characteristics of the simple sequence repeat (SSR) loci isolated from P. ovata.
Sr. NoPrimerPrimer Sequence (F/R)Tm *Repeat MotifAmplified Fragment SizeNo. of Observed AllelesPIC **
1APOM 1TGGCACTTGGGCAAATCTACTTGG60GC623560.75
TTGGTATCCACGGATGAACAGCCT
2APOM3GTTTACCTTGCTCAAGTGCTTGCT52TG1030190.00
AACTCCTTCACCCTTCGCCTAACA
3APOM4TGTCACACACACACACACACACAC52CA10269120.00
AGGGAAACTGCCATGACTCCTCTT
4APOM 5ATGGAAGGAGGGTGGTGGAAGTTT52AG737760.75
AGCTTTATCACAGCGACGGAGCTT
5APOM 6AATTGAAGACTGTGCACTTGGGCG60TC718160.75
AAAGGAGAGAGAGAGAGAAGCACG
6APOM 7AGGAAGGAGTCCCGAAGAGTAAGA55GC743160.75
AAATTGGGACCCACCTATCTCCCGTA
7APOM 8ATCTAACTTATCCCTTGGAC52GC7140120.00
TGCCTTAGAACTATAAGTGG
8APOM 9TTATATATCCGTCGATTTTC52CA10197120.00
AAAATATGCACTTGATTAGC
9APOM 10TTATTGATTTCGGATCTTTA60AG7192120.00
GACACACACAACTTTCTCTC
10APOM 11ATCTAACTTATCCCTTGGAC55AG619960.75
TGCCTTAGAACTATAAGTGG
11APOM 12ATTAACTGAGGAAGAGGAAG55GAA5212120.00
AGATTGAGTAGTTTCAGCAA
12APOM 13CTATTTGTCCTTCTTTGCTA60AGC7245120.00
ATATATCTGACAAGTCGCAC
13APOM 14AAATTCTAAGGCTTGTACCT60TTC424990.43
AAAATTTAGCACGCGA
14APOM 15ATGGAGTAGGAAGTGAGAGT60GAT4183120.00
GAGATGCATATCTTAAGTGTAG
15APOM 16CATAGAGTATGCTGGAAAAT60TCC419060.75
ATTCATGTTCTTGACTGTGT
16APOM 17TGTAAGGTATTGAGATTGCT55GTG5156120.00
CTTCTAATGATGATGATGGT
17APOM 19TGCAATGAGTTTTATTCTCT60CTC419660.75
GATTGTCATCATCTTCATTC
18APOM 20ATT AAA TTC GTA GTT TGA CAC ATC62CTT471570.66
ACTTGATCAGTTTGGTAGTG
19APOM 21AATGTACAAGAAGTTTTCCA58TCT428170.66
GGAACATATTCCAAGAACTA
20APOM 23AGCTAGTATCAATGCACAAT47CTT4198120.00
AAGCTACATCATCAGAAGAA
21APOM 24TTGCTGAAACTACTCAATCT47CTG412660.75
ATTCTTCTTCAGTATCAGCA
22APOM 25TCCGGAGTATAATAAGTCAA47TAA5278120.00
ACAATAATGATGTGTTTGGT
23APOM 27ACATTTTCCAACATTTAAGA47TCA5191110.16
CTAGACCAATAACAGCCTTA
24APOM 28TCAACCGATGGACAGT47GCT427960.00
CGTTAATTGTTTGTTTGAAT
25APOM 29CATAGAGTATGCTGGAAAAT47TTCT4199120.75
ATTCATGTTCTTGACTGTGT
26APOM 30TCAACCGATGGACAGT47GCT427960.75
CGTTAATTGTTTGTTTGAAT
27APOM 31CGAGTTATCTTTACTCGATG47TGA4192120.00
TCACCAGTAGTAAGTGGAAG
28APOM 34GCGACTCCTCCCTATCTTCTTCAT57AC8273120.00
TTCATCCCAAATCTATCAATTCACC
29APOM 36AATAAGGGAGGTGCACAGACCGAT57TA6241120.00
TCCGTGAGCTTCCTTGGACTGAAA
30APOM 37TGGTTTAGGCTTTCCTGCCTTTGC57TG730790.43
TTTCCTTCGGCCAAACACTCTTGC
* Tm, temperature melting; ** PIC, polymorphic information content
SSR primers show cross-genus and cross-species amplification [54,55], and the success of the cross-species amplification of SSRs depends on the evolutionary relatedness of the species sampled [56]. To test the cross-species transferability, 30 SSRs were tested on a panel of six allied species of Plantago (P. arenaria, P. coronopus, P. psyllium, P. indica, P. serraria and P. lanceolata). Of 30 primers, only 20 (66%) showed amplification in at least one of the allied Plantago species during cross-species amplification (Table 5). Cross-species amplification of these novel SSRs in other sections varied, and a maximum of 85% cross-species transferability was noticed with P. arenaria and P. lanceolata, followed by P. coronopus and P. serraria (80%) and P. psyllium and P. indica (75%). The present report on the cross-species transferability was comparable with earlier reports on different crop species, such as cotton [57] and sugarcane [58]. The high rate of transferability suggests that the SSR flanking regions of the sequences identified in P. ovata are well conserved among the Plantago species. However, the results are not in congruence with Kotwal et al., 2013, where the limited transferability of the primers from P. major to Plantago species was observed; although, primers based on unrelated genera, like Malus and Phaseolus, showed successful cross-species amplification in other species of Plantago [59].
Table 5. SSR cross-amplification in other species of Plantago based on the presence (+)/absence (−) of the amplified product.
PrimerP. arneriaP. coronopusP. psylliumP. indicaP. serrariaP. lanceolata
APOM 3+++
APOM 4++++++
APOM 8++++++
APOM 9++++++
APOM 10++++++
APOM 12++++++
APOM 13++++++
APOM 14+++
APOM 15++++++
APOM 17++++++
APOM 20+
APOM 21+
APOM 23++++++
APOM 25-1+++
APOM 25-2+++
APOM 27+++++
APOM 29++++++
APOM 31++++++
APOM 34++++++
APOM 36++++++
APOM 37+++
Total171615151617
Transferability (%) Percentage858075758085
+, Presence of amplified product; −, absence of amplified product.

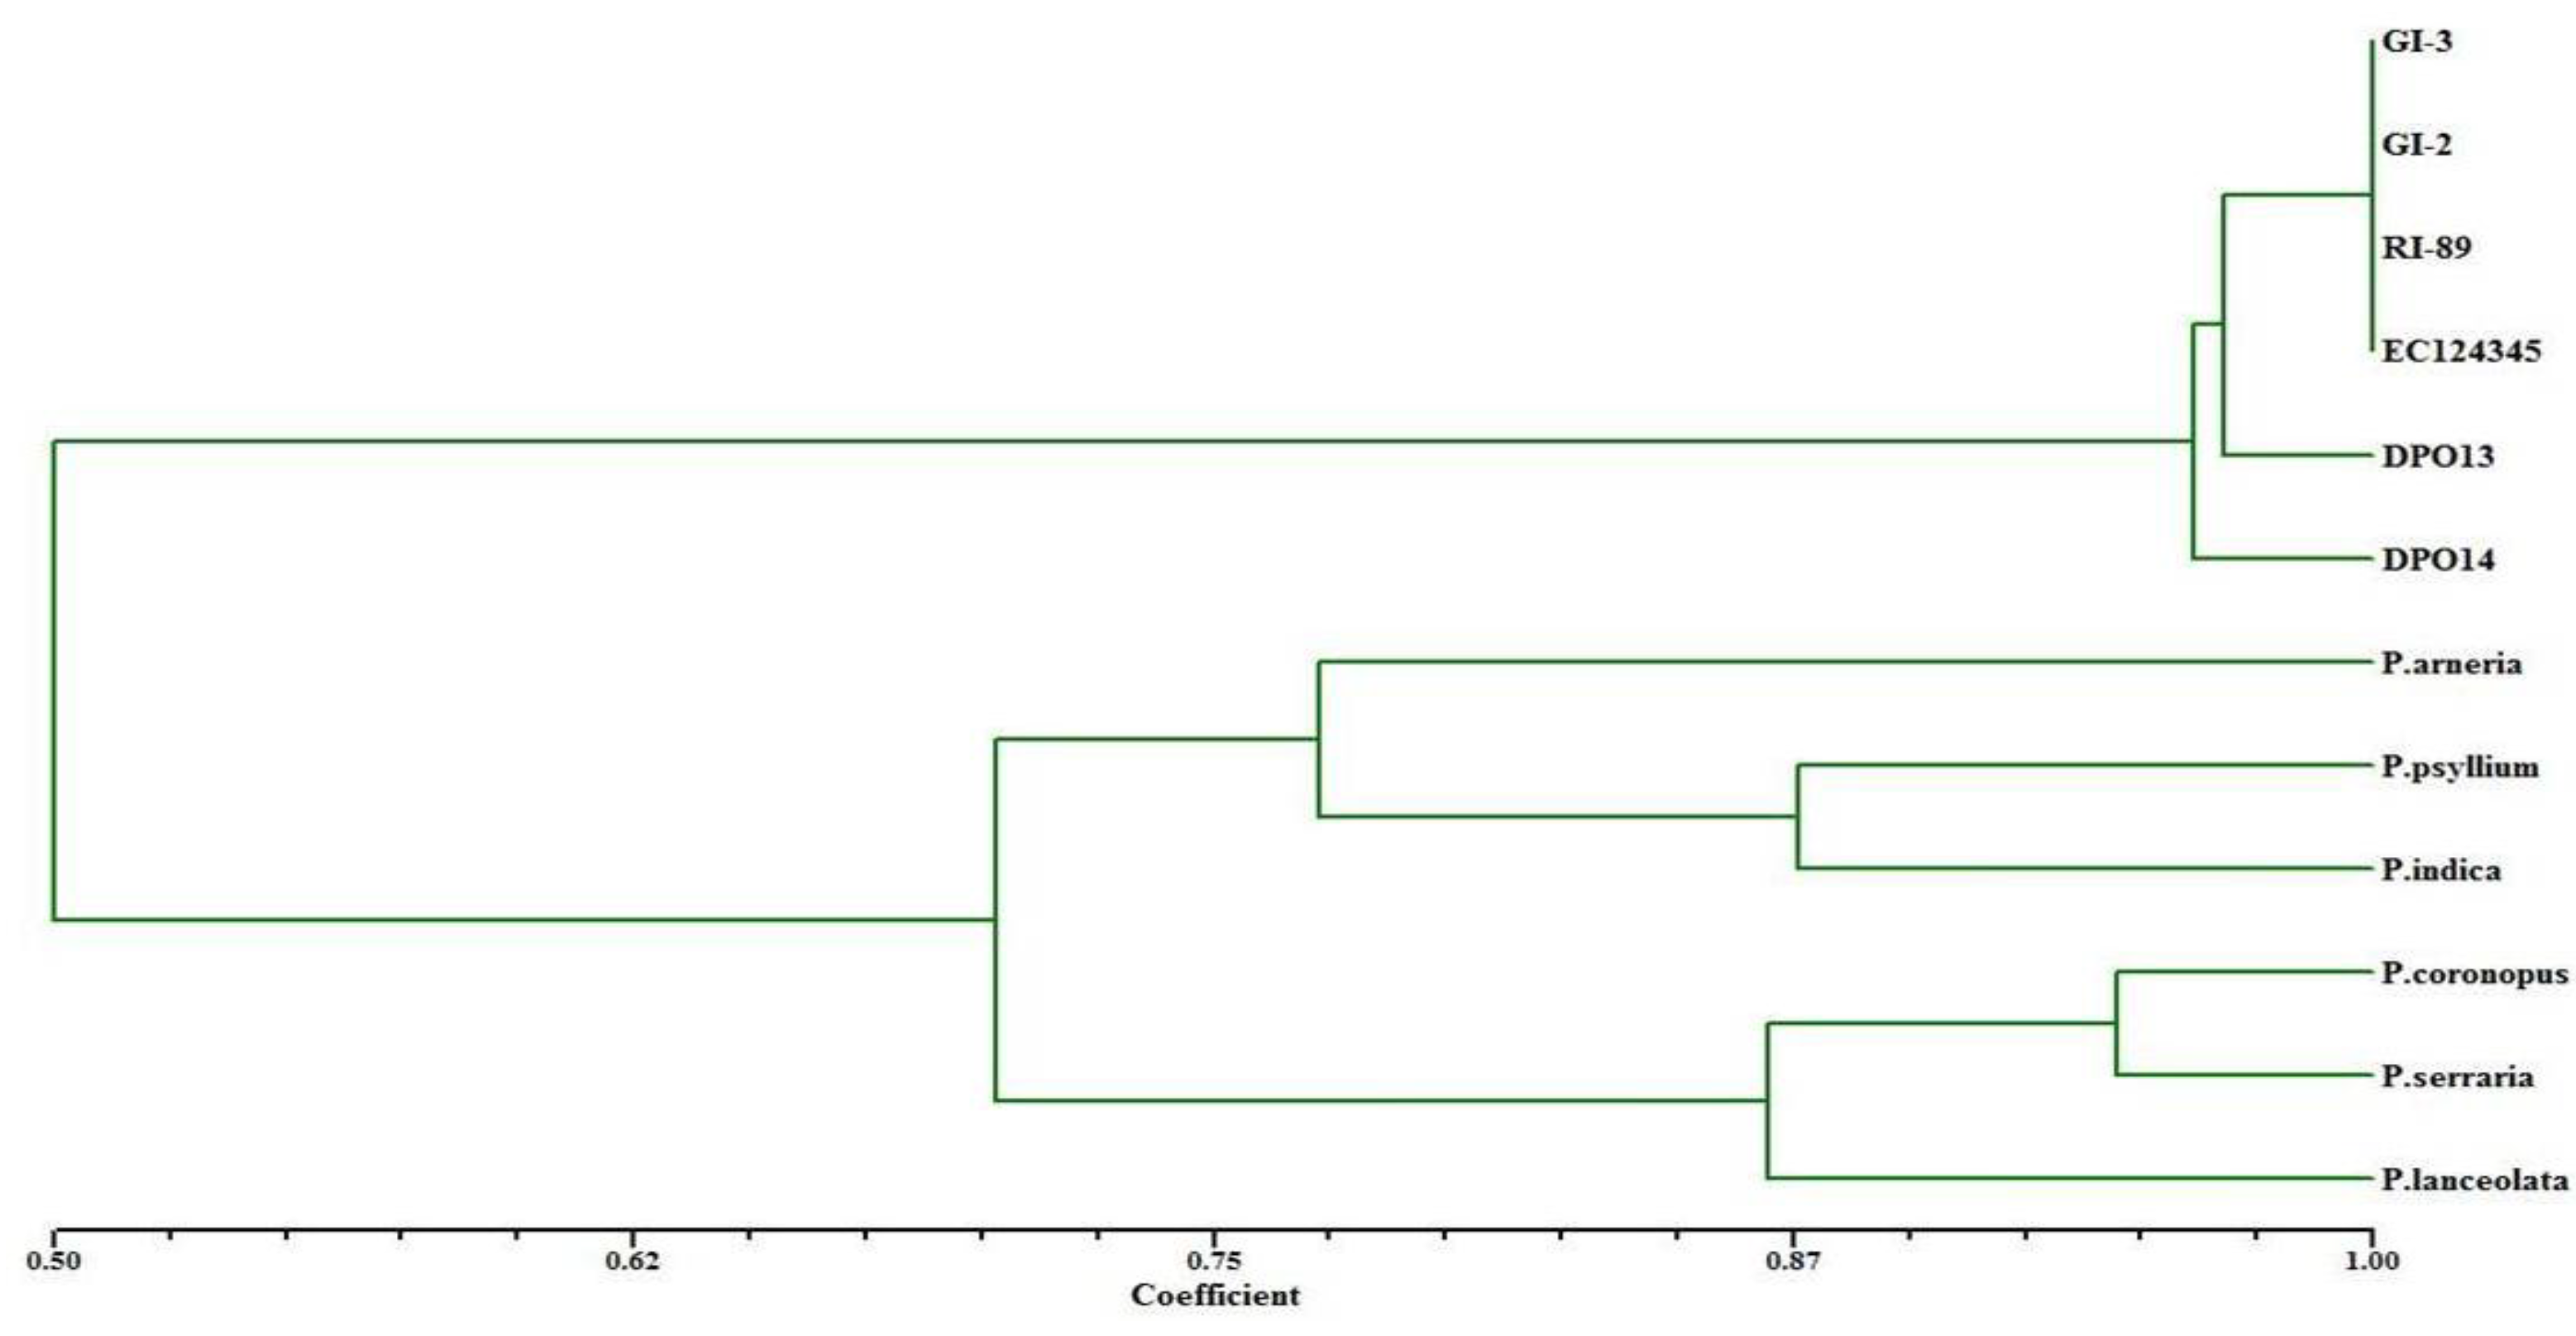
3.4. SSR Marker Scoring and Data Analysis

The authentic identification of taxa is necessary for the commercial importance of Plantago and the protection of the intellectual property rights of breeders and farmers [14]. Therefore, six highly diverse genotypes of Plantago ovata and one genotype each from six allied species were fingerprinted with 30 SSRs. The present results showed that there is a very low polymorphism within P. ovata, as all SSRs were monomorphic. During the analysis, SSRs could clearly differentiate all of the species of Plantago used for study.
Jaccard’s similarity coefficients among all pair-wise combinations of genotypes ranged from 0.38 to one, with a mean genetic similarity of 0.68. The dendrogram based on UPGMA analysis separated all of the genotypes into six groups at an average cut-off value of 0.79 (Figure 3). Six genotypes of Plantago ovata clustered into group one, and the rest of the genotypes were clustered in the other two. The first major cluster was divided into two minor clusters, out of which one minor cluster had one of the two early maturing genotypes, DPO14 of P. ovata having 94% similarity between them. Cluster I with only P. ovata was further sub-clustered, comprising GI-3, GI-2, RI-89 and EC124345 with 98.6% similarity. The accession EC123345 is highly resistant to downy mildew and is indigenous to Pakistan, hence being very distinct. However, this could not be clearly detected by SSR. Cluster II was comprised of P. arenaria, P. psyllium and P. indica; Cluster III was comprised of P. coronopus, P. serraria and P. lanceolata. The clustering pattern of the dendrogram corroborates the nature of genotypes GI-3, GI-2 and RI-89, which are developed by mutation breeding and possess elite characteristics, such as the EC124345 line, which is downy mildew resistant. The pattern of clustering of other species corresponds with earlier studies of [14]. In the second cluster, P. arneria alone showed a similarity index of about 63% and 78% with P. psyllium and P. indica, respectively. The placement of P. serraria and P. lanceolata in the present dendrogram does not line up with earlier findings [14], as both of these species belong to different subgenus’s, coronopus and albicans, respectively; hence P. serraria should have been therefore clustered with species in the fourth cluster.
Figure 3. Dendrogram based on UPGMA clustering of 12 genotypes of isabgol using SSR markers.
Agriculture 04 00199 g003
A RAPD analysis of different Plantago species by Singh et al., 2009, showed a high level of polymorphism at the species level [53]. However, within species, only a low level of polymorphism was observed. Additionally, from the RAPD study, the accessions were not differentiated, but intra-specific differences recorded in all three species were much less in comparison with inter-specific diversity.
The study is mainly aimed at the development of genomic resources and not at genetic diversity. The newly developed SSR markers showed amplification in Plantago ovata genotypes and cross-amplification in other species, although polymorphism was not seen. The study preliminarily confirms that less variability/diversity exits in Plantago spp., and for an in-depth conformation, more SSR markers need to be screened.

Acknowledgments

This work was financially supported by Gujarat State Biotechnology Mission, Department of Science and Technology, Government of Gujarat, India. The authors are thankful to Maheshbhai A. Patel, Associate Research Scientist, Medicinal and Aromatic Research Centre, Anand Agricultural University, Anand, for providing the germplasm.

Author Contributions

R.S.F., C.J. and S.K. guided the experiment and edited the final version of manuscript. K.K., A.P., A.S. and J.M. conceived and designed the study, performed the experiment and analyzed the data.

Conflicts of Interest

The authors declare no conflicts of interest.

References

  1. Dalal, K.C.; Sriram, S. Psyllium. In Advances in Horticulture. 11. Medicinal and Aromatic Plants; Chadha, K.L., Gupta, R., Eds.; Malhotra Publishing House: New Delhi, Indian, 1995; Volume 11, pp. 575–604. [Google Scholar]
  2. Chandler, C. Improvement of Plantago for mucilage production and growth in United States. Contr. Boyce Thomoson. Inst. 1954, 17, 495–505. [Google Scholar]
  3. Zargari, A. Medicinal Plants, 4th ed.; University of Tehran: Tehran, Iran, 1990; Volume 4, pp. 18–19. [Google Scholar]
  4. Ansari, S.H.; Ali, M. Chemical, pharmacological and clinical evaluation of Plantago ovata Forsk. Hamdard Med. 1996, 39, 63–85. [Google Scholar]
  5. Patel, A.; Saravanan, R. Screening of Plantago species for physiological parameters in relation to seed yield. Electron. J. Plant Breed. 2010, 1, 1454–1460. [Google Scholar]
  6. Dhar, M.K.; Kaul, S.; Friebe, B.; Gill, B.S. Chromosome identification in Plantago ovata Forsk. through C-banding and FISH. Curr. Sci. 2002, 83, 150–152. [Google Scholar]
  7. Punia, M.S.; Sharma, G.D.; Verma, P.K. Genetics and breeding of Plantago ovata Forsk. A review. Inter. J. Trop. Agri. 1985, 3, 255–264. [Google Scholar]
  8. Lal, R.K.; Sharma, J.R.; Misra, H.O. Induced variability and varietal selection in Isabgol (Plantago ovata). J. Med. Arom. Plant Sci. 1999, 21, 34–37. [Google Scholar]
  9. Mittal, S.P.; Bhagat, N.R.; Maheshwari, M.L. Improvement of Plantago ovata Forsk. through tetraploidy and mutation breeding. Indian J. Agric. Sci. 1975, 45, 426–429. [Google Scholar]
  10. Bhagat, N.R.; Hardas, M.W. Studies on induce and natural variation in Plantago ovata Forsk. Indian Drugs 1980, 17, 376–380. [Google Scholar]
  11. Bhan, A.; Dhar, M.K.; Langer, A. Genetic diversity among Plantagos XX. A tetraploid Plantago lagopus L. Cytologia 1990, 55, 511–517. [Google Scholar] [CrossRef]
  12. Dalal, K.C.; Sriram, S. Psyllium. In Advances in Horticulture medicinal and Aromatic Plants; Chaddha, K.L., Gupta, R., Eds.; Malhotra Publishing House: New Delhi, India, 1995; Volume 2, pp. 575–604. [Google Scholar]
  13. Dhar, M.K.; Kaul, S.; Sareen, S.; Koul, A.K. Plantago ovata: Genetic diversity, cultivation, utilization and chemistry. Plant Gen. Resour. 2005, 3, 252–263. [Google Scholar] [CrossRef]
  14. Samantaray, S.; Dhagat, U.M.; Maiti, S. Evaluation of genetic relationships in Plantago species using Random Amplified Polymorphic DNA (RAPD) markers. Plant Biotechnol. 2010, 27, 297–303. [Google Scholar] [CrossRef]
  15. Vala, A.G.; Fougat, R.S.; Jadeja, G.C. Genetic diversity of Plantago ovata Forsk. through RAPD markers. Elec. J. Plant Breed. 2011, 2, 592–596. [Google Scholar]
  16. Rohila, A.K.; Kumar, M.; Sindhu, A.; Boora, K.S. Genetic diversity analysis of the medicinal herb Plantago ovata (Forsk.). Afr. J. Biotechnol. 2012, 11, 15835–15842. [Google Scholar]
  17. Wolff, K.; Morgan, R.M. PCR markers distinguish Plantago major subspecies. Theor. Appl. Genet. 1998, 96, 282–286. [Google Scholar] [CrossRef]
  18. Wolff, K.; Morgan, R.M.; Davison, A.W. Patterns of molecular genetic variation in Plantago major and P. intermedia in relation to ozone resistance. New Phytologist. 2000, 145, 501–509. [Google Scholar] [CrossRef]
  19. Kaswan, V.; Joshi, A.; Maloo, S.R. Assessment of genetic diversity in Isabgol (Plantago ovata Forsk.) using random amplified polymorphic DNA (RAPD) and inter-simple sequence repeat (ISSR) markers for developing crop improvement strategies. Afr. J. Biotechnol 2013, 12, 3622–3635. [Google Scholar]
  20. Koorevaar, G.N.; Ivanovic, S.; van Damme, J.M.M.; Koelewijn, H.P.; van’T Westende, W.P.C.; Smulders, M.J.M.; Vosman, B. Dinucleotide repeat microsatellite markers for buck’s-horn Plantain (Plantago coronopus). Mol. Ecol. Note. 2002, 2, 524–526. [Google Scholar] [CrossRef]
  21. Hale, M.L.; Wolff, K. Polymorphic microsatellite loci in Plantago lanceolata. Mol. Ecol. Notes. 2003, 3, 134–135. [Google Scholar] [CrossRef]
  22. Squirrell, J.; Wolff, K. Isolation of polymorphic microsatellite loci in Plantago major and P. intermedia. Mol. Ecol. Notes. 2001, 1, 179–181. [Google Scholar] [CrossRef]
  23. Parida, S.K.; Kalia, S.K.; Kaul, S.; Dalal, V.; Hemaprabha, G.; Selvi, A.; Pandit, A.; Singh, A.; Gaikwad, K.; Sharma, T.R.; et al. Informative genomic microsatellite markers for efficient genotyping applications in sugarcane. Theor. Appl. Genet. 2009, 118, 327–338. [Google Scholar] [CrossRef]
  24. Zane, L.; Bargelloni, L.; Patarnello, T. Strategies for microsatellites isolation, a review. Mol. Ecol. 2002, 44, 1–16. [Google Scholar]
  25. Schadt, E.E.; Turner, S.; Kasarskis, A. A window into third-generation sequencing. Hum. Mol. Gen. 2010, 19, R227–R240. [Google Scholar] [CrossRef]
  26. Doyle, J.J.; Doyle, J.L. Isolation of Plant DNA from Fresh Tissue. Focus 1990, 12, 13–15. [Google Scholar]
  27. Gnirke, A.; Melnikov, A.; Maguire, J.; Rogov, P.; LeProust, E.M.; Brockman, W.; Fennell, T.; Giannoukos, G.; Fisher, S.; Russ, C.; et al. Solution hybrid selection with ultra-long oligonucleotides for massively parallel targeted sequencing. Nat. Biotechnol 2009, 27, 182–189. [Google Scholar] [CrossRef]
  28. Thiel, T.; Michalek, W.; Varshney, R.K.; Graner, A. Exploiting, EST databases for the development and characterization of gene-derived SSR-markers in barley (Hordeum vulgare L.). Theor. Appl. Genet 2003, 106, 411–422. [Google Scholar]
  29. Perl-based Microsatellite Search Module. Available online: http://pgrc.ipk-gatersleben.de/Misa (accessed on 1 December 2012).
  30. Senthilvel, S.; Jayashree, B.; Mahalakshmi, V.; Kumar, P.S.; Nakka, S.; Nepolean, T.; Hash, C.T. Development and mapping of simple sequence repeat markers for pearl millet from data mining of expressed sequence tags. BMC Plant Biol. 2008, 8, 119. [Google Scholar] [CrossRef] [Green Version]
  31. Rozen, S.; Skaletsky, H.J. Primer3 on the WWW for general users and for biologist programmers. In Methods in Molecular Biology; Misener, S., Krawetz, S.A., Eds.; Humana Press Inc.: Totowa, NJ, USA, 2000; pp. 365–386. [Google Scholar]
  32. Integrated DNA Technologies. Available online: http://www.idtdna.com/pages/scitools (accessed on 15 December 2012).
  33. Rohlf, F.J. NTSYS-PC Numerical Taxonomy and Multivariate Analysis System; Version 2.2.; State University of New York: Stony brook, NY, USA, 1994. [Google Scholar]
  34. Anderson, J.A.; Churchill, G.A.; Autrique, J.E.; Tanksley, S.D.; Sorrells, M.E. Optimizing parental selection for genetic linkage maps. Genome 1993, 36, 181–186. [Google Scholar]
  35. Rafalski, J.A.; Vogel, J.M.; Morgante, M.; Powell, W.; Andre, C.; Tingey, S.V. Generating and using DNA markers in plants. In Non-Mammalian Genomic Analysis: A Practical Guide; Birren, B., Lai, E., Eds.; Academic: San Diego, CA, USA, 1996; pp. 75–135. [Google Scholar]
  36. Santana, Q.; Coetzee, M.; Steenkamp, E.; Mlonyeni, O.; Hammond, G.; Wingfield, M.; Wingfield, B. Microsatellite discovery by deep sequencing of enriched genomic libraries. Biotechniques 2009, 46, 217–223. [Google Scholar] [CrossRef]
  37. Gardner, M.G.; Fitch, A.J.; Bertozzi, T.; Lowe, A.J. Rise of the machines recommendations for ecologists when using next generation sequencing for microsatellite development. Mol. Ecol. Resour. 2011, 11, 1093–1101. [Google Scholar] [CrossRef]
  38. Elliott, C.P.; Enriqht, N.J.; Allcock, R.J.; Gardner, M.G.; Meglécz, E.; Anthony, J.; Krauss, S.L. Microsatellite markers from the Ion Torrent: A multi-species contrast to 454 shotgun sequencing. Mol. Ecol. Resour. 2014, 14, 554–568. [Google Scholar] [CrossRef]
  39. Ellegren, H. Microsatellites: Simple sequences with complex evolution. Nat. Rev. Genet. 2004, 6, 435–445. [Google Scholar] [CrossRef]
  40. Temnykh, S.; DeClerck, G.; Lukashova, A.; Lipovich, L.; Cartinhour, S.; McCouch, S. Computational and experimental analysis of microsatellites in rice (Oryza sativa L.): Frequency, length variation, transposon associations, and genetic marker potential. Genome Res. 2001, 11, 1441–1452. [Google Scholar] [CrossRef]
  41. Pupko, T.; Graur, D. Evolution of microsatellites in the yeast Saccharomyces cerevisiae: Role of length and number of repeated units. J. Mol. Evol. 1999, 48, 313–316. [Google Scholar] [CrossRef]
  42. Zhao, Z.; Guo, C.; Sutharzan, S.; Li, P.; Echt, C.S.; Zhang, J.; Liang, C. Genome-wide analysis of tandem repeats in plants and green algae. G3(Bethesda) 2014, 4, 67–78. [Google Scholar]
  43. Liu, S.R.; Li, W.Y.; Long, D.; Hu, C.G.; Zhang, J.Z. Development and characterization of genomic and expressed SSRs in Citrus by genome-wide analysis. PLoS One 2013, 8, e75149. [Google Scholar]
  44. Cavagnaro, P.F.; Senalik, D.A.; Yang, L.; Simon, P.W.; Harkins, T.T.; Kodira, C.D.; Huang, S.; Weng, Y. Genome-wide characterization of simple sequence repeats in cucumber (Cucumis sativus L.). BMC Genomics 2010, 11, 569. [Google Scholar] [CrossRef]
  45. Sonah, H.; Deshmukh, R.K.; Sharma, A.; Singh, V.P.; Gupta, D.K.; Gacche, R.N.; Rana, J.C.; Singh, N.K.; Sharma, T.R. Genome-wide distribution and organization of microsatellites in plants, an insight into marker development in Brachypodium. PLoS One 2011, 6, e21298. [Google Scholar]
  46. Lin, H.; Chiang, C.Y.; Chang, S.B.; Kuoh, C.S. Development of Simple Sequence Repeats (SRR) markers in Setaria italica (Poaceae) and cross-amplification in related species. Int. J. Mol. Sci. 2011, 12, 7835–7845. [Google Scholar] [CrossRef]
  47. Dhar, M.K.; Fuchs, J.; Houben, A. Distribution of eu- and heterochromatin in Plantago ovata. Cytogenet. Gen. Res. 2009, 125, 235–240. [Google Scholar] [CrossRef]
  48. Yonemaru, J.; Ando, T.; Mizubayashi, T.; Kasuga, S.; Matsumoto, T.; Yano, M. Development of genome-wide simple sequence repeat markers using whole-genome shotgun sequences of sorghum (Sorghum bicolor (L.) Moench). DNA Res. 2009, 16, 187–193. [Google Scholar] [CrossRef]
  49. Katti, M.V.; Ranjekar, P.K.; Gupta, V.S. Differential distribution of simple sequence repeats in eukaryotic genome sequences. Mol. Biol. Evol. 2001, 18, 1161–1167. [Google Scholar] [CrossRef]
  50. Kalia, R.K.; Rai, M.K.; Kalia, S.; Singh, R.; Dhawan, A.K. Microsatellite markers, an overview of the recent progress in plants. Euphytica 2011, 177, 309–334. [Google Scholar] [CrossRef]
  51. Mun, J.; Kim, D.J.; Choi, H.K.; Gish, J.; Debellé, F.; Mudge, J.; Denny, R.; Endré, G.; Saurat, O.; Dudez, A.M.; et al. Distribution of microsatellites in the genome of Medicago truncatula: A resource of genetic markers that integrate genetic and physical maps. Genetics 2006, 172, 2541–2555. [Google Scholar]
  52. Victoria, F.C.; Maia, L.; Oliveira, A.C. In silico comparative analysis of SSR markers in plants. BMC Plant Biol. 2011, 11, 15. [Google Scholar] [CrossRef]
  53. Singh, N.; Lal, R.K.; Shasany, A.K. Phenotypic and RAPD diversity among 80 germplasm accessions of the medicinal plant Isabgol (Plantago ovata, Plantaginaceae). Genet. Mol. Res. 2009, 8, 1273–1284. [Google Scholar] [CrossRef]
  54. Liebhard, R.; Gianfranceschi, L.; Koller, B.; Ryder, C.D.; Tarchini, R.; van de Weg, E.; Gessler, C. Development and characterization of 140 new microsatellites in apple (Malus X domestica Borkh.). Mol. Breed. 2002, 10, 217–241. [Google Scholar] [CrossRef]
  55. Yamamoto, T.; Srivastava, A.; Rai, K.M.; Ranjan, A.; Singh, S.K.; Nisar, T.; Srivastava, M.; Bag, S.K.; Mantri, S.; Asif, M.H.; et al. Identification of quince varieties using SSR markers developed from pear and apple. Breed. Sci. 2004, 54, 239–244. [Google Scholar] [CrossRef]
  56. Dayanandan, S.; Bawa, K.; Kesseli, R. Conservation of microsatellites among tropical trees (Leguminosae). Amer. J. Bot. 1997, 84, 1658–1663. [Google Scholar] [CrossRef]
  57. Jena, S.N.; Srivastava, A.; Rai, K.M.; Ranjan, A.; Singh, S.K.; Nisar, T.; Srivastava, M.; Bag, S.K.; Mantri, S.; Asif, M.H.; et al. Development and characterization of genomic and expressed SSRs for levant cotton (Gossypium herbaceum L.). Theor. Appl. Genet. 2012, 124, 565–576. [Google Scholar]
  58. Singh, R.K. Development, cross-species/genera transferability of novel EST-SSR markers and their utility in revealing population structure and genetic diversity in sugarcane. Gene 2013, 524, 309–329. [Google Scholar] [CrossRef]
  59. Kotwal, S.; Dhar, M.K.; Kour, B.; Raj, K.; Kaul, S. Molecular markers unravel intraspecific and interspecific genetic variability in Plantago ovata and some of its wild allies. J. Genet. 2013, 92, 293–298. [Google Scholar] [CrossRef]

