
The Effect of Tillage on Organic Carbon Stabilization in Microaggregates in Different Climatic Zones of European Russia

Abstract
:1. Introduction
2. Materials and Methods
2.1. Materials
Sample Collection
2.2. Methods
3. Results and Discussion
3.1. Share of Microaggregates in Native and Arable Soils
3.2. Carbon Concentration in Organic and Organo-Clay Fractions of Native and Arable Soils
3.3. Variations in Organic Matter Content in Soils under a Change of Land Use
4. Conclusions
Acknowledgments
Author Contributions
Conflicts of Interest
References
- Carter, M.R. Soil quality for sustainable land management: Organic matter and aggregation interactions that maintain soil functions. Agron. J. 2002, 94, 38–47. [Google Scholar] [CrossRef]
- Travnikova, L.S.; Sileva, T.M.; Ryzhova, I.M.; Artem’eva, Z.S. Microaggregation and stability of organic matter in the forest-steppe chernozems of the Volga region. Eurasian Soil Sci. 2006, 39, 640–647. [Google Scholar] [CrossRef]
- Artemyeva, Z.S. Organicheskoe Veshchestvo i Granulometricheskaya Sistema Pochvy (Organic Matter and Granulometric Soil System); GEOS: Moscow, Russia, 2010; pp. 34–95. (In Russian) [Google Scholar]
- Mandiola, M.; Studdert, G.A.; Domínguez, G.F.; Videla, C.C. Organic matter distribution in aggregate sizes of a mollisol under contrasting managements. J. Soil Sci. Plant Nutr. 2011, 11, 41–57. [Google Scholar] [CrossRef]
- Semenov, V.M.; Kogut, B.M. Pochvennoe Organicheskoe Veshchestvo (Soil Organic Matter); GEOS: Moscow, Russia, 2015; pp. 105–114. (In Russian) [Google Scholar]
- Balesdent, J. The significance of organic separates to carbon dynamics and its modelling in some cultivated soils. Eur. J. Soil Sci. 1996, 47, 485–493. [Google Scholar] [CrossRef]
- Von Lützow, M.; Köegel-Knabner, I.; Ekschmitt, K.; Matzner, E.; Guggenberger, G.; Marschner, B.; Flessa, H. Stabilization of organic matter in temperate soils: Mechanisms and their relevance under different soil conditions—A review. Eur. J. Soil Sci. 2006, 57, 426–445. [Google Scholar] [CrossRef]
- Von Lützow, M.; Köegel-Knabner, I.; Ludwig, B.; Matzner, E.; Flessa, H.; Ekschmitt, K.; Guggenberger, G.; Marschner, B.; Kalbitz, K. Stabilization mechanisms of organic matter in four temperate soils: Development and application of a conceptual model. J. Plant Nutr. Soil Sci. 2008, 171, 111–124. [Google Scholar] [CrossRef]
- Doran, J.W.; Sarrantino, M.; Liebig, M.A. Soil health and sustainability. Adv. Agron. 1996, 56, 1–54. [Google Scholar]
- Stockmann, U.; Adams, M.A.; Crawford, J.W.; Field, D.J.; Henakaarchchi, N.; Jenkins, M.; Minasny, B.; McBratney, A.B.; de Courcelles, V.R.; Singh, K.; et al. The knowns, known unknowns and unknowns of sequestration of soil organic carbon. Agric. Ecosyst. Environ. 2013, 164, 80–99. [Google Scholar] [CrossRef]
- Jacobs, A.; Helfrich, M.; Hanisch, S.; Quendt, U.; Rauber, R.; Ludwig, B. Effect of conventional and minimum tillage on physical and biochemical stabilization of soil organic matter. Biol. Fertil. Soils 2010, 46, 671–680. [Google Scholar] [CrossRef]
- Solomon, D.; Lehmann, J.; Zech, W. Land use effects on soil organic matter properties of Chromic Luvisols in semi-arid northern Tanzania: Carbon, nitrogen, lignin and carbohydrates. Agric. Ecosyst. Environ. 2000, 78, 203–213. [Google Scholar] [CrossRef]
- Grünzweig, J.M.; Sparrow, S.D.; Chapin, S.F. Impact of forest conversion to agriculture on carbon and nitrogen mineralization in subarctic Alaska. Biogeochemistry 2003, 64, 271–296. [Google Scholar] [CrossRef]
- Balesdent, J.; Chenu, C.; Balabane, M. Relationship of soil organic matter dynamics to physical protection and tillage. Soil Tillage Res. 2000, 53, 215–230. [Google Scholar] [CrossRef]
- Wander, M. Soil organic matter fractions and their relevance to soil function. In Soil Organic Matter in Sustainable Agriculture; Magdoff, K., Weil, R.R., Eds.; CRC Press: Boca Raton, FL, USA, 2004; pp. 67–102. [Google Scholar]
- Janzen, H.H. The soil carbon dilemma: Shall we hoard it or use it? Soil Biol. Biochem. 2006, 38, 419–424. [Google Scholar] [CrossRef]
- Artemyeva, Z.S.; Ryzhova, I.M.; Sileva, T.M.; Erokhova, A.A. Organic carbon stabilization in microaggregates of Sod-Podzolic soils depending on land use. Mosc. Univ. Soil Sci. Bull. 2013, 68, 116–122. [Google Scholar] [CrossRef]
- Li, X.G.; Li, Y.K.; Li, F.M.; Ma, M.; Zhang, P.L.; Yin, P. Changes in soil organic carbon, nutrients and aggregation after conversion of native desert soil into irrigated arable land. Soil Tillage Res. 2009, 104, 263–269. [Google Scholar] [CrossRef]
- Golchin, A.; Oades, J.M.; Skjemstad, J.O.; Clarke, P. Structural and dynamic properties of soil organic matter as reflected by 13C natural abundance, pyrolysis mass spectrometry and solid-state 13C NMR spectroscopy in density fractions of an Oxisol under forest and pasture. Aust. J. Soil Res. 1995, 33, 59–76. [Google Scholar] [CrossRef]
- Post, W.M.; Kwon, K.C. Soil carbon sequestration and land use change: Processes and potential. Glob. Chang. Biol. 2000, 6, 317–327. [Google Scholar] [CrossRef]
- Murty, D.; Kirschbaum, M.U.F.; Mcmurtrie, R.E.; Mcgilvray, H. Does conversion of forest to agricultural land change soil carbon and nitrogen? A review of the literature. Glob. Chang. Biol. 2002, 8, 105–123. [Google Scholar] [CrossRef]
- Christensen, B.T. Carbon in primary and secondary organomineral complexes. In Structure and Organic Matter Storage in Agricultural Soils; Carter, M.R., Stewart, B.A., Eds.; Lewis Publication: Boca Raton, FL, USA, 1996; pp. 97–165. [Google Scholar]
- Von Lützow, M.; Köegel-Knabner, I.; Ekschmitt, K.; Flessa, H.; Guggenberger, G.; Matzner, E.; Marschner, B. SOM fractionation methods: Relevance to functional pools and to stabilization mechanisms. Soil Biol. Biochem. 2007, 39, 2183–2207. [Google Scholar] [CrossRef]
- Six, J.; Conant, R.T.; Paul, E.A.; Paustian, K. Stabilization mechanisms of soil organic matter: Implications for c-saturation of soils. Plant Soil 2002, 241, 155–176. [Google Scholar] [CrossRef]
- Oorts, K.; Bossuyt, H.; Labreuche, J.; Merckx, R.; Nicolardot, B. Carbon and nitrogen stocks in relation to organic matter fractions, aggregation and pore size distribution in no-tillage and conventional tillage in northern France. Eur. J. Soil Sci. 2007, 58, 248–259. [Google Scholar] [CrossRef]
- Cambardella, C.A.; Elliot, E.T. Carbon and nitrogen distribution in aggregates from cultivated and native grassland soils. Soil Sci. Soc. Am. J. 1993, 57, 1071–1076. [Google Scholar] [CrossRef]
- Six, J.; Paustian, K.; Elliott, E.T.; Combrink, C. Soil structure and organic matter I. Distribution of aggregate-size classes and aggregate associated carbon. Soil Sci. Soc. Am. J. 2000, 64, 681–689. [Google Scholar] [CrossRef]
- Besnard, E.; Chenu, C.; Balesdent, J.; Puget, P.; Arrouays, D. Fate of particulate organic matter in soil aggregates during cultivation. Eur. J. Soil Sci. 1996, 47, 495–503. [Google Scholar] [CrossRef]
- Six, J.; Elliott, E.T.; Paustian, K. Aggregate and soil organic matter dynamics under conventional and no-tillage systems. Soil Sci. Soc. Am. J. 1999, 63, 1350–1358. [Google Scholar] [CrossRef]
- Jastrow, J.D.; Miller, R.M. Soil aggregate stabilization and carbon sequestration: Feedbacks through organomineral associations. In Soil Processes and the Carbon Cycle; CRC Press: Boca Raton, FL, USA, 1997; pp. 207–223. [Google Scholar]
- Golchin, A.; Oades, J.M.; Skjemstad, J.O.; Clarke, P. Study of free and occluded particulate organic-matter in soils by solid-state 13C CP/MAS NMR-spectroscopy and scanning electron-microscopy. Aust. J. Soil Res. 1994, 32, 285–309. [Google Scholar] [CrossRef]
- Schmidt, M.W.; Rumpel, C.; Kögel-Knabner, I. Evaluation of an ultrasonic dispersion procedure to isolate primary organomineral complexes from soils. Eur. J. Soil Sci. 1999, 50, 87–94. [Google Scholar] [CrossRef]
- Christensen, B.T. Physical fractionation of soil and structural and functional complexity in organic turnover. Eur. J. Soil Sci. 2001, 52, 345–353. [Google Scholar] [CrossRef]
- Olchin, G.P.; Ogle, S.; Frey, S.D.; Filley, T.R.; Paustian, K.; Six, J. Residue carbon stabilization in soil aggregates of No-Till and tillage management of dryland cropping systems. Soil Sci. Soc. Am. J. 2008, 72, 507–513. [Google Scholar] [CrossRef]
- Christensen, B.T. Physical fractionation of soil and organic matter in primary particle size and density separates. Adv. Agron. 1992, 20, 1–90. [Google Scholar]
- Morra, M.J.; Blank, R.R.; Freeborn, L.L.; Shafii, B. Size fractionation of soil organo-mineral complexes using ultrasonic dispersion. Soil Sci. 1991, 152, 294–303. [Google Scholar] [CrossRef]
- Emerson, W.W. The Determination of the Stability of Soil Crumbs. J. Soil Sci. 1954, 5, 233–250. [Google Scholar] [CrossRef]
- Edwards, A.P.; Bremner, J.M. Microaggregates in soils. J. Soil Sci. 1967, 18, 64–73. [Google Scholar] [CrossRef]
- Shaimukhametov, M.S. The way to use ultrasound for researching how organic matter is fixed in soils. Pochvoved 1974, 5, 154–161. (In Russian) [Google Scholar]
- Hamblin, A.P. Structural features of aggregates in some east england silt. J. Soil Sci. 1977, 28, 23–28. [Google Scholar] [CrossRef]
- Tisdall, J.M.; Oades, J.M. Organic matter and water-stable aggregates in soils. J. Soil Sci. 1982, 33, 141–163. [Google Scholar] [CrossRef]
- Oades, J.M. The retention of organic matter in soils. Biogeochemistry 1988, 5, 35–70. [Google Scholar] [CrossRef]
- Oades, J.M.; Waters, A.C. Aggregate Hierarchy in Soils. Aust. J. Soil Res. 1991, 29, 815–828. [Google Scholar] [CrossRef]
- Amato, M.; Ladd, J.N. Decomposition of 14C-labelled glucose and legume material in soils: Properties influencing the accumulation of organic residue C and microbial biomass C. Soil Biol. Biochem. 1992, 24, 455–464. [Google Scholar] [CrossRef]
- Golchin, A.; Clarke, P.; Oades, J.M.; Skjemstad, J.O. The effect of cultivation on the composition of organic matter and structural stability of soils. Aust. J. Soil Res. 1995, 33, 975–993. [Google Scholar] [CrossRef]
- Russian Federation. Available online: http://russia.auto-maps.com/maps/large_detailed_road_map_of_Russia_with_all_cities_in_English.jpg (accessed on 28 August 2016).
- Blanco-Canqui, H.; Lal, R. Mechanisms of carbon sequestration in soil aggregates. Crit. Rev. Plant Sci. 2004, 23, 481–504. [Google Scholar] [CrossRef]
- Ashamn, M.R.; Hallett, P.D.; Brookes, P.C. Are the links between soil aggregate size class, soil organic matter and respiration rate artifacts of the fractionation procedure? Soil Biol. Biochem. 2003, 35, 435–444. [Google Scholar] [CrossRef]
- Travnikova, L.S.; Artemyeva, Z.S. Physical Fractionation of Soil Organic Matter for Studying Its Resistance to Biodegradation. In Ecology and Soils: Selected Lectures of the X All-Russian School (Pushchino, 2001); ONTI PNC RAN: Pushchino, Russia, 2001; pp. 337–346. (In Russian) [Google Scholar]
- Shaimukhametov, M.S.; Voronina, K.A. Methods of fractionation organo-clay complexes of soils through laboratory centrifuges. Pochvovedenie 1972, 8, 134–138. (In Russian) [Google Scholar]
- Tang, Z.; Wu, L.; Luo, Y.; Christie, P. Size fractionation and characterization of nanocolloidal particles in soils. Environ. Geochem. Health 2009, 31, 1–10. [Google Scholar] [CrossRef] [PubMed] [Green Version]
- Balesdent, J.; Mariotti, A.; Guillet, B. Natural 13C abundance as a tracer for studies of soil organic matter dynamics. Soil Biol. Biochem. 1987, 19, 25–30. [Google Scholar] [CrossRef]
- Chenu, C.; Plante, A.F. Clay-sized organo-mineral complexes in a cultivation chronosequence: Revisiting the concept of the “organo-mineral complex”. Eur. J. Soil Sci. 2006, 57, 596–607. [Google Scholar] [CrossRef]
- Fedotov, G.N.; Artem’eva, Z.S. Colloidal component of granulodensimetric soil fractions. Eurasian Soil Sci. 2015, 48, 54–62. [Google Scholar] [CrossRef]
- Beheshti, A.; Raiesi, F.; Golchin, A. Soil properties, C fractions and their dynamics in land use conversion from native forests to croplands in northern Iran. Agric. Ecosyst. Environ. 2012, 148, 121–133. [Google Scholar] [CrossRef]
- Haasink, J. Decomposition rate constants of size and density fractions of soil organic matter. Soil Sci. Soc. Am. J. 1995, 59, 1631–1635. [Google Scholar] [CrossRef]
- Six, J.; Elliott, E.T.; Paustian, K.; Doran, J.W. Aggregation and soil organic matter storage in cultivated and native grassland soils. Soil Sci. Soc. Am. J. 1998, 62, 1367–1377. [Google Scholar] [CrossRef]
- Tyurin, I.V. Organicheskoe Veshchestvo Pochvy i Ego rol v Plodorodii (Soil Organic Matter and Its Role in Soil Fertility); Nauka: Moscow, Russia, 1965; pp. 135–144. (In Russian) [Google Scholar]
- Mishustin, E.N. Microorganizmi i Productivnost Zemledelia (Microorganizms and Soil Fertility); Nauka: Moscow, Russia, 1972; pp. 116–117. (In Russian) [Google Scholar]
- Bazilevich, N.I.; Grebenchikov, O.S.; Tishkov, A.A. Geograficheskii Zakonomernosti Struktury I Funktsionirovania Ekosistem (Geografical Patterns of Ecosystem Structure and Functioning); Nauka: Moscow, Russia, 1986; pp. 10–23. (In Russian) [Google Scholar]


| Zone | Location of the Studied Area | Climate | Parent Material | Soil Group | Soil Texture | pHH2O | pHKCl | Сorg (%) | ||||||
|---|---|---|---|---|---|---|---|---|---|---|---|---|---|---|
| Region | Point | Coordinate | Mean Annual Temperature | Mean Annual Precipitation/Evaporation | Sand | Silt | Clay | |||||||
| N | E | |||||||||||||
| Taiga | Moscow | Zvenigorod Biostation | 55°42′00″ | 36°43′35″ | +3.2 | 620/550 | Glacial deposits | Albeluvisols | 54.5–55.5 | 40.2–40.9 | 4.3–4.6 | 4.1–5.2 | 1.2–2.2 | |
| Chashnikovo Scientific-Experimental Ecological Centre | 56°01′47″ | 37°10′09″ | +3.3 | 600/550 | 21.0–22.9 | 71.0–71.4 | 6.1–7.6 | 4.0–5.2 | 1.5–2.4 | |||||
| Zelenograd Research Station | 54°48′18″ | 37°36′18″ | +3.5 | 600/550 | 13.0–14.0 | 72.5–75.6 | 10.4–14.5 | 3.9–4.8 | 1.3–3.2 | |||||
| 55°14′10″ | 37°59′60″ | 15.0–18.0 | 68.7–70.4 | 13.3–14.6 | 4.0–5.1 | 1.2–2.3 | ||||||||
| Malinki Biogeocenological Station | 55°27′00″ | 37°13′00″ | +3.5 | 550/550 | 19.0–20.0 | 64.9–66.8 | 13.2–16.1 | 5.1–5.4 | 2.0–3.5 | |||||
| Tula | Ivan’kovo Research Station | 54°28′45″ | 37°41′36″ | +4.5 | 570/600 | Loess sediments | Phaeozems | 6.0–7.3 | 76.8–78.4 | 15.6–15.9 | 5.3–5.5 | 4.0 | ||
| Semi-humid Steppe | Kursk | Strelestkaya steppe Reserve | 51°34′00″ | 36°06′00″ | +5.3 | 550/600 | Chernozems | 4.2–5.0 | 70.0–73.1 | 21.9–24.6 | 6.8–7.2 | 3.2–4.6 | ||
| Penza | Poperechenskay steppe Reserve | 52°58′59″ | 44°19′20″ | +5.2 | 521/550 | 2.0 | 68.3–71.2 | 26.8–29.7 | 6.3–7.0 | 5.0–7.4 | ||||
| Ostrovtsovskay steppe Reserve | 52°49′50″ | 44°23′27″ | +5.3 | 440/460 | 5.4–6.0 | 64.4–66 | 29.0–29.6 | 6.8–7.2 | 4.9–6.3 | |||||
| Soil | Location | Land Use | Tillage Systems | Depth (cm) | Dominant Vegetation/Dominant Crops | Agricultural Amendment |
|---|---|---|---|---|---|---|
| Umbric Albeluvisols Abruptic | Zvenigorod Biostation | Forest | absent | 4–12 | Betula pendula, Betula pubescens | absent |
| Arable | CT * | 0–25 | barley crops | low | ||
| Chashnikovo Scientific-Experimental Ecological Centre | Forest | absent | 4–10 | Picea abies, Betula pendula, Betula pubescens | absent | |
| Arable | CT * | 0–25 | clover crops | low | ||
| Malinki Biogeocenological Station | Forest | absent | 5–13 | Quercus pubescens, Picea abies | absent | |
| Arable | CT * | 0–25 | barley crops | low | ||
| Zelenograd Station (1) | Forest | absent | 3–12 | Picea abies, Betula pendula, Betula pubescens | absent | |
| Arable | CT * | 0–25 | clover crops | low | ||
| Zelenograd Station (2) | Forest | absent | 4–10 | Picea abies, Betula pubescens | absent | |
| Arable | CT | 0–24 | clover crops | low | ||
| Greyic Phaeozems Albic | Ivan’kovo Research Station | Forest | absent | 4–16 | Quercus pubescens, Betula pendula | low |
| Arable | CT * | barley crops | low | |||
| Voronic Chernozems Pachic | Ostrovtsovskay steppe Reserve | Steppe | absent | 5–33 | Stipa dasyphylla, Stipa pennata, Stipa zalesskii | absent |
| Arable | CT * | 0–28 | wheat crops | low | ||
| Haplic Chernozems Pachic | Poperechenskay steppe Reserve | Steppe | absent | 8–51 | Stipa dasyphylla, Stipa pennata, Stipa pulcherrima, Stipa zalesskii | absent |
| Arable | CT * | 0–30 | wheat crops | low | ||
| Voronic Chernozems Pachic | Strelestkaya steppe Reserve | Steppe | absent | 5–30 | Stipa pennata, Stipa dasyphylla, Stipa pulcherrima | absent |
| Arable | CT * | 0–30 | barley crops | low |
| Soil | Land Use | Unstable (Coarse) Microaggregates (50–250 μm) | Stable (Fine) Microaggregates (1–50 μm) | Microaggregates Total | |||
|---|---|---|---|---|---|---|---|
| % of Soil Bulk | Student Criterion | % of Soil Bulk | Student Criterion | % of Soil Bulk | Student Criterion | ||
| Albeluvisols | Forest | 13.38 ± 1.95 | 0.02 < t = 2.10 | 85.48 ± 2.26 | 0.08 < t = 2.10 | 98.86 ± 0.73 | 1.33 < t = 2.10 |
| Arable | 13.34 ± 2.56 | 86.16 ± 2.72 | 99.49 ± 0.59 | ||||
| Phaeozems | Forest | 20.04 ± 0.32 | 1.35 < t = 4.30 | 79.34 ± 1.06 | 0.93 < t = 4.30 | 99.38 ± 0.32 | 0.63< t = 4.30 |
| Arable | 19.22 ± 0.50 | 80.70 ± 2.08 | 99.92 ± 0.77 | ||||
| Chernozems | Steppe | 33.49 ± 5.31 | 0.97 < t = 2.23 | 66.15 ± 5.51 | 1.06 < t = 2.23 | 99.64 ± 0.36 | 1.46 < t = 2.23 |
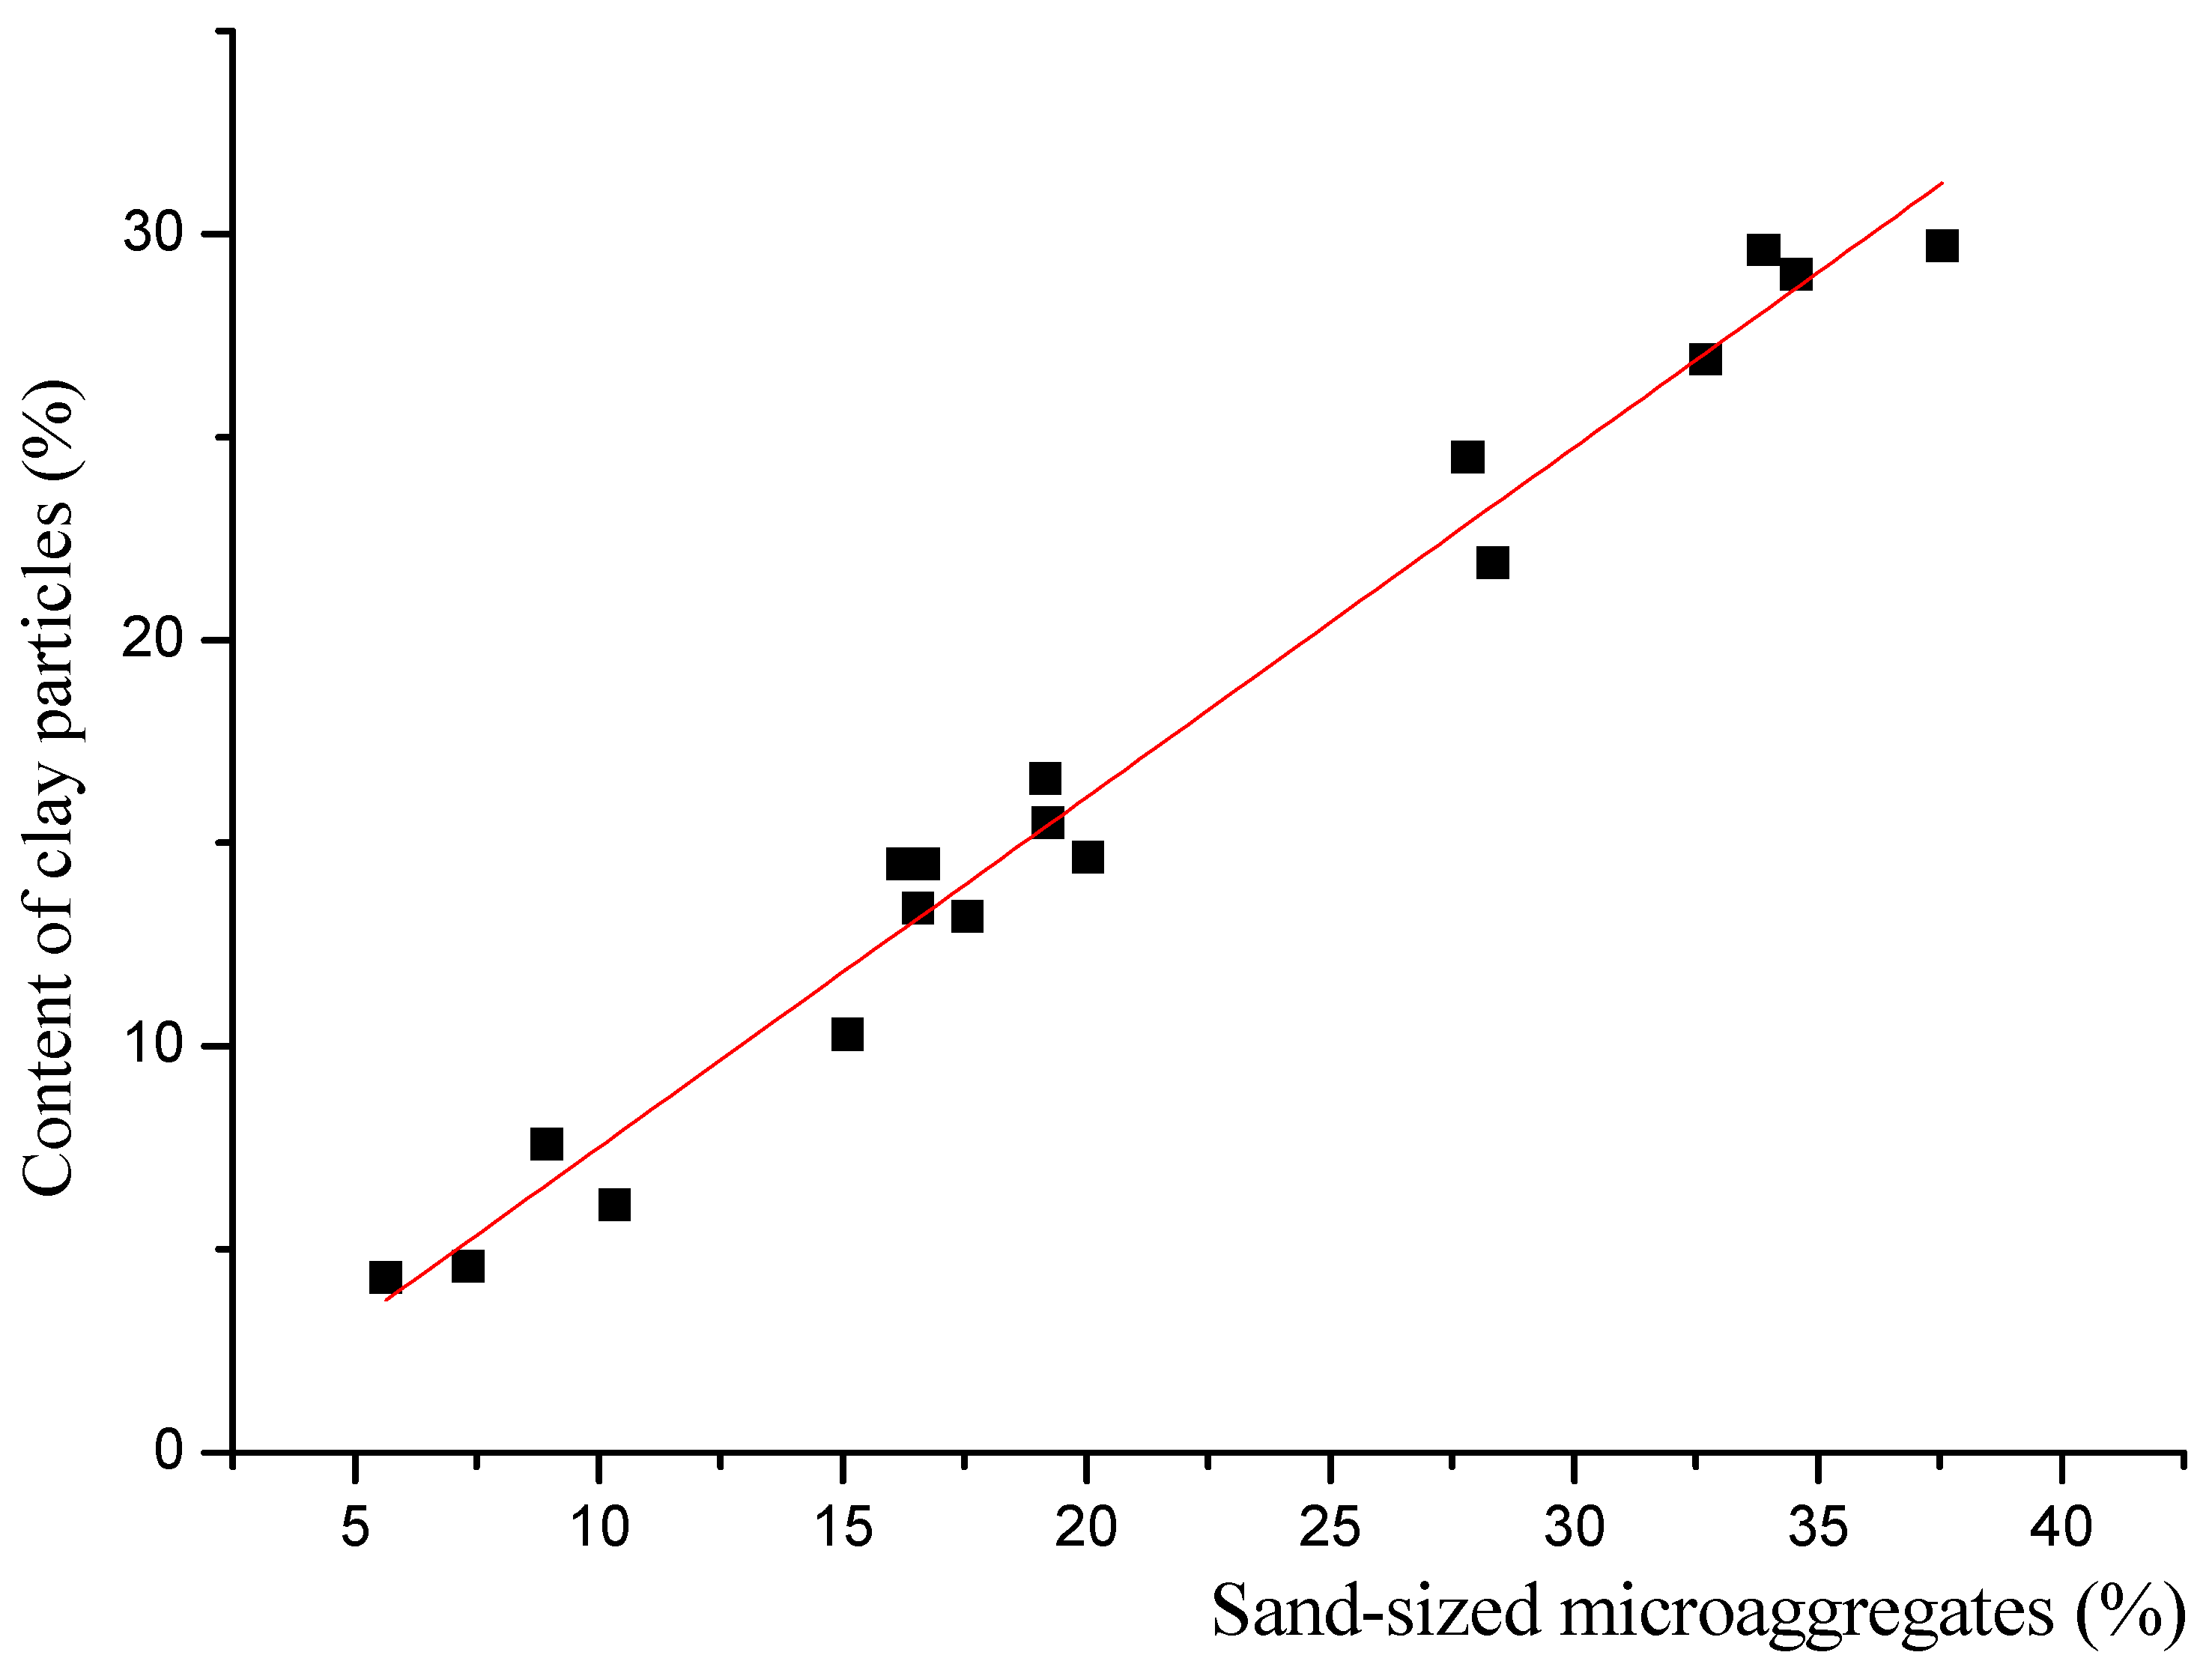
| Number of Samples (N) | m | SEm | b | SEb | r | R2 | RMSE |
|---|---|---|---|---|---|---|---|
| 18 | 0.86 | 0.031 | −1.11 | 0.69 | 0.9899 | 0.9786 | 1.25 |
| Soil | Land Use | LFfr | Unstable (Coarse) Microaggregates (50–250 μm) | Stable (Fine) Microaggregates (1–50 μm) | |||||||
|---|---|---|---|---|---|---|---|---|---|---|---|
| % C in fraction (Mean ± Standard Error) | Student Criterion | LFoc | Clayrd | Clayhd | Res | ||||||
| % C in Fraction (Mean ± Standard Error) | Student Criterion | % C in Fraction (Mean ± Standard Error) | Student Criterion | % C in Fraction (Mean ± Standard Error) | Student Criterion | % C in Fraction (Mean ± Standard Error) | Student Criterion | ||||
| Albeluvisols | Forest | 40.69 ± 1.74 | 1.66 < t = 2.12 | 23.11 ± 2.24 | 2.28 > t = 2.01 | 8.93 ± 1.80 | 1.32 > t = 2.10 | 8.80 ± 1.74 | 1.43 < t = 2.23 | 0.65 ± 0.22 | 2.90 > t = 2.23 |
| Arable | 38.08 ± 2.68 | 23.22 ± 3.86 | 6.65 ± 1.87 | 7.07 ± 1.62 | 0.30 ± 0.10 | ||||||
| Phaeozems | Forest | 39.75 ± 1.47 | 3.71 < t = 4.30 | 18.59 ± 0.52 | 1.01 < t = 4.30 | 6.05 ± 0.29 | 0.25 > t = 4.30 | n.d. | n.d. | n.d. | n.d. |
| Arable | 47.15 ± 3.63 | 20.97 ± 1.90 | 7.00 ± 0.39 | the same | the same | ||||||
| Chernozems | Steppe | 38.23 ± 3.98 | 1.54 < t = 2.23 | 24.07 ± 5.86 | 2.03 < t = 2.23 | 5.86 ± 0.65 | 0.27 > t = 2.23 | 10.95 ± 1.33 | 4.4 > t = 2.45 | 3.87 ± 0.17 | 5.72 > t = 2.45 |
| Arable | 42.01 ± 2.71 | 21.81 ± 1.46 | 5.75 ± 0.51 | 7.18 ± 1.02 | 3.06 ± 0.22 | ||||||
| B | Value | Standard Error | |
|---|---|---|---|
| Intercept | B0 | 15.94 | 1.18 |
| x | B1 | −1.05 | 0.15 |
| x2 | B2 | 0.02 | 0.004 |
| Soil | Land Use | Ctotal (%) | LFfr (% of Soil Bulk) | Unstable (Coarse) Microaggregates (50–250 μm) | Stable (Fine) Microaggregates (1–50 μm) | ||||||
|---|---|---|---|---|---|---|---|---|---|---|---|
| LFoc | Clayrd | Clayhd | Res | ||||||||
| % of Soil Bulk | % of Ctotal Microaggregates | % per Soil Bulk | % of Ctotal Microaggregates | % of Soil Bulk | % of Ctotal Microaggregates | % of Soil Bulk | % of Ctotal Microaggregates | ||||
| Albeluvisols | Forest | 2.72 ± 0.36 | 0.28 ± 0.02 | 0.88 ± 0.12 | 53.44 ± 4.26 | 0.76 ± 0.09 | 46.56 ± 4.26 | 0.25 ± 0.07 | 32.82 ± 9.55 | 0.46 ± 0.22 | 67.18 ± 9.55 |
| Arable | 1.43 ± 0.21 | 0.03 ± 0.01 | 0.41 ± 0.05 | 38.86 ± 2.60 | 0.65 ± 0.11 | 61.14 ± 2.60 | 0.14 ± 0.03 | 37.34 ± 8.23 | 0.25 ± 0.07 | 62.66 ± 8.23 | |
| Phaeozems | Forest | 2.79 ± 0.08 | 0.23 ± 0.04 | 0.78 ± 0.06 | 44.89 ± 2.34 | 0.96 ± 0.02 | 55.11 ± 2.34 | 0.82 ± 0.08 | |||
| Arable | 2.20 ± 0.03 | 0.04 ± 0.01 | 0.55 ± 0.10 | 33.72 ± 6.76 | 1.09 ± 0.13 | 66.28 ± 6.76 | 0.52 ± 0.04 | ||||
| Chernozems | Steppe | 6.08 ± 1.01 | 0.13 ± 0.07 | 1.58 ± 0.27 | 49.99 ± 1.20 | 1.58 ± 0.24 | 50.01 ± 1.20 | 1.18 ± 0.28 | 37.05 ± 5.81 | 1.97 ± 0.11 | 62.95 ± 5.81 |
| Arable | 4.35 ± 0.75 | 0.04 ± 0.01 | 0.99 ± 0.24 | 38.14 ± 4.59 | 1.56 ± 0.19 | 61.86 ± 4.59 | 0.42 ± 0.14 | 20.00 ± 6.29 | 1.64 ± 0.11 | 80.00 ± 6.29 | |
| Soil | Ctotal (%) | LFfr (% of Soil Bulk) | Unstable (Coarse) Microaggregates (50–250 μm) | Stable (Fine) Microaggregates (1–50 μm) | ||||||
|---|---|---|---|---|---|---|---|---|---|---|
| LFoc | Clayrd | Clayhd | Res | |||||||
| % of Soil Bulk | % Ctotal Microaggregates | % of Soil Bulk | % Ctotal Microaggregates | % of Soil Bulk | % Ctotal Microaggregates | % of Soil Bulk | % Ctotal Microaggregates | |||
| Albeluvisols | 6.00 > t = 2.1 | 4.86 > t = 2.1 | 6.88 > t = 2.1 | 5.73 > t = 2.1 | 1.53 < t = 2.1 | 5.73 > t = 2.1 | 3.0 > t = 2.23 | 0.70 < t = 2.23 | 2.29 > t = 2.23 | 0.70 < t = 2.23 |
| Phaeozems | 7.29 > t = 4.3 | 6.72 > t = 4.3 | 3.31 < t = 4.3 | 5.15 > t = 4.3 | 1.92 < t = 4.3 | 5.15 > t = 4.3 | 6.71 > t = 4.3 | |||
| Chernozems | 2.94 > t = 2.23 | 2.52 > t = 2.23 | 3.28 > t = 2.23 | 4.90 > t = 2.23 | 0.03 < t = 2.23 | 4.90 > t = 2.23 | 4.73 > t = 2.45 | 3.90 > t = 2.45 | 4.12 > t = 2.45 | 3.90 > t = 2.45 |
| Soil | Land Use | CLFoc/CClayrd | Cunstable/Cstable | ||
|---|---|---|---|---|---|
| Mean ± Standard Error | Student Criterion | Mean ± Standard Error | Student Criterion | ||
| Albeluvisols | Forest | 1.1 ± 0.3 | 5.0 > t = 2.10 | 2.2 ± 0.4 | 3.1 > t = 2.10 |
| Arable | 0.6 ± 0.1 | 3.0 ± 0.4 | |||
| Phaeozems | Forest | 0.8 ± 0.1 | 5.0 > t = 4.30 | 2.2 ± 0.7 | 2.8 < t = 4.30 |
| Arable | 0.5 ± 0.1 | 3.2 ± 0.2 | |||
| Chernozems | Steppe | 1.0 ± 0.0 | 5.3 > t = 2.23 | 1.0 ± 0.1 | 3.7 > t = 2.23 |
| Arable | 0.6 ± 0.1 | 1.5 ± 0.2 | |||
| Soil | Land Use | LFfr | Unstable (Coarse) Microaggregates (50–250 μm) | Stable (Fine) Microaggregates (1–50 μm) | |||||||
|---|---|---|---|---|---|---|---|---|---|---|---|
| % of Total Soil C (Mean ± Standard Error) | Student Criterion | LFoc | Clayrd | Clayhd | Res | ||||||
| % of Total Soil C (Mean ± Standard Error) | Student Criterion | % of Total Soil C (Mean ± Standard Error) | Student Criterion | % of Total Soil C (Mean ± Standard Error) | Student Criterion | % of Total Soil C (Mean ± Standard Error) | Student Criterion | ||||
| Albeluvisols | Forest | 9.89 ± 2.96 | 5.39 > t = 2.10 | 32.75 ± 3.74 | 2.02 < t = 2.10 | 28.41 ± 2.99 | 2.02 < t = 2.10 | 9.43 ± 2.42 | 0.01 < t = 2.23 | 19.85 ± 3.91 | 1.48 < t = 2.23 |
| Arable | 2.28 ± 1.12 | 28.47 ± 1.83 | 44.87 ± 2.47 | 9.44 ± 2.05 | 16.06 ± 3.15 | ||||||
| Phaeozems | Forest | 8.26 ± 1.64 | 3.21 < t = 4.30 | 27.99 ± 1.30 | 1.44 < t = 4.30 | 34.36 ± 1.65 | 1.44 < t = 4.30 | n.d. | n.d. | n.d. | n.d. |
| Arable | 1.83 ± 1.04 | 25.10 ± 4.93 | 49.40 ± 5.26 | ||||||||
| Chernozems | Steppe | 2.06 ± 1.09 | 2.09 < t = 2.23 | 26.03 ± 0.47 | 3.00 > t = 2.23 | 26.07 ± 1.34 | 3.00 > t = 2.23 | 17.07 ± 2.58 | 4.56 > t = 2.45 | 29.05 ± 3.00 | 3.00 > t = 2.45 |
| Arable | 0.84 ± 0.32 | 22.39 ± 2.33 | 36.50 ± 3.71 | 8.34 ± 2.72 | 33.25 ± 2.40 | ||||||
© 2016 by the authors; licensee MDPI, Basel, Switzerland. This article is an open access article distributed under the terms and conditions of the Creative Commons Attribution (CC-BY) license (http://creativecommons.org/licenses/by/4.0/).
Share and Cite
Artemyeva, Z.S.; Kogut, B.M. The Effect of Tillage on Organic Carbon Stabilization in Microaggregates in Different Climatic Zones of European Russia. Agriculture 2016, 6, 63. https://doi.org/10.3390/agriculture6040063
Artemyeva ZS, Kogut BM. The Effect of Tillage on Organic Carbon Stabilization in Microaggregates in Different Climatic Zones of European Russia. Agriculture. 2016; 6(4):63. https://doi.org/10.3390/agriculture6040063
Chicago/Turabian StyleArtemyeva, Zinaida S., and Boris M. Kogut. 2016. "The Effect of Tillage on Organic Carbon Stabilization in Microaggregates in Different Climatic Zones of European Russia" Agriculture 6, no. 4: 63. https://doi.org/10.3390/agriculture6040063