Exploring the Future Potential of Jute in Bangladesh
by
 , ,
, ,
Sanzidur Rahman
1,* ,
,
Mohammad Mizanul Haque Kazal
2,† ,
,
Ismat Ara Begum
3,† and
Mohammad Jahangir Alam
4,†
1
School of Geography, Earth and Environmental Sciences, University of Plymouth, Plymouth PL4 8AA, UK
2
Department of Development and Poverty Studies, Sher-e-Bangla Agricultural University, Dhaka 1207, Bangladesh
3
Department of Agricultural Economics, Bangladesh Agricultural University, Mymensingh 2202, Bangladesh
4
Department of Agribusiness and Marketing, Bangladesh Agricultural University, Mymensingh 2202, Bangladesh
*
Author to whom correspondence should be addressed.
†
These authors contributed equally to this work.
Agriculture 2017, 7(12), 96; https://doi.org/10.3390/agriculture7120096
Submission received: 17 September 2017
/
Revised: 23 November 2017
/
Accepted: 24 November 2017
/
Published: 25 November 2017
Abstract
:The study assesses the future potential of the jute sector in Bangladesh by examining its growth performance, international competitiveness, profitability, and production efficiency using national time-series data of over the period 1973–2013 and farm survey data from 289 farmers from two major jute growing areas of Bangladesh. Results revealed that the jute sector has experienced substantial growth in area, production, productivity, prices, and exports. However, productivity has stagnated during the latter 10-year period (2004–2013), while it grew at a rate of 1.3% per annum (p.a.) during the first 31-year period (1973–2003). Only traditional jute production is globally competitive, although financial profitability of white jute is relatively higher (benefit cost ratio = 1.24 and 1.17, respectively). Land, labor, and irrigation are the main productivity drivers for jute. The mean production efficiency of jute is estimated at 75% indicating substantial scope to improve yield by eliminating inefficiency. Marginal farmers are relatively inefficient. Policy implications include investments in research and development, irrigation, and tenurial reform and export protection for white jute in order to revive the sector and boost export earnings.
1. Introduction
Jute, known as the golden fiber, is an important traditional cash crop in Bangladesh. In fact, jute is the second most important natural fiber in terms of global consumption after cotton [1]. Although there are more than 40 species of jute available, only two species are cultivated commercially, namely, Corchorus capsularis L. (commonly known as white jute) and C. olitorius L. (commonly known as Tossa/traditional jute). The planting time varies slightly between these two types of jute. The traditional, or Tossa, jute, which grows in low-lying land, is planted during March and April, and the white jute during April and May in Bangladesh. One of the important characteristics of jute is that it is free from health hazards and environmental pollution [2]. Jute is also versatile, durable, reusable, cheap, and superior to synthetic fibers. Other major advantages of jute is that it is agro-based, produced annually, renewable, and biodegradable [1]. Jute is regarded as the best natural substitute for nylon and polypropylene. Although jute has been recognized as a solution to produce eco-friendly products for the future [3], the production of jute and jute products are actually declining globally. This is mainly due to the availability of plastic substitutes, which is likely to continue in the future [4]. Europe, as well as China, have experienced a slow erosion of the market for jute products, particularly sacks and bags, while India still consumes over half of the world’s production of jute products [4].
Bangladesh and India are the two major jute-growing countries, contributing almost 85% of the world jute production and area cultivated [5]. Bangladesh contributes nearly 39% of total raw jute supply cultivated on 39% of the total global jute area, with an average yield of 1.53 t ha−1 during the period 1961–2002 [5]. Jute used to be a dominant export item in Bangladesh during the early years of independence, but its importance has declined gradually. Nevertheless, with over 2.5 million tons of fiber being grown per annum, the processing industry remains a major business in Bangladesh and India [4].
The Jute Sector in Bangladesh: History, Challenges, and Policy Developments
Jute has been an integral part of the culture of Bengal for centuries, primarily in the southwest of Bangladesh and parts of West Bengal. Bangladeshi farmers take pride in producing jute, which they call ‘sonali ansh’ (the golden fiber). Bangladesh actually produces the finest-quality natural jute fiber. The history of jute trading goes back to colonial times when the British East India Company was the first to trade in jute. The East India Company exported its first consignment of jute in 1793 and continued trading until the 19th century. During the 20th century, the company started trading raw jute with the jute industry in Dundee, Scotland. Jute products (e.g., sacks, bags, hessian for carpet backing, etc.) provide higher value added than raw jute, which necessitated the establishment of processing industries. The first jute mill was set up in 1855 near the bank of Hoogly River, Kolkata, India, and more mills followed in the West Bengal region well into the 1900s. However, after the partition of India in 1947, Bangladesh (then, East Pakistan) was left with the finest quality of raw jute stocks, while the major jute mills needed to process those raw jute remained on the other side of the border in West Bengal, India. This has led to the need to set up jute processing industries in Bangladesh.
Bangladesh used to enjoy a monopoly position in the production and marketing of jute during 1950s and 1960s. Currently, such a monopoly position does not exist because of competition from India, China, Uzbekistan, and Nepal. However, the country is still the second largest producer of jute after India, and jute has been a prominent export item for Bangladesh since the 1950s. However, the jute industry in Bangladesh went through major upheavals over time. The jute industry was supported by both implicit and explicit government subsidies during the early years, which were later discontinued. For example, the export bonus scheme, introduced in 1959, was discontinued in the 1970s [6]. Furthermore, the direct incentives provided to the export-oriented private enterprises in terms of tax relief on imports of machineries and equipment to support the industrialization of the nation were not extended to the jute sector.
Finally, due to a fall in jute demand worldwide during the 1990s, and recurring losses in publicly-owned jute mills, the government signed an agreement with the World Bank/IDA during 1994 to reform the jute sector, which mainly translated into: (1) closing nine of the 29 jute mills and downsizing two large publicly-owned jute mills; (2) retrenchment of about 20,000 jute workers of publicly-owned jute mills to other public sectors; and (3) privatization of 18 of the remaining 20 jute mills [6]. The process of such adjustment finally culminated in the closure of the flagship Adamjee Jute Mills on 24 June 2002, based on the claim that it had incurred a loss of BDT 12 billion (i.e., USD 35 million) over its 30 years of existence, which effectively brought the jute industry to a close. However, such closure of the key jute mills was criticized. This is because the reported losses were largely due to the lack of institutional support and modernization of these jute mills, which were essential to keep them competitive in the global market. Instead, the reported losses were attributed to corruption, mismanagement, and inefficiency in the processing of jute [6].
Later, in order to revive the jute industry, Bangladesh produced a National Jute Policy 2011, which has the following objectives: (a) increase jute production in response to national and international demand; (b) land use planning for jute; (c) produce high quality jute seeds and distribute these to farmers; (d) develop modern varieties of jute and encourage adoption by farmers; (e) protect the market for jute and jute products to increase foreign exchange earnings; (f) develop modern equipment and improve existing jute processing mills; (g) encourage diversified use of jute; (h) increase interaction and institutional linkages amongst jute and jute seed producers, traders, jute industries, and the Bangladesh Jute Research Institute; and (i) strengthen the Management Information System (MIS) of the jute sector [7]. Furthermore, to enhance the sector, the government has proposed a Draft National Jute Policy 2014, which has the following additional objectives: (j) establish composite jute mills to produce high-quality fabric from jute; (k) establish professional design institute to develop various designs of jute and jute products to meet international demand; (l) automation of the MIS of the jute sector; and (m) prioritize the jute sector in the National Export Policy of Bangladesh [7]. The vision of the Draft National Jute Policy 2014 specifies reopening all of the closed jute mills, the modernization of the mills, and establishing jute as the second most important export item by 2021 [7]. However, the Draft National Jute Policy 2014 has not been finalized yet.
Farmers in Bangladesh grow several crops in conjunction with rice as a staple in order to fulfil the dual role of meeting subsistence, as well as cash, needs [8]. It has been widely recognized that, under non-irrigated or semi-irrigated conditions, better farming practices and varietal improvements in non-cereal crops (e.g., jute, potato, vegetables, oilseeds, and spices) will be more profitable and could lead to crop diversification as a successful strategy for the future growth and sustainability of Bangladeshi agriculture [9,10,11].
There is a dearth of information about the jute sector in Bangladesh. Recently Rahman [12] noted that the area under jute remained stagnant during the period 1960–1985 and then declined at the rate of 0.3% per annum (p.a.) (p < 0.01) during the period 1986–2006, but the yield per ha increased marginally at the rate of 0.1% p.a. (p < 0.01) for the same period. Similarly, Gupta et al. [5] concluded that both Bangladesh and India demonstrated a declining trend in jute area, production, and productivity during the period 1961–2002, although Bangladesh has the potential to increase production through expanding the jute area, as well as improving productivity. The main reason behind the declining share of jute area in Bangladesh is the competition for land of high yielding varieties (HYVs) of rice, as well as falling demand in the market due to the increase in the use of synthetic fibers. Bangladesh, once at the forefront in the production and export of jute during the 1960s, can potentially regain its position and contribute positively to replace/reduce synthetic fiber use, as well as raise export earnings. However, a revival of jute will only be possible if the sector is globally competitive, profitable, and efficient. However, little is known about the sectors’ performance with respect to its international competitiveness, profitability, and efficiency.
Given the dearth of information about the prospect of the jute sector, the present study specifically addresses this critical research gap and systematically examines the growth performance of the jute sector over time and determines its profitability, drivers of productivity, and production efficiency at the farm level in Bangladesh. The study uses a combination of national time-series data covering a 41-year period (1973–2013) and an in-depth farm survey data of 289 jute growers from two major jute-growing regions (Kishoreganj and Faridpur) to address the following specific objectives: (i) to examine trends in area, production, productivity, prices, and export of jute over time; (ii) to assess global competitiveness of the jute sector; (iii) to assess financial profitability of producing jute at the farm level; and (iv) to identify the drivers of productivity and technical efficiency of jute production at the farm level.
2. Methodology
We apply a range of analytical tools to address the four key research objectives. These include: (a) computation of annual compound growth rates of key indicators of performance; (b) construction of a policy analysis matrix (PAM) and computation of selected ratio indicators to measure the global competitiveness of the sector; (c) a cost-benefit analysis (CBA) to determine the financial profitability of jute production at the farm level; and (d) a stochastic production frontier (SFA) approach to estimate the productivity and technical efficiency of jute production and its drivers at the farm level. The details are as follows.
2.1. Trend Analysis of the Jute Sector
Average annual compound growth rates were computed in order to determine the rate of change of the variable of interest (i.e., cultivated area, total production, yield, harvest price, and value of jute exported). The growth rates were computed using a semi-logarithmic trend function: lnY = α + βT, where Y is the target variable, T is time, ln is the natural logarithm, and β is the growth rate.
2.2. Analysis of Competitiveness of Jute
A PAM framework was utilized to analyze the competitiveness and economic efficiency of jute production. The PAM framework is particularly useful in identifying the appropriate direction of change in policy [13] and is commonly used for policy analysis [14,15,16,17,18]. The process uses two enterprise budgets, one valued at market prices and the other valued at social prices (Table 1). Profit in the PAM framework is defined as the difference between the total (or per unit) revenues minus total production costs [19]. Each PAM consists of two cost columns, one for the tradable inputs and the other for domestically produced factors. The matrix presents an array of symbols or letters which define accounting relationships across the columns of the matrix and down the rows of the matrix. Such relationships are termed as identities [19].
The following variables make up the indicators of the PAM shown in Table 1.
| Prices: | Pid = domestic price of output i; |
| Pjd = domestic price of tradable input j; | |
| Pib = international price of output i; | |
| Pjb = international price of tradable input j; | |
| Pnd = market price of non-tradable input n; | |
| Pns = shadow price of non-tradable input n; | |
| Quantities: | Qi = quantity of output; |
| Qj = quantity of tradable input; | |
| Qn = quantity of non-tradable input; | |
| Revenue at private prices: | A = Pid × Qi; |
| Tradable inputs at private prices: | B = Pjd × Qj; |
| Domestic factors at private prices: | C = Pnd × Qn; |
| Revenue at social prices: | E = Pib × Qi; |
| Tradable inputs at social prices: | F = Pjb × Qj; |
| Domestic factors at social prices: | G = Pns × Qn; [14]. |
The indicators in the first row of Table 1 provide a measure of private profitability (D), or competitiveness, and is defined as the difference between observed revenue (A) and costs (B + C). Private profitability demonstrates the competitiveness of the system, given current technologies, prices of inputs and outputs, and policy interventions and market failures. The second row of the matrix calculates the measure of social profitability (H) defined as the difference between social revenue (E) and costs (F + G). Social profitability measures economic efficiency/comparative advantage of the system [14].
To estimate social prices, the inputs used were divided into two categories: (a) tradable intermediate inputs; and (b) non-tradable intermediate inputs. The tradable intermediate inputs were different types of fertilizers and irrigation equipment. We have used an import parity price by converting the FOB price to CIF at the Chittagong port by adding the freight cost to FOB prices of fertilizers (for details, please see Molla et al. [20]). Since, detailed cost of production for irrigation equipment are not available, it was not considered. For the non-tradable intermediate inputs, such as agricultural labor, machinery, seed, organic manure, insecticides, cultivated land, irrigation fees, and interest on operating capital, we have applied domestic costs adjusted with specific conversion factors (SCF) for each input (for details of full social costs and SCF, see Kazal et al. [2]; Shahabuddin and Dorosh, [21]). The opportunity cost of operating capital was calculated at an interest rate of 10% for the duration of the jute production period [14].
2.3. Ratio Indicators of Competitiveness
The PAM framework can also be used to calculate important indicators for policy analysis. Popular measures of global competitiveness are: the nominal protection coefficient (NPC) and effective protection coefficient (EPC). We apply the NPC on output (NPCO) and input (NPCI), as well as the EPC to determine the competitiveness of jute. These are defined as follows:
- (a)
- Nominal Protection Coefficient on Output (NPCO): This ratio shows the extent to which domestic prices for output differ from international reference prices. NPCO > 1 means that the domestic farm gate price is greater than the world price of output and is uncompetitive [22]. On the contrary, if NPCO < 1, the production system is competitive. NPCO is expressed as [14]:NPCO = (Pid × Qi)/(Pib × Qi)
- (b)
- Nominal Protection Coefficient on Input (NPCI): This ratio shows how much domestic prices for tradable inputs differ from their social prices. If NPCI > 1, the domestic input cost is greater than the comparable world prices and the system is unprotected by policy. If NPCI < 1, the system is protected by policy. NPCI is defined as follows [14]:NPCI = (Pjd × Qj)/(Pjb × Qj)
- (c)
- Effective Protection Coefficient (EPC): EPC is the ratio of value added in private prices (A–B) to value added in social prices (E–F). An EPC > 1 suggests that government policy protects the producers, while EPC < 1 indicates that producers are unprotected through policy interventions. EPC is expressed as [14]:EPC = {(Pid × Qi) − (Pjd × Qj)}/{(Pib × Qi) − (Pjb × Qj)}
2.4. Profitability Analysis of Jute
Profitability or CBA includes calculation of detailed financial costs of production and returns from jute on a per hectare basis. The total cost (TC) is composed of total variable costs (TVC) and total fixed costs (TFC) [23]. TVC includes costs of human labor (both family-supplied and hired labor, wherein the cost of family-supplied labor was estimated by imputing a market wage rate), mechanical power; seed; manure; chemical fertilizers; pesticides; and irrigation. TFC includes land rent (if owned land was used, and then the imputed value of a market rate of land rent was applied) and interest on operating capital. The gross return (GR) was computed as total jute output multiplied by the market price of jute. Profit or gross margin (GM) was computed as GR–TVC, whereas the net return (NR) was computed as GR–TC. Finally, the benefit cost ratio (BCR) was computed as GR/TC [14].
2.5. The Stochastic Production Frontier Approach to Analyse the Productivity and Efficiency of Jute
The SFA approach, developed by Aigner et al. [24], is utilized in this study. The stochastic production frontier for the ith farmer is written as:
where Yi is the output, Xi is the vector of physical inputs, vi is assumed to be an independently and identically distributed N(0,σv2) two-sided random error, independent of ui; and ui is a non-negative random variable associated with inefficiency in production which is assumed to be independently distributed as a truncation at zero of the normal distribution with a mean Ziδ, and variance σu2 (|N(Ziδ,σu2|), where Zi are the correlates of inefficiencies on farm i. In this formulation, output is assumed to be strictly monotonically increasing in response to an increase in physical inputs.
In determining the predictors of production efficiency, we use the single-stage approach proposed by Battese and Coelli [25] wherein the technical inefficiency parameter is related to a vector of farm-specific managerial and household characteristics subject to statistical error, such that:
where, Zi are the farm-specific managerial and household characteristics and the error ζi is distributed as . Since , so that the distribution of ζi is truncated from below at the variable truncation point, –Ziδ.
The production efficiency of farm i in the context of the stochastic frontier production function is defined as:
where E is the expectation operator. This is achieved by obtaining the expressions for the conditional expectation ui upon the observed value of ξi, where ξi = vi − ui. The method of maximum likelihood is used to estimate the unknown parameters, with the stochastic frontier and the inefficiency effects functions estimated simultaneously. The likelihood function is expressed in terms of the variance parameters, σ2 = σv2 + σu2 and γ = σu2/σ2 [25].
2.6. Data and the Study Area
Two sets of data were used for this study. The first set is the national time-series data on area under jute, total production, yield, price, and the value of export for Bangladesh covering the available 41-year period (1973–2013). The principal sources are the annual publications of the Yearbook of Agricultural Statistics [26] and monthly publication of economic trends by the Bangladesh Bank [27]. The second set of data used to analyze competitiveness, profitability, and production efficiency at the farm level was taken from a recently completed NFPCSP-FAO project [2]. The data was collected during February–May 2012 through an extensive farm survey. Although the NFPCSP-FAO project covered 17 districts (or 20 sub-districts) of Bangladesh, data on jute production was collected in only two districts. These were Kishoreganj district, in the central region, and Faridpur district, in the south-central region. A multistage stratified random sampling technique was employed. At the first stage, districts where the specified crops are dominant were selected, which includes jute as one of the crops. At the second stage, sub-districts (upazilla) were selected according to the highest concentration of jute in terms of area cultivated based on information from the district offices of the Directorate of Agricultural Extension (DAE). At the third stage, unions were selected using same criteria at the union/block level, which was obtained from the upazilla offices of the DAE. Finally, the farmers were selected at random from the villages with the same criteria classified by three standard farm size categories. These were: marginal farms (farm size 50–100 decimals), small farms (101–250 decimals), and medium/large farms (>251 decimals). A total of 289 jute producing households (89 marginal farms, 102 small farms, and 98 medium/large farms) located in 32 villages were interviewed, which forms the total sample size for this study. The questionnaire used was pre-tested in the Tangail district prior to finalization. The survey was carried out by trained enumerators who were the graduate students of Sher-e-Bangla Agricultural University, Dhaka and/or Bangladesh Agricultural University, Mymensingh [2,14].
2.7. Empirical Specification of the Stochastic Production Frontier Model
The empirical model is specified with a flexible Translog stochastic production frontier function allowing for all possible interactions amongst inputs. The model is written as:
and:
3. Results and Discussion
3.1. Trends in the Jute Sector over the Past Four Decades (1973–2013)
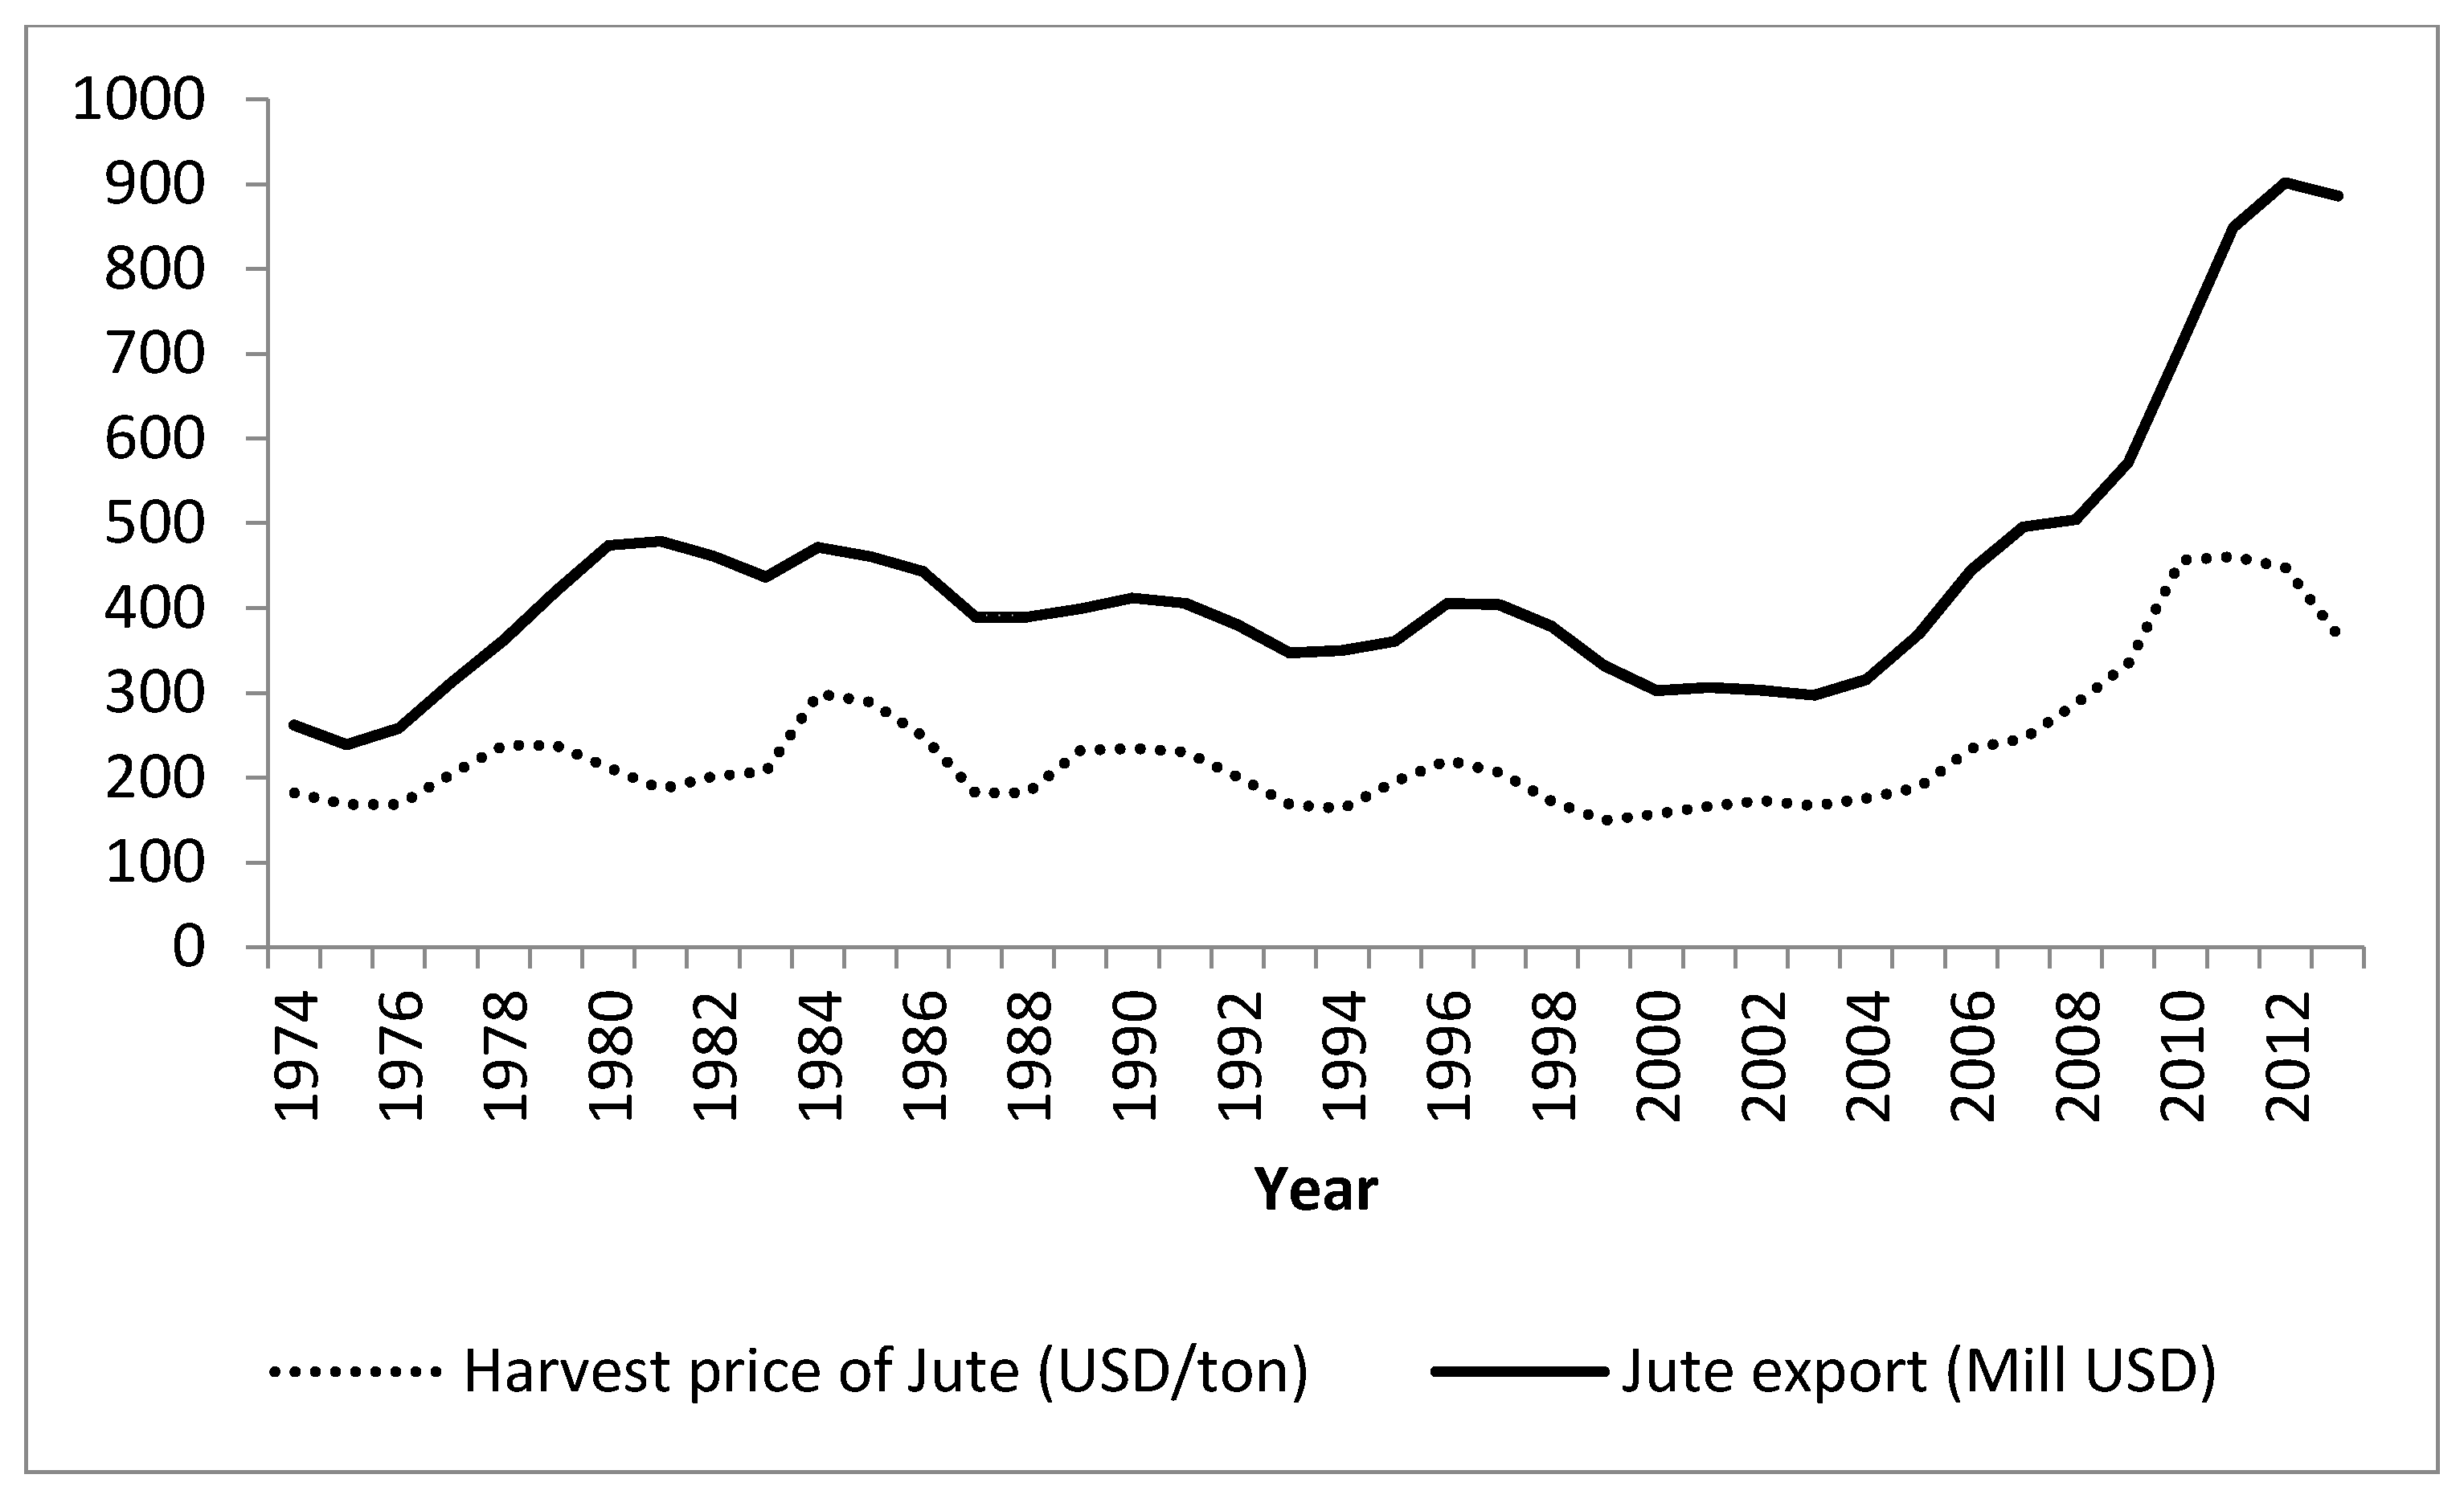
In order to avoid cyclical factors in the time-series data, the series were first transformed into three-year moving averages [5]. Figure 1 and Figure 2 present the trends of area cultivated, total production, productivity, harvest price, and value of export of jute covering a 41-year period (1973–2013). The average values and the corresponding growth rates are presented in Table 2. These were computed for three periods: (a) the first 31 years (1973–2003) when synthetic fiber and plastic use took hold widely; (b) the latter 10 years (2004–2013), which is the period when the awareness of the damaging effect of the excessive use of synthetic fibers and plastics gained worldwide attention; and (c) the overall performance over the 41 years under consideration (1973–2013). Table 2 shows that, except land area under jute, the average values of total production, yield, price and export have increased substantially during the latter 10 years (i.e., the 2004–2013 period). This period has seen high growth in the jute area at a rate of 7.3% p.a., and in production at a rate of 7.7% p.a. but with no improvement in yield, which is quite puzzling. The reason may be the high variability in yield rate during this 10 year period. Similarly, the growth in harvest price and value of exports were even higher, at a rate of 11.0% and 12.1% p.a., respectively. Overall, the jute area has declined at a rate of 1.2% p.a. and the total production, harvest price, and export remained stagnant, but yield increased at a rate of 1.3% p.a. mainly due to consistent growth in yield during the first 31 year period (1973–2003). The overall performance of the latter 10 years (2004–2013) lends support to Gupta et al.’s [5] claim that Bangladesh has the potential to improve land area, as well as the productivity of jute, in the future.
3.2. Competitiveness of Jute
A country should specialize in producing commodities in which it is competitive in the global market [22]. Jute used to be the main export crop of Bangladesh because it had comparative advantage in the past. In a recent study, Molla et al. [20] noted that jute production is more profitable financially than Aus rice (pre-monsoon season rice) and has comparative advantage for import substitution. Table 3 presents the results of the competitiveness analysis of jute. It is interesting to note that all of the sampled farmers in Kishoreganj produced only traditional or Tossa jute, whereas all the farmers in Faridpur produced only white jute. Both the tradable inputs and domestic factor costs at social prices are higher in Faridpur when compared with Kishoreganj because jute production in Faridpur is characterized by the high cost of labor and land rents. As a result, social profits are negative for Faridpur. Analysis of NPCO, NPCI, and EPC shows that the white jute producers in Faridpur are uncompetitive and are protected or subsidized by government policy, while the traditional jute producers are competitive. For example, the domestic price of white jute production is 26% higher than the world price, i.e., NPCO = 1.26 (Table 3). Profit from traditional jute production at social prices is estimated at BDT 7649.60, which is very close to the estimate of Molla et al. [20] at BDT 7826.67.
3.3. Financial Profitability of Jute
The financial profitability of jute production by 289 jute producers at the farm-level were analysed and the results are presented in Table 4. Table 4 clearly shows that there is a significant price difference between the two types of jute produced. The sale price of white jute is higher than that of traditional jute. Although all cost elements are higher for white jute producers, the BCR remains higher than traditional jute production mainly due to higher yield as well as the higher price of white jute. The key conclusion is that both traditional and white jute production are profitable. However, the variation in net returns for traditional and white jute production by farm size category is not statistically significant (results not shown), implying that farm size does not matter in determining the financial profitability of jute production. The level of profitability (i.e., BCR) of white jute production is closely comparable to producing HYV rice, HYV wheat and mustard [2], implying that the production of jute can compete with the main staples in Bangladesh on financial terms.
3.4. Production Structure and Drivers of Jute Productivity
A maximum likelihood estimation (MLE) procedure was used to estimate the parameters of the stochastic frontier production function and the inefficiency effects model jointly in a single stage using STATA Version 8 (StataCorp, LLC, College Station, TX, USA) [28]. Prior to discussing the results of the production frontier and the inefficiency effects model, we report the series of hypothesis tests conducted to select the functional form and to decide whether the frontier model is an appropriate choice. The first test was conducted to determine the appropriate functional form, i.e., the choice between a Cobb-Douglas or a translog functional form (H0: β11 = β22 = … = β67 = 0). The result indicated non-linearities in the production function and, hence, the choice of flexible translog functional form is a better representation of the true production structure when compared with a more restricted Cobb-Douglas form (Table 5).
Next we check the sign of the third moment and the skewness of the OLS residuals of the data in order to justify use of the stochastic frontier framework (and hence the MLE procedure) (In the stochastic frontier framework, the third moment is also the third sample moment of the ui. Therefore, if it is negative, it implies that the OLS residuals are negatively skewed and technical inefficiency is present [29]). The computed value of Coelli’s [30] standard normal skewness statistic (M3T) based on the third moment of the OLS residuals was estimated at 25.26 (Table 5) which was tested against H0: M3T = 0. The null hypothesis of ‘no inefficiency component’ was strongly rejected implying that the choice of stochastic frontier approach was justified. The coefficient of γ reported in the mid-panel of Table 6 also confirms the strong presence of technical inefficiency. The value of γ ranges between 0 to 1, with 0 denoting no inefficiency and 1 being perfectly inefficient.
Next, we determine whether the variables introduced as inefficiency effects improve the explanatory power of the model. The null hypothesis (H0: δ1 = δ2 = … = δ6 = 0) was strongly rejected at the 1% level, implying that the distributions of inefficiencies were not identical across individual observations.
A total of 50% of the coefficients on the production variables are significantly different from zero at the 10% level at least, implying a good fit. All the input variables were mean corrected prior to estimation . Therefore, the coefficients on the first order terms of the input variables can be read directly as elasticities. Land is the most dominant input, followed by labor and irrigation in jute production (Table 6). The value of the coefficient is 0.69 implying that a one percent increase in land area will increase jute production by 0.69%, which is substantial. Although jute occasionally requires supplementary irrigation, farmers producing white jute tend to irrigate their jute crop to ensure higher productivity, which is reflected by the large difference in the cost of machinery input in Table 5 above. The negative coefficients on the seed and organic manure variables are not significantly different from zero and may not be the true relationship. The returns to scale in jute production was estimated at 0.87, which is less than unity. The null hypothesis of constant returns to scale (H0: α1 + α2 + … + α5 = 1) in jute production was rejected in favor of decreasing returns to scale (Table 5) implying that farmers were not operating at the optimal scale.
3.5. Drivers of Technical Inefficiency in Jute Production
The mean technical efficiency level in jute production was estimated at 0.75, which implies that production can be increased by 25 points by eliminating inefficiency (Table 7). The distribution of efficiency is very wide and variable with a minimum efficiency level of 0.09 and a maximum of 0.99. A total of 39.1% of the farmers are operating at an efficiency level below 0.70, which is very high given that jute production has been a traditional farming activity in Bangladesh for many years. However, the mean level of efficiency in jute production is closely comparable to efficiency in rice and wheat production in Bangladesh [31,32] and elsewhere in developing economies [33].
The lower panel of Table 6 reports the drivers of technical inefficiency in jute production. Marginal farmers seem to be relatively inefficient when compared with the medium/large farms whose effect is subsumed in the intercept term. The mean technical efficiency of marginal farms was significantly lower by six and five points (p < 0.10) as compared with the small and medium/large farms, respectively (Table 6). Farm households who are involved with non-governmental organizations (NGOs) are relatively inefficient. The mean technical efficiency of farm households with no involvement in NGOs were 12 points higher than those who were members of NGOs (p < 0.01) (Table 7). This may be because NGOs largely focus on and train their members to diversify their work portfolio into off-farm and/or non-farm sources, which do not necessarily support the technical skills of producing jute or any other crops. Land fragmentation does not pose any constraint on production efficiency, although Rahman and Rahman [33] have reported the significant influence of this variable on rice production efficiency.
4. Discussion and Policy Implications
The jute sector in Bangladesh went through major upheavals over time due to a host of factors, some of which were not under the control of the producers. As mentioned earlier, the partition of India in 1947 into the-then East Pakistan (now Bangladesh) and West Pakistan (now Pakistan), resulted in the location of most of the jute mills in West Bengal (i.e., India) whereas four-fifths of the land under jute production were in East Bengal (i.e., Bangladesh). This left the jute mills in West Bengal with a serious shortage of the raw product and jute farmers in Bangladesh with no market due to the lack of processing facilities. The next challenge the jute sector faced was the drive towards the use of synthetic fibers worldwide to replace jute and jute products during the 1970s, 1980s, and 1990s, which saw a major decline in jute trade during the period 1961–2003 and showed a sign of an increase after that period. For example, worldwide jute import and export have declined steadily at rates of 3.5% and 2.5% over the 43-year period (1961–2003), respectively (analysis was conducted using the FAOSTAT database covering a 53-year period (1961–2013) using three-year moving averages to compute the average annual compound growth rates (see Section 2.1 for methodology)) [34]. Later jute imports worldwide have increased at a rate of 2.5% p.a. during the period 2004–2013 with no improvement in jute exports.
Nevertheless, the jute sector in Bangladesh has survived these major pressures, albeit with variable outcomes, thereby requiring a fresh analysis to assess its potential to support economic growth. This was achieved by: systematically examining trends in the growth of jute area, production, prices, and export earnings over a 41-year period (1973–2013); determining the competitiveness of jute in the global market; examining the financial profitability at the farm level; and identifying the drivers of productivity and efficiency at the farm level.
The results revealed that the jute sector in Bangladesh seems to have recovered to some extent during the period 2004–2013 as demonstrated by the sharp growth in area cultivated, total production, harvest prices, and value of export of jute and jute products, but with no improvement in productivity. The productivity growth was observed during the first 31-year period (1973–2003) instead. The competitiveness of jute in Bangladesh is, however, variable, as white jute production was protected by the policy while traditional jute producers were exposed to competition. For example, the domestic price of jute production was 26% higher than the world price. Both traditional, as well as white jute production was financially profitable (BCR 1.17 and 1.24, respectively) and can clearly compete with the main staples of Bangladesh in terms of profitability. Land, labor, and irrigation were the major drivers of jute productivity, with land being the most dominant input (output elasticity value of 0.69). However, the jute farmers were operating at a sub-optimal scale. Production efficiency of jute was estimated at 75%, which is closely comparable to the efficiency level of producing the main staples of rice and/or wheat in Bangladesh. Nevertheless, there is substantial scope to improve jute output up to 25% by eliminating technical inefficiency. Marginal farmers, who were the majority of the farming population, are relatively inefficient as compared with the medium/large farmers.
The key conclusion emerging from this study is that the jute sector can be revived and has the potential to be the cash crop of the future in Bangladesh. However, a number of policy measures are necessary in order to revive the jute sector. Therefore, based on the results of this study, the following policy measures are suggested. First, investment in R and D is essential to replace low yielding traditional jute varieties with modern jute varieties to improve jute productivity. The Bangladesh Jute Research Institute (BJRI) is entrusted with improving jute production and productivity through R and D and, so far, has developed only six varieties of white jute and eight varieties of traditional jute [35]. The release date of the latest varieties of white jute (Tossa jute #6) and traditional jute (Deshi jute #8) from the research station is 2013, which are yet to be widely adopted at the farm level. The most popular varieties of traditional and white jute adopted and produced at the farm level were those released during 1995 and/or 2008, with potential yields between 2.5 and 4.5 t ha−1 on average [35], which perhaps explains low productivity at the farm level (see Table 4). Nevertheless, in order to revive jute as a major cash crop for the future, BJRI should aim to enhance their R and D activities and release newer varieties that are suited to the changing climatic conditions. Higher productivity of jute will not only increase financial profitability, but will also synergistically improve competitiveness in the global market. Second, government policy should protect the export of white jute, as the system is uncompetitive, whereas traditional jute production, although competitive, suffers from relatively lower productivity and financial profitability. The argument in favor of protecting white jute are as follows: First, the productivity, harvest price, and financial profitability of white jute at the farm level is higher than traditional jute (Table 4). Second, the loss of profit of white jute at social prices is marginal (BDT −615.90). Third, the harvest price of jute and the value of jute exports to Bangladesh have increased sharply during the period 2004–2013 (Figure 2). Therefore, assuming that the rising trend of jute price continues, and given a higher level of financial profitability at the farm level, the existing uncompetitveness of white jute could be eliminated in the coming years and, therefore, will not require protection thereafter. However, in the meantime, protection for white jute is needed. Furthermore, supporting the jute sector will be worthwhile because the demand for jute and jute products is rising globally due to the changing mind-set of consumers who now prefer eco-friendly products as opposed to synthetic products. Bangladesh, being a producer of the finest quality jute fiber in the world, can tap into this rising market for jute and jute products by devising appropriate policy, infrastructural, and institutional support. Third, investment in the irrigation infrastructure will significantly increase jute productivity. Bangladesh has made remarkable progress in increasing supplementary irrigation infrastructure and facilities over time. For example, the share of irrigated area in the gross cropped area increased steadily from 11.0% in 1973 to 47.4% in 2013, a four-fold increase in 40 years [12,36]. Further expansion of the irrigated area will contribute positively towards increasing the productivity of jute. Fourth, the average farm size in Bangladesh is declining over time due to population pressure in a closing land frontier. Although conventional land reform policies to redistribute land is not feasible in the Bangladesh context [33], tenurial policies aimed at improving the land rental market, in order to allow marginal farmers to consolidate their farm size to an optimum scale, will significantly improve jute productivity.
Although the challenges to realize all these policy measures are formidable, a revival of the jute sector will contribute positively towards commercialization of Bangladesh agriculture, as well as boost export earnings. Bangladesh has already launched a National Jute Policy in 2011 and subsequently drafted an extended National Jute Policy in 2014. Both these actions demonstrate that the government of Bangladesh is keen to revive the jute sector, which is a step in the right direction as indicated by the results of the present study.
Acknowledgments
The database required for this project was created with funding support from the National Food Policy Capacity Strengthening Program, FAO-Bangladesh Research Grant, Phase II (2011). Some of the materials presented in this paper are available in the report “Financial and economic profitability of selected agricultural crops in Bangladesh” NFPCSP-FAO Research Grant Report #05/11, Dhaka Bangladesh, July 2013. The authors gratefully acknowledge critical comments made by two anonymous referees, which have substantially improved the paper. All caveats remain with the authors.
Author Contributions
Sanzidur Rahman (Co-I of the main project) conducted the growth rate, productivity, and efficiency analysis, and wrote the paper. Mohammad Mizanul Haque Kazal (PI of the main project) was in charge of the field survey, data management, and conducted the farm-level profitability analysis. Ismat Ara Begum and Mohammad Jahangir Alam (Co-Is of the main project) jointly conducted the PAM analysis.
Conflicts of Interest
The authors declare no conflict of interest.
References
- Basu, G.; Roy, A.N. Blending of Jute with Different Natural Fibres. J. Nat. Fibers 2008, 4, 13–29. [Google Scholar] [CrossRef]
- Kazal, M.M.H.; Rahman, S.; Alam, M.J.; Hossain, S.T. Financial and Economic Profitability of Selected Agricultural Crops in Bangladesh; NFPCSP-FAO Research Grant Report #05/11; Food Planning and Monitoring Unit, Ministry of Food, Government of Bangladesh: Dhaka, Bangladesh, 2013.
- Bangladesh Bureau of Statistics. Statistical Yearbook of Bangladesh, 2009; Bangladesh Bureau of Statistics: Dhaka, Bangladesh, 2010.
- Mackie, G. Prospects for Traditional Jute Products. J. Nat. Fibers 2005, 2, 105–110. [Google Scholar] [CrossRef]
- Gupta, D.; Sahu, P.K.; Banerjee, R. Forecasting jute production in major contributing countries in the world. J. Nat. Fibers 2009, 6, 127–137. [Google Scholar] [CrossRef]
- Muhammad, A. Closure of Adamjee Jute Mills: Ominous Sign. Econom. Political Wkly. 2002, 37, 3895–3897. [Google Scholar]
- Ministry of Textiles and Jute. Draft National Jute Policy 2014 (in Bangla); Ministry of Textiles and Jute, Government of Bangladesh: Dhaka, Bangladesh, 2015. Available online: https://www.bangladeshtradeportal.gov.bd/index.php?r=site/display&id=211 (accessed on 29 March 2017).
- Rahman, S. Whether crop diversification is a desired strategy for agricultural growth in Bangladesh? Food Policy 2009, 34, 340–349. [Google Scholar] [CrossRef]
- Planning Commission. The Fifth Five-Year Plan (1997–2002); Ministry of Planning, Government of Bangladesh: Dhaka, Bangladesh, 1998.
- Planning Commission. The Sixth Five-Year Plan (2011–2015); Ministry of Planning, Government of Bangladesh: Dhaka, Bangladesh, 2011.
- International Monitory Fund. Bangladesh Poverty Reduction Strategy Paper; IMF Country Report No. 04/410; International Monitory Fund: Washington, DC, USA, 2005. [Google Scholar]
- Rahman, S. Six decades of agricultural land use change in Bangladesh: Effects on crop diversity, productivity, food availability and the environment, 1948–2006. Singap. J. Trop. Geogr. 2010, 31, 254–269. [Google Scholar] [CrossRef]
- Gonzales, L.A.; Kasryno, F.; Perez, N.D.; Rosegrant, M.W. Economic Incentives and Comparative Advantage in Indonesian Food Crop Production; Research Report 93; International Food Policy Research Institute: Washington, DC, USA, 1993. [Google Scholar]
- Rahman, S.; Kazal, M.M.H.; Begum, I.A.; Alam, M.J. Competitiveness, Profitability, Input Demand and Output Supply of Maize Production in Bangladesh. Agriculture 2016, 6, 21. [Google Scholar] [CrossRef]
- Rashid, M.A.; Hassan, M.K.; Harun-ur-Rashid, A.K.M. Domestic and International Competitiveness of Production of Selected Crops in Bangladesh; NFPCSP-FAO Research Grant Report CF #01/08; Food Planning and Monitoring Unit, Ministry of Food, Govt. of Bangladesh: Dhaka, Bangladesh, 2009.
- Khan, N.P. Comparative advantage of wheat production in Pakistan and its policy implications. Pak. J. Agric. Econom. 2001, 4, 17–29. [Google Scholar]
- Chaudhry, M.G.; Kayani, N.N. Implicit Taxation of Pakistan’s Agriculture: An Analysis of the Commodity and Input Prices. Pak. Dev. Rev. 1991, 30, 225–242. [Google Scholar]
- Appleyard, D.R. Report on Comparative Advantage; Agricultural Price Commission Series # 61; Agricultural Price Commission: Islamabad, Pakistan, 1987.
- Monke, E.A.; Pearson, S.R. The Policy Analysis Matrix for Agricultural Development; Cornell University Press: Ithaca, NY, USA, 1989. [Google Scholar]
- Molla, M.M.U.; Sabur, S.A.; Begum, I.A. Financial and economic profitability of jute in Bangladesh: A comparative assessment. J. Agric. Nat. Resour. Sci. 2015, 2, 295–303. [Google Scholar]
- Shahabuddin, Q.; Dorosh, P. Comparative Advantage in Bangladesh Crop Production, MSSD Discussion Paper No. 47; International Food Policy Research Institute: Washington, DC, USA, 2002. [Google Scholar]
- Reddy, A.A.; Bantilan, M.C.S. Competitiveness and technical efficiency: Determinants in the groundnut oil sector in India. Food Policy 2012, 37, 255–263. [Google Scholar] [CrossRef]
- Rahman, S.; Rahman, M.S. Exploring the potential and performance of maize production in Bangladesh. Int. J. Agric. Manag. 2014, 3, 99–106. [Google Scholar]
- Aigner, D.J.; Lovell, C.A.K.; Schmidt, P. Formulation and estimation of stochastic frontier production function models. J. Econom. 1977, 6, 21–37. [Google Scholar] [CrossRef]
- Battese, G.; Coelli, T. A model for technical inefficiency effects in a stochastic frontier production function for panel data. Empir. Econom. 1995, 20, 325–332. [Google Scholar] [CrossRef]
- Bangladesh Bureau of Statistics. Statistical Yearbook of Bangladesh, 1975 through 2013; Various Issues (1975–2013); Bangladesh Bureau of Statistics: Dhaka, Bangladesh, 2014.
- Bangladesh Bank. Economic Trends, Monthly, December 2013; Bangladesh Bank: Dhaka, Bangladesh, 2013. [Google Scholar]
- StataCorp. STATA Version 8; Stata Press Publications: College Station, TX, USA, 2003. [Google Scholar]
- Rahman, S.; Hasan, M.K. Impact of environmental production conditions on productivity and efficiency: A case study of wheat farmers in Bangladesh. J. Environ. Manag. 2008, 88, 1495–1504. [Google Scholar] [CrossRef] [PubMed]
- Coelli, T.J. Estimators and hypothesis tests for a stochastic frontier function: A Monte-Carlo analysis. J. Prod. Anal. 1995, 6, 247–268. [Google Scholar] [CrossRef]
- Coelli, T.; Rahman, S.; Thirtle, C. Technical, allocative, cost and scale efficiencies in Bangladesh rice cultivation: A non-parametric approach. J. Agric. Econom. 2002, 53, 607–626. [Google Scholar] [CrossRef]
- Bravo-Ureta, B.E.; Solis, D.; Lopez, V.H.M.; Maripani, J.F.; Thiam, A.; Rivas, T. Technical efficiency in farming: A meta regression analysis. J. Prod. Anal. 2007, 27, 57–72. [Google Scholar] [CrossRef]
- Rahman, S.; Rahman, M.M. Impact of land fragmentation and resource ownership on productivity and efficiency: The case of rice producers in Bangladesh. Land Use Policy 2008, 26, 95–103. [Google Scholar] [CrossRef]
- Food and Agricultural Organisation (FAO). FAOSTAT Database; Food and Agricultural Organisation of the United Nations: Rome, Italy, 2017; Available online: http://www.fao.org/faostat/en/#data/TP (accessed on 28 March 2017).
- Bangladesh Jute Research Institute (BJRI). Bangladesh Jute Research Institute Official Website. Undated. Available online: http://www.bjri.gov.bd/bjri_english/ (accessed on 22 October 2017).
- Bangladesh Bureau of Statistics. Statistical Yearbook of Bangladesh, 2014; Bangladesh Bureau of Statistics: Dhaka, Bangladesh, 2016.
Figure 1.
Trends in the three-year moving average of jute area, production, and yield in Bangladesh (1973–2013). Source: Computed from BBS [26].
Figure 1.
Trends in the three-year moving average of jute area, production, and yield in Bangladesh (1973–2013). Source: Computed from BBS [26].
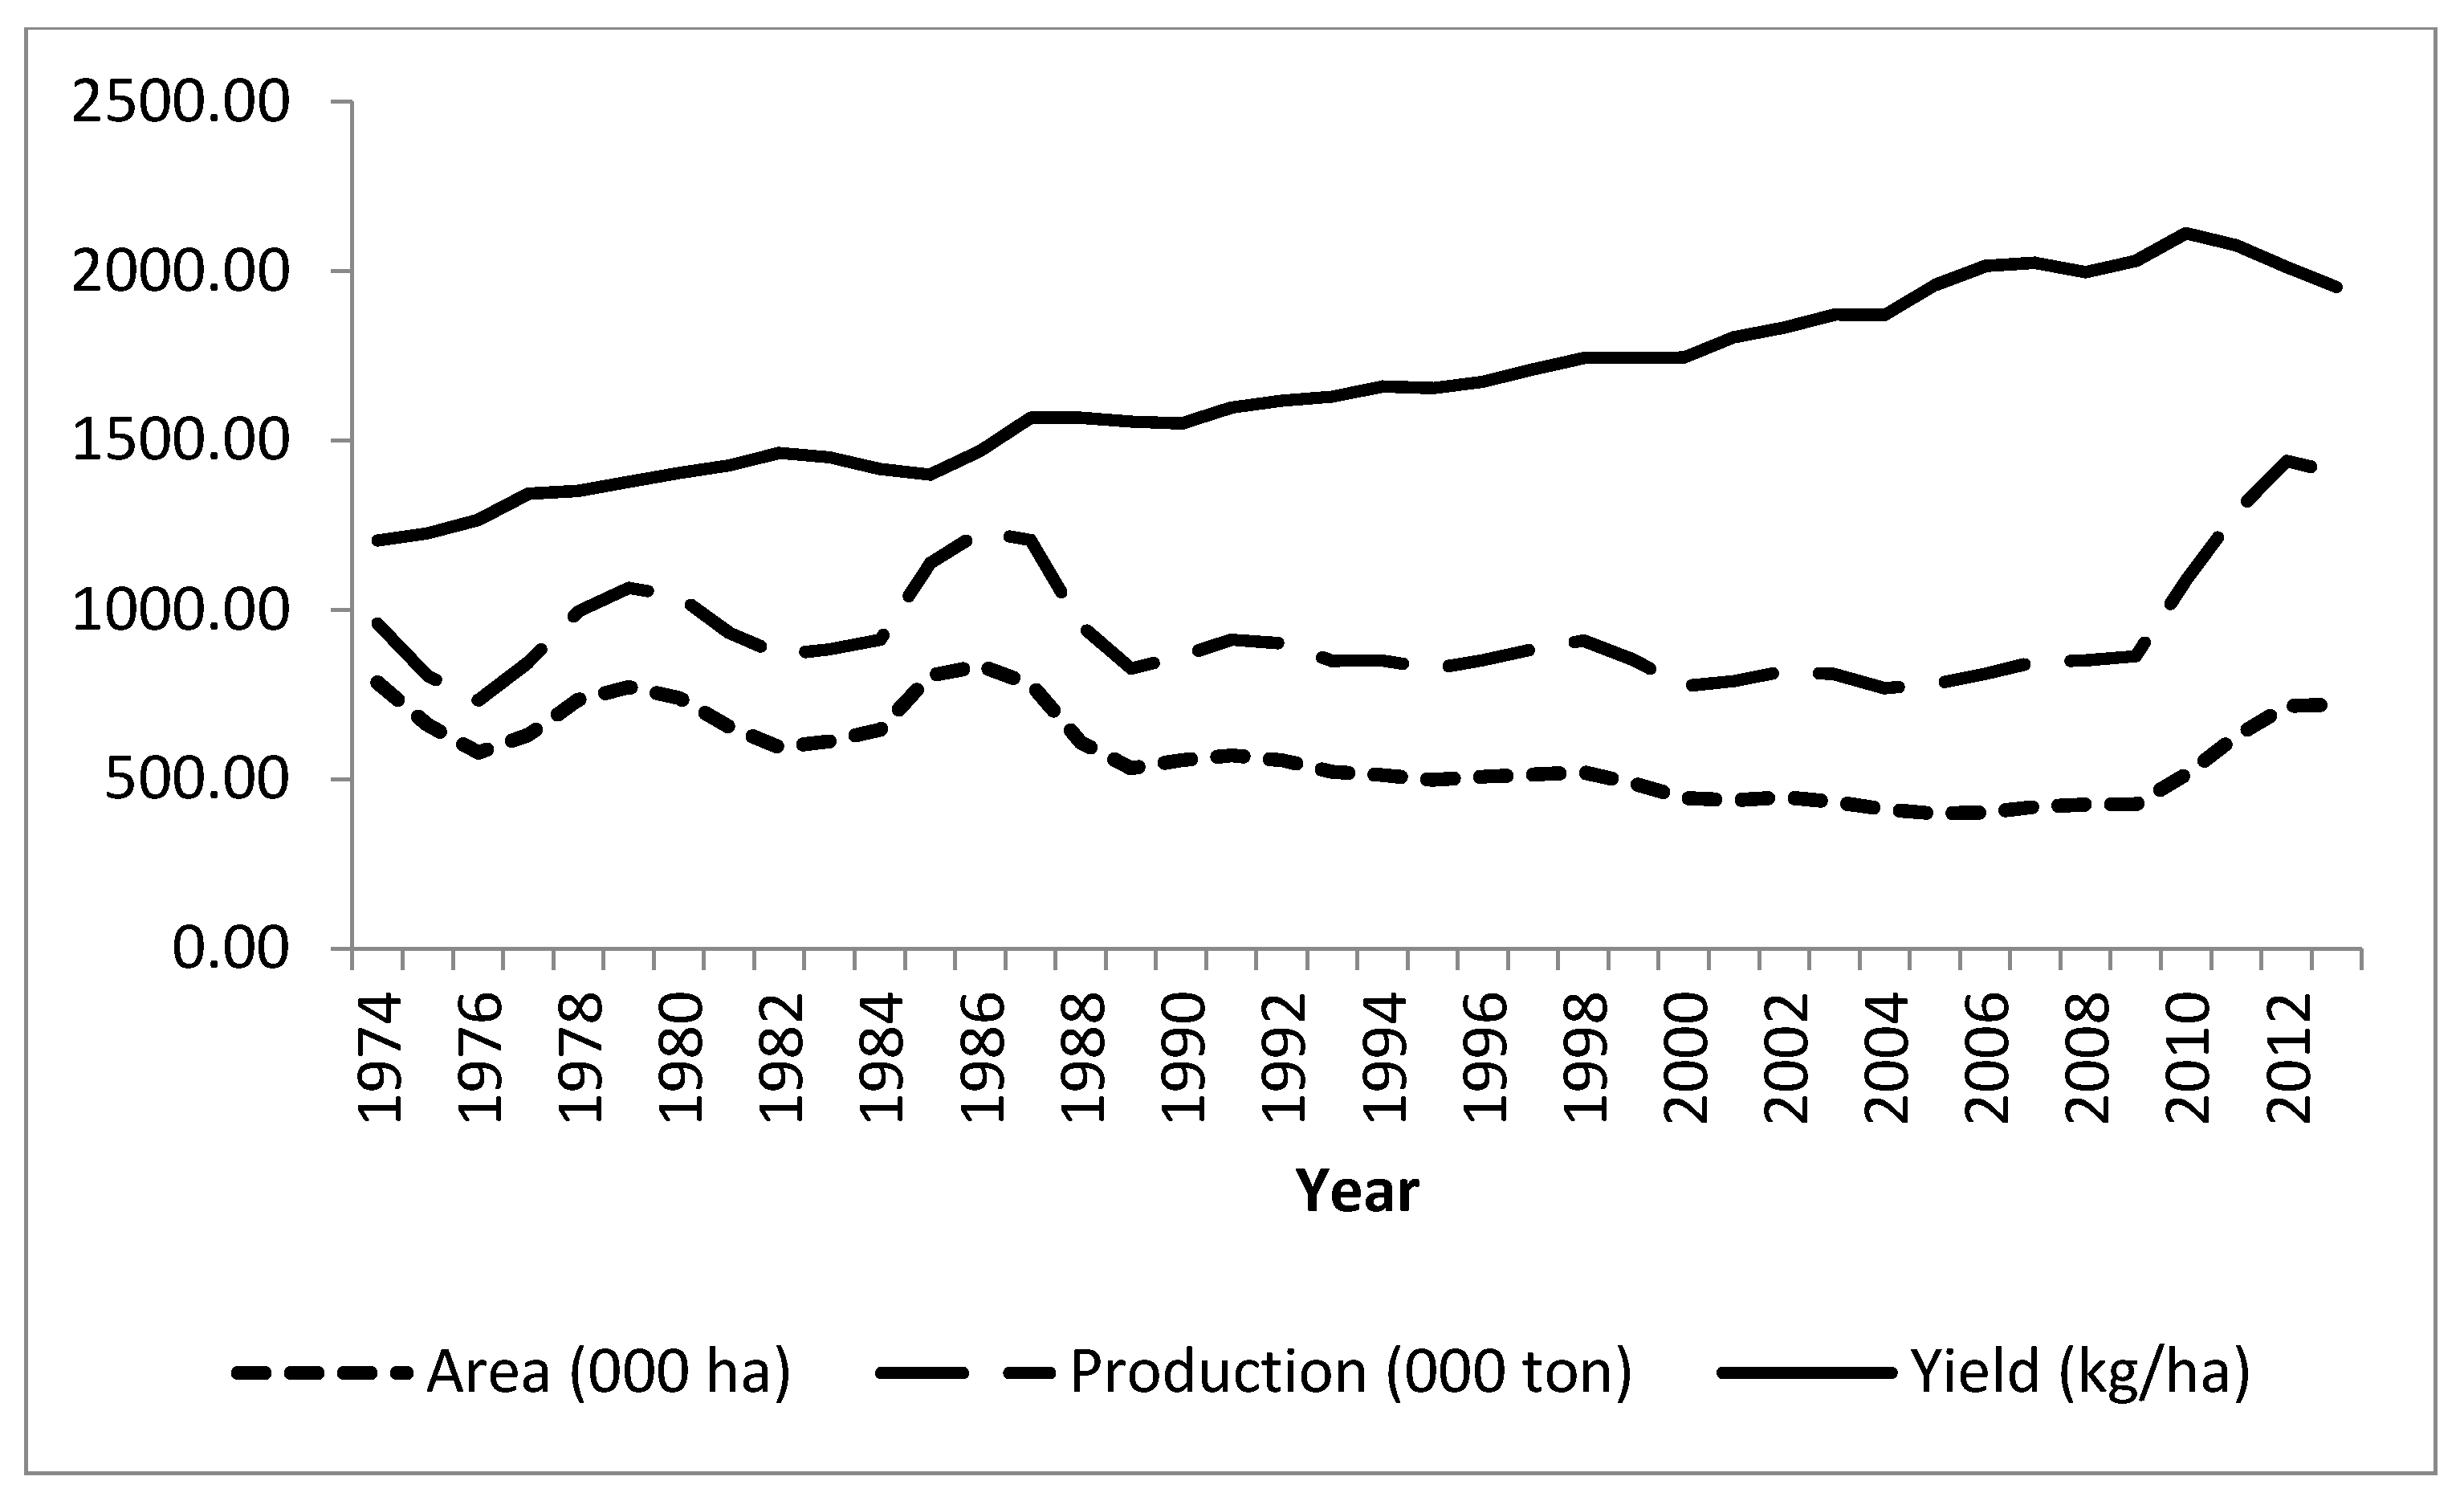
Figure 2.
Trends in the three-year moving averages of jute harvest price and value of jute export in Bangladesh (1973–2013). Source: Computed from BBS [26].
Figure 2.
Trends in the three-year moving averages of jute harvest price and value of jute export in Bangladesh (1973–2013). Source: Computed from BBS [26].


Table 1.
Framework of the policy analysis matrix (PAM).
| Items | Revenue | Costs | Profit | |
|---|---|---|---|---|
| Tradable Inputs | Domestic Factors | |||
| Private prices | A | B | C | D |
| Social prices | E | F | G | H |
Source: Selected from Monke and Pearson [19].
Table 2.
Trends in the jute sector in Bangladesh.
| Variables | Units | First 31 Years | Latter 10 Years | Total Period |
|---|---|---|---|---|
| 1973–2003 | 2004–2013 | 1973–2013 | ||
| Average Values | ||||
| Area cultivated | ‘000 ha | 599.76 | 506.55 | 576.46 |
| Total production | ‘000 mt | 910.21 | 1015.0 | 936.41 |
| Productivity | t ha−1 | 1.54 | 2.01 | 1.66 |
| Harvest price | USD | 201.59 | 320.12 | 231.23 |
| Value of export | million USD | 374.67 | 604.81 | 432.21 |
| Average Annual Compound Growth Rates | ||||
| Area cultivated | % | −1.8 *** | 7.3 *** | −1.1 *** |
| Total production | % | −0.5 * | 7.7 *** | 0.2 |
| Productivity | % | 1.3 *** | 0.5 | 1.3 *** |
| Harvest price | % | −0.7 * | 11.0 *** | 1.1 *** |
| Value of export | % | −0.1 | 12.1 *** | 1.4 *** |
Note: *** = Significant at 1 percent level (p < 0.01); * = Significant at the 10% level (p < 0.10). Source: Computed from BBS [26].
Table 3.
Competitiveness of jute.
| Items | Kishoreganj | Faridpur |
|---|---|---|
| Revenue at social prices (BDT) | 35,457.31 | 35,457.31 |
| Tradable inputs at social prices (BDT) | 3223.99 | 3683.33 |
| Domestic factors at social prices (BDT) | 24,583.73 | 32,389.88 |
| Profits at social prices (BDT) | 7649.60 | −615.90 |
| Nominal Protection Coefficient on Output (NPCO) | 0.80 | 1.26 |
| Nominal Protection Coefficient on Input (NPCI) | 0.45 | 0.43 |
| Effective Protection Coefficient (EPC) | 0.84 | 1.35 |
Note: Exchange rate: USD 1.00 = BDT 81.86 in 2012 [27].
Table 4.
Financial profitability of jute by type/region.
| Region | Unit | Kishoreganj (Traditional Jute) | Faridpur (White Jute) |
|---|---|---|---|
| Average yield/productivity | kg ha−1 | 2340.00 | 2500.00 |
| Sale price | BDT mt−1 | 28,433.33 | 44,666.67 |
| Human labor | BDT ha−1 | 30,583.90 | 50,899.50 |
| Machinery Inputs | BDT ha−1 | 1763.40 | 4864.70 |
| Material Inputs | BDT ha−1 | 14,602.90 | 7047.90 |
| Total variable cost (TVC) | BDT ha−1 | 46,950.22 | 62,812.10 |
| Interest on operating capital | BDT ha−1 | 1173.80 | 1570.30 |
| Land use cost | BDT ha−1 | 19,899.00 | 32,307.00 |
| Total fixed cost (TFC) | BDT ha−1 | 21,072.70 | 33,877.30 |
| Total cost (TC) | BDT ha−1 | 68,022.97 | 96,689.40 |
| Gross return (GR) | BDT ha−1 | 79,811.37 | 119,491.00 |
| Gross margin (GM = GR − TVC) | BDT ha−1 | 32,861.18 | 56,678.90 |
| Net return (NR = GR − TC) | BDT ha−1 | 11,788.47 | 22,801.60 |
| Undiscounted BCR | 1.17 | 1.24 |
Note: Exchange rate: USD 1.00 = BDT 81.86 in 2012 [27].
Table 5.
Tests of hypotheses.
| Hypothesis | Critical Value of χ2 (v, 0.95) | LR Statistic/z Statistic | Decision |
|---|---|---|---|
| Choice of the functional form (H0: β11 = β22 = … = β67 = 0) | 41.37 | 280.98 *** | Translog function is appropriate |
| Frontier test H0: M3T = 0 (i.e., no inefficiency component) | - | 25.26 *** | Frontier not OLS |
| Presence of inefficiency (H0: γ = 0) | 3.84 | 93.22 *** | Inefficiencies are present |
| No effect of socio-economic variables on inefficiency (H0: δ1 = δ2 = … = δ6 = 0) | 12.59 | 29.74 *** | Have effects of socio-economic on inefficiency |
| Constant returns to scale in production (H0: α1 + α2 + … + α5 = 1) | 3.84 | 42.34 *** | Decreasing returns to scale in production |
Note: In testing (H0: γ = 0) the critical value of χ2 (1, 0.95) was used which is 3.84. *** = Significant at the 1% level (p < 0.01).
Table 6.
Maximum likelihood estimates of stochastic production frontier of jute.
| Variables | Parameters | Coefficient | t-Ratio |
|---|---|---|---|
| Production Function | |||
| Constant | α0 | 6.5036 *** | 108.39 |
| ln Labour | α1 | 0.1116 ** | 2.06 |
| ln Fertiliser | α2 | 0.0053 | 0.16 |
| ln Organic manure | α3 | −0.0019 | −0.23 |
| ln Mechanical power | α4 | 0.0467 | 1.11 |
| ln Irrigation | α5 | 0.0679 *** | 11.21 |
| ln Seed | α6 | −0.0476 | −1.17 |
| ln Land | α7 | 0.6901 *** | 11.13 |
| 0.5 × (ln Labour)2 | β11 | 0.3490 *** | 4.75 |
| 0.5 × (ln Fertiliser)2 | β22 | 0.0678 | 1.25 |
| 0.5 × (ln Organic manure)2 | β33 | 0.0050 | 1.26 |
| 0.5 × (ln Mechanical power)2 | β44 | 0.0601 | 1.42 |
| 0.5 × (ln Irrigation)2 | β55 | 0.0358 *** | 5.25 |
| 0.5 × (ln Seed)2 | β66 | −0.0448 *** | −3.64 |
| 0.5 × (ln Land)2 | β77 | 0.6214 *** | 5.75 |
| ln Labour × ln Fertiliser | β12 | −0.2249 *** | −3.34 |
| ln Labour × ln Organic manure | β13 | −0.1036 *** | −2.90 |
| ln Labour × ln Mechanical power | β14 | −0.0326 *** | −3.95 |
| ln Labour × ln Irrigation | β15 | 0.1051 | 1.02 |
| ln Labour × ln Seed | β16 | −0.0399 ** | −2.02 |
| ln Labour × ln Land | β17 | −0.1796 | −1.51 |
| ln Fertiliser × ln Organic manure | β23 | 0.1216 ** | 1.96 |
| ln Fertiliser × ln Mechanical power | β24 | −0.0042 | −0.34 |
| ln Fertiliser × ln Irrigation | β25 | −0.0338 | −0.64 |
| ln Fertiliser × ln Seed | β26 | −0.0360 *** | −2.69 |
| ln Fertiliser × ln Land | β27 | 0.1222 | 1.02 |
| ln Organic manure × ln Mechanical power | β34 | 0.0103 | 1.01 |
| ln Organic manure × ln Irrigation | β35 | 0.2429 *** | 3.59 |
| ln Organic manure × ln Seed | β36 | 0.0214 ** | 2.36 |
| ln Organic manure × ln Land | β37 | −0.2871 *** | −3.40 |
| ln Mechanical power × ln Irrigation | β45 | 0.0075 | 0.33 |
| ln Mechanical power × ln Seed | β46 | −0.0267 | −1.20 |
| ln Mechanical power × ln Land | β47 | −0.2800 *** | −2.69 |
| ln Irrigation × ln Seed | β56 | −0.0017 | −0.77 |
| ln Irrigation × ln Land | β57 | 0.0413 | 1.32 |
| ln Seed × ln Land | β67 | −0.0063 | −0.38 |
| Model Diagnostics | |||
| σ2 = σu2 + σv2 | σ2 | 0.23 | 72.86 *** |
| γ = σu2/(σu2 + σv2) | γ | 0.99 | 93.22 *** |
| Log likelihood | 56.81 | ||
| Inefficiency Effects Function | |||
| Constant | δ0 | −0.6524 ** | −2.02 |
| Marginal farmer | δ1 | 0.2152 * | 1.73 |
| Subsistence pressure | δ2 | −0.0073 | −0.21 |
| Experience of the farmer | δ3 | 0.0006 | 0.13 |
| Land fragmentation | δ4 | −0.0111 | −0.42 |
| Involvement in NGOs | δ5 | 0.5771 *** | 4.63 |
| Education of the farmers | δ6 | 0.0123 | 0.91 |
| Total number of observations | 289 | ||
Note: *** = Significant at the 1% level (p < 0.01); ** = Significant at the 5% level (p < 0.05); * = Significant at the 10% level (p < 0.10).
Table 7.
Technical efficiency distribution.
| Items | Proportion of Farmers |
|---|---|
| Efficiency Levels | |
| Up to 60% | 20.07 |
| 61–70% | 19.03 |
| 71–80% | 21.11 |
| 81–90% | 15.57 |
| 91% and above | 24.22 |
| Efficiency Measures | |
| Mean efficiency score | 0.75 |
| Standard deviation | 0.17 |
| Minimum | 0.09 |
| Maximum | 0.99 |
| Mean Efficiency by Farm Size Categories | |
| Marginal | 0.71 |
| Small | 0.77 |
| Medium/large | 0.76 |
| F-test for difference by farm size categories | 2.80 * |
| Mean Efficiency by NGO Membership | |
| Not involved in NGO | 0.82 |
| Members of NGO | 0.70 |
| t-test for mean difference by NGO involvement | 6.10 *** |
Note: *** = Significant at the 1% level (p < 0.10); * = Significant at the 10% level (p < 0.10).
© 2017 by the authors. Licensee MDPI, Basel, Switzerland. This article is an open access article distributed under the terms and conditions of the Creative Commons Attribution (CC BY) license (http://creativecommons.org/licenses/by/4.0/).
Share and Cite
MDPI and ACS Style
Rahman, S.; Kazal, M.M.H.; Begum, I.A.; Alam, M.J. Exploring the Future Potential of Jute in Bangladesh. Agriculture 2017, 7, 96. https://doi.org/10.3390/agriculture7120096
AMA Style
Rahman S, Kazal MMH, Begum IA, Alam MJ. Exploring the Future Potential of Jute in Bangladesh. Agriculture. 2017; 7(12):96. https://doi.org/10.3390/agriculture7120096
Chicago/Turabian StyleRahman, Sanzidur, Mohammad Mizanul Haque Kazal, Ismat Ara Begum, and Mohammad Jahangir Alam. 2017. "Exploring the Future Potential of Jute in Bangladesh" Agriculture 7, no. 12: 96. https://doi.org/10.3390/agriculture7120096
Note that from the first issue of 2016, this journal uses article numbers instead of page numbers. See further details here.