Recycling Improves Soil Fertility Management in Smallholdings in Tanzania


1
Postgraduate program ‘Microenergy Systems Research Group’, Center for Technology & Society, Technische Universität (TU) Berlin, 10623 Berlin, Germany
2
Department of Environmental Technology, Chair of Circular Economy and Recycling Technology, TU Berlin, 10623 Berlin, Germany
*
Author to whom correspondence should be addressed.
Agriculture 2018, 8(3), 31; https://doi.org/10.3390/agriculture8030031
Submission received: 21 December 2017
/
Revised: 12 February 2018
/
Accepted: 21 February 2018
/
Published: 26 February 2018
(This article belongs to the Special Issue Energy and Agriculture)
Abstract
:Residues from bioenergy and ecological sanitation (EcoSan) can be utilized to sustain soil fertility and productivity. With regard to certain cooking and sanitation technologies used in smallholder households (hh), we systematically analyzed how utilization of the respective potentials to recover residues for farming affects (i) soil nutrient balances, (ii) the potential for subsistence production of composts, and (iii) environmental emissions. On the example of an intercropping farming system in Karagwe, Tanzania, we studied specific farming practices including (1) current practices of using standard compost only; (2) a combination of using biogas slurry, urine, and standard compost; (3) a combination of using so-called “CaSa-compost” (containing biochar and sanitized human excreta, Project “Carbonization and Sanitation”), urine, and standard compost. The system analysis combines a soil nutrient balance (SNB) with material flow analysis (MFA). Currently, nitrogen (N) and phosphorus (P) are depleted by −54 ± 3 and −8 ± 1 kg∙ha−1∙year−1, respectively. Our analysis shows, however, a clear potential to reduce depletion rates of N, and to reverse the SNB of P, to bring about a positive outcome. Composts and biogas slurry supply sufficient P to crops, while urine effectively supplements N. By using resources recovered from cooking and sanitation, sufficient compost for subsistence farming may be produced. Human excreta contribute especially to total N and total P in CaSa-compost, whilst biochar recovered from cooking with microgasifier stoves adds to total carbon (C) and total P. We conclude that the combined recycling of household residues from cooking and from sanitation, and CaSa-compost in particular, is especially suitable for sustainable soil management, as it mitigates existing P-deficiency and soil acidity, and also restores soil organic matter.

1. Introduction
1.1. The Challenge of Closing the Loop
Managing soil appropriately requires replacing those nutrients which have been taken from the soil during cultivation [1]. The International Assessment of Agricultural Knowledge, Science and Technology for Development (IAASTD) sees “Agriculture at a crossroads”, and calls for focusing on efficient, small-scale agroecosystems with material cycles that are as closed as practicably possible [2]. Agroecology, nutrient recycling within the agroecosystem, and the use of locally available resources represent, therefore, agreed prerequisites for soil conservation and amelioration, and also, as a consequence, for long-term food production [3,4,5,6,7,8,9]. As a holistic farming approach to jointly manage soil, nutrients, water, crops, and vegetation in the context of sub-Saharan Africa (SSA), the IAASTD and the Food and Agricultural Organisation of the United Nations (FAO) further promote integrated plant nutrient management (IPNM) [10,11]. When tailored to a particular cropping system, IPNM aims to provide a solution to the triple challenge of (i) sustaining soil fertility, (ii) improving land productivity, and (iii) reducing environmental degradation [11].
Applied IPNM combines the use of organic inputs, such compost, farmyard manure, mulch, etc., with mineral inputs, such as synthetic fertilizers, alongside practices including intercropping, agroforestry, liming, low-tillage, crop rotation, etc. [12]. Composting is a widespread and common method, whereby various organic residues, mixed with mineral components, are aerobically and biochemically decomposed by macro- and microorganisms. The composting process, e.g., [13,14,15], as well as the combined use of compost with inorganic nutrient sources, cf. [16], has been well studied in the context of SSA. Regular input of organic matter to agricultural soils is needed to restore soil organic matter (SOM) and maintain soil humus. Pursuant to [17], however, on-farm availability of organic matter is often restricted in the case of many farmers in SSA, due to poor land productivity. As a consequence, SSA has been identified as a hotspot for the depletion of SOM [18]. Moreover, existing organic materials tend to be characterized by comparatively low contents of phosphorus (P) [19]. Pig and poultry manure, which constitute a possible P-rich resource, however, are not sufficiently available, especially to structurally poor farming households [20]. For these reasons, a lack of P is a very common factor in limiting plant growth in SSA [17]. Consequently, many smallholders face being locked into a vicious circle of low soil P, resulting in low production of food crops, and then a limited supply of organic material for soil fertility management [17].
1.2. Monitoring and Assessing Soil Fertility Management Practices
To effectively enhance soil fertility, the FAO recommends the development of IPNM approaches alongside the identification of existing soil nutrient balances [21,22]. The concept of soil nutrient balance (SNB) was introduced by [23], in order to analyze and monitor changes in soil fertility, particularly in SSA. The methodology aims at measuring, calculating, and balancing various input and output flows of nutrients to and from agricultural land.
For the wider Lake Victoria region (East Africa), however, existing annual rates of soil nutrient mining and replenishing remain mostly unknown [24]. As an exception, [25] identified existing annual nutrient depletion rates on arable land in Eastern Uganda with 33 kg∙ha−1∙year−1 and 6 kg∙ha−1∙year−1 for nitrogen (N) and P, respectively. For Tanzania (TZ), estimated average annual losses of N and P range from 20 to 40 kg∙ha−1∙year−1, and 3.5 to 6.6 kg∙ha−1∙year−1, respectively [26]. Furthermore, [27] estimated SNBs for N and P of banana-based farming in Northwest TZ as ranging from −30 to +11 kg∙ha−1∙year−1, and −3 to +9 kg∙ha−1∙year−1, respectively. According to [27], nutrients are increasingly exported out of farmland in the region, since the market economy has intensified sales and trading of food products, and since the use of pit latrines has increased, which act as sinks for nutrients. The most significant nutrient inputs to home gardens derive from imports of fodder grasses from off-farm grassland, or bought bananas and brewing grasses, respectively [17]. The worst depletion rates were, therefore, identified for structurally poor households without livestock. As a countermeasure, [27] recommend the rigorous recycling of all household refuse, including human excreta, alongside an increased application of composting.
1.3. Intersectional Resource Management for Subsistence Fertilizer Production
Hence, the recovery of resources from the farming household could effectively promote on-farm nutrient cycling. Especially the use of residues from cooking with bioenergy and from ecological sanitation (EcoSan) provides a viable option to increase subsistence production of soil amenders for IPNM. Residues available after cooking depend on the technology applied, and include (i) ash from three-stone fires, charcoal stoves, or rocket stoves; (ii) biochar from microgasifier stoves; or (iii) biogas slurry from anaerobic fermentation of organic wastes to produce biogas. The latter is particularly rich in nutrients, and is well known for its suitability as a fertilizer for organic farming [28]. The term “biochar” refers specifically to carbonised organic matter—i.e., (powdery) charcoal with significant carbon (C) content—that is used for soil amelioration [29,30]. Biochar has attracted significant interest from scientists and practitioners within the last decade, largely due to the findings of Terra Preta, an Anthrosol in the Amazon basin with exceptional soil fertility [31,32]. Using biochar as a compost additive is the most promising approach for maximising the positive effects of biochar applications, as demonstrated by [33].
Residues available from EcoSan facilities include urine and faeces that can be collected separately in a urine-diverting dry toilet (UDDT). In order to prevent the transmission of disease, additional treatment of human excreta is vital in order to inactivate pathogens [34,35]. Treatment should be carried out at as early a stage as possible during the process [36]. Urine must simply be stored for a period of at least two months after collection in the UDDT [36,37]. After this period, stored urine is a fast-acting and rapidly available N-fertilizer [38]. Urine is often diluted with water in a ratio of from 1:3, to up to 1:5 parts urine to water, in order to avoid over-application and to reduce odour [38]. For balancing nutrient doses, urine should be complemented with either mineral P and potassium (K) additives, or an organic amendment, such as compost. Sanitation of human faeces is possible by different means [36,39]. In this study, we focus on thermal sanitation of faeces, which is based on an appropriate combination of time and temperature [40]. As an example, pasteurization can take place at temperatures between 65 to 75 °C, over periods ranging from 30 to 120 min. Here, pasteurization is realized before composting and takes place in a loam oven, whereby a microgasifier stove provides the heat required [39]. The use of a microgasifier means that additional biochar is potentially available as an output of this sanitation process [41]. For the subsequent composting, it is recommended to mix human faces with other organic residues, such as kitchen wastes, harvest residues, ashes, or biochar [42]. This mixing of various types of waste aims to create a well-balanced content of C and other nutrients, as well as of dry and wet matter, which in turn sustains a well-functioning composting process [43].
Studies observing plant response to biogas slurry, e.g., [28,44,45,46,47] or (composted) biochar e.g., [33,48,49,50,51,52,53,54,55], have often revealed positive results in terms of stimulated crop productivity. Furthermore, co-composting of source-separated human faeces has also been empirically studied, cf. [34,35,38,56]. In the SSA context, however, plant responses to applications of biogas slurry, e.g., [57], biochar, e.g., [58], human urine e.g., [59] or faeces e.g., [37,60] have, to date, only rarely been studied. Nevertheless, existing scientific studies can be used to extrapolate overall improved soil properties and stimulated biomass growth with, for example, increasing maize grains yields to 200–400%, compared to plants grown on unamended soil. This given, we reason that studies observing the combined use of household residues, such as biogas slurry, urine, and co-composted biochar and human faeces, are of a strong interest for contemporary scientific studies.
1.4. Research Objectives and Questions
To the best of our knowledge, analytical studies focusing on IPNM potentials around the nexus energy–sanitation–agriculture, and based on SNB, have not yet been scientifically targeted for smallholder systems in SSA in general, or in East Africa in particular. Moreover, the SNB has, to date, in the vast majority of studies, been applied for ex-post analyses of existing depletion or replenishment of soil nutrients. Nonetheless, SNB could also be used as analytical ex-ante evaluation or assessment method, considering potential effects of technology-related changes in farming systems on soil fertility.
Against this background, it is the objective of the present work to develop a model that enables an ex-ante assessment of integrating residues from cooking and EcoSan into soil fertility management in the context of smallholder farming in SSA. In prior studies focusing on a household level, we already introduced [39], demonstrated [61], and analyzed, in detail, the recycling potentials of an intersectional resource management for the example of smallholdings in Karagwe, TZ [41]. In the present work focusing on a farm level, we systematically compare specific approaches to recover residues as resources for IPNM, such as biogas slurry, urine, or co-composted human faeces, and biochar. Therefore, the following research question has been formulated: How do identified modifications in the farming system (i.e., technology use and residue recovery) affect (i) soil nutrient balances; (ii) availability of resources for subsistence production of compost; and (iii) environmental emissions assessed with global warming potential (GWP) and eutrophication potential (EP)? In addition, we estimate the potential for counteracting existing soil degradation, and sustain soil fertility and food production through recycling of nutrient and restoration of SOM.
2. Materials and Methods
In this section, we firstly introduce the study area (Section 2.1) and the research methodologies (Section 2.2). Then, we describe how we define the system analyzed (Section 2.3), and the tailored modelling approach (Section 2.4). The appendix of the present article presents further details of (i) those IPNM alternatives analyzed, including descriptions and pictures of the substrates in question (Supplementary 1); (ii) the modelling, including equations and assumptions made regarding to specific metabolisms and processes; and (iii) a summary of all data collected (Supplementary 5). Further information on the study area, the case study projects, and the technologies studied is presented in [39,41], and in the supplements to this article.
2.1. Study Area & Case Studies
The study area of this work is Karagwe, one of eight districts in Kagera region, Northwest TZ, part of the Lake Victoria basin, and located near to the volcanic areas of the East African Rift zone (lat 01°33′ S; long. 31°07′ E; alt. 1500–1600 m.a.s.l.). Rainfall is bi-modal (March to May and October to November), and varies between 500 and 2000 mm year−1; the mean temperature ranges from 20 to 28 °C [50]. Hence, local climate conditions allow harvesting twice a year for most annual crops. Households in Karagwe consist, on average, of six people, including adults and children [62].
The regional economy is dominated by smallholder agriculture, and about 90% of households sell agricultural products grown on their farms [17]. Banana is the most prominent perennial crop and staple food in Kagera, while beans and maize dominate annual cropping; Karagwe is also an important producer of onions and cabbage within Kagera (cf. Supplementary Table S1). Approximately 40% of agricultural land in Karagwe is occupied by banana-based home gardens surrounding farmers’ houses [17], named shamba in Swahili (Supplementary Figure S1). The shamba (Supplementary 6) is a mixed cultivation system of perennial crops such as bananas, coffee, etc., annual crops such as beans, cassava, etc., and fruit trees including mango, orange, etc. [27]. Fields used for intercropping of annual crops are called msiri in Swahili [27] (Supplementary Figure S2) and cover approximately 20% of the planted land in Karagwe [62]. Other types of land use comprise mono-cropping of annual crops, tree planting, fallow land, and animal husbandry. Cattle are kept by one sixth of the households, mostly in herds of less than five animals [17].
As for many smallholders in SSA, farmers in Karagwe are challenged by soil constraints including nutrient deficiencies and soil acidity with pH < 4.0 [39]. (In addition, unusual rainfall patterns indicate the approaching effects of climate change, and increasingly threaten the predominantly rain-fed agriculture in Karagwe). Andosols, the predominant soil type in Karagwe [61], typically suffer from P deficiency [17], as P retention potential is relatively high [63]. Crop productivity and sustainable land use therefore requires constant replenishment of P. Unbalanced inputs of N with organic and/or mineral fertilizers and uptake of N by crops often contribute to the problem [64,65]. As an initiative towards soil improvement, and as a countermeasure against deforestation, two Karagwe farmer’s organisations recently initiated a set of projects that deal with the development of “sustainable” cooking (cf. Supplementary Table S2) and sanitation technologies (cf. Supplementary Table S3), as well as with the promotion of the use of residues in agriculture [39]. The three projects and respective technologies act as case studies for our work. Assessing the use of residues for IPNM and potential effects on local SNBs are subjects of the present system analysis.
2.2. Research Methods: MFA & SNB
In order to answer our research questions, we applied SNB methodology in combination with material flow analysis (MFA). This paragraph introduces the conceptual background of these two methods, with fundamental terms given in italics.
According to the definition of the MFA [66,67], a system is a group of interacting processes that cause either a chemical or a physical transformation, transportation, or storage of materials. A material flow () is a mass flow of a good (economic entity) or substance (chemical element or compound) per unit of time (e.g., kg∙year−1). The systems in question are generally open systems, as are exchanged between the anthroposphere and the ecosystem. Material stocks describe the accumulation, storage, or depletion of materials within the anthroposphere. Likewise, following the SNB, one calculates and then balances five input flows (IN) and five output flows (OUT) to and from agricultural land [23]. Both methods follow the same mathematical law, known as “the principle of mass conservation” (Equation (1)), and assume a linear function between and , to simplify calculations.
where and are the total mass of k input and j output material flows and causes ±Δ stock.
To effectively support local soil fertility interventions, [68] emphasize downscaling SNB to site-specific balances, and recommend focusing on a specific cropping system. When applying SNB to the farm level, [69] further suggest splitting the analysis into a natural balance (NB) and a partial balance (PB). The NB comprises all inputs and emissions from and to the environment. The PB reflects the “way of farming”, and solely consists of organic and mineral fertilizer inputs and nutrient removals through food products and crop residues. The combination of the NB and the PB results in the full SNB.
A negative result of the SNB indicates nutrient depletion and declining soil fertility. A positive net balance can be interpreted positively, for example, when P in surplus replenishes P-stocks in P-deficient soils, or negatively, when, for example, heavy metals accumulate in the soil. Apart from specific cases in which soils are deficient in certain essential nutrients, it is most preferable that IN and OUT are balanced.
2.3. Systems Defined & Scenarios Studied
For our analyses, we divided the anthroposphere of an integrated farming system into (i) the farming household, and (ii) the agro-ecosystem (AES) (Figure 1). The former consists of the micro energy system for cooking (MES) and the micro sanitation system (MSS) (referring to a micro-perspective, respectively a focus on smallholder households). Both are systematically studied in [41] by comparing selected technologies, that are available to smallholders in Karagwe (cf. Supplementary Tables S2 and S3), with respect to relevant material flows. The latter represents the farmland, composting, and the disposal of residues through burning. Composting constitutes the central process linking smallholder households to farmland. In our model, we consider two ways of composting: (i) Karagwe-standard composting (Figure 2a), and (ii) CaSa-composting (Figure 2b) (cf. Supplementary 2.6). The composition of Karagwe-standard compost follows local practices [39]. The so-called “CaSa-compost” is based on the approach of the local project “Carbonization and Sanitation” (CaSa) to jointly exploit biochar, stored urine, sanitized faeces, and harvest and kitchen residues.
The functional unit of the system analysis is “to cultivate nutritious and market relevant annual food crops for subsistence farming on a total of 0.125 ha of msiri-land (spatial system boundary), over one year with two cropping seasons (temporal system boundary)”. The crops chosen include maize as a staple food, beans as a source of protein, and onion and cabbage as vegetables. These crops are inter-cropped following local practices. Indicator elements of the analysis are C, and the macronutrients N and P. The atmosphere, the pedosphere, and the hydrosphere are all located outside the spatial system boundaries.
To identify the contribution of residues from cooking and sanitation to managing soil fertility on the farmland, two scenarios are compared: (i) the most common current practices for smallholder farming in Karagwe, and (ii) alternative farming practices based on IPNM, utilizing resources captured from different technologies that are potentially used for cooking and sanitation (Table 1). In total, the analysis comprises five alternatives for msiri cultivation (AM) that mainly differ from one another in respect to their organic and mineral IN to maize and beans: when compared to the current state of affairs (AM1), the further scenarios represent a shift of technologies used in the household towards either using a biogas system for cooking and a UDDT for sanitation (AM2), or using a microgasifier for cooking and as sanitation system a combination of the UDDT with thermal treatment of faeces on a loam oven, following the approach of the CaSa-project (AM3–5). In AM2, we only considered the use of urine as mineral IN; not the use of faeces. We reason that in the case of simply using a UDDT, faeces are not thermally sanitized and thus not “safe” to be used in crop production. In accordance with omushote practice, faeces could rather be used in the shamba, which is, however, out of the scope of the present model. (Omushote was a common practice in Karagwe before pit latrines were implemented, and entails adding faecal matter on a rotation basis into the planting holes for trees or cuttings of banana plants [70].) Cabbage and onion receive nutrient inputs through application of standard compost in all scenarios. This is also because application of composts that contain human faeces, such as the CaSa-compost, should, in general, not be used for crops growing underground [38]. We further followed [17], who recommended that, in order to restore soil P stocks efficiently, there are two principal types of organic fertilizer application: either (i) seasonal moderate applications (AM1–4), or (ii) a one-off large application that is repeated every three years (AM5). In all alternatives studied, biogas slurry (AM2) and urine (AM2–5) are used with seasonal applications. The annual recovery potentials of biogas slurry, biochar, urine, and sanitized faeces derive from an earlier MFA presented in [41]. Table 2 summarizes the quantities identified to be available annually, as well as the respective C and nutrient contents estimated.
2.4. Specific Modelling Approach & Equations Applied
In the present study, we combined SNB with MFA in order to (i) estimate the potential for C recovery available for restoration of SOM; (ii) model the potentials for subsistence production of composts by using household and farming residues; and (iii) assess environmental emissions. The following paragraph describes the manner in which we applied the two methods (cf. Supplementary Figure S3 with plot data in Table S17). The SNB largely follows the basic concepts laid down by [23], with modifications pursuant to [26,68,69,71]. At the outset of this study, we carried out an intensive literature review in order to collect data (cf. Supplementary 5), and to plan and design the system to be analyzed (cf. Supplementary Table S4). In reference to [67], we collected data for determining flows and stocks from various sources, including (i) primary data from case study projects, our own experiments, and previous studies, including household surveys, field tests, laboratory analysis, material flow modelling, etc.; (ii) secondary data, including literature review, statistics from private and public organizations, etc.; and (iii) estimations/judgements of experts. The latter was specifically used if no sufficient data was available or, not available for the specific context. Finally, those IN and OUT that are most relevant and quantifiable to the specific context were selected (Table 3).
Calculations were made through a series of steps (cf. Supplementary 2). The first step was to calculate total biomass production, including crop yields and plant residues, and the respective total nutrient uptake by plants (). Grass carpeting and mulching with residues are considered local standard practices, and are therefore included as organic IN into “PB I without fertilization” (Equation (2)). It follows, therefore, that PB I reflects the “net nutrient requirements” of crops. Application of organic (i.e., Karagwe standard compost and CaSa-compost), organo-mineral (i.e., biogas slurry), and mineral (i.e., urine) fertilizers are considered in “PB II with organic fertilization” (Equation (3)), and “PB III with organic and mineral fertilization” (Equation (4)), respectively. Organic and mineral INs are quantified based on PB I. As suggested by [17,72], if the ratio of N/P of the crops’ nutrient requirement is higher than the N/P ratio found in organic amendments—which is the case in our model (Supplementary Table S26)—then organic matter should be used first to balance the P uptake of crops. In this way, the underlying fertilization approach aims to avoid over-fertilization with P and under-fertilization with N, whilst optimizing P-use efficiency. Mineral fertilizer can also be used to meet crops’ N requirements. As part of the NB, biological nitrogen fixation (BNF) is estimated from the N uptake determined for beans. Values of other IN and OUT for the NB derive from literature (Supplementary Table S27). Finally, the “full SNB I with organic fertilization” (Equation (5)) and “full SNB II with organic and mineral fertilization” (Equation (6)) are calculated.
where IN is the nutrient input flows, OUT is the nutrient output flows, PB is the partial balance, NB is the natural balance, and SNB is the full soil nutrient balance.
Furthermore, several gaseous and liquid emissions are considered in the analysis (Figure 1), which originate from covering soil with carpeting grasses and mulching material, from applying urine or biogas slurry, from burning agricultural residues, and from composting processes. We assessed the climate-relevant gas emissions with those GWP-factors provided by [73] (Supplementary Table S30). Emissions with eutrophying effects were assessed with EP-equivalence factors suggested by [74,75] (Supplementary 3, Supplementary Table S31).
In aggregating the data, we assumed that all parameters were normally distributed and independent of variables [76]. We also applied Gauss’s law of error propagation (FAU physics, n.d.) [77]. The resulting uncertainty of data is expressed by presenting the statistical variance of the collected data set with its arithmetic mean value (), the standard error (Δx), and the relative uncertainty (RU), defined as Δx in % of [67]. Further information on data collected is summarized in Supplementary 4. Data collection, the equation-based model, and all auxiliary calculations were combined in one Excel spreadsheet.
3. Results and Discussion
The following chapter contains (i) a presentation of selected results, checked for plausibility and briefly discussed in relation to relevant factors; (ii) a synthesis of results from a sustainability perspective; and (iii) a brief discussion of the applied methodology.
3.1. Soil Nutrient Balances
Currently, the intercropping system analyzed for Karagwe results in nutrient depletion of the soil (Figure 3). This Table 4 refers to the full SNB with organic input and not including (SNB I), but with (SNB II) additional mineral fertilization. The results identified for the SNB II in the current situation reflect the state-of-knowledge on SNBs in the region very well [25,26,27]. Means of AM1, however, significantly differ from means of AM2–5 for both N and P, as overlapping error bars for the SNB II in Figure 3a,b indicate, respectively [78]. Hence, integrating resources recovered from cooking and sanitation into agriculture has the potential to clearly improve the net SNBs.
As shown for the example of Karagwe, IPNM strategies that utilize residues from the farming household can reverse results of net P balance to positive figures, and mitigate, but not completely avoid, depletion rates of N. When compared to the current state (AM1 = 100%), the total N deficit (i.e., referring to SNB II) is only one fifth that of the biogas-scenario (AM2 ≈ 20%), and less than half that of the CaSa-scenarios (AM3–5 ≈ 30–45%). Differences identified between analyzed IPNM alternatives (AM2–5) are, however, not significant, because error bars (Figure 3) do not overlap [78].
Nutrient requirements of crops (PB I) vary according to the yield assumptions for each alternative. They are lowest for the scenario, reflecting the current state of affairs (AM1) and highest for AM3 and AM5. Note that, as yield assumptions are equivalent in AM3 and AM5, we further refer to these alternatives jointly as AM3/5 for results depending on this shared equal parameter.
The balances of organic and mineral INs and OUTs relevant for the PB vary across IPNM alternatives for both N and P (Figure 3). For example, nutrient inputs with mulching (In2b) correspond to the availability of harvest residues (Supplementary Tables S10 and S23), and thus, also to underlying yield assumptions. After carpeting and mulching, the limited use of organic IN (because compost is used only for cabbage) and the exclusion of mineral IN results in a deficient supply of nutrients in the current state. Specifically in AM1, N and P requirements are, in total, compensated by only 10% and 15% of their demand, respectively.
Organic soil amendments, such as biogas slurry, standard compost, and CaSa-compost, completely meet the P demand of crops (i.e., PB II of AM2–5), while N demand of crops is met by 55–65% of requirements. After organic and mineral fertilization, the total compensation of P in PB III of AM2–5 is approximately 105% to 145% of requirements. The use of urine ultimately satisfies crop N demand in PB III of AM2 by approximately 100%, while N requirements are only partially compensated in PB III of AM3–5 by 75–95% of requirements. Despite biogas slurry and urine fully balancing N demand of crops in AM2, SNB II for N is negative, due to additional N losses through natural flows. Finally, we emphasize the need to consider the fact that nutrients contained in biogas slurry were previously recycled to banana-based homegardens, together with the feeding material of the biogas digester itself [41]. Thus, when switching to a biogas system and using the slurry for fertilizing crops cultivated on msiri fields, compensation or replacement of nutrients in the shamba is required to avoid amplifying existing nutrient deficits there [27].
The balance of natural IN and OUT, relevant for the NB for N, differs between the alternatives analyzed, due to varying BNF. In our model, BNF is 12 ± 3 kg∙N∙ha−1∙year−1 in AM1, compared to 17 ± 4, 29 ± 7, and 85 ± 17 kg∙N∙ha−1∙year−1 in AM2, AM4, and AM3/5, respectively. The BNF estimated for the current state is therefore appropriate, compared to a typical value of approximately 12–16 kg∙N∙ha−1∙year−1 for East African farming systems [25,26,27,68,79,80]. The amount of N fixed by leguminous beans, meanwhile, depends on assumed crop yields. Only in AM3/5, where we assume the highest level of bean productivity, does the NB estimated for N reveal a positive result. A regression analysis comparing results of NB and the BNF of AM1–5 shows that at least 55 kg∙N∙ha−1∙year−1 are required in order to reverse the net balance of all natural N flows from a negative to a positive result (Supplementary Figure S5). Given that this BNF value falls between the estimated BNF for scenarios AM4 and AM3/5, we deduce that a seasonal biomass growth of beans of at least 30 ton∙ha−1 in FM is needed to reach the break-even threshold, where the NB turns from a net negative to a net positive result. This corresponds to a crop yield of about 3.8 ton∙ha−1 air-dry beans. The NB for P is positive in all scenarios, as its quantification was based on data collected from literature only. This data was equivalent for all alternatives.
3.2. Potential for Subsistence Production of Compost
The total amount of CaSa-compost produced is comparable in AM3–5, while quantities of standard compost prepared vary over scenarios (Supplementary Table S10). (Note that results are presented in terms of fresh matter (FM). We consider this to be the more practice-oriented unit, as it refers to the material that farmers actually need to transport when performing agricultural activities.) Annual compost production is projected to be equivalent to about 0.3–0.9 m3 for standard compost, and 2.6–2.8 m3 for CaSa-compost (Table 2), which is, overall, an adequate and feasible amount for annual applications [81]. The variation regarding standard compost depend (i) on the general availability of harvest residues (and thus on yield assumption, as discussed above), and (ii) whether or not the CaSa-compost is additionally produced, because then residues are divided between the two composting processes (cf. Supplementary 2.6). The average compositions of both composts in terms of relative volumes (Figure 4) fit well with local practices [39].
Recovering residues from cooking and sanitation can contribute clearly to C and nutrient contents in composts. By way of an example, P in ashes recovered from three-stone fires contributes >60% of total P in standard compost for AM1 (Figure 4a). However, in AM2–5, where a switch in cooking technology has been assumed, the use of three-stone fires and the subsequent recovery of ashes for standard composting are no longer considered in the calculation. Instead, biogas slurry from small-scale biogas digesters, and biochar recovered from microgasifier stoves are available as direct organic fertilizer in AM2, or as additive to CaSa-composting in AM3–5, respectively. Taking a closer look at the CaSa-compost (Figure 4b), it reveals that approximately 38% of total C, and 14% of the total P content originate from biochar recovered after cooking. In addition, stored urine, sanitized faeces (also referred to as “sanitized solids” (Figure 4b), as a mix of materials collected from the UDDT, which include human faeces and some sort of dry material, such as dry soil, sawdust, ash, etc., that is added after defecation to enhance the drying of faeces and to reduce smelling), and biochar recovered from sanitation, add approximately 52% and 38% of total N and of total P in CaSa-compost, respectively.
Furthermore, the total amount of biochar recovered from cooking and from sanitation, and sanitized faeces are both available in comparable amounts in terms of volume (i.e., about 1.2 and 1.0 m3∙year−1 of FM of biochar and sanitized faeces, respectively). This fits very well with the typical composition of CaSa-compost in the CaSa pilot project, which includes approximately 0.17 m3∙m−3 biochar and 0.15 m3∙m−3 sanitized faeces [39]. In addition, about 0.8 m3∙year−1, or approximately 60% of stored urine, is used for CaSa-composting. This means that the total amount of urine available as mineral IN is higher in AM2 (without CaSa-composting) as compared to AM3–5 (with CaSa-composting) (Supplementary Table S10).
Yearly application rates for standard compost are estimated at 2.0 ± 0.5 in AM4, and 4.4 ± 1.4 kg∙m−2∙year−1 of FM in AM1; those for the CaSa-compost are within the range of 1.7–1.8 kg∙m−2∙year−1 in AM3 and AM4 (Supplementary Table S5). Overall, annual application rates estimated for both composts are consistent with relevant literature [82,83]. The triennial application rates calculated in AM5, however, are significantly higher, with 11.3 ± 1.8 and 5.5 ± 0.5 kg∙m−2∙year−1 of the standard and the CaSa-compost, respectively, a figure also appropriate according to [17]. Seasonal application rates of urine vary over each of the scenarios, and range from 0.1 to 0.3 dm3∙m−2 year−1 for maize, and from 0.5 to 2.0 dm3∙m−2∙year−1 for vegetables, which is also fully consistent with common recommendations for urine fertilization [38]. Furthermore, urine application rates estimated for maize, in particular, are appropriate for one-dose fertilization per cultivation period, which ensures workloads are manageable. The appropriate timing for urine fertilization would be at week five after sowing, when crops demand most N for growing [82].
Finally, we acknowledge that not all potentials of input materials available are exhausted (Supplementary Table S11), even though nutrient deficits remain in the full SNB for N (Table 4). For example, standard compost remains available after fertilizing vegetables in most scenarios. This leftover compost could be used, therefore, to improve PB for maize and beans.
3.3. Environmental Emissions
Environmental emissions of greenhouse gases (GHG) increase in all IPNM strategies analyzed, when compared to current state practices (Figure 5a). GWPs in alternatives AM2–5 are around four to five times higher than the GWP of the current state, while the overall results of analyzed IPNM alternatives are generally comparable. The most significant contributions to GWP in AM2 can be traced back to N2O emissions from biogas slurry application (≈60% of the total GWP assessed in AM2). In the CaSa-scenarios AM3–5, CO2, and N2O emissions from CaSa-composting bring about, respectively, approximately 65% and 13% of the total GWP assessed for these alternatives.
Similarly, environmental emissions with eutrophying effects potentially increase through IPNM (Figure 5b). Numerically, EP assessed in AM2, AM4, and AM3/5 is approximately 160%, 430%, and 500% of the current EP in AM1, respectively. Overall, EPs of AM1–5 correspond closely to NH3 emissions from composting, and thus, to the intensity of the total compost production. The comparatively higher EPs estimated for AM3–5 are mainly attributable to NH3 emissions and P leaching from CaSa-composting, contributing, on average, about 60% and 20% to the EPs in AM3–5, respectively. In AM2, those emissions assessed with EP that exceed those estimated for AM1 mainly stem from N leaching after applying biogas slurry and urine, and comprise, in total, approximately 15% of the total EP in AM2. The contribution of NH3 emissions after slurry application to the EP assessed for AM2, meanwhile, is negligible.
Finally, we add some practical recommendations to reduce environmental emissions. For example, applying biogas slurry preferably to dry soil, and incorporating biogas slurry into soil within the first few minutes after application, can avoid nutrient leaching and N2O and NH3 emissions, as advised by [44,84]. Farmers may do so using a simple hand hoe. Also, [85] emphasize the importance of biogas slurry entering soil as rapidly as possible after application, and therefore, recommend a high water content in the slurry, or additional dilution of slurry with water. According to prior research presented in [39], water content of biogas slurry studied stands at approximately 95% of FM, and should thus be adequate for rapid infiltration. Likewise, [38] recommend applying urine into a furrow or hole, and closing the furrow/hole with soil afterwards, in order to reduce N2O and NH3 emissions after urine application. In addition, biochar additions to composting can potentially decrease N2O and CH4 emissions, e.g., [86,87,88,89], whilst NH3 emissions potentially increase (e.g., [87]). Other studies [33,90] showed that biochar captures nitrate and phosphate during composting, which is promising, in order to reduce nutrient leaching. However, such potentially beneficial effects of co-composting biochar have not yet been included in our model (Section 3.5).
Before synthesizing our results, we want to shortly comment on the certainty/uncertainty of (i) data that have been collected from literature and used for the modelling, and (ii) values that have been presented as results. According to [91], a relative uncertainty (RU) of <30%, ±50%, or >90% indicates “low”, “average”, or “high” uncertainty, respectively. The uncertainty of most flows considered in, and calculated by our model, can be classified as low. Nevertheless, there are some flows that show average or high uncertainty, such as, respectively, atmospheric deposition, total N and P in rainfall, N in cabbage or onion (for both, food product and harvest residue), total C in kitchen waste, P in stored urine collected from UDDT, and density of (generic) organic waste or emission factor for CO from burning agricultural residues (Supplementary Table S32). Also, with respect to the results of SNB (Supplementary Table S24), the uncertainty of most flows calculated can be classified as low. Especially values estimated for the PB, i.e., nutrient requirements and nutrient supplies, show an RU of <20%. For the NB, the uncertainty is low for N in AM1–3 and AM5, and average for N in AM4 and for P in all alternatives. The uncertainty of results estimated for the full SNB in AM1 is low. For the IPNM alternatives, the uncertainties range from average (for N in AM3/5 and P in AM2/4) to high (for N in AM2/4 and P in AM3/5), which is also indicated with grey error bars for the standard errors of the means in Figure 3.
3.4. Sustainability Aspects of Intersectional Resource Management
When evaluating our results, our main focus is on the potential for sustainable soil fertility management. In particular, we aim at taking the specific vulnerability of smallholders into consideration, and the importance of the soil as a basis of existence and subsistence. Hence, in order to be considered “sustainable”, soil management should, among other factors, maintain or improve crop productivity and mitigate existing soil constraints, such as nutrient depletion and soil acidity (Section 2.1). In the contemporary context, it should also promote resilience in farming in the face of climate change as a local and global threat. Therefore, SOM, which contributes to the soil’s water holding capacity and erosion resistance, and the restoration of SOM, are of utmost importance as climate adaptation measures. Furthermore, adequate soil P levels support climate mitigation and adaptation, due to the fact that a sufficient supply of soil P supports plants to root more deeply, which, in turn, makes crops less vulnerable to drought [92]. To sum up, the focus of our final evaluation is on the potential of IPNM practices to (i) replenish soil P, (ii) combat soil acidification, (iii) restore SOM, and (iv) sequester C. In addition, (v) we briefly discuss, integrated environmental emissions accumulated for smallholder household and farmland. (Effects on crop productivity, as a consequence to improved soil fertility, is not further discussed here. Estimated figures of food products for self-consumption (OUT1a) and food products sold to market (OUT1b) are displayed in Supplementary Tables S20–S22.)
3.4.1. Replenishing Soil P
In AM1–4, phosphate is applied with annual rates of around 20–60 kg∙P∙ha−1∙year−1 (Supplementary Table S6). Within this range, per hectare P applications estimated for CaSa-compost as applied to maize and beans, and those for standard compost as applied to vegetables, are very similar. When considering amendments to soil cultivated with maize and beans, CaSa-compost used in AM3–5 accounts for about 175% of total P provided in the form of biogas slurry in AM2. Compared to our results, [17] consider 10–20 kg∙P∙ha−1 as a sufficient seasonal P application to degraded soils in East Africa that are characterized by strong P-fixation, as is the case for Karagwe Andosols. In addition, [93] found that application rates of >25 kg∙P∙ha−1∙season−1 over the course of four seasons were capable of replenishing levels of P in a P deficient soil in Western Kenya. In contrast, the application of 40 or 70 kg∙P∙ha−1 in the form of biogas slurry or standard compost, respectively, was not sufficient to increase extractable soil P, as demonstrated in a short-term field trial on the local Andosol [61]. Adding about 140 kg∙P∙ha−1 with CaSa-compost, however, significantly increased levels of available P in the soil after the experiment, and thus, immediately contributed to mitigating P deficiency [17]. The latter P amendment is comparable to our present results in AM5, where P is supplied triennially in the range of around 100–200 kg∙P∙ha−1∙year−1 for both composts analyzed. In comparison, [17] suggests 100–500 kg∙P∙ha−1 for one large application repeated “every few years”.
When considering application frequency and subsequent plant response, [94] emphasize that a seasonal and moderate application of P is more effective in increasing crop yields than a large, one-off application. This contradicts [17], who recommends both strategies. In addition, [94] reason that a lower input of P is preferable, as the residual effect of a single fertilization dose is far lower than the initial and direct effect of the seasonal fertilizer application. In other words, P-use efficiency of fertilizers is higher at comparatively lower inputs of P [17]. By contrast, a model-based simulation of [95] supports an appropriate supply of plant available P to crops originating in residual soil P pools. The authors promote substantial efforts to build up soil P, whilst being patient with respect to the known hysteric response of plants to fertilizer application [17]. The specific hysteric characteristics of local Karagwe Andosol have not, to the best of our knowledge, yet been studied. Finally, [94] argue against large P applications, as farmers often lack the capital, as well as the machinery, to apply the large quantities required for appropriate fertilization. In the present work, we have demonstrated the potential to provide P-rich inputs to agriculture on-farm, at no additional cost, and in such quantities that are feasible to apply with standard tools, such as a wheelbarrow and hand hoe.
3.4.2. Combating Soil Acidification
In order to strengthen nutrient cycling processes, acidity management through liming is an important practice [92]. Nutrient availability in the soil is, among other factors, a function of soil pH [96]. This means that an increase in soil pH through liming promotes plant uptake of P and N from organic and mineral fertilizers, and thus renders on-farm nutrient recycling more efficient. Organic material has an equivalent potential to neutralize soil acidity levels as lime (CaO) [97,98].
In an earlier study, we quantified the potential liming effect of the substrates analyzed [39]. We have integrated this data into the present study to deduce the following results: In AM1–4, the liming effects of annual organic INs are equivalent to around 200–650 kg∙CaO∙ha−1∙year−1 (Supplementary Table S7). All treatments studied, therefore, meet the minimum requirements of 50 kg∙CaO∙ha−1∙year−1 to avoid Al toxicity, and to neutralize acid deposition from the atmosphere onto agricultural soils [96]. Within the ranges presented, however, amendments with biogas slurry and standard compost have significantly lower liming potentials (≈ 200–400 kg∙CaO∙ha−1∙year−1) as compared to the CaSa-compost (<600 kg∙CaO∙ha−1∙year−1). In AM5, the liming effect is estimated in the range of around 1000–2300 kg∙CaO∙ha−1, and refers to the same soil amended every three years. This treatment is, therefore, adequate to maintain, or even improve, soil pH in accordance with [82], who recommends a triennial application of 1250–2250 kg∙CaO∙ha−1. Empirically, an immediate rise of soil pH within one cropping season was only possible with CaSa-compost, not with standard compost or biogas slurry, and at an application rate of about 2000 kg∙CaO∙ha−1 [61].
3.4.3. Restoring SOM
The capacity to restore SOM generally depends on the form in which C is recovered and applied to soil. Compost and biogas slurry typically provide, respectively, about 50% and 25% of total organic C content for reproducing SOM [83]. For this reason, amendments of total C with standard compost (Supplementary Table S8) correspond to SOM reproduction potentials on soil cultivated with vegetables, varying approximately 1.4–1.9 ton∙SOM-C∙ha−1∙year−1 in AM1–4 (Supplementary Table S9). In comparison, cabbage and onion consume approximately 2.1 and 0.7 ton∙SOM-C∙ha−1∙year−1, respectively. Moreover, on soil cultivated with maize and beans, the amendment of total C with CaSa-compost is about two and a half times higher than compared to biogas slurry. Hence, inputs of biogas slurry and CaSa-compost consequently correspond to SOM reproduction potentials of about 0.3 and 1.2–1.3 ton∙SOM-C∙ha−1∙year−1, respectively. Maize meanwhile consumes approximately 1.4 ton∙SOM-C∙ha−1∙year−1, while beans replenish SOM-C at the rate of about 0.4 ton∙SOM-C∙ha−1∙year−1 [99]. In scenario AM5, the SOM reproduction potentials of standard compost and CaSa-compost are approximately 9.1 and 3.9 ton∙SOM-C∙ha−1∙year−1, respectively, which then has to serve for three years of continuous cropping. To sum up, the potential for reproducing SOM for large applications of standard compost in AM5, or for general applications of CaSa-compost in AM3–5, is estimated at slightly higher than the accumulated C consumption of crops. This finding indicates a potential for replenishing SOM, and even for sequestering it.
3.4.4. Sequestering C
Carbon sequestration refers to long-term storage of CO2 in the form of SOM, in order to mitigate global warming, and also, in principle, to an increase of SOM. Furthermore, the addition of phosphate and lime promotes a stable increase in SOM in deeply weathered tropical soils [76], such as the local soil. For this reason, sequestering C is possible in the present system analysis through the use of compost and, particularly, the CaSa-compost, which simultaneously promotes restoring SOM, replenishing soil P, and liming. The context of the present analysis further promotes C sequestration, as local soil is known for its outstanding capacity to accumulate organic C. Andosols tend to protect organic matter from degradation by forming either metal–humus (i.e., often Al–Fe), or allophane–organo complexes [100]. Thus, Andosols can act as a CO2 sink [101].
Furthermore, CaSa-compost contains biochar recovered from cooking and sanitation. Biochar potentially renders C sequestration possible, because (i) it originates from renewable biomasses [102], and (ii) it is characterized by relatively recalcitrant organic compounds, which promise the long-term “stability” of biochar in the soil [29]. In regard to the latter, [103] recently criticised the traditional model of “labile and stable organic compounds” and their role in the genesis of long-term “stable” SOM. The degradation of SOM and other organic matter in the soil is rather a continuum, and depends on many factors, including accessibility of matter, microbial ecology, energy transportation processes, prevailing temperatures affecting enzymes, etc. [17]. To the best of our knowledge, however, long-term studies observing the effect of compost amendments—with and without biochar—on SOM in tropical Andosols do not exist. We are, therefore, unable to quantify the general potential for C sequestration with existing data, and any further discussion would enter into the realms of speculation.
Nonetheless, we may at least compare our modelling results for CaSa-scenarios with data available from empiric studies in the region on biochar applications and effects. According to our model, biochar is applied at rates of approximately 2.7 ton∙ha−1∙year−1 in AM3 or AM4, and of about 8.0 ton∙ha−1∙year−1 in AM5, which is presumably equivalent to rates of 2.0 ton∙C∙ha−1∙year−1 and 6.0 ton∙C∙ha−1∙year−1, respectively. In comparison, [50] generally identified a minimum application rate of biochar, leading to a significant increase in SOM, and thus to C sequestration, of 50 ton∙ha−1. On highly degraded soil in Kenya, [58] empirically demonstrated that biochar amendments equivalent to 6 ton∙C∙ha−1, applied in three consecutive seasons, increased SOM by 45%, as compared to the unamended control soil.
3.4.5. Integrated Environmental Emissions
Finally, we estimate the overall environmental impact of the intersectional resource management analyzed. We have, therefore, aggregated environmental emissions of the entire smallholder farming system, including MES, MSS, and AES. With respect to overall climate balance (Supplementary Figure S4a with plot data in Tables S15 and S18), integrated GWP in AM2, when shifting to a biogas system and an UDDT, and while utilizing biogas slurry and stored urine as inputs to the farm land, is more than 250% of the integrated GWP in AM1. This is caused by (i) extremely high levels of GWP identified for operating biogas systems [41] propagating into the integrated perspective, and (ii) comparatively higher levels of GWP identified for the AES (Figure 5a). By contrast, [104] estimated that overall GHG emissions decrease when integrating biogas digestion to organic farming systems through a lifecycle assessment methodology. However, the net reduction originates from offsetting fossil fuels consumed for producing electrical energy, which lie outside the scope of the present analysis [17]. The total GWPs of CaSa-scenarios are generally comparable to the current state. In AM3–5, GWP assessed for the MES decreased when shifting from three-stone fires to microgasifier stoves [41]. This is offset, however, by increased GWP assessed for the AES (Figure 5a). With respect to emissions with eutrophying effects (Supplementary Figure S4b with plot data in Tables S16 and S19), the integrated EPs for all IPNM strategies studied in AM2–5 is only about half of the total EP in AM1. This general decrease of integrated EP is attributable mainly to lower EP levels assessed for using an UDDT instead of a pit latrine [17]. In AM2 and AM3–5, a proportion of the EP reduced in the MSS are, however, offset by higher EP analyzed for biogas production, or for CaSa-compost production, respectively.
Results of the synthesis above refer to our case study in Karagwe, and are summarized in Table 5.
3.5. Discussion of Methodology
Overall, we consider the combination of MFA and SNB as a highly appropriate methodology for conducting a holistic ex-ante assessment of soil management practices in SSA smallholdings. Both methods generally aim at a structured analysis of certain substances flowing in an arbitrary complex system, and therefore, follow comparable principles and procedures. Selecting certain IN and OUT, which are generally considered in SNB, allowed us to describe the real farming system in as simple a manner as possible, yet also in as complex a manner as necessary, for the scope of this study. MFA supplemented our analysis by providing a framework, (i) to expand our investigations, by incorporating both private households and the environment into a single system analysis, (ii) to compute our analyses with uncertainties incorporated into it, and (iii) to illustrate the results of composting processes into flow diagrams. The first point, in particular, allowed us to derive additional information, such as C content or liming potentials of the substrates analyzed, composition of composts, emissions from composting, etc.
Despite obvious strengths, we identify the following limitations in the applied methodology:
(I) Data used to assume biomass production and crop yields in AM2–5 derive from a field trial conducted in Karagwe [61]. The experiment was well adapted to local practices, but only lasted for one cropping season. The results still need, therefore, to be replicated for validation. Nevertheless, practical experiences from the case study underline existing scientific results so far.
(II) The time needed for mineralization, the form of applied nutrients (i.e., organic versus mineral N or P), and the transfer of the applied nutrients to the various nutrient pools in the soil (e.g., labile and stable pools of P) is not taken into account in our model. This simplification is accounted for by the fact that our model is a static one, and it was not possible to include dynamic effects. Instead, we simply assumed that the treatments analyzed would be applied repeatedly, and thus constantly release nutrients to various pools. The total nutrient uptake of plants in one season is rather the sum of contributions from different previous cultivation periods. Our model, however, suggests that plant uptake is equivalent to the contributions applied over one single season.
(III) Soil and nutrient losses through wind and water erosion are not considered in our model. We reason that (i) [27] also neglected soil erosion as a natural OUT when conducting SNB for shamba systems in Karagwe; (ii) available data on slopes and erosion sensitivity of the local soil are not sufficient; and (iii) many farmers in Karagwe apply erosion control measures, such as contour planting, catching water in trenches, mulching, intercropping with cover-crops, and agroforestry, to control soil erosion. According to local expert judgment, efforts to implement countermeasures are widely adopted by farmers in Karagwe. However, [69] report a possible range of 0–28 kg∙ha−1∙year−1 for erosion induced N-losses from arable land in East Africa. Other SNB studies conducted for Uganda, estimated N- and P-losses with 5–14 and 1.5–10.0 kg∙ha−1∙year−1, respectively [25,79,80].
(IV) Sequestered C could have been subtracted from total GWP according to the Kyoto Protocol. However, C sequestration rates of local soils are, to the best of our knowledge, largely unknown. Hence, we excluded C sequestration in GWP accounting, which, according to [102], is valid if biogenic CO2 emissions are included in the assessment, which is the case in our model for CO2 emissions from composting.
(V) Environmental emissions with EP are likely to be over-estimated. We assessed the EP after [74], and consequently included both total P, and total N contained in liquid emissions. Given that high levels of P fixation can be expected for the local soil [101], and given that P is relatively immobile in the soil [94], we presume that phosphate would most likely remain in the soil surrounding pit latrines. By contrast, pollution of underground water resources is more likely from ammonium emissions. If we were to exclude P leaching from our assessment, our EP estimations could possibly be reduced to about 70–90% of the EP (Figure 5b).
(VI) Possible biochar-related effects are not considered when quantifying GHG emissions, or nutrient leaching from the composting process. We rather assumed equal processes and emission factors for standard compost and biochar-containing CaSa-compost. We reason that existing scientific data on using biochar as a soil amendment are contradictory, cf. [105,106]. Overall, available data expose existing uncertainties in various areas, knowledge gaps in underlying principles and mechanisms, and the admission that possible effects of biochar amendments are highly site-specific [105]. For these reasons, we judge that it is not yet possible to depict biochar effects in a model such as the present one.
(VII) The model developed in this study does not yet depict soil dynamics, such as nutrient dynamics or SOM transformations. Further empiric studies are therefore required to study, for example, in situ interactions of biochar, soil nutrient pools, and SOM in long-term field experiments, and the effects of amending selected treatments, such as biochar-compost to tropical Andosols. Empiric data collected would help quantify the relationship between compost applications and replenishment rates of soil nutrients, turnover rates of SOM, and accumulation rates of SOM for C sequestration. Analytical work, such as dynamic modelling, could then follow, in order to estimate the timeframes associated with soil effects.
Despite all limitations discussed, we consider the present model to be complex enough, and therefore adequate to sufficiently answer our research questions.
4. Conclusions
By adopting an integrated perspective on farming and households, we draw the following conclusions with respect to the research objectives, and for the example, of smallholdings in Karagwe, TZ:
- The IPNM strategies analyzed, i.e., utilizing resources recovered from cooking and sanitation, show a clear potential to decrease currently existing soil nutrient deficits. Specifically, net P balance is reversed, giving a positive result. This means that P depletion is avoided, while depletion rates of N are mitigated, but not avoided completely.
- Biogas slurry, standard compost, or CaSa-compost, are all feasible for completely meeting P demand of crops. All organic inputs analyzed require application in combination with a mineral fertilizer, such as urine, to compensate crop N-demand.
- Recovering and utilizing residues from households for composting allows for the production of adequate quantities of compost on-farm. Biochar recovered from cooking and/or sanitation specifically contributes to C contained in CaSa-compost, while residues from EcoSan significantly contribute to nutrient content of CaSa-compost.
- Environmental emissions greatly increase with the production and use of organic fertilizers, whereby the climate balance declines for all IPNM scenarios analyzed. The EP also demonstrates an increase in association with intensive subsistence production of composts.
When considering the analyzed IPNM practices with respect to certain relevant sustainability aspects, we emphasise that
- Using the CaSa-compost is a suitable method for sustainable soil fertility management, due to the following factors: (i) applied P amendments are appropriate to replenish P in exhausted soils, (ii) estimated liming effects are suitable for mitigating existing soil acidification, (iii) C inputs contribute to restoring the SOM, and (iv) potentially also to C sequestration, while (v) the overall GWP is maintained, and total EP is reduced.
- Regarding the aforementioned benefits identified for compost amendments, the potential of the CaSa-compost is superior to the standard compost, especially with respect to liming and SOM restoration. By contrast, the use of biogas slurry is inferior in all aspects when compared to compost amendments, especially for liming, SOM restoration, and emissions with GWP.
Conceptually, combining SNB with MFA was beneficial because it enabled us to:
- Conduct an analysis from a system perspective around the nexus of energy-sanitation-agriculture, instead of focusing only on farming products and processes.
- Create a functional link between smallholder households, farming practices, soil nutrient stocks, and the environment.
- Shed light on how IPNM strategies that combine use of residues from cooking and sanitation affect local soil nutrient budgeting in comparison to the current state.
To sum up, we found that switching household technologies to locally adopted alternatives, such as biogas digesters, microgasifiers, and UDDTs, combined with the consequent recovery and use of residues, has a strong potential to improve SNBs in farming. Moreover, both of the prevailing challenges for the agricultural production in Karagwe—P-scarcity and soil acidity—can be mitigated through the use of biochar–faecal-compost. We judge that our results are transferable to comparable smallholder systems in other regions of SSA, where similar technologies are available. Moreover, estimated results from this study, which focus at the farm level, may serve as a starting point for upscaling analyses from the farm level to the community or district level. In addition, they help estimate potential positive environmental and agronomic impacts, which in turn support local initiatives aimed at sustainable farming and soil improvement. We maintain that a socio-economic assessment should follow up on this study.
Overall, we conclude that integrating residues from farming households into agricultural practices is a promising path for subsistence farmers wishing to escape the vicious circle of insufficient production of food crops, and therefore, residual matter, leading to poor soil fertility. Nevertheless, efficient recycling of all available domestic refuses is required to offset those local soil nutrient deficits identified in this study. Exploiting the potentials of the analyzed recycling practices therefore requires a considerable effort on the part of local farmers, affecting processes including transportation of materials, making compost, collecting and using urine (or other mineral fertilizer), etc. Smallholders need to pursue multiple practical aims, including optimizing nutrient recovery efficiency, maintaining sound composting processes, minimizing workload, reducing GHG emissions, etc. For these reasons, various (objective) criteria and subjective preferences need to be considered jointly from an intersectional and transdisciplinary perspective. We must, therefore, consider the possibility that a single “optimum solution” may not exist, but rather pursue a “best option” that measures the delicate balance of all these different objectives against one another. For example, the multi-disciplinary approach of a multi-criteria analysis (MCA) can be applied for selecting and considering the objectives of the evaluation, identifying the preferences of all the people involved, and ensuring transparency within the group of decision makers.
Supplementary Materials
The following are available online at https://www.mdpi.com/2077-0472/8/3/31/s1, Figure S1: Example of a shamba, the agricultural land surrounding farming houses, also called “banana-based home garden”, used for inter-cropping of perennial crops like fruit, banana, and coffee trees, and annual crops including beans, cassava, African eggplant, etc., Figure S2: Example of a msiri, former grassland used for the cultivation of annual crops including maize, beans, millet, and vegetables, like tomatoes, cabbage, onion, etc., Figure S3: Proceeding of the applied system analysis combining the material flow analysis (MFA) with the soil nutrient balance (SNB) for an annual intercropping system in Karagwe, TZ, Figure S4: Integrated environmental impacts of the micro energy systems (MES/red), the micro sanitation system (MSS/blue), and the agroecosystem AES/green) for the global warming potential (a) and the eutrophication potential (b), Figure S5: Regression analysis for estimating the relationships between the N flows in the natural balance (NB) and the biological nitrogen fixation (BNF) for all of the five analyzed scenarios; values are displayed in kg of N per hectare and year, Table S1: Production of main crops in Kagera region and Karagwe district based on the national sample census of agriculture 2007/2008, Table S2: Pictures and short description of the analyzed cooking alternatives that are locally available in Karagwe, TZ, Table S3: Pictures and short description of the analyzed sanitation alternatives that are locally available in Karagwe, TZ, Table S4: Definition of the system analyzed, Table S5: Estimated application rates of the organic and mineral inputs studied in scenarios AM1–AM5 in kg of FM per household and year, Table S6: Estimated P-inputs with organic and mineral inputs studied in scenarios AM1–AM5 in kg of P per hectare and year, Table S7: Estimated liming effects of the organic material expressed in equivalent application in kg of CaO per hectare and year calculated with liming potentials presented in Krause et al. (2015), Table S8: Estimated C inputs with organic and mineral inputs studied in scenarios AM1–AM5 in kg of C per hectare and year, Table S9: Estimated SOM reproduction potentials with organic and mineral inputs studied in scenarios AM1–AM5 in kg of C in SOM per hectare and year, Table S10: Available materials for organic and mineral fertilization in kg year−1 of FM, Table S11: Utilization of the matter as input material in % of available FM, Table S12: Estimated SNB for N and P comprising natural input (IN3a, 4a, 4b) and natural output (OUT3, 4a) flows; organic (IN2a–2e) and mineral (IN1c) input flows; and output flows (Out1a, 1b, 2) with agricultural products; in kg of N and P per household and year; plot data for Figure 3, Table S13: Estimated environmental impacts of the analyzed IPNM strategies: the global warming potential in kg of CO2 equivalents per household and year; plot data for Figure 5a, Table S14: Estimated environmental impacts of the analyzed IPNM strategies: the eutrophication potential in kg of PO4 equivalents per household and year; plot data for Figure 5b, Table S15: Integrated environmental impacts with GWP of the MES, the MSS, and the AES in kg of CO2 equivalents per household and year; plot data for Supplementary Figure S4a, Table S16: Integrated environmental impacts with EP of the MES, the MSS, and the AES in kg of PO4 equivalents per household and year; plot data for Supplementary Figure S4b, Table S17: Evaluation SNB—regression analysis: estimated biological N fixation and estimated natural balance in kg of N per household and year; plot data for Supplementary Figure S3, Table S18: Relative contribution of the different resources used for standard composting and for CaSa-composting to the total input flow in terms of volume and content of C, N, and P prior to the composting process in %; plot data for Figure 4a, Table S19: Relative contribution of the different resources used for standard composting and for CaSa-composting to the total input flow in terms of volume and content of C, N, and P prior to the composting process in %; plot data for Figure 4b, Table S20: Material output flows of food products (i.e., maize and beans grains, cabbage heads, and onion bulbs) in kg of FM (after air-drying for maize, beans, and onion) per household and year, Table S21: Material output flows of food products for self-consumption in kg of FM (after air-drying for maize, beans, and onion) per household and year, Table S22: Material output flows of food products sold to market in kg of FM (after air-drying for maize, beans, and onion) per household and year, Table S23: Material output flows of harvest residues in kg of FM (at time of harvesting) per household and year, Table S24: Relative uncertainties (RU) of results calculated defined as the standard error in % of the arithmetic mean value. Supplementary S1: General information; Supplementary 2: Specific equations applied for modelling; Supplementary 3: Assessment of emissions to the environment; Supplementary 4: Short Discussion; Supplementary 5: Data collection of material and process values; Supplementary 6: Terminology.
Acknowledgments
We would like to express our sincere thanks to the teams of the case study projects and the MAVUNO staff for their support to this work by sharing project data and information on the cropping systems and ways of farming. Sincere thanks to Richard Aslan for professional editing service. We also thank the Hans Böckler Foundation and the Central Women’s Representative of TU Berlin for financially supporting Ariane Krause’s PhD scholarship. We acknowledge support by the German Research Foundation and the Open Access Publication Funds of TU Berlin.
Author Contributions
Ariane Krause conceived and designed the system analysis; Ariane Krause performed the data collection, data evaluation and modelling; Ariane Krause and Vera Susanne Rotter discussed findings, results, and conclusions as well as visual presentation of results. Ariane Krause prepared the manuscript including drafting the text and preparing figures and tables; Vera Susanne Rotter cooperated by correcting the text and promoting professional discussions.
Conflicts of Interest
The authors declare no conflict of interest. The founding sponsors had no role in the design of the study; in the collection, analyses, or interpretation of data; in the writing of the manuscript, and in the decision to publish the results.
References
- Von Liebig, J.F.; Playfair, L.P.B.; Webster, J.W. Organic Chemistry in Its Applications to Agriculture and Physiology; Owen, J., Ed.; Printed for Taylor and Walton: London, UK, 1841. [Google Scholar]
- McIntyre, B.D.; Herren, H.R.; Wakhungu, J.; Watson, R.T. Agriculture at a crossroads. In Synthesis Report of the Global and Sub-Global, IAASTD Reports; Island Press: Washington, DC, USA, 2009; 106p. [Google Scholar]
- De Schutter. Agroecology and the Right to Food. Report by the Special Rapporteur on the Right to Food; 16th Session of the United Nations Human Rights Council (A/HRC/16/49); United Nations General Assembly: Geneva, Switzerland, 2011; Available online: http://www.srfood.org/en/report-agroecology-and-the-right-to-food (accessed on 11 May 2017).
- FAO. A Statement by FAO Director-General José Graziano da Silva; 24th Session of the Committee on Agriculture (COAG) Opening Statement; Food and Agriculture Organization of the United Nations (FAO): Rome, Italy, 2014; Available online: http://www.fao.org/about/who-we-are/director-gen/faodg-statements/detail/en/c/250139/ (accessed on 24 October 2016).
- La Via Campesina. Declaration of the International Forum for Agroecology. Available online: https://viacampesina.org/en/index.php/main-issues-mainmenu-27/sustainable-peasants-agriculture-mainmenu-42/1749-declaration-of-the-international-forum-for-agroecology (accessed on 15 November 2016).
- Lal, R. Managing soils for feeding a global population of 10 billion. J. Sci. Food Agric. 2006, 86, 2273–2284. [Google Scholar] [CrossRef]
- Lal, R. Soils and world food security. Soil Till Res. 2009, 102, 1–4. [Google Scholar] [CrossRef]
- Tittonell, P. Feeding the world with soil science: embracing sustainability, complexity and uncertainty. SOILD 2016. [Google Scholar] [CrossRef]
- Kiers, E.T.; Leakey, R.R.; Izac, A.M.; Heinemann, J.A.; Rosenthal, E.; Nathan, D.; Jiggins, J. Agriculture at a crossroads. Science 2008, 320, 320–321. [Google Scholar] [CrossRef] [PubMed]
- Markwei, C.; Ndlovu, L.; Robinson, E.; Shah, W.P. International Assessment of Agricultural Knowledge, Science and Technology for Development (IAASTD): Sub-Saharan Africa Summary for Decision Makers; Island Press: Washington, DC, USA, 2008. [Google Scholar]
- FAO. What is Integrated Plant Nutrient Management? FAO: Rome, Italy, 2016; Available online: http://www.fao.org/agriculture/crops/thematic-sitemap/theme/spi/scpi-home/managing-ecosystems/integrated-plant-nutrient-management/ipnm-what/en/ (accessed on 24 October 2016).
- Roy, R.N.; Finck, A.; Blair, G.J.; Tandon, H.L. Plant Nutrition for Food Security; A Guide for Integrated Nutrient Management, FAO Fertilizer and Plant Nutrition Bulletin 16; FAO: Rome, Italy, 2006. [Google Scholar]
- Amoding, A.; Tenywa, J.S.; Ledin, S.; Otabbong, E. Agronomic effectiveness of urban market crop waste compost on-farm in Uganda. In Proceedings of the African Crop Science Conference, Entebbe, Uganda, 5–9 December 2005; African Crop Science Society: Kampala, Uganda, 2005; pp. 1133–1138. [Google Scholar]
- Karungi, J.; Kyamanywa, S.; Ekbom, B. Organic soil fertility amendments and tritrophic relationships on cabbage in Uganda: Experiences from on-station and on-farm trials. Afr. J. Agric. Res. 2010, 5, 2862–2867. [Google Scholar]
- Tumuhairwe, J.B.; Tenywa, J.S.; Otabbong, E.; Ledin, S. Comparison of four low-technology composting methods for market crop wastes. Waste Manag. 2009, 29, 2274–2281. [Google Scholar] [CrossRef] [PubMed]
- Palm, C.A.; Myers, R.J.K.; Nandwa, S.M. Combined Use of Organic and Inorganic Nutrient Sources for Soil Fertility Maintenance and Replenishment. In Replenishing Soil Fertility in Africa; Buresh, R.J., Sanchez, P.A., Calhoun, F., Eds.; Soil Science Society of America (SSSA) Special Publication 51: Madison, WI, USA, 1997; p. 217. [Google Scholar] [CrossRef]
- Buresh, R.J.; Smithson, P.C.; Hellums, D.T. Building soil phosphorus capital in Africa. In Replenishing Soil Fertility in Africa; Buresh, R.J., Sanchez, P.A., Calhoun, F., Eds.; SSSA Special Publication 51: Madison, WI, USA, 1997; pp. 111–149. [Google Scholar] [CrossRef]
- Montanarella, L.; Pennock, D.J.; McKenzie, N.; Badraoui, M.; Chude, V.; Baptista, I.; Vargas, R. World’s soils are under threat. SOIL 2016, 2, 79–82. [Google Scholar] [CrossRef]
- Sanginga, N.; Woomer, P.L. (Eds.) Integrated Soil Fertility Management in Africa: Principles, Practices, and Developmental Process; Tropical Soil Biology and Fertility Institute of the International Centre for Tropical Agriculture: Nairobi, Kenya, 2009; 263p. [Google Scholar]
- Nziguheba, G.; Zingore, S.; Kihara, J.; Merckx, R.; Njoroge, S.; Vanlauwe, B. Phosphorus in smallholder farming systems of sub-Saharan Africa: Implications for agricultural intensification. Nutr. Cycl. Agroecosys. 2016, 104, 321–340. [Google Scholar] [CrossRef]
- De Jager, A.; Nandwa, S.M.; Okoth, P.F. Monitoring nutrient flows and economic performance in African farming systems (NUTMON): I. Concepts and methodologies. Agric. Ecosyst. Environ. 1998, 71, 37–48. [Google Scholar] [CrossRef]
- Roy, R.N.; Misra, R.V.; Lesschen, J.P.; Smaling, E.M.A. Chapter 2 Methodologies for assessing soil nutrient balances—section “microlevel”. In Assessment of Soil Nutrient Balance: Approaches and Methodologies; FAO: Rome, Italy, 2003; Volume 14, pp. 46–70. [Google Scholar]
- Stoorvogel, J.J.; Smaling, E.M. Assessment of Soil Nutrient Depletion in Sub-Saharan Africa: 1983–2000; Volume II: Nutrient Balances per Crop and per Land Use Systems; Winand Staring Centre for Integrated Land, Soil and Water Research: Wageningen, The Netherlands, 1990. [Google Scholar]
- Zhou, M.; Brandt, P.; Pelster, D.; Rufino, M.C.; Robinson, T.; Butterbach-Bahl, K. Regional nitrogen budget of the Lake Victoria Basin, East Africa: Syntheses, uncertainties and perspectives. Environ. Res. Lett. 2014, 9, 105009. [Google Scholar] [CrossRef]
- Lederer, J.; Karungi, J.; Ogwang, F. The potential of wastes to improve nutrient levels in agricultural soils: A material flow analysis case study from Busia District, Uganda. Agric. Ecosyst. Environ. 2015, 207, 26–39. [Google Scholar] [CrossRef]
- Stoorvogel, J.J.; Smaling, E.A.; Janssen, B.H. Calculating soil nutrient balances in Africa at different scales I Supra-national scale. Fertil. Res. 1993, 35, 227–235. [Google Scholar] [CrossRef]
- Baijukya, F.P.; de Steenhuijsen, P.B. Nutrient balances and their consequences in the banana-based land use systems of Bukoba district, northwest Tanzania. Agric. Ecosyst. Environ. 1998, 71, 147–158. [Google Scholar] [CrossRef]
- Möller, K.; Müller, T. Effects of anaerobic digestion on digestate nutrient availability and crop growth: A review. Eng. Life Sci. 2012, 12, 242–257. [Google Scholar] [CrossRef]
- Lehmann, J.; Joseph, S. Biochar for Environmental Management: Science and Technology; Earthscan: London, UK, 2009; p. 449. ISBN 978-1844076581. [Google Scholar]
- Taylor, P. (Ed.) The Biochar Revolution. In Transforming Agriculture & Environment; Global Publishing Group Mt Evelyn: Victoria, Australia, 2010; ISBN 978-1921630415. [Google Scholar]
- Glaser, B.; Lehmann, J.; Zech, W. Ameliorating physical and chemical properties of highly weathered soils in the tropics with charcoal: A review. Biol. Fertil. Soils 2002, 35, 219–230. [Google Scholar] [CrossRef]
- Sombroek, W. Amazon Soils: A Reconnaissance of Soils of the Brazilian Amazon Region; Dissertation, Agricultural State University of Wageningen; Centre for Agricultural Publications and Documentation: Wageningen, The Netherlands, 1996. [Google Scholar]
- Kammann, C.I.; Schmidt, H.P.; Messerschmidt, N.; Linsel, S.; Steffens, D.; Stephen, J. Plant growth improvement mediated by nitrate capture in co-composted biochar. Nat. Sci. Rep. 2015, 5, 11080. [Google Scholar] [CrossRef] [PubMed]
- Esrey, S.A.; Andersson, I.; Hillers, A.; Sawyer, R. Closing the Loop—Ecological Sanitation for Food Security; Publications on Water Resources No. 18; Swedish International Development Cooperation Agency (SIDA): Tepoztlán, Mexico, 2001; ISBN 91-586-8935-4. [Google Scholar]
- Winblad, U.; Simpson-Hébert, M.; Calvert, P.; Morgan, P.; Rosemarin, A.; Sawyer, R.; Xiao, J. Ecological Sanitation—Revised And Enlarged Edition; SEI: Stockholm, Sweden, 2004. [Google Scholar]
- WHO. WHO guidelines for the safe use of wastewater, excreta and greywater. In Excreta and Greywater Use in Agriculture; World Health Organization (WHO) Press: Geneva, Switzerland, 2006; Volume 4, p. 222. ISBN 92-4-154685-9. [Google Scholar]
- Niwagaba, C.; Nalubega, M.; Vinnerås, B.; Sundberg, C.; Jönsson, H. Bench-scale composting of source-separated human faeces for sanitation. Waste Manag. 2009, 29, 585–589. [Google Scholar] [CrossRef] [PubMed]
- Richert, A.; Gensch, R.; Jönsson, H.; Stenström, T.A.; Dagerskog, L. Practical Guidance on the Use of Urine in Crop Production; Stockholm Environment Institute (SEI): Stockholm, Sweden, 2010; ISBN 978-918-612-521-9. [Google Scholar]
- Krause, A.; Kaupenjohann, M.; George, E.; Köppel, J. Nutrient recycling from sanitation and energy systems to the agroecosystem—Ecological research on case studies in Karagwe, Tanzania. Afr. J. Agric. Res. 2015, 10, 4039–4052. [Google Scholar] [CrossRef]
- Feachem, R.G.; Bradley, D.J.; Garelick, H.; Mara, D.D. Sanitation and Disease—Health Aspects of Excreta and Wastewater Management; World Bank Studies in Water Supply and Sanitation No. 3; John Wiley & Sons: Chichester, UK, 1983; p. 534. [Google Scholar]
- Krause, A.; Rotter, V.S. Linking energy-sanitation-agriculture: Intersectional resource management in smallholder households in Tanzania. Sci. Total Environ. 2017, 590, 514–530. [Google Scholar] [CrossRef] [PubMed]
- Heinonen-Tanski, H.; van Wijk-Sijbesma, C. Human excreta for plant production. Bioresource Technol. 2005, 96, 403–411. [Google Scholar] [CrossRef] [PubMed]
- Amlinger, F.; Peyr, S.; Cuhls, C. Green house gas emissions from composting and mechanical biological treatment. Waste Manag. Res. 2008, 26, 47–60. [Google Scholar] [CrossRef] [PubMed]
- Möller, K.; Stinner, W.; Deuker, A.; Leithold, G. Effects of different manuring systems with and without biogas digestion on nitrogen cycle and crop yield in mixed organic dairy farming systems. Nutr. Cycl. Agroecosys. 2008, 82, 209–232. [Google Scholar] [CrossRef]
- Baba, Y.; Tada, C.; Watanabe, R.; Fukuda, Y.; Chida, N.; Nakai, Y. Anaerobic digestion of crude glycerol from biodiesel manufacturing using a large-scale pilot plant: Methane production and application of digested sludge as fertiliser. Bioresource Technol. 2013, 140, 342–348. [Google Scholar] [CrossRef] [PubMed]
- Clements, L.J.; Salter, A.M.; Banks, C.J.; Poppy, G.M. The usability of digestate in organic farming. Water Sci. Technol. 2012, 66, 1864–1870. [Google Scholar] [CrossRef] [PubMed]
- Garfí, M.; Gelman, P.; Comas, J.; Carrasco, W.; Ferrer, I. Agricultural reuse of the digestate from low- cost tubular digesters in rural Andean communities. Waste Manag. 2011, 31, 2584–2589. [Google Scholar] [CrossRef] [PubMed]
- Herath, H.M.S.K.; Camps-Arbestain, M.; Hedley, M. Effect of biochar on soil physical properties in two contrasting soils: An Alfisol and an Andisol. Geoderma. Geoderma 2013, 209, 188–197. [Google Scholar] [CrossRef]
- Kammann, C.I.; Linsel, S.; Go ̈ßling, J.W.; Koyro, H.W. Influence of biochar on drought tolerance of Chenopodium quinoa Willd and on soil-plant relations. Plant Soil 2011, 345, 195–210. [Google Scholar] [CrossRef]
- Liu, J.; Schulz, H.; Brandl, S.; Miehtke, H.; Huwe, B.; Glaser, B. Short-term effect of biochar and compost on soil fertility and water status of a Dystric Cambisol in NE Germany under field conditions. J. Plant Nutr. Soil Sci. 2012, 175, 698–707. [Google Scholar] [CrossRef]
- Major, J.; Rondon, M.; Molina, D.; Riha, S.J.; Lehmann, J. Maize yield and nutrition during 4 years after biochar application to a Colombian savanna oxisol. Plant Soil 2010, 333, 117–128. [Google Scholar] [CrossRef]
- Nehls, T. Fertility Improvement of a Terra Firme Oxisol in Central Amazonia by Charcoal Applica-Tions. Master’s Thesis, University of Bayreuth, Bayreuth, Germany, 2002. [Google Scholar]
- Petter, F.A.; Madari, B.E.; Silva, M.A.S.D.; Carneiro, M.A.C.; Carvalho, M.T.D.M.; Ju ́nior, M.; Pacheco, L.P. Soil fertility and upland rice yield after biochar application in the Cerrado. Pesqui. Agropecu. Bras. 2012, 47, 699–706. [Google Scholar] [CrossRef]
- Schmidt, H.P.; Pandit, B.H.; Martinsen, V.; Cornelissen, G.; Conte, P.; Kammann, C.I. Fourfold increase in pumpkin yield in response to low-dosage root zone application of urine-enhanced biochar to a fertile tropical soil. Agriculture 2015, 5, 723–741. [Google Scholar] [CrossRef] [Green Version]
- Schulz, H.; Dunst, G.; Glaser, B. Positive effects of composted biochar on plant growth and soil fertility. Agron. Sustain. Dev. 2013, 33, 817–827. [Google Scholar] [CrossRef]
- SUSANA (n.d.) Sanitation Case Studies, an Online Collection of Fact Sheets on 95 Case Studies of EcoSan. Sustainable Sanitation Alliance (SuSanA). Available online: http://www.susana.org/en/resources/case-studies (accessed on 22 May 2017).
- Komakech, A.J.; Zurbrügg, C.; Semakula, D.; Kiggundu, N.; Vinnerås, B. Evaluation of the Performance of Different Organic Fertilisers on Maize Yield: A Case Study of Kampala, Uganda. J. Agric. Sci. 2015, 7, 28. [Google Scholar] [CrossRef]
- Kimetu, J.M.; Lehmann, J.; Ngoze, S.O.; Mugendi, D.N.; Kinyangi, J.M.; Riha, S.; Pell, A.N. Reversibility of soil productivity decline with organic matter of differing quality along a degradation gradient. Ecosystems 2008, 11, 726–739. [Google Scholar] [CrossRef]
- Andersson, E. Turning waste into value: Using human urine to enrich soils for sustainable food production in Uganda. J. Clean. Prod. 2015, 96, 290–298. [Google Scholar] [CrossRef]
- Ogwang, F.; Tenywa, J.S.; Otabbong, E.; Tumuhairwe, J.B.; Amoding-Katusabe, A. Faecal Blending for Nutrient Enrichment and Speedy Sanitisation for Soil Fertility Improvement. ISRN Soil Sci. 2012, 2012, 424171. [Google Scholar] [CrossRef]
- Krause, A.; Nehls, T.; George, E.; Kaupenjohann, M. Organic wastes from bioenergy and ecological sanitation as a soil fertility improver: A field experiment in a tropical Andosol. SOIL 2016, 2, 147–162. [Google Scholar] [CrossRef]
- Tanzania. National Sample Census of Agriculture 2007/2008, Regional Report—Kagera Region; United Republic of Tanzania, Ministry of Agriculture, Food Security and Cooperatives, The National Bureau of Statistics and the Office of the Chief Government Statistician: Zanzibar, Tanzania, 2012; Volume Vh.
- Batjes, N.H. Global Distribution of Soil Phosphorus Retention Potential; ISRIC Report; Wageningen University and Research Centre: Wageningen, The Netherlands, 2011; p. 41. [Google Scholar]
- Baijukya, F.P.; De Ridder, N.; Giller, K.E. Nitrogen release from decomposing residues of leguminous cover crops and their effect on maize yield on depleted soils of Bukoba District, Tanzania. Plant Soil 2006, 279, 77–93. [Google Scholar] [CrossRef]
- UNEP. Reactive Nitrogen in the Environment: Too Much or Too Little of a Good Thing; United Nations Environment Programme (UNEP): Paris, France, 2007; 56p. [Google Scholar]
- Baccini, P.; Brunner, P.H. Metabolism of the Anthroposphere: Analysis, Evaluation, Design; MIT Press: Cambridge, MA, USA, 2012; 408p. [Google Scholar]
- Brunner, P.H.; Rechberger, H. Practical handbook of material flow analysis; CRC Press: Boca Raton, FL, USA, 2004; 336p. [Google Scholar]
- Lesschen, J.P.; Stoorvogel, J.J.; Smaling, E.M.; Heuvelink, G.B.; Veldkamp, A. A spatially explicit methodology to quantify soil nutrient balances and their uncertainties at the national level. Nutr. Cycl. Agroecosys. 2007, 78, 111–131. [Google Scholar] [CrossRef]
- Van den Bosch, H.; Gitari, J.N.; Ogaro, V.N.; Maobe, S.; Vlaming, J. Monitoring nutrient flows and economic performance in African farming systems (NUTMON): III. Monitoring nutrient flows and balances in three districts in Kenya. Agric. Ecosyst. Environ. 1998, 71, 63–80. [Google Scholar] [CrossRef]
- Rugalema, G.H.; Okting’Ati, A.; Johnsen, F.H. The homegarden agroforestry system of Bukoba district, North-Western Tanzania. 1. Farming system analysis. Agrofor. Syst. 1994, 26, 53–64. [Google Scholar] [CrossRef]
- Smaling, E.M.; Fresco, L.O.; Jager, A.D. Classifying, monitoring and improving soil nutrient stocks and flows in African agriculture. Ambio 1996, 25, 492–496. [Google Scholar]
- Eghball, B.; Power, J.F. Phosphorus-and nitrogen-based manure and compost applications corn production and soil phosphorus. Soil Sci. Soc. Am. J. 1999, 63, 895–901. [Google Scholar] [CrossRef]
- Myhre, G.; Shindell, D.; Bréon, F.-M.; Collins, W.; Fuglestvedt, J.; Zhang, H. Anthropogenic and Natural Radiative Forcing—Climate Change 2013: The Physical Science Basis; Contribution of Working Group I to the Fifth Assessment Report of the IPCC; Stocker, T.F., Qin, D., Plattner, G-K., Tignor, M., Midgley, P.M., Eds.; Cambridge University Press: Cambridge, UK; New York, NY, USA, 2013. [Google Scholar]
- Heijungs, R.; Guinée, J.B.; Huppes, G.; Lankreijer, R.M.; Udo de Haes, H.A.; De Goede, H.P. Environmental Life Cycle Assessment of Products: Guide and Backgrounds (Part 1). Available online: https://openaccess:.leidenuniv.nl/handle/1887/8061 (accessed on 3 September 2016).
- Guinée, J.B. Handbook on life cycle assessment: Operational guide to the ISO standards. Int. J. Life Cycle Assess. 2002, 7, 311–313. [Google Scholar] [CrossRef]
- Laner, D.; Rechberger, H.; Astrup, T. Systematic evaluation of uncertainty in material flow analysis. J. Ind. Eng. 2014, 18, 859–870. [Google Scholar] [CrossRef]
- FAU Physics (n.d.) Anleitung zur Fehlerrechnung. Friedrich Alexander Universität (FAU) Erlangen-Nuremberg, Department of Physics. Available online: http://www.physik.uni-erlangen.de/lehre/daten/NebenfachPraktikum/Anleitung%20zur%20Fehlerrechnung.pdf (accessed on 15 June 2016).
- Cumming, G.; Fidler, F.; Vaux, D.L. Error bars in experimental biology. J. Cell Biol. 2007, 177, 7–11. [Google Scholar] [CrossRef] [PubMed]
- Nkonya, E.; Kaizzi, C.; Pender, J. Determinants of nutrient balances in a maize farming system in eastern Uganda. Agric. Syst. 2005, 85, 155–182. [Google Scholar] [CrossRef]
- Wortmann, C.S.; Kaizzi, C.K. Nutrient balances and expected effects of alternative practices in farming systems of Uganda. Agric. Ecosyst. Environ. 1998, 71, 115–129. [Google Scholar] [CrossRef]
- Sanchez, P.A.; Shepherd, K.D.; Soule, M.J.; Place, F.M.; Buresh, R.J.; Woomer, P.L. Soil fertility replenishment in Africa: An investment in natural resource capital. In Replenishing Soil Fertility in Africa; Buresh, R.J., Sanchez, P.A., Calhoun, F., Eds.; Soil Science Society of America and American Society of Agronomy: Madison, WI, USA, 1997; pp. 1–46. [Google Scholar]
- Finck, A. Pflanzenernährung und Düngung in Stichworten (Plant Nutrition and Fertilization in Keywords), 6th ed.; Borntraeger: Stuttgart, Germany, 2007. [Google Scholar]
- Mafongoya, P.L.; Bationo, A.; Kihara, J.; Waswa, B.S. Appropriate technologies to replenish soil fertility in southern Africa. In Advances in Integrated Soil Fertility Management in Sub-Saharan Africa: Challenges and Opportunities; Springer: Dordrecht, The Netherlands, 2007; Volume 1, pp. 29–44. [Google Scholar]
- Möller, K.; Stinner, W. Effects of different manuring systems with and without biogas digestion on soil mineral nitrogen content and on gaseous nitrogen losses (ammonia, nitrous oxides). Eur. J. Agron. 2009, 30, 1–16. [Google Scholar] [CrossRef]
- Amon, B.; Kryvoruchko, V.; Amon, T.; Zechmeister-Boltenstern, S. Methane, nitrous oxide and ammonia emissions during storage and after application of dairy cattle slurry and influence of slurry treatment. Agric. Ecosyst. Environ. 2006, 112, 153–162. [Google Scholar] [CrossRef]
- Agyarko-Mintah, E.; Cowie, A.; Singh, B.P.; Joseph, S.; Van Zwieten, L.; Cowie, A.; Harden, S.; Smillie, R. Biochar increases nitrogen retention and lowers greenhouse gas emissions when added to composting poultry litter. Waste Manag. 2016, 61, 138–143. [Google Scholar] [CrossRef] [PubMed]
- Larsen, O.; Horneber, D. Einfluss von Biokohle auf Treibhausgasemissionen während der Kompostierung. In Book of Abstracts of the scientific Workshop Biokohle im Gartenbau–Verwertung von Organischen Reststoffen zur Schließung von Energie—und Stoffkreisläufen; Terytze, K., Ed.; Freie Universität Berlin: Berlin, Germany, 2015; pp. 33–34. [Google Scholar]
- Sonoki, T.; Furukawa, T.; Jindo, K.; Suto, K.; Aoyama, M.; Sánchez-Monedero, M.Á. Influence of biochar addition on methane metabolism during thermophilic phase of composting. J. Basic Microb. 2013, 53, 617–621. [Google Scholar] [CrossRef] [PubMed]
- Vandecasteele, B.; Mondini, C.; D’Hose, T.; Russo, S.; Sinicco, T.; Quero, A.A. Effect of biochar amendment during composting and compost storage on greenhouse gas emissions, N losses and P availability. In Proceedings of the 15th RAMIRAN International Conference, Recycling of Organic Residues in Agriculture, Versailles, France, 3–5 June 2013; Institut National de la Recherche Agronomique (INRA): Thiverval-Grignon, France, 2013. [Google Scholar]
- Gronwald, M.; Don, A.; Tiemeyer, B.; Helfrich, M. Effects of fresh and aged biochars from pyrolysis and hydrothermal carbonization on nutrient sorption in agricultural soils. SOILD 2015, 2, 29–65. [Google Scholar] [CrossRef]
- Laner, D.; Cencic, O.; Lederer, J. Quantification and Handling of Uncertainties in MFA; Class Notes, Course‚ Material Flow Analysis of Resource and Recycling Systems’; Vienna University of Technology: Vienna, Austria, 2013. [Google Scholar]
- Batjes, N.H.; Sombroek, W.G. Possibilities for carbon sequestration in tropical and subtropical soils. Glob. Chang. Biol. 1997, 3, 161–173. [Google Scholar] [CrossRef]
- Nziguheba, G. Improving Phosphorus Availability and Maize Production through Organic and Inorganic Amendments in Phosphorus Deficient Soils in Western Kenya. Ph.D. Thesis, Katholieke Universiteit Leuven, Leuven, Belgium, 2011. [Google Scholar]
- Van der Eijk, D.; Janssen, B.H.; Oenema, O. Initial and residual effects of fertilizer phosphorus on soil phosphorus and maize yields on phosphorus fixing soils: A case study in south-west Kenya. Agric. Ecosyst. Environ. 2006, 116, 104–120. [Google Scholar] [CrossRef]
- Sattari, S.Z.; Bouwman, A.F.; Giller, K.E.; van Ittersum, M.K. Residual soil phosphorus as the missing piece in the global phosphorus crisis puzzle. Proc. Natl. Acad. Sci. USA 2012, 109, 6348–6353. [Google Scholar] [CrossRef] [PubMed]
- Horn, R.; Brümmer, G.W.; Kandeler, E.; Kögel-Knabner, I.; Kretzschmar, R.; Stahr, K.; Wilke, B.M. Scheffer/Schachtschabel—Lehrbuch der Bodenkunde (Textbook of Soil Science), 16th ed.; Springer: Heidelberg, Germany, 2010; 570p. [Google Scholar]
- Van Breemen, N.; Mulder, J.; Driscoll, C.T. Acidification and alkalinization of soils. Plant Soil 1983, 75, 283–308. [Google Scholar] [CrossRef]
- Wong, M.T.F.; Nortcliff, S.; Swift, R.S. Method for determining the acid ameliorating capacity of plant residue compost, urban waste compost, farmyard manure, and peat applied to tropical soils. Commun. Soil Sci. Plant Anal. 1998, 29, 2927–2937. [Google Scholar] [CrossRef]
- KTBL. Faustzahlen für die Landwirtschaft (Rule-of-Thumb Figures for Agriculture), 14th ed.; Kuratorium für Technik und Bauwesen in der Landwirtschaft (KTBL): Darmstadt, Germany, 2009. [Google Scholar]
- Zakharova, A.; Beare, M.H.; Cieraad, E.; Curtin, D.; Turnbull, M.H.; Millard, P. Factors controlling labile soil organic matter vulnerability to loss following disturbance as assessed by measurement of soil-respired δ13CO2. Eur. J. Soil Sci. 2015, 66, 135–144. [Google Scholar] [CrossRef]
- Chesworth, W. (Ed.) Encyclopedia of Soil Science; Springer: Dordrecht, The Netherlands, 2008; p. 902. [Google Scholar]
- Christensen, T.H.; Gentil, E.; Boldrin, A.; Larsen, A.; Weidema, B.; Hauschild, M. C balance, carbon dioxide emissions and global warming potentials. Waste Manag. Res. 2009, 27, 707–715. [Google Scholar] [CrossRef] [PubMed]
- Lehmann, J.; Kleber, M. The contentious nature of soil organic matter. Nature 2015, 528, 60–68. [Google Scholar] [CrossRef] [PubMed]
- Michel, J.; Weiske, A.; Möller, K. The effect of biogas digestion on the environmental impact and energy balances in organic cropping systems using the life-cycle assessment methodology. Renew. Agric. Food Syst. 2010, 25, 204–218. [Google Scholar] [CrossRef]
- Mukherjee, A.; Lal, R. The biochar dilemma. Soil Res. 2014, 52, 217–230. [Google Scholar] [CrossRef]
- Van Zwieten, L.; Kammann, C.; Cayuela, M.; Singh, B.P.; Joseph, S.; Kimber, S.; Donne, S.; Clough, T.; Spokas, K.A. Biochar effects on nitrous oxide and methane emissions from soil. In Biochar for Environmental Management; Lehmann, J., Joseph, S., Eds.; Routledge: London, UK, 2015; pp. 489–520. [Google Scholar]
Figure 1.
The integrated farming system analyzed comprises the farming household (white) and the agro-ecosystem (AES; green). Processes are indicated with boxes, material flows with arrows; the dotted line represents the system boundaries. Material flows in green were part of the present work; red and blue flows/arrows were part of [41]; grey flows/arrows were not considered in the system analysis. AM: Abbreviation part of the scenarios indicating the agroecosystem of a msiri.

Figure 2.
Flow charts showing in- and output flows of materials considered in modelling Karagwe standard composting (a) and CaSa-composting (b). Processes are indicated with boxes, material flows with arrows. A: ash; AC: ash and char; CaSaC: CaSa-compost; EmVC: emissions of carbon through volatilization; EmVN: emissions of nitrogen through volatilization; EmLP: emissions of phosphorus through leaching; F: faeces; HR: harvest residues; KSC: Karagwe standard compost; KW: kitchen waste; S: soil; SD: sawdust; U: urine.
Figure 3.
The estimated SNB II for N (a); left) and P (b); right) comprises natural input (IN3a, 4a, 4b) and natural output (OUT3, 4a) flows; organic (IN2a-2e) and mineral (IN1c) input flows; and output flows (Out1a, 1b, 2) with agricultural products. Mean values for the estimated SNB II are indicated with black dashes; standard errors of the means with grey error bars. Scenarios are defined in Table 1; the IN and OUT flows are in Table 3. Plot data is provided in Supplementary Table S12.
Figure 4.
Relative contribution of the different resources used for standard composting ((a); left) and for CaSa-composting ((b); right) to the total input flow in terms of volume (Vol.) and content of carbon (C), nitrogen (N), and phosphorus (P) prior to the composting process (values represent the mean percentage calculated for all scenarios). Scenarios are defined in Table 1. Plot data provided in Supplementary Table S18 (for Figure 4a) and Table S19 (for Figure 4b).
Figure 5.
Estimated environmental impacts of the analyzed IPNM strategies: the global warming potential ((a); left) and the eutrophication potential ((b); right). Scenarios are defined in Table 1. Plot data provided in Supplementary Table S13 (Figure 5a) and Table S14 (Figure 5b). comp.: composting; EP: eutrophication potential; GWP: gobal warming potential; hh: household; leach.: leaching; min. fert.: mineral fertilization.


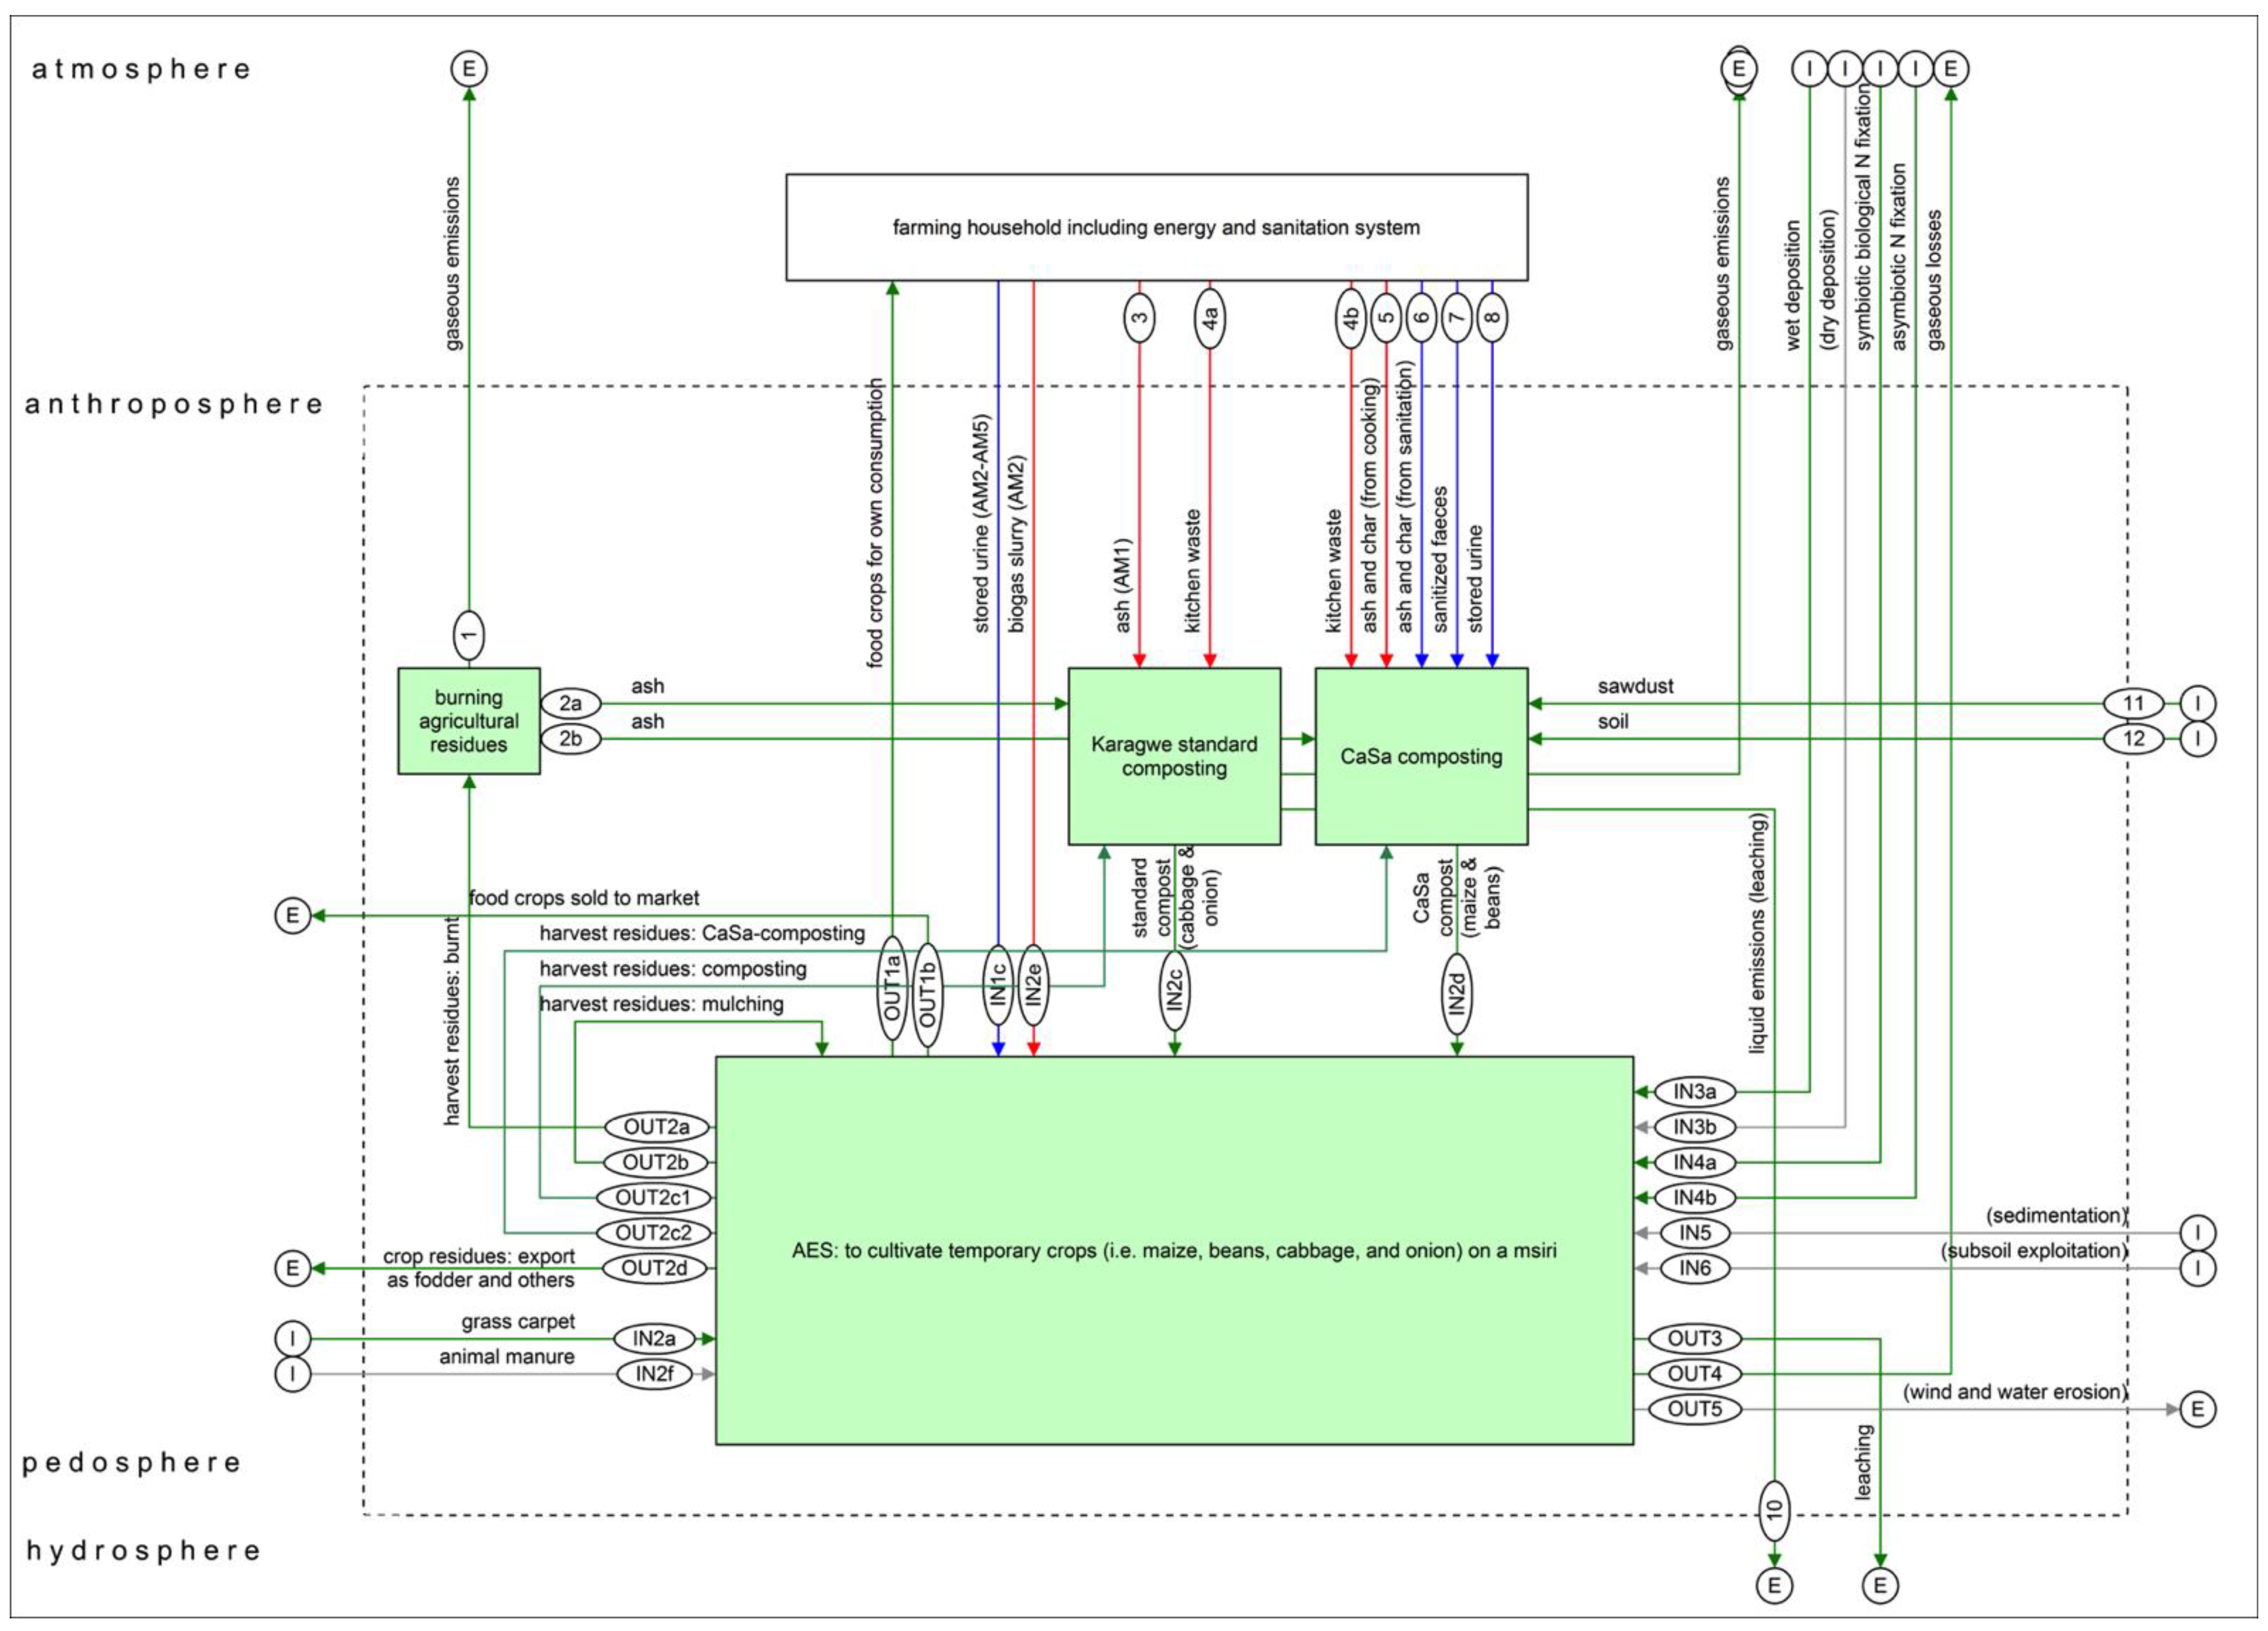
Table 1.
Alternatives defined to compare different integrated plant nutrient management (IPNM) strategies (AM2–5) to the current practice (AM1) in an intercropping system in Karagwe, TZ.
Table 1.
Alternatives defined to compare different integrated plant nutrient management (IPNM) strategies (AM2–5) to the current practice (AM1) in an intercropping system in Karagwe, TZ.
| No. | Organic Input to Maize & Beans | Organic Input to Onion & Cabbage | Mineral Input to all Crops | Cooking Alternative | Sanitation Alternative | Comment |
|---|---|---|---|---|---|---|
| AM1 | None | Standard compost (cabbage only) | None | Three-stone fire | Pit latrine | |
| AM2 | Biogas slurry | Standard compost | Urine | Biogas digester & burner | UDDT | |
| AM3 | CaSa-compost | Standard compost | Urine | Microgasifier | UDDT & thermal sanitation | |
| AM4 | CaSa-compost | Standard compost | Urine | Microgasifier | UDDT & thermal sanitation | like AM3, but with lower yield prognosis |
| AM5 | CaSa-compost | Standard compost | Urine | Microgasifier | UDDT & thermal sanitation | like AM3, but with larger application of composts every 3 years |
AM: agroecosystem msiri (abbreviation used to name the alternatives studied); CaSa-compost: compost prepared according to practices of the project “Carbonization and Sanitation” (CaSa); EcoSan: ecological sanitation; IPNM: integrated plant nutrient management; TZ: Tanzania.
Table 2.
Quantities and qualities of the organic, organo-mineral, and mineral inputs used in the IPNM strategies analyzed.
Table 2.
Quantities and qualities of the organic, organo-mineral, and mineral inputs used in the IPNM strategies analyzed.
| Substrates | Recovery Potential | Subsistence Production | Total C | Total N | Total P |
|---|---|---|---|---|---|
| kg∙year−1 | kg∙year−1 | g∙kg−1 (in FM) | g∙kg−1 (in FM) | g∙kg−1 (in FM) | |
| Biogas slurry | 14955 ± 4409 | 15.3 ± 0.3 | 0.9 ± 0.0 | 0.3 ± 0.0 | |
| Biochar & ash (from cooking) | 301 ± 29 | 751 ± 296 | 2.9 ± 2.2 | 1.9 ± 0.8 | |
| Biochar & ash (from sanitation) | 15 ± 6 | 694 ± 461 | 3.1 ± 1.2 | 5.2 ± 2.7 | |
| Stored urine | 780 ± 80 | 7.9 ± 3.2 | 5.0 ± 1.2 | 0.5 ± 0.2 | |
| Sanitized solids | 506 ± 186 | 106 ± 51 | 7.5 ± 3.5 | 2.1 ± 1.0 | |
| Standard compost | 292 ± 20 | 60 ± 11 | 3.5 ± 0.6 | 0.8 ± 0.1 | |
| CaSa-compost | 2350 ± 132 | 78 ± 9 | 4.0 ± 0.4 | 2.1 ± 0.2 |
Note: Data for the recovery potentials of biogas slurry, biochar, stored urine, and sanitized faeces stem from [41]. The potential for subsistence production of Karagwe standard compost and CaSa-compost are estimated in the present study. Values represent the mean percentage calculated for all scenarios. Water contents are 95.6 ± 0.5, 33.6 ± 5.3, and 32.5 ± 1.9 g∙kg−1 in FM (Fresh matter) of biogas slurry, standard compost, and CaSa-compost, respectively.
Table 3.
Selected flows considered in soil nutrient balance.
| Input flows of partial balance | |
| IN1c | Urine |
| IN2a | Grass carpet |
| IN2b | Mulching with crop residues |
| IN2c | Standard compost |
| IN2d | CaSa-compost |
| IN2e | Biogas slurry |
| Input flows of natural balance | |
| IN3a | Atmospheric deposition |
| IN4a | Symbiotic BNF |
| IN4b | Non-symbiotic BNF |
| Output flows of partial balance | |
| OUT1a | Food products for self-consumption |
| OUT1b | Food products sold to market |
| OUT2 | Crop residues |
| Output flows of natural balance | |
| OUT3 | Leaching |
| OUT4a | Gaseous losses (from denitrification) |
Abbreviations: BNF: biological nitrogen fixation.
Table 4.
Results of the SNB for intercropping of annual crops (maize, beans, cabbage and onion), on msiri land sized 0.125 ha located in Karagwe, TZ.
Table 4.
Results of the SNB for intercropping of annual crops (maize, beans, cabbage and onion), on msiri land sized 0.125 ha located in Karagwe, TZ.
| Nutrient Requirement of Crops | Nutrient Supply with Organic Fertilization | Nutrient Supply with Organic and Mineral Fertilization | Natural Balance | Full SNB with Organic Fertilization | Full SNB with Organic and Mineral Fertilization | |||||||
|---|---|---|---|---|---|---|---|---|---|---|---|---|
| PB I | PB II–PB I | PB III–PB I | NB | SNB I | SNB II | |||||||
| Kg∙ha−1 year−1 | ||||||||||||
| Alternatives | N | P | N | P | N | P | N | P | N | P | N | P |
| AM1 | −46 ± 2 | −11 ± 1 | 4.1 ± 0.1 | 1.5 ± 0.0 | 4.1 ± 0.1 | 1.5 ± 0.0 | −13 ± 2 | 0.9 ± 0.3 | −54 ± 3 | −8 ± 1 | −54 ± 3 | −8 ± 1 |
| AM2 | −87 ± 3 | −20 ± 2 | 57 ± 7 | 22 ± 2 | 88 ± 14 | 25 ± 4 | −11 ± 2 | 0.9 ± 0.3 | −41 ± 10 | 2 ± 3 | −11 ± 14 | 6 ± 3 |
| AM3 | −139 ± 5 | −38 ± 3 | 87 ± 5 | 38 ± 2 | 105 ± 9 | 39 ± 5 | 9 ± 2 | 0.9 ± 0.3 | −43 ± 10 | 1 ± 5 | −25 ± 10 | 2 ± 4 |
| AM4 | −104 ± 8 | −25 ± 4 | 58 ± 4 | 25 ± 2 | 97 ± 18 | 37 ± 7 | −8 ± 5 | 0.9 ± 0.3 | −54 ± 13 | 1 ± 6 | −15 ± 17 | 12 ± 5 |
| AM5 | −139 ± 5 | −38 ± 3 | 88 ± 9 | 38 ± 5 | 108 ± 12 | 41 ± 6 | 9 ± 2 | 0.9 ± 0.3 | −41 ± 7 | 1 ± 4 | −22 ± 11 | 3 ± 6 |
PB: partial balance; NB: natural balance; SNB: soil nutrient balance; TZ: Tanzania. Alternatives AM1–AM5 are defined in Table 1.
Table 5.
Summarized effects estimated for the IPNM strategies analyzed with regard to selected sustainability aspects.
Table 5.
Summarized effects estimated for the IPNM strategies analyzed with regard to selected sustainability aspects.
| IPNM Based on the Use of | Replenishing Soil P | Liming Potential | SOM Reproduction Potential | C-Sequestration Potential | Integrated Emissions |
|---|---|---|---|---|---|
| Standard compost * | ++/++ | =/+ | =/+ | ?/? | na |
| Biogas slurry and urine | + | = | − | − | GWP: −, EP: = |
| CaSa-compost and urine | ++/++ | ++/++ | +/+ | ?/? | GWP & EP: = |
++: Strong improvement; +: improvement; =: constant; −: decline; − −: strong decline; ?: not clear; na: not analyzed. * Note that results refer only to a small share of the land, whilst the larger part of the farmland remains unamended. When two results are indicated, for example =/+, the first result refers to the regular annual amendments analyzed in AM1 and AM3–4, whilst the second result refers to the one-off large amendments analyzed in AM5. (Scenarios are defined in Table 1.)
© 2018 by the authors. Licensee MDPI, Basel, Switzerland. This article is an open access article distributed under the terms and conditions of the Creative Commons Attribution (CC BY) license (http://creativecommons.org/licenses/by/4.0/).
Share and Cite
MDPI and ACS Style
Krause, A.; Rotter, V.S. Recycling Improves Soil Fertility Management in Smallholdings in Tanzania. Agriculture 2018, 8, 31. https://doi.org/10.3390/agriculture8030031
AMA Style
Krause A, Rotter VS. Recycling Improves Soil Fertility Management in Smallholdings in Tanzania. Agriculture. 2018; 8(3):31. https://doi.org/10.3390/agriculture8030031
Chicago/Turabian StyleKrause, Ariane, and Vera Susanne Rotter. 2018. "Recycling Improves Soil Fertility Management in Smallholdings in Tanzania" Agriculture 8, no. 3: 31. https://doi.org/10.3390/agriculture8030031
Note that from the first issue of 2016, this journal uses article numbers instead of page numbers. See further details here.