
Tsunami Hazard Assessment at Oeiras Municipality, Portugal


1
Centre for Geographical Studies and Associated Laboratory TERRA, Institute of Geography and Spatial Planning, Universidade de Lisboa, Rua Branca Edmée Marques, 1600-276 Lisboa, Portugal
2
Centre for Geographical Studies, Institute of Geography and Spatial Planning, Universidade de Lisboa, Rua Branca Edmée Marques, 1600-276 Lisboa, Portugal
*
Author to whom correspondence should be addressed.
J. Mar. Sci. Eng. 2022, 10(8), 1120; https://doi.org/10.3390/jmse10081120
Submission received: 30 June 2022
/
Revised: 5 August 2022
/
Accepted: 8 August 2022
/
Published: 14 August 2022
(This article belongs to the Special Issue Coastal Risk Assessment and Management)
Abstract
:Portugal has had several large tsunamis in the past, yet Oeiras municipality has not implemented mitigation strategies and awareness to the general public, to the authors’ knowledge. In addition, Oeiras has 10 beaches that are very popular among residents and tourists, who can become at high risk of a potential tsunami if they do not evacuate from the low ground areas on time. Thus, the tsunami numerical model of the 1755 event was carried out to calculate the inundation, complemented with a field survey, in order to assess the tsunami evacuation conditions of the beaches. The results show the tsunami hits Oeiras municipality 26 to 36 min after the earthquake, inundating all the beaches. The local tsunami hazard classification is Low on 3 beaches, Moderate on 1 beach, High on 5 beaches, and Critical on 1 beach. In addition, there are no tsunami evacuation signs to guide the people to move to higher ground. Therefore, it is important to conduct mitigation strategies to avoid and reduce fatalities in a future tsunami.
1. Introduction
The seismic activity in Portugal (mainland area and offshore) is considered moderate, generating few daily earthquakes, with a magnitude less than 6.5 [1,2]. Still, the area has generated large earthquakes, with magnitudes higher than 6.5 that occurred in 1531, 1722, 1755, 1858, 1909, and 1969 [3]. Among these events, 1755 was the worst disaster, causing more than 12,000 fatalities due to the earthquake, fire (in Lisbon and Setubal), and tsunami [4]. In fact, the 1755 event has been the worst disaster that occurred in Portugal till now, which as of 10 March 2022, caused 21,285 dead in the country [5].
The location of the tsunami source area of the 1755 earthquake and tsunami has been the focus of many publications. Different authors using several methodologies, over different periods of time, carried out the identification of sediment records and turbidites [6,7,8,9,10,11], seismo-tectonics [12,13,14,15,16,17,18,19,20,21,22,23], seismic moment assessment [24], seismic intensity analysis and modeling [25,26,27], tsunami wave ray analysis and tsunami numerical model applied at the regional scale (propagation) [28], and tsunami numerical model applied at the local scale (inundation) combined with field survey [3,29]. All these publications indicate the earthquake’s magnitude would be Mw = 8.7, with the earthquake and tsunami source area located on the Gorringe Bank (Figure 1a). This is the largest bathymetry structure in the area, being about 200 km long by 80 km wide, with the shallowest point of this bank reaching almost the surface of the ocean, at about 25 m deep.
The Oeiras municipality (Figure 1a) has approximately 46 km2, and it belongs to Lisbon Metropolitan Area. The Land Use map [30] shows the 10 local beaches (Figure 1b). Those beaches occupy less than 0.3% of the territory, which is quite artificial (about 65.3%), with some land for agriculture and pasture (about 15%), bush and forests (about 19%), and water (0.24%). The residents and visitors are attracted to the coastline, especially to the beaches that are very popular all year, but mostly during summer. In addition, the existence of a large and continuous sidewalk on the beaches, and many restaurants, and bars make the beaches popular during day-time and night-time periods. Moreover, there are several marinas that are provided with nautical centers allowing fishing and other maritime activities. It is rather the high level of tourism and coastal activities that make the coastal community of Oeiras at high risk if exposed to a tsunami. On the other hand, to the authors’ knowledge, Oeiras stakeholders have not implemented educational activities regarding evacuation procedures, mitigation strategies, and risk awareness to the general public. For these reasons, it is fundamental to analyze whether or not the beach users have safe conditions to evacuate in an emergency, particularly in the occurrence of an earthquake with large a magnitude (higher than 7.5) followed by a tsunami. Nevertheless, a basic tsunami scenario is already contemplated in the Municipal Emergency Plan [31] that needs to be reviewed and updated.
Therefore, the objective of this study is to carry out the tsunami numerical model at the local scale (inundation) at the Oeiras municipality, by considering the 1755 tsunami. The goal is to then apply a criterion for tsunami hazard classification in order to assess the evacuation conditions of the beaches, combined with a field survey. With this research, the authors hope to contribute to tsunami preparedness in Oeiras and the construction and implementation of tsunami hazard maps. Moreover, the information will be disseminated to the civil protection and spatial planning agents in order to improve the safety of the coastal communities in a future tsunami, by updating the municipal emergency plans.
2. Materials and Methods
The tsunami modeling was carried out by using the TUNAMI-N2 code of Tohoku University which considers the non-linear shallow water equations, discretized with a staggered leap-frog finite difference scheme [32]. The governing equations, written in Cartesian coordinates, are:
where,
M and N are the discharge fluxes, and u and v are the velocities, in the x and y directions, respectively. D is the total water depth, η is the sea surface elevation, h is the still water depth, and g is the acceleration due to gravity. The bottom friction was considered with Manning’s roughness coefficient of n = 0.025.
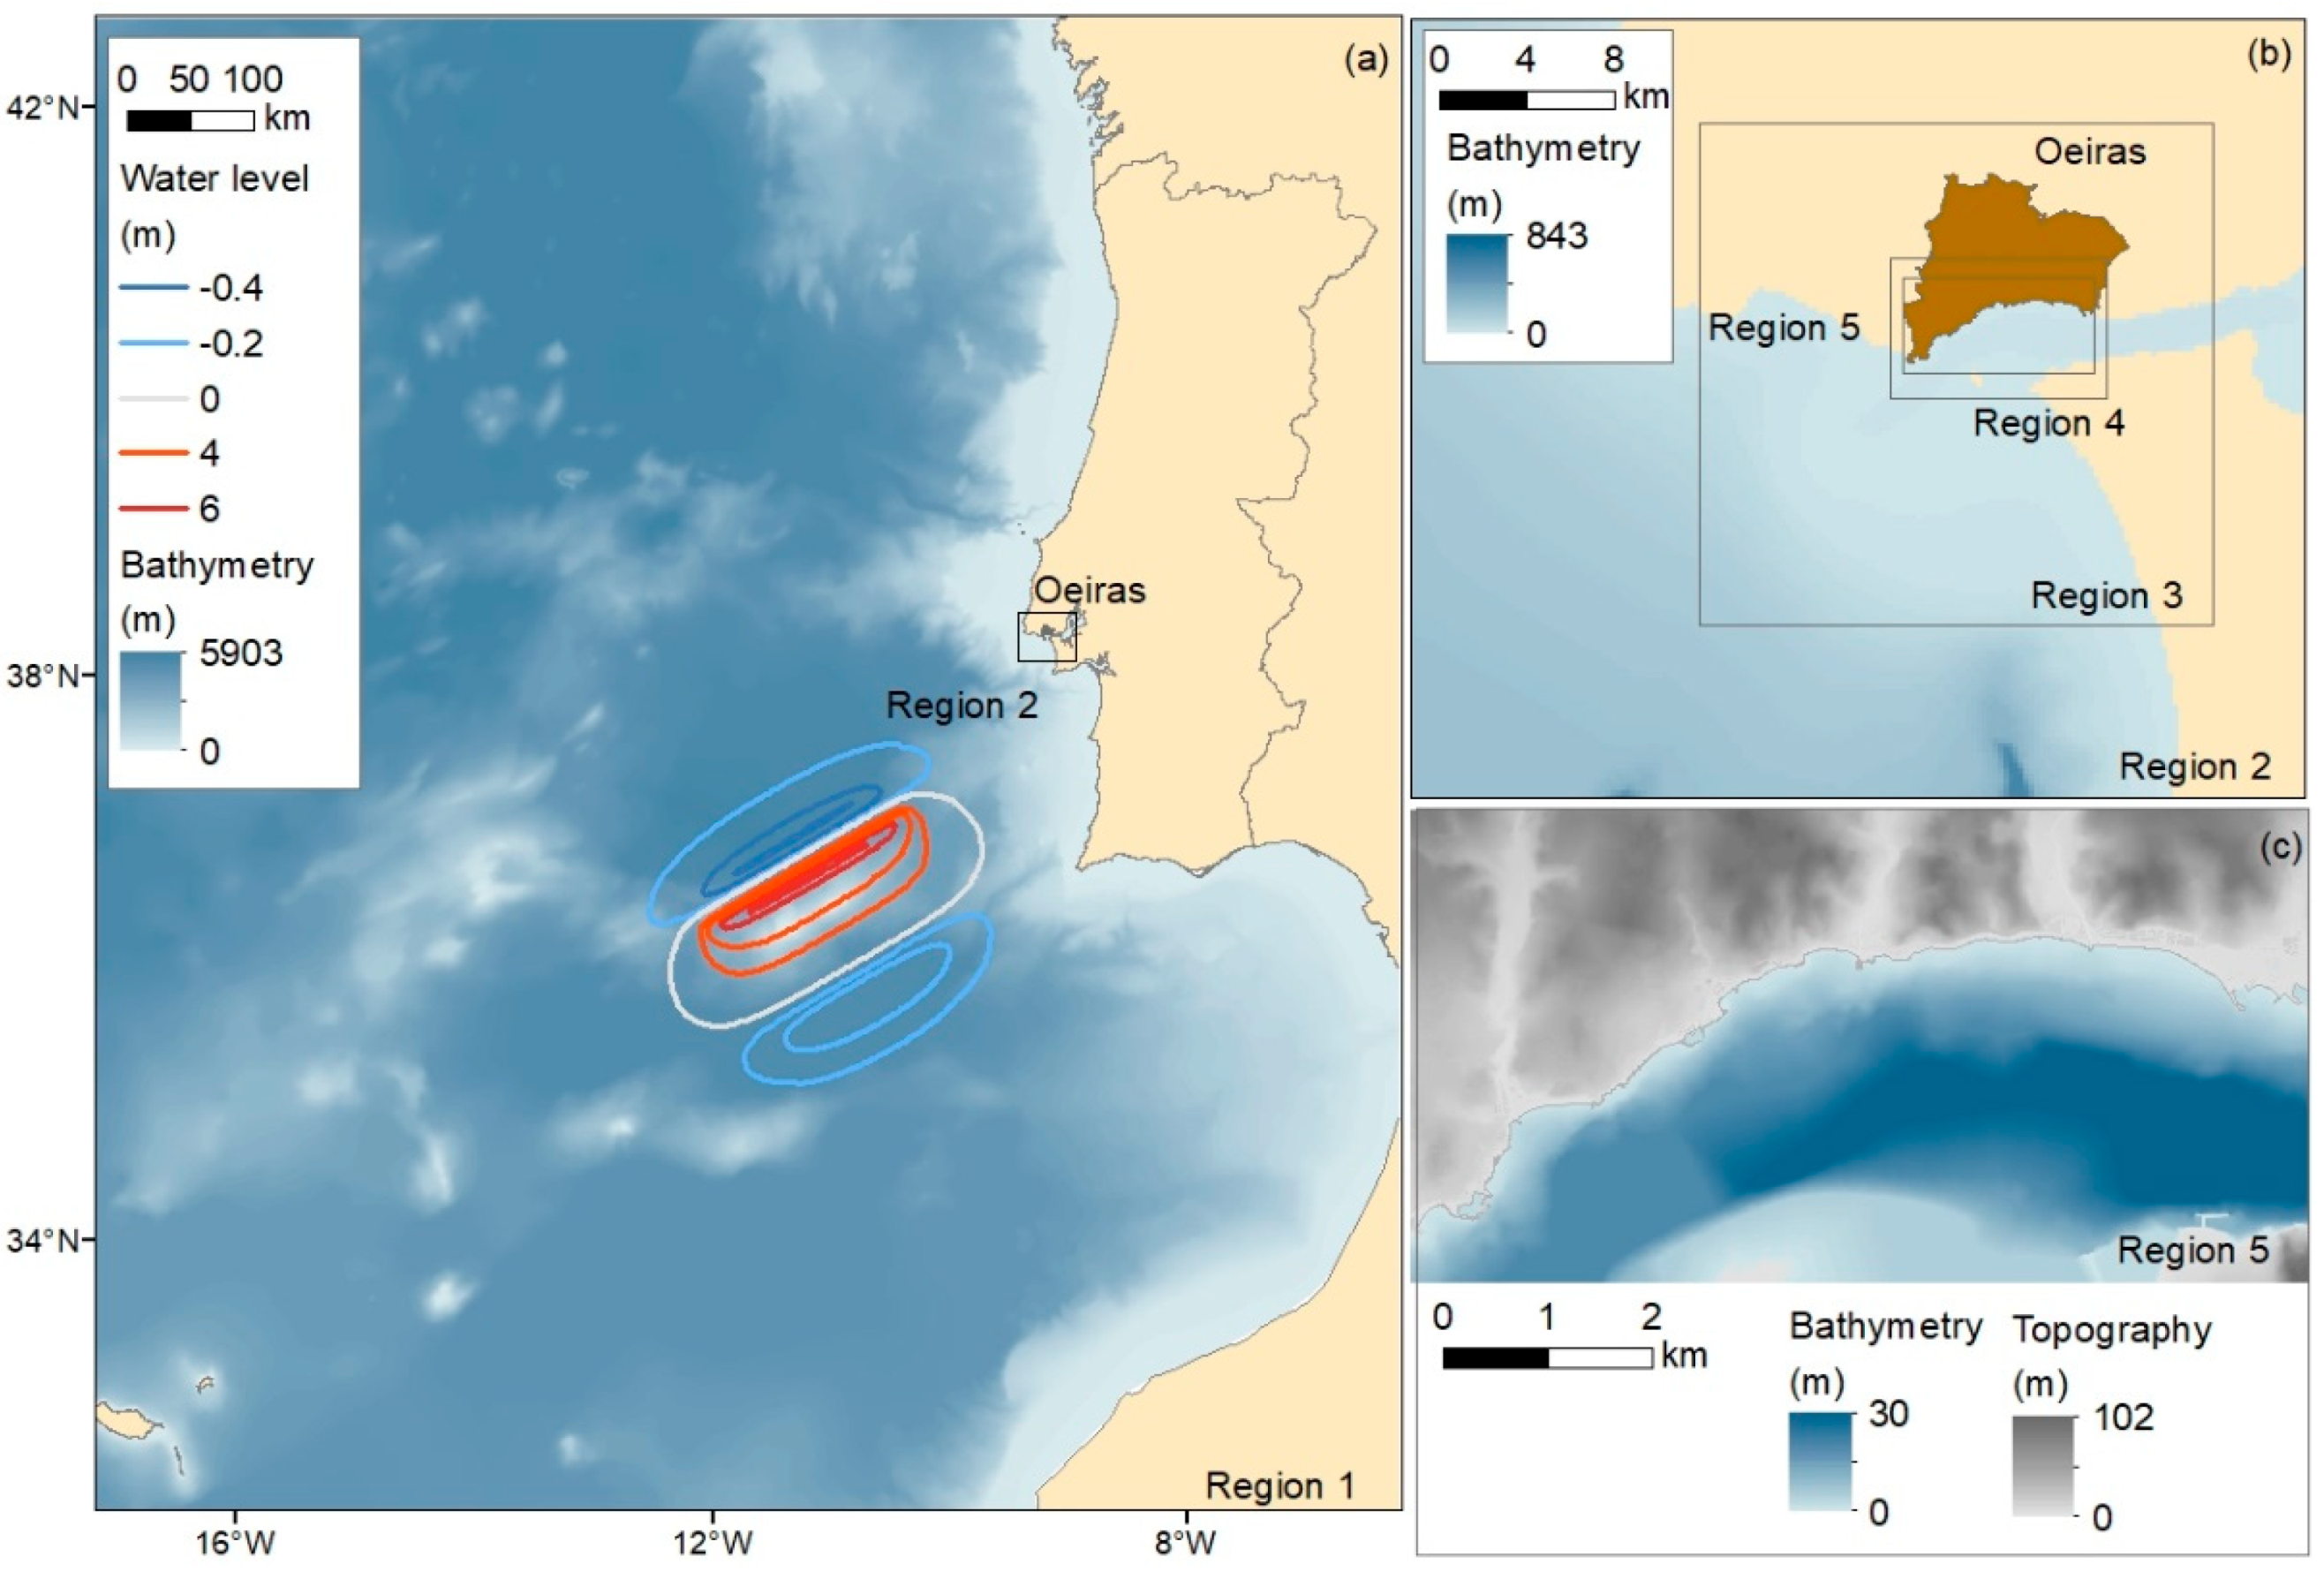
The equations were applied to a nesting of five computational regions, where each region has a progressively smaller area and finer grid cell size, being included in the previous computational region, as shown in Figure 2. The first region is the largest and has a cell size of 729 m (Figure 2a). Then, regions two, three, and four have cell sizes of 243, 81, and 27 m, respectively (Figure 2b). Region five has a cell size of 9 m and includes detailed bathymetry and topography (Figure 2c). The computational region 5 reproduces the local coastal features of Oeiras municipality, including narrow streams and marinas. During the construction of each region, several bathymetry charts [33,34,35] and topographic maps were used [36]. In addition, on computational region five, tsunami inundation will be calculated, on which the local bathymetry and topography are read, in comparison to the height of the wave, at each computational grid point. This method has been used to study many tsunamis over the past 25 years. As examples of recent research, the code was applied to the 2004 Indian Ocean Tsunami [37] as well as the 2011 Tohoku Tsunami [38].
The co-seismic displacement of the seafloor is transferred to the sea surface displacement because the rupture process of an earthquake is usually much shorter than the tsunami wave period. The source model of the 1755 tsunami considered in this study follows the earthquake fault parameters proposed by several authors [3,24,27,28,29], located on the Gorringe Bank, with origin at 12.3° W, 36.5° N, a length of 200 km, width of 80 km, strike of 60°, dip of 40°, slip of 12.1 m, and focal depth of 8 km. These parameters are in agreement with the seismo-tectonics of the area [12,13,14,15,16,17,18,19,20,21,22,23] and consistent with the seismic intensity analysis [25,26]. Then, the initial sea surface displacement of the tsunami was calculated by using the Okada formulas [39], on region 1, which conducted to a maximum uplift of about +6.0 m and a subsidence of—0.4 m (Figure 2a).
After the numerical model results are obtained on computational region 5, a hazard matrix is used (Figure 3) where a criterion is applied to classify the maximum water level height into the susceptibility of water level, and the travel times into the susceptibility of travel time. These are combined in order to obtain a tsunami hazard classification [29]. In addition, a field survey was carried out in May and June 2022 in order to assess the local tsunami hazard, which evaluated the evacuation conditions at the local scale. The authors visited the beaches and identified the location of their exits and the overall safety conditions, such as the existence of an open area located on high ground and outside the inundation zone.
3. Results and Discussion
The tsunami numerical model results calculated in region 1, showing the tsunami propagation, are presented in Figure 4. The water level snapshots show how the tsunami waves spread out from the tsunami source area over the selected computational region 1. The first tsunami wave reached the Portuguese coastline within about 15–20 min after the earthquake, and at about 60 min the tsunami hit the entire Portuguese coastline, which is consistent with previous tsunami numerical modeling results at the regional scale [28] and local scale [3,29]. Moreover, the tsunami propagation behaves in the same way as in [28], with an animation of the numerical model [40].
The tsunami numerical model carried out on computational region 5 includes the tsunami inundation at Oeiras. The water level snapshots (Figure 5) show that 30 min after the earthquake (Figure 5a) the beaches of Torre (1) and Santo Amaro de Oeiras (2) are already completely inundated. At 35 min after the earthquake (Figure 4b) the first tsunami wave hit the entire coastline of Oeiras. Then, from 40 min all the low ground areas (at about 3 m above mean sea level) are completely inundated, including some stretches of Marginal Avenue and the railway.
These results show the Oeiras beaches are inundated within 35 min after the earthquake, therefore people must evacuate the beaches immediately after the earthquake to higher ground. However, this problem has been addressed by several authors [41] who have shown there are delays in the evacuation: (i) time to detect an event and assess the threat may vary between 5 min [42], 7 min [38] and 15 min [43]; (ii) time of each individual to make a decision is estimated as 13 min [44]. Therefore, it is fundamental that evacuation exercises are conducted on a regular basis in order to train muscle memory [45] so that the number of fatalities may be reduced if a tsunami occurs.
The water level time series are presented in Figure 6. As a complement to the water level snapshots, these plots show the tsunami water level variation over a computational time of 90 min, on six virtual tide gauges. The results show there was one major wave hitting the Oeiras municipality, except at Santo Amaro de Oeiras beach (2) where two waves were obtained. The results show the first wave arrives within 26 to 36 min after the earthquake, with about 4 m height on all the stations. In addition, these results show there is a water level elevation of about 2 m height till the 90 min, showing that beach users should remain on higher ground and not return to the beach for at least 2 h after the earthquake.
The maximum water level height calculated in region 5 is presented in Figure 7a, with a mean of 3.2 m and a standard deviation of 0.8 m, showing that a tsunami similar to the 1755 event would have a significant impact on the coastline. The results also show the absolute maximum water level is located at Torre Beach (1), with values ranging from 7.7 m to 9.3 m, and local maximum water levels are obtained at the beaches of Santo Amaro de Oeiras (2), with values ranging from 6.0 to 6.6 m, Caxias (6) with 6.0 to 6.9m, and São Bruno (7) with 6.0 to 6.2 m, showing there are local amplifications on these areas. These amplifications are mainly due to the impact of the first wave combined with the local configuration of the marina at Torre beach (1), and the coastline of the beaches of Santo Amaro de Oeiras (2), and Caxias (6) and São Bruno (7). As a complement, the graphs of the water level time series presented in Figure 6 show that the first wave is about 4 m.
The inundation depth (Figure 7b) at Torre beach (1) ranges from 0.1 to 7.6 m (maximum value). At Santo Amaro de Oeiras beach (2), the inundation depth ranges from 0.72 to 5.6 m, overtopping Marginal Avenue, inundating the low ground area and the Lage Stream up to 4.5 km inland. A stretch of about 445 m of this road is completely inundated, and for this reason, the road should not be used for evacuation purposes. The railway passes the area over a bridge located more than 10 m above the local ground and therefore does not represent a risk to the tsunami.
The highest inundation depth values calculated at the beaches of Fontainhas (3), Paço de Arcos Beach (4), and Old Paço de Arcos Beach (5) are 3.3 m, 4.4 m, and 3.9m, respectively. The inundation depth at Caxias beach (6) reaches 6.5m, and at São Bruno beach (8) 5.4 m, inundating the beaches, overtopping the Marginal Avenue and the railway, the Barcarena Stream and the low ground areas 870 m inland.
In the vicinity of the Paço de Arcos beach (5), the Marginal Avenue is inundated till the São Bruno beach (7), with a total of 2.2 km. In addition, the railway at São Bruno beach (7) is inundated for about 340 m. These results show these infrastructures could not be operational, making the possible rescue of survivors more difficult.
The inundation depth at Cruz Quebrada beach (8) reaches up to 4.3m, and the tsunami travels about 980 m upstream of the Jamor River. From this beach to Algés (10) the Marginal Avenue and the railway are inundated for about 2.2 km. Thus, the Marginal Avenue is inundated for a total stretch of about 4.5 km, and the railway for about 2.5 km. Finally, the inundation depth at the beaches of Dafundo (9) and Algés (10) are 4.3 m and 4.1 m, respectively. Near these beaches the inundation depth is quite low, less than 0.3 m, still people should evacuate the area before the arrival of the first wave.
These results show that people must evacuate the beaches, since research from the 2004 Indian Ocean Tsunami demonstrated that when the inundation depth is higher than 2 m the casualties will increase [37].
Following the tsunami hazard matrix (Figure 3), the susceptibility of travel time is classified as High (Figure 8a) on beaches of Torre (1), Santo Amaro de Oeiras (2), and Fontainhas (3), and as Moderate on the remaining coastline. Thus, as mentioned above, beach users, particularly on these 2 beaches, should start evacuating immediately after the earthquake. In addition, the susceptibility of maximum water level (Figure 8b) is Moderate nearby the beaches of Torre (1), Santo Amaro de Oeiras (2), Caxias (6), and São Bruno (7). On the other hand, vessels that are not anchored in the marinas should evacuate to deeper waters.
This result shows the exposure to a tsunami increases due to local amplifications on these areas. The combination of both susceptibilities lead to the tsunami hazard classification (Figure 8c) of High at the beaches of Torre (1) and Santo Amaro de Oeiras (2); Moderate in the beaches of Old Paço de Arcos (5), Caxias (6), São Bruno (7), Dafundo (9) and Algés (10); and Low in the beaches of Fontainhas (3), Paço de Arcos (4), and Cruz Quebrada (8).
The field survey results show the coastal area of Oeiras does not have any tsunami evacuation signs indicating the Meeting Point and evacuation routes. The survey also showed that the Torre beach (1) has 3 exits with large ramps (Figure 9a) and stairs that allow a quick and safe evacuation. The beach also has several parking lots nearby, providing enough area for beach users to evacuate before the arrival of the first tsunami wave. Thus, the local tsunami hazard is classified as High (Figure 10a).
The Santo Amaro de Oeiras beach (2) is the largest beach in Oeiras having the capacity to accommodate about 4500 people. It has at least five exits, most of which are under passages to cross the Marginal Avenue (Figure 9b). However, the tsunami inundates the beach, overpasses the Marginal Avenue, and inundates the low ground area up to 4.5 km inland. In addition to the lack of open areas nearby the beach, the sidewalks are too narrow for a quick evacuation in an emergency. Therefore, the local tsunami hazard is Critical (Figure 10a) since it is unlikely that all beach users could evacuate safely, before the arrival of the first wave. The authors already contacted the civil protection of Oeiras who are willing to collaborate with the authors to discuss mitigation strategies to implement in the area, which includes the production of educational materials and organization of information sessions and workshops for the general public.
The Fontainhas beach (3) is a small beach with a large open area nearby located on high ground, outside the inundation area. The Paço de Arços beach (4) has five exits and also has a large open area nearby located on high ground, outside the inundation area. Both beaches have large ramps (Figure 9c) as exits allowing a quick evacuation. The Cruz Quebrada beach (8) is also a small beach with one exit, and it has high ground nearby. Still, people should evacuate these three beaches immediately after the earthquake, and the tsunami hazard classification is Low.
The Old Paço de Arcos beach (5) is a small beach with only one underpass to cross Marginal Avenue and the high ground nearby. Nevertheless, beach users must evacuate immediately and orderly after the earthquake to leave the inundation zone within 30 min after the earthquake. The local tsunami hazard is moderate.
The beaches of Caxias (6) and São Bruno (7) are very close to each other, and for that reason, they share the same exits: there are two exits to cross Marginal Avenue and the railway: an underpass (Figure 9d) and pedestrian crossing the Marginal Avenue when the traffic light is red, then passing over the railway (Figure 9e). Although there is high ground nearby, the configuration of these exits may cause some confusion to beach users, and for that reason, the local tsunami hazard on each beach is High (Figure 10b). The authors already contacted the civil protection of Oeiras to inform them about these results, and an evacuation exercise is planned in order to test the emergency plan [31].
The Dafundo (9) and Algés (10) beaches are quite large, located on the low ground area (about 4 m above mean sea level). In addition, the only exit nearby (Figure 9f) is located more than 600 m, which is an underpass to Marginal Avenue and the railway. Although there are several buildings in the area, they are not prepared to be used as a vertical evacuation. In addition, this area is used for music concerts, especially during the summer, with several thousands of participants. Given the present day conditions, if a tsunami occurs, most people will be trapped and caught by the tsunami. Due to these limitations, the local tsunami hazard is classified as High (Figure 10c) on both beaches.
The Oeiras stakeholders are aware of these situations, and for that reason, have created a project to construct a large pedestrian overpass. However, due to the restrictions of the COVID-19 Pandemic [46,47,48], it has been postponed for almost two years. On the other hand, the overpasses and underpasses may be destroyed during an earthquake. This situation may cause chaos during the evacuation. In fact, in some cases, people may be trapped, without any escape. This situation has also been reported to stakeholders. These authorities are willing to collaborate with the authors to discuss and implement other social disaster mitigation strategies on these beaches. These may include the production of educational materials, the organization of information sessions, and workshops for the general public. Furthermore, the installation of tsunami evacuation signs and other early warning devices were also discussed, since they are very important to hazards mitigation [49,50].
4. Conclusions
The tsunami numerical model of the 1755 event was carried out as the worst case scenario, with the tsunami source area located at the Gorrige Bank. The results show the tsunami hits Oeiras municipality 26 to 36 min after the earthquake, inundating all the beaches. Most of the beaches have higher ground nearby, located outside the tsunami inundation zone. Still, people have to start evacuating immediately after the earthquake. In addition, the field survey showed the crossing of Marginal Avenue and railway by under or an overpass may cause some delay in the evacuation since in some cases the passages areas are narrow. The Marginal Avenue and the railway are inundated on several stretches with a total affected length of about 4.5 km and 2.5 km, respectively. The results also show the coastal area of Oeiras does not have any tsunami evacuation signs indicating the Meeting Point and evacuation routes to higher ground, which may cause confusion and chaos during an evacuation. In addition, the results show the local tsunami hazard classification is Low on the beaches of Fontainhas (3), Paço de Arcos (4), and Cruz Quebrada (8), Moderate on Old Paço de Arcos beach (5), High on the beaches of Torre (1), Caxias (6) São Bruno (7), Dafundo (9), and Algés (10), and Critical on Santo Amaro de Oeiras beach (2), which show it is important to conduct mitigation strategies in order to avoid and reduce fatalities in a future tsunami.
The Oeiras stakeholders are aware of these situations and therefore the construction of a large overpass has been planned. In addition, these authorities are willing to collaborate with the authors to discuss social mitigation strategies to implement in the area as well as the installation of early warning devices.
Author Contributions
Conceptualization, A.S. and N.M.; methodology, A.S., J.F. and N.M.; investigation, A.S., J.F. and N.M.; writing—original draft preparation, J.F.; writing—review and editing, A.S.; visualization, A.S.; funding acquisition, N.M. All authors have read and agreed to the published version of the manuscript.
Funding
This research was supported by Portuguese national funds through the Fundação para a Ciência e a Tecnologia (FCT, I.P.), under the funding “UIDB/GEO/00295/2020” and “UIDP/GEO/00295/2020”.
Institutional Review Board Statement
Not applicable.
Informed Consent Statement
Not applicable.
Data Availability Statement
Not applicable.
Conflicts of Interest
The authors declare no conflict of interest.
References
- IPMA—Portuguese Institute of the Ocean and Atmosphere. Available online: https://www.ipma.pt/pt/geofisica/sismicidade/ (accessed on 29 June 2022). (In Portuguese).
- USGS—United States Geological Survey. Available online: https://www.usgs.gov/ (accessed on 29 June 2022).
- Santos, A.; Correia, M.; Loureiro, C.; Fernandes, P.; Marques da Costa, N. The historical reconstruction of the 1755 earthquake and tsunami in downtown Lisbon, Portugal. J. Mar. Sci. Eng. 2019, 7, 208. [Google Scholar] [CrossRef]
- Santos, A.; Koshimura, S. The historical review of the 1755 Lisbon Tsunami. J. Geod. Geomat. Eng. 2015, 1, 38–52. [Google Scholar] [CrossRef]
- Health General Direction—Direção Geral de Saúde, Situation Report. Available online: https://covid19.min-saude.pt/relatorio-de-situacao/ (accessed on 29 June 2022).
- Foster, I.D.L.; Albon, A.J.; Barbell, K.M.; Fletcher, J.L.; Jardine, T.C.; Mothers, R.J.; Pritchard, M.A.; Turner, S.E. High energy coastal sedimentary deposits; an evaluation of depositional processes in Southwest England. Earth Surface Processes Landforms 1991, 16, 341–356. [Google Scholar] [CrossRef]
- Dawson, A.; Foster, I.D.L.; Shi, S.; Smith, D.E.; Long, D. The identification of tsunami deposits in coastal sediment sequences. Sci. Tsunami Hazards 1991, 9, 73–82. [Google Scholar]
- Thomson, J.; Weaver, P.P.E. An AMS radiocarbon method to determine the emplacement time of recent deep-sea turbidites. Sediment. Geol. 1994, 89, 1–7. [Google Scholar] [CrossRef]
- Lebreiro, S.M.; McCave, I.N.; Weaver, P.P.E. Late Quaternary Turbidite Emplacement on the Horseshoe Abyssal Plain (Iberian Margin). J. Sediment. Res. 1997, 67, 856–870. [Google Scholar]
- Banerjee, D.; Murray, A.S.; Foster, I.D.L. Scilly Isles, UK: Optical dating of a possible tsunami deposit from the 1755 Lisbon earthquake. Quat. Sci. Rev. 2001, 20, 715–718. [Google Scholar] [CrossRef]
- Costa, P.J.M.; Lario, J.; Reicherter, K. Tsunami Deposits in Atlantic Iberia: A Succinct Review. In Historical Earthquakes, Tsunamis and Archaeology in the Iberian Peninsula; Álvarez-Martí-Aguilar, M., Prieto, F.M., Eds.; Springer: Singapore, 2022; pp. 105–126. [Google Scholar] [CrossRef]
- Moreira, V.S. Seismotectonics of Portugal and its adjacent area in the Atlantic. Tectonophysics 1985, 11, 85–96. [Google Scholar] [CrossRef]
- Grimison, N.L.; Chen, W.-P. The Azores-Gibraltar plate boundary: Focal mechanisms, depths of earthquakes, and their tectonic implications. J. Geophys. Res. 1986, 91, 2029–2047. [Google Scholar] [CrossRef]
- Buforn, E.; Udias, A.; Colombas, M.A. Seismicity, source mechanisms and tectonics of the Azores-Gibraltar plate boundary. Tectonophysics 1988, 152, 89–118. [Google Scholar] [CrossRef]
- DeMets, C.; Gordon, R.G.; Argus, D.F.; Stein, S. Current plate motions. Geophys. J. Int. 1990, 101, 425–478. [Google Scholar] [CrossRef]
- Pinheiro, L.M.; Wilson, R.C.L.; Pena dos Reis, R.; Whitmarsh, R.B.; Ribeiro, A. The Western Iberia Margin: A Geophysical and Geological overview. Proc. Ocean. Drill. Program Sci. Results 1996, 149, 1–23. [Google Scholar]
- Hayward, N.; Watts, A.B.; Westbrook, G.K.; Collier, J.S. A seismic reflection and GLORIA study of compressional deformation in the Gorringe Bank region, eastern North Atlantic. Geophys. J. Int. 1999, 138, 831–850. [Google Scholar] [CrossRef]
- Borges, J.F.; Fitas, A.J.S.; Bezzeghoud, M.; Teves-Costa, P. Seismotectonics of Portugal and its adjacent Atlantic area. Tectonophysics 2001, 337, 373–387. [Google Scholar] [CrossRef]
- Jimenez-Munt, I.; Fernandez, M.; Torne, M.; Bird, P. The transition from linear to diffuse plate boundary in the Azores-Gibraltar region: Results from a thin-sheet model. Earth. Planet. Sci. Lett. 2001, 192, 175–189. [Google Scholar] [CrossRef]
- McClusky, S.; Reilinger, R.; Mahmoud, S.; Ben Sari, D.; Tealeb, A. GPS constraints on Africa (Nubia) and Arabia plate motions. Geophys. J. Int. 2003, 155, 126–138. [Google Scholar] [CrossRef]
- Carrilho, F.; Teves-Costa, P.; Morais, I.; Pagarete, J.; Dias, R. GEOALGAR Project: First results on seismicity and fault-plane solutions. Pure Appl. Geophys. 2004, 161, 589–606. [Google Scholar] [CrossRef]
- Zitellini, N.; Rovere, M.; Terrinha, P.; Chierici, F.; Matias, L.; Bigsets Team. Neogene Through Quaternary Tectonic Reactivation of SW Iberian Passive Margin. Pure Appl. Geophys. 2004, 161, 565–587. [Google Scholar] [CrossRef]
- Jiménez-Romero, R.; Fernández-Salas, L.M.; Palomino, D.; Sánchez-Leal, R.F.; Vila, Y. Discovering the Fine-Scale Morphology of the Gulf of Cádiz: An Underwater Imaging Analysis. J. Mar. Sci. Eng. 2022, 10, 651. [Google Scholar] [CrossRef]
- Johnston, A. Seismic moment assessment of earthquakes in stable continental regions—III. New Madrid 1811–1812, Charleston 1886 and Lisbon 1755. Geophys. J. Int. 1996, 126, 314–344. [Google Scholar] [CrossRef]
- Machado, F. Contribution to the study of the November 1, 1755. Rev. Fac. Cienc. Univ. Lisb. 1966, XIV, 19–31. (In Portuguese) [Google Scholar]
- Vilanova, S.; Nunes, C.; Fonseca, J. Lisbon 1755: A case of triggered onshore rupture? Bull. Seismol. Soc. Am. 2003, 93, 2056–2068. [Google Scholar] [CrossRef]
- Grandin, R.; Borges, J.F.; Bezzeghoud, M.; Caldeira, B.; Carrilho, F. Simulations of strong ground motion in SW Iberia for the 1969 February 28 (Ms = 8.0) and the 1755 November 1 (M ~ 8.5) earthquakes—II. Strong ground motion simulations. Geophys. J. Int. 2007, 171, 807–822. [Google Scholar] [CrossRef]
- Santos, A.; Koshimura, S.; Imamura, F. The 1755 Lisbon Tsunami: Tsunami source determination and its validation. J. Disaster Res. 2009, 4, 41–52. [Google Scholar] [CrossRef]
- Santos, A.; Koshimura, S. The 1755 Lisbon Tsunami at Vila do Bispo Municipality, Portugal. J. Disaster Res. 2015, 10, 1067–1080. [Google Scholar] [CrossRef]
- COS—Chart of the Land Use. 2018. Available online: https://www.dgterritorio.gov.pt/Carta-de-Uso-e-Ocupacao-do-Solo-para-2018/ (accessed on 29 June 2022). (In Portuguese)
- Municipality of Oeiras, Emergency Municipal Plan of Civil Protection, 2018; 1–59. Available online: http://planos.prociv.pt/Documents/132131286457737300.pdf (accessed on 10 June 2022). (In Portuguese).
- Imamura, F. Review of tsunami simulation with a finite difference method. In Long-Wave Runup Models; World Scientific: Singapore, 1995; pp. 25–42. [Google Scholar]
- GEBCO Digital Atlas, General Bathymetric Chart of the Oceans, BODC. 2003. Available online: https://www.gebco.net (accessed on 10 June 2022).
- Hydrographic Institute. International Bathymetric Chart of the Central and Eastern Atlantic, Sheet 1.01.2001. Available online: https://www.ngdc.noaa.gov/mgg/ibcea/ (accessed on 29 June 2022).
- Hydrographic Institute. Bathymetry Charts No. 24204, No. 26308, No. 26309; Hydrographic Institute: Lisbon, Portugal, 2011; Available online: http://eurogoos.eu/locations/hydrographic-institute-of-portugal/ (accessed on 29 June 2022).
- IGeoE—Geographic Institute of the Army. Charts No. 430, No. 431, No. 432, No. 441, No. 442, No. 443; Geographic Institute of the Army: Lisbon, Portugal, 2001; Available online: https://www.igeoe.pt/index.php?id=1 (accessed on 29 June 2022).
- Koshimura, S.; Oie, T.; Yanagisawa, H.; Imamura, F. Developing fragility functions for tsunami damage estimation using numerical model and post-tsunami data from Banda Aceh, Indonesia. Coast. Eng. J. 2009, 51, 243–273. [Google Scholar] [CrossRef]
- Mas, E.; Suppasri, A.; Imamura, F.; Koshimura, S. Agent-based simulation of the 2011 great east Japan earthquake/tsunami evacuation: An integrated model of tsunami inundation and evacuation. J. Nat. Disaster Sci. 2012, 34, 41–57. [Google Scholar] [CrossRef]
- Okada, Y. Surface deformation due to shear and tensile faults in a half space. Bull. Seismol. Soc. Am. 1985, 75, 1135–1154. [Google Scholar] [CrossRef]
- Tsurima Project. Available online: https://sites.google.com/a/campus.ul.pt/tsurima/publications (accessed on 29 June 2022).
- Trindade, A.; Teves-Costa, P.; Catita, C. A GIS-based analysis of constraints on pedestrian tsunami evacuation routes: Cascais case study (Portugal). Nat. Hazards 2018, 93, 169–185. [Google Scholar] [CrossRef]
- Charnkol, T.; Tanaboriboon, Y. Evacuee behaviors and factors affecting the tsunami trip generation model: A case study in Phang-nga, Thailand. J. Adv. Transp. 2006, 40, 313–330. [Google Scholar] [CrossRef]
- González-Riancho, P.; Aguirre-Ayerbe, I.; Aniel-Quiroga, I.; Abad, M.; González, S.; Larreynaga, J.; Gavidia, F.; Gutiérrez, O.Q.; Alvarez-Gómez, J.A.; Medina, R. Tsunami evacuation modelling as a tool for risk management: Application to the coastal area of El Salvador. Nat. Hazards Earth Syst. Sci. 2013, 13, 3249–3270. [Google Scholar] [CrossRef]
- Omira, R.; Baptista, M.A.; Mellas, S.; Leone, F.; Richemond, N.M.; Zourarah, B.; Cherel, J.P. The November, 1st, 1755 Tsunami in Morocco: Can Numerical Modeling Clarify the Uncertainties of Historical Reports? In Tsunami—Analysis of a Hazard; Lopez, G., Ed.; IntechOpen: London, UK, 2012; pp. 61–76. [Google Scholar]
- Dengler, L.; Goltz, J.; Fenton, J.; Miller, K.; Wilson, R. Building tsunami-resilient communities in the United States: An example from California. TsuInfo Alert 2011, 13, 1Ā14. [Google Scholar]
- Health General Direction (Direção Geral de Saúde), Recommendations and Norms. Available online: https://covid19.min-saude.pt/normas-e-orientacoes/ (accessed on 29 June 2022). (In Portuguese).
- XXII Portuguese Government. Government Decree-Laws and Communications, COVID-19 and Vaccination. Available online: https://www.portugal.gov.pt/pt/gc22/comunicacao/tema?i=128 (accessed on 10 June 2022). (In Portuguese)
- XXII Portuguese Government. The Response of Portugal to COVID-19. Available online: https://covid19estamoson.gov.pt/ (accessed on 10 June 2022). (In Portuguese)
- Wang, Y.; Tshushima, H.; SAtake, K.; Navarrete, P. Review on recent progress in near-field tsunami forecasting using offshore tsunami measurements: Source inversion and data assimilation. Pure Appl. Geophys. 2021, 178, 5109–5128. [Google Scholar] [CrossRef]
- Wang, Y.; Imai, K.; Kusumoto, S.; Takahasgi, N. Tsunami early warning of the Hunga Volcanic Eruption using an ocean floor observation network off the Japanese Islands. Seismol. Res. Lett. 2022. [Google Scholar] [CrossRef]
Figure 1.
Geographical Framework of the study area: (a) location of Oeiras municipality; (b) details of the Land use [30] and the location of the beaches.
Figure 1.
Geographical Framework of the study area: (a) location of Oeiras municipality; (b) details of the Land use [30] and the location of the beaches.

Figure 2.
Conditions of the numerical model setting in Oeiras municipality: (a) Computational region 1 and initial sea surface displacement of the 1755 tsunami; (b) Computational region 2 and the placement of regions 3 and 4; (c) details of computational region 5.
Figure 2.
Conditions of the numerical model setting in Oeiras municipality: (a) Computational region 1 and initial sea surface displacement of the 1755 tsunami; (b) Computational region 2 and the placement of regions 3 and 4; (c) details of computational region 5.

Figure 3.
Criterion for tsunami hazard (Adapted from [29]).
Figure 3.
Criterion for tsunami hazard (Adapted from [29]).

Figure 4.
Water level snapshots on computational region 1: (a) 20 min; (b) 40 min; (c) 60 min.

Figure 5.
Water level snapshots of the 1755 Tsunami on computational region 5: (a) 30 min; (b) 35 min; (c) 40 min; (d) 45 min.
Figure 5.
Water level snapshots of the 1755 Tsunami on computational region 5: (a) 30 min; (b) 35 min; (c) 40 min; (d) 45 min.

Figure 6.
Water level time series at Oeiras coastline.

Figure 7.
Tsunami numerical model results of the 1755 Tsunami on computation region 5: (a) maximum water level; (b) inundation depth.
Figure 7.
Tsunami numerical model results of the 1755 Tsunami on computation region 5: (a) maximum water level; (b) inundation depth.

Figure 8.
Tsunami hazard classification at Oeiras from the 1755 tsunami: (a) susceptibility of travel times; (b) susceptibility of water level; (c) tsunami hazard.
Figure 8.
Tsunami hazard classification at Oeiras from the 1755 tsunami: (a) susceptibility of travel times; (b) susceptibility of water level; (c) tsunami hazard.

Figure 9.
Field survey results: (a) 1-Torre beach; (b) 2-Santo Amaro de Oeiras beach; (c) 3-Fontainhas beach; (d) 6-Caxias beach; (e) 7- São Bruno beach; (f) underpass of 9-Dafundo beach and 10-Algés beach.
Figure 9.
Field survey results: (a) 1-Torre beach; (b) 2-Santo Amaro de Oeiras beach; (c) 3-Fontainhas beach; (d) 6-Caxias beach; (e) 7- São Bruno beach; (f) underpass of 9-Dafundo beach and 10-Algés beach.

Figure 10.
Local tsunami hazard classification at Oeiras beaches: (a) details of the beaches of Torre (1), Santo Amaro de Oeiras (2); Fontainhas (3), Paço de Arcos (4), and Old Paço de Arcos (5); (b) details of the beaches of Caxias (6), and São Bruno (7); (c) details of the beaches of Cruz Quebrada (8), Dafundo (9), and Algés (10).

Publisher’s Note: MDPI stays neutral with regard to jurisdictional claims in published maps and institutional affiliations. |
© 2022 by the authors. Licensee MDPI, Basel, Switzerland. This article is an open access article distributed under the terms and conditions of the Creative Commons Attribution (CC BY) license (https://creativecommons.org/licenses/by/4.0/).
Share and Cite
MDPI and ACS Style
Santos, A.; Fernandes, J.; Mileu, N. Tsunami Hazard Assessment at Oeiras Municipality, Portugal. J. Mar. Sci. Eng. 2022, 10, 1120. https://doi.org/10.3390/jmse10081120
AMA Style
Santos A, Fernandes J, Mileu N. Tsunami Hazard Assessment at Oeiras Municipality, Portugal. Journal of Marine Science and Engineering. 2022; 10(8):1120. https://doi.org/10.3390/jmse10081120
Chicago/Turabian StyleSantos, Angela, Juan Fernandes, and Nelson Mileu. 2022. "Tsunami Hazard Assessment at Oeiras Municipality, Portugal" Journal of Marine Science and Engineering 10, no. 8: 1120. https://doi.org/10.3390/jmse10081120
Note that from the first issue of 2016, this journal uses article numbers instead of page numbers. See further details here.