Article

Prediction of Overpressure Zones in Marine Sediments Using Rock-Physics and Other Approaches

1
Laboratory of Fundamental Problems of Petroleum Geophysics and Geophysical Monitoring, Schmidt Institute of Physics of the Earth of the Russian Academy of Sciences, 123242 Moscow, Russia
2
Science and Technology Center of Geophysics and Mineral Resources, Moscow Institute of Physics and Technology (National Research University), 141701 Dolgoprudny, Russia
3
NOVYE PROEKTY Limited Liability Company (NOVYE PROEKTY LLC)., 119034 Moscow, Russia
4
Laboratory of Seismoacoustic Exploration Methods, Faculty of Geology, Lomonosov Moscow State University, 119234 Moscow, Russia
5
Seismic Data Analysis Center Limited Liability Company, Lomonosov Moscow State University, 119992 Moscow, Russia
*
Authors to whom correspondence should be addressed.
J. Mar. Sci. Eng. 2022, 10(8), 1127; https://doi.org/10.3390/jmse10081127
Submission received: 15 July 2022 / Revised: 5 August 2022 / Accepted: 14 August 2022 / Published: 17 August 2022
(This article belongs to the Special Issue Recent Advances in Geological Oceanography)

Abstract

:
The paper discusses the problem of localizing zones of high pore pressure in sub-bottom sediments (first tens of meters under the seafloor). Prediction of the overpressure zones in the near-surface is required for the mitigation of risks at the early stages of the offshore hydrocarbon field exploration and development. The results of seismic data interpretation generally serve as the main source of information for this kind of problems, yet there are other methods to predict overpressure zones in the subsurface. The paper presents the results of the overpressure zone prediction using a set of methods including empirical ones, and the approach based on rock-physics modeling that features the soft-sand model of unconsolidated media effective properties. While the rock-physics modeling grants the most reliable result, it is also the most demanding method to the input data. Hence, it can be used to verify other methods of the overpressure zone prediction. We present the results of the overpressure zone prediction at the research site on the Black Sea shelf. The mitigation of the drilling risks via changing the drilling conditions is discussed in detail. As the drilling through the overpressure zones is often a necessity, the engineering solutions proposed in the paper can be applied elsewhere when facing similar problems typical for offshore exploration.

1. Introduction

Pore pressure prediction is an important step in hydrocarbon reservoirs exploration as it is often associated with several geological risks [1]. These risks include, but are not limited to deepwater kicks [2], well blowouts [3], activation of faults [4], and mud volcanoes [5]. There are risks of geohazards caused by unpredicted overpressure zones during hydrate-bearing sediments exploitation [6], as pressure affects the conditions of the hydrate stability zone [7] and potential recovery [8]. Realization of such risks is not extraordinary: according to [9], roughly 10% of the drilling time in deepwater of the Gulf of Mexico was associated with incidents related to overpressure zones. Failure to reliably predict overpressure zones—zones with fluid pressure exceeding hydrostatic pressure—in subsea sediments can lead to a number of results considerably increasing costs of offshore hydrocarbon field exploration and lead to induced geologic hazards and disasters, highlighting the importance of the usage of various blowout preventer systems [10].
There is a general understanding of overpressure zones’ origins. As formulated in [7], continuous sedimentation causes an increase in the overburden, resulting in consolidation of sediments over geological times. Overpressure can develop in such systems if the saturating fluid cannot be expelled from the pore space fast enough and, instead, supports some of the overburden. As permeability controls this rate of pore water expulsion, sediments with low permeability can develop overpressure in this way. Alternatively, overpressure can also develop in sediments with relatively high permeability if the sedimentation rate is fast, i.e., increase in the overburden is faster than rate of pore water expulsion—the latter case is closer to the focus of the current paper.
There are many studies presenting methods for pore pressure prediction using geophysical data of varying spatial and temporal scale following the pioneering paper [11], where acoustic travel time, velocity, and resistivity data were used to estimate pore pressure of fluid-saturated rocks. Well-known and extensively applied approaches to evaluate the pore pressure were proposed in papers [12,13], where electrical resistivity [12], compressional transit time [13], and overburden stress [14] were used as the basis for overpressure zone prediction. A number of specific correlations for particular fields have been proposed by various authors, their comprehensive overviews have been provided by [15,16]. In this brief overview, we would like to mention several recent trends in the pore pressure prediction based primarily on seismic data obtained at offshore sites, as this is the focus of the current study.
The Gulf of Mexico, as already mentioned above, is an important site from the perspective of pore pressure prediction as several studies proposing novel approaches deal with this particular area known for a number of issues [9]. While Eaton’s [12,13] and Bowers’ [14] are among the most widely used methods of pore pressure prediction on shore [16], offshore reservoirs, especially the upper layers of seafloor sediments, are unconsolidated fluid-saturated masses, frequently, in the state of under-compaction. As a result, correlations developed for different reservoirs can be inapplicable for pore pressure characterization at the upper layers of seafloor sediments. Alternative approaches have been developed based on analysis of compaction trends for unconsolidated sediments [17]: the relationship between pore pressure of fluid-saturated sediments, their porosity, and effective stress has been established based on experimental data. This relationship, however, demands the presence of direct measurements of the pore pressure at certain depths to provide a reliable evaluation of overpressure [18]. Although methods of direct estimation, e.g., borehole penetrometers, are being developed [19] and successfully applied at various sites [20,21], direct pore pressure measurements require long equilibration times [18]. Whenever direct estimations of the pore pressure at a particular depth are known, the porosity trend can be used to reliably predict pore pressure and overpressure zones even in unconsolidated sediments [22,23] with an emphasis on zones near the seafloor—up to several dozens of meters from the seafloor [18,24]. This method, however, is limited to unconsolidated zones, so greater depths require application of other methods, primarily based on well logging data [25].
While well logging data remain an important source of information for estimation of pore pressure and prediction of overpressure zones, early stages of offshore fields exploration are characterized by lack of these data. At the same time, the need to estimate pore pressure emerges at pre-drilling stages [26]. Logging-while-drilling (LWD) data can be used as well for estimation of pore pressure [27,28] before drilling the main exploratory wells.
While porosity, resistivity, and acoustic travel time are generally used to predict pore pressure from well logs, there are also other sources of information worth mentioning, especially, in the context of the following sections. The results obtained at offshore site located in the Eastern India [29] suggest the presence of interrelationships between pore pressure and inner structure of the sediments, including grain size distribution. These interrelations give a chance to believe that rock physics approaches can be helpful in pore pressure prediction. The majority of rock physics methods gives a possibility to relate the effective (measured) physical properties of rocks with the parameters describing the physical properties of components, their volume concentration, shape, and mutual distribution in the rock volume. Among the rock physics approaches, methods exist that give a possibility to incorporate the effect of pore pressure on the macroscopic elastic properties of granular media in an explicit form [30,31,32,33]. These methods can be applied for granular media where the pore pressure plays a dominant role in the effective elastic properties [34]. Thus, in the works [35,36], the authors proposed a heuristic combination of the Hertz–Mindlin method [30] and the Hashin–Shtrikman bounds [37] in order to consider two different types of granular rocks—with and without cement between the grains—the so-called stiff-sand and soft-sand models. The authors noted that instead of the Mindlin–Hertz method any method suitable for granular medium can be applied. However, in practice, the former is the most popular.
To sum up, there are a variety of methods for overpressure zone prediction based on geophysical data. A number of correlations have been proven to be reliable for different sites—and exploitation of a new site is complicated due to the lack of information on which correlation should be used to obtain reasonable estimations of pore pressure. Moreover, it is generally necessary to have direct or indirect measurements of the pore pressure at certain depths to find the proper correlation coefficients for the current site. Moreover, different methods of the pore pressure estimation can be the most suitable at different zones even at the same site: compaction trend-based methods provide reliable results for unconsolidated sediments near the seafloor, while widely used estimations based on resistivity and acoustic travel time are more suitable for the greater depths. On the other hand, the rock-physics modeling provides another perspective on pore pressure estimation—while it generally requires more data for reliable estimations, the corresponding workflow remains independent on the specific site. Comparison of usage the same data to predict pore pressure using these two approaches seems of both scientific and practical interest: for example, it remains unknown at the current stage of pore pressure estimation methods, which of them are more, and which of them are less conservative. This comparison is among the theoretical goals of the current study—it is carried out at a certain site with available data, making the application of both methods possible.
In the current study, we aim at estimating the pore pressure at a certain site, located in the eastern Black Sea, in a zone with expected drilling for offshore hydrocarbon reservoir development. Seismic data act as the main source of information for the pore pressure estimation—only a limited number of engineering wells have been drilled at the site, but drilling results provided both an understanding of the need to reliably predict pore pressure due to a risk of well blowout, and some insight on the potential properties of overpressure zones. The pore pressure prediction procedure was completed using various methods: as far as a certain indirect estimation of pore pressure at a particular depth was performed during drilling of engineering wells, the compaction trend [18,24] could be successfully applied to locate overpressure zones. Rock-physics modeling was carried out as well to check the agreement between estimations obtained from different methods. Simultaneous usage of different methods of pore pressure estimation provided an opportunity to get an extra verification of predictions and adjust the following strategy of exploration of the field.

2. Overview

2.1. Geological Setting

The study area is located in the northwestern part of the Black Sea within the Kerch-Taman shelf. In the west, it is limited by the meridian of the southern tip of the Crimea; in the north-west by the Crimean, and in the east—by the Caucasian coast of the Krasnodar Territory.
Tectonically, a significant part of the area under consideration is located within the Kerch-Taman trough, which includes the Taman Peninsula, the southeastern part of the Kerch Peninsula and the adjacent Kerch-Taman Shelf of the Black Sea. The southern part of the area covers the outer zone of the shelf and adjacent areas of the slope of the Black Sea basin. There are several ideas about the tectonic nature of the trough noted above. It is classified either as a transverse or interpericlinal trough. A number of geologists tend to consider it as a southwestern branch from the Indolo-Kuban trough [38] located to the north.
It is assumed that the southeastern and southern limits of the described trough are the folded formations of the Northwestern Caucasus and the Anapa ledge in the sea, composed of Mesozoic and Paleogene deposits. In the west, in the area of the city of Feodosiya, the Kerch-Taman trough is limited by shallow Mesozoic formations and, in general, the eastern closure of the Crimean mountain structure, although the features of its eastern limit cause discrepancies. If we assume that the Crimean mountain structure is a block uplifted on one side in the Cenozoic, the eastern limit of which can be a system of transverse strike-slip faults. In the south and southwest, the Kerch-Taman trough is limited by the Barrier anticline zone in the outer part of the shelf of the same name, which, in our interpretation, is a system of fold-thrust dislocations [39]. In the north, the trough does not have a clear tectonic boundary. Only in the northwest of the Taman Peninsula (the area of the Fontalovsky uplift) is a relatively shallow position of the Mesozoic strata noted, which can be considered as one of the fragments of the northern limit of the Kerch-Taman trough. According to seismic studies, the thickness of the sedimentary fulfillment of the trough exceeds 10 km. Most of the section of its central sections is composed of Maikop-Neogene deposits. The Paleogene-Mesozoic (pre-Maikop) part of the section is much less studied.
Marine seismic surveys have established a system of linearly extended anticlinal zones in the trough. Their southwestern strikes within the shelf are replaced by sublatitudinal ones on the Taman Peninsula. High-amplitude brachianticlines, composed mainly of Maikop and supra-Maikop deposits, take part in the structure of anticlinal zones. Until recently, clay diapirism played the main role in the structure and formation of these brachyanticlines [40,41]. The common depth point (CDP) materials of recent years, obtained in the described area, indicate a significantly greater significance of fault tectonics and, in particular, fold-thrust dislocations in the formation of the structural plan of the Mesozoic-Cenazoic deposits.
In 1997–2005, at the new technical level of marine seismic exploration, various promising areas of the Kerch-Taman shelf and adjacent sections of the slope were covered by 2D CDP studies using a uniform network of profiles in order to clarify the structure and nature of local structures previously identified in the supra-Maikop deposits, study the pre-Maikop sedimentary complexes, and resolve the issue of dominant types of hydrocarbon traps within the shelf [42]. 3D CDP surveys were carried out in a number of areas.
The deep exploration well (Rifovaya-302) on the Anapa shelf was drilled in 1985 in the crest of the Rifovoye uplift. The well penetrated the top of the Maikop deposits at a depth of 600 m and was stopped in the same deposits at a depth of 2000 m.
Another exploratory well, drilled at the northwestern end of the Shatsky swell at the Yuzhno-Doobskaya (Maria) structure, opened the top of the Mesozoic deposits to a depth of more than the Zapadno-Chernomorskaya area on the Black Sea shelf, the press service of Rosneft OJSC reports. The depth of the sea at the drilling point reaches 2109 m. The actual depth of the well was 5265 m. As a result of the work, a unique structure was discovered, in the roof of which a Cretaceous carbonate stratum with a thickness of more than 300 m was discovered.
The main object of the study area is a seismic complex, including deposits of the Oligocene-Lower Miocene (Maikop series). On seismic profiles, the presence of a fairly thick thickness of Maikop deposits is established. Here, the deep erosion of these deposits by the post-Maikop erosion processes is clearly recorded. On the map of the thickness of the Maikop deposits, a band of their maximum erosion is highlighted to the west and south of the study area of the ledge. Thus, the area of accumulation of Maikop deposits occupied a vast area, including the modern deep-water part of the Black Sea. Based on the available materials, it is difficult to judge tectonic movements in the Maikop time, but, apparently, they were not as intense as in the post-Maikop time, and especially in the Pliocene-Pleistocene.
Most of the hydrocarbon deposits on the adjacent Kerch and Taman peninsulas are associated precisely with the Oligocene-Miocene, mainly Maikop and, to a lesser extent, Chokrak-Karagan deposits.
The newest CDP materials, obtained by VO “Chernomorneftegaz”, unambiguously resolved the issue of the fold-thrust nature of the structures in this part of the shelf [42].
It can be said with confidence that the asymmetric folds complicated by reverse thrusts in this part of the shelf can be associated mainly with domed reservoir deposits. Seismic data also indicate that such deposits in most cases should be tectonically screened and, in some places, stratigraphically screened. At the same time, deposits on the arches of many uplifts were subjected to erosion during periods of breaks in sedimentation and, therefore, the possibility of erosion of the main Middle Miocene oil and gas complex is not excluded. However, it was preserved in the subthrust parts of these uplifts. Therefore, we highly appreciate the prospects of Miocene deposits within the uplifts identified here, mainly in the subthrust parts of the structures. The asymmetric folds of this part of the shelf may also be associated with hydrocarbon deposits in the pre-Maikop (Paleocene-Eocene) deposits in their arched parts.
In 2005, in the Ukrainian zone of the Prykerchensky shelf, VO “Chernomorneftegaz” drilled the parametric well Subbotina 403, in which commercial hydrocarbon inflows were obtained from Maikop deposits [43,44]. According to well logging data, promising objects in the Tortonian, Eocene, and Paleocene deposits were identified in the well, but they were not tested for technical reasons.
The bottom hole is located at a depth of 4300 m in the Early Eocene deposits (according to N.V. Maslun). In 2008, in exploration well 1, positive results were obtained when testing objects in the deposits of the lower Maikop (layer M3). In 2009, well 2 was drilled with a design depth of 3150 m in the Subbotin area in order to search for productive horizons in the Torton, Maikop, and Eocene deposits. The bottom of the well is located at a depth of 3200 m in the Eocene deposits (after reaching the design depth, it was decided to deepen the well by 50 m).
The well uncovered deposits of the Neogene, Maikop series, Eocene, represented by limestones, marls, argillaceous sandstones, siltstones, clays, mudstones; from the interval 2030–2047, an oil inflow of 13.1 m3/d was obtained, from the interval 2006–2047 m, an oil inflow of 19.1 m3/day was obtained (productive horizon M-1).
In the Lower Eocene, according to electrometry data, a repetition of the section of the interval 3890–4038 m is clearly observed. The well probably passed a tectonic fault of the reverse-thrust type twice, at a depth of 3890 and 4162 m. This is also indicated by the geological complications that were noted at these depths during drilling, as well as by the finds of cores of redeposited crumpled Cretaceous and Danish foraminiferal forms. According to the new interpretation of seismic data, taking into account the drilling data of parametric well No. 403, along the reflecting horizon Ib, confined to the lower Maikop formation, the fold is an anticline of latitudinal strike [42].
Its dimensions within the limits of the extremely closed isohypse minus 3000 m are 10 × 2–4 km, the amplitude is 650 m. The fold in the north and south is complicated by tectonic faults of the latitudinal strike-thrust type. The geological structure of the Subbotin area is significantly more complicated along the deeper horizon IIa, confined to the roof of the Paleocene-Eocene formations. The crest of the fold is displaced to the south of well No. 403 and is complicated by tectonic disturbance. The fold is contoured by isohypse minus 3800 m.

2.2. Data

At the research site, 2D multichannel reflection very-high-resolution seismic data were available. The frequency range of the seismic data was from 100 to 600 Hz with the central frequency of 250 Hz. The range of offsets was from 50 to 250 m which facilitated the range of incident angles of reflected P-waves from 5 to 45° in the near-surface. The maximum propagation depth of the seismic survey was about 400 m, and the vertical resolution of the resulting seismic images was about 2–5 m.
The signal processing of the seismic data included a bandpass filtering, FK-filtering, an amplitude correction for the spherical divergence of the wavefront, suppression of multiples, a pre-stack Kirchhoff migration in time-domain, construction of the supergathers by averaging of the neighbor gathers, and stacking. The figure below shows an example of the processed seismic image (a seismic stack) along the 2D profile that crosses the project borehole. The position of the project borehole coincides with the projection of X engineering well to the 2D seismic profile—X projection (X proj in Figure 1), for which the pore pressure prediction was conducted.
At the site, several engineering wells, up to 50 m deep, were also available. Soil tests and laboratory measurements on the soil samples were conducted in each engineering well. The lab measurements were aimed at the estimation of physical and mechanical properties of the soils and their classification. Among the soil properties that were measured and estimated in the laboratory were the bulk density (cutting ring method), moisture (drying to permanent mass method), flow (standardized cone method, plastic limit method), and elastic moduli. The static Young modulus of the soils were measured under static loading by triaxial and compression tests. Note that the Poisson ratio v was estimated using the laboratory data on Liquidity index IL [45]:
v = 0.05 + 0.45IL
As a result, seven engineering and geological elements (EGE) were identified at the research site. Their description is given in Table 1. The tops of the EGE in the well X are shown in Figure 1.

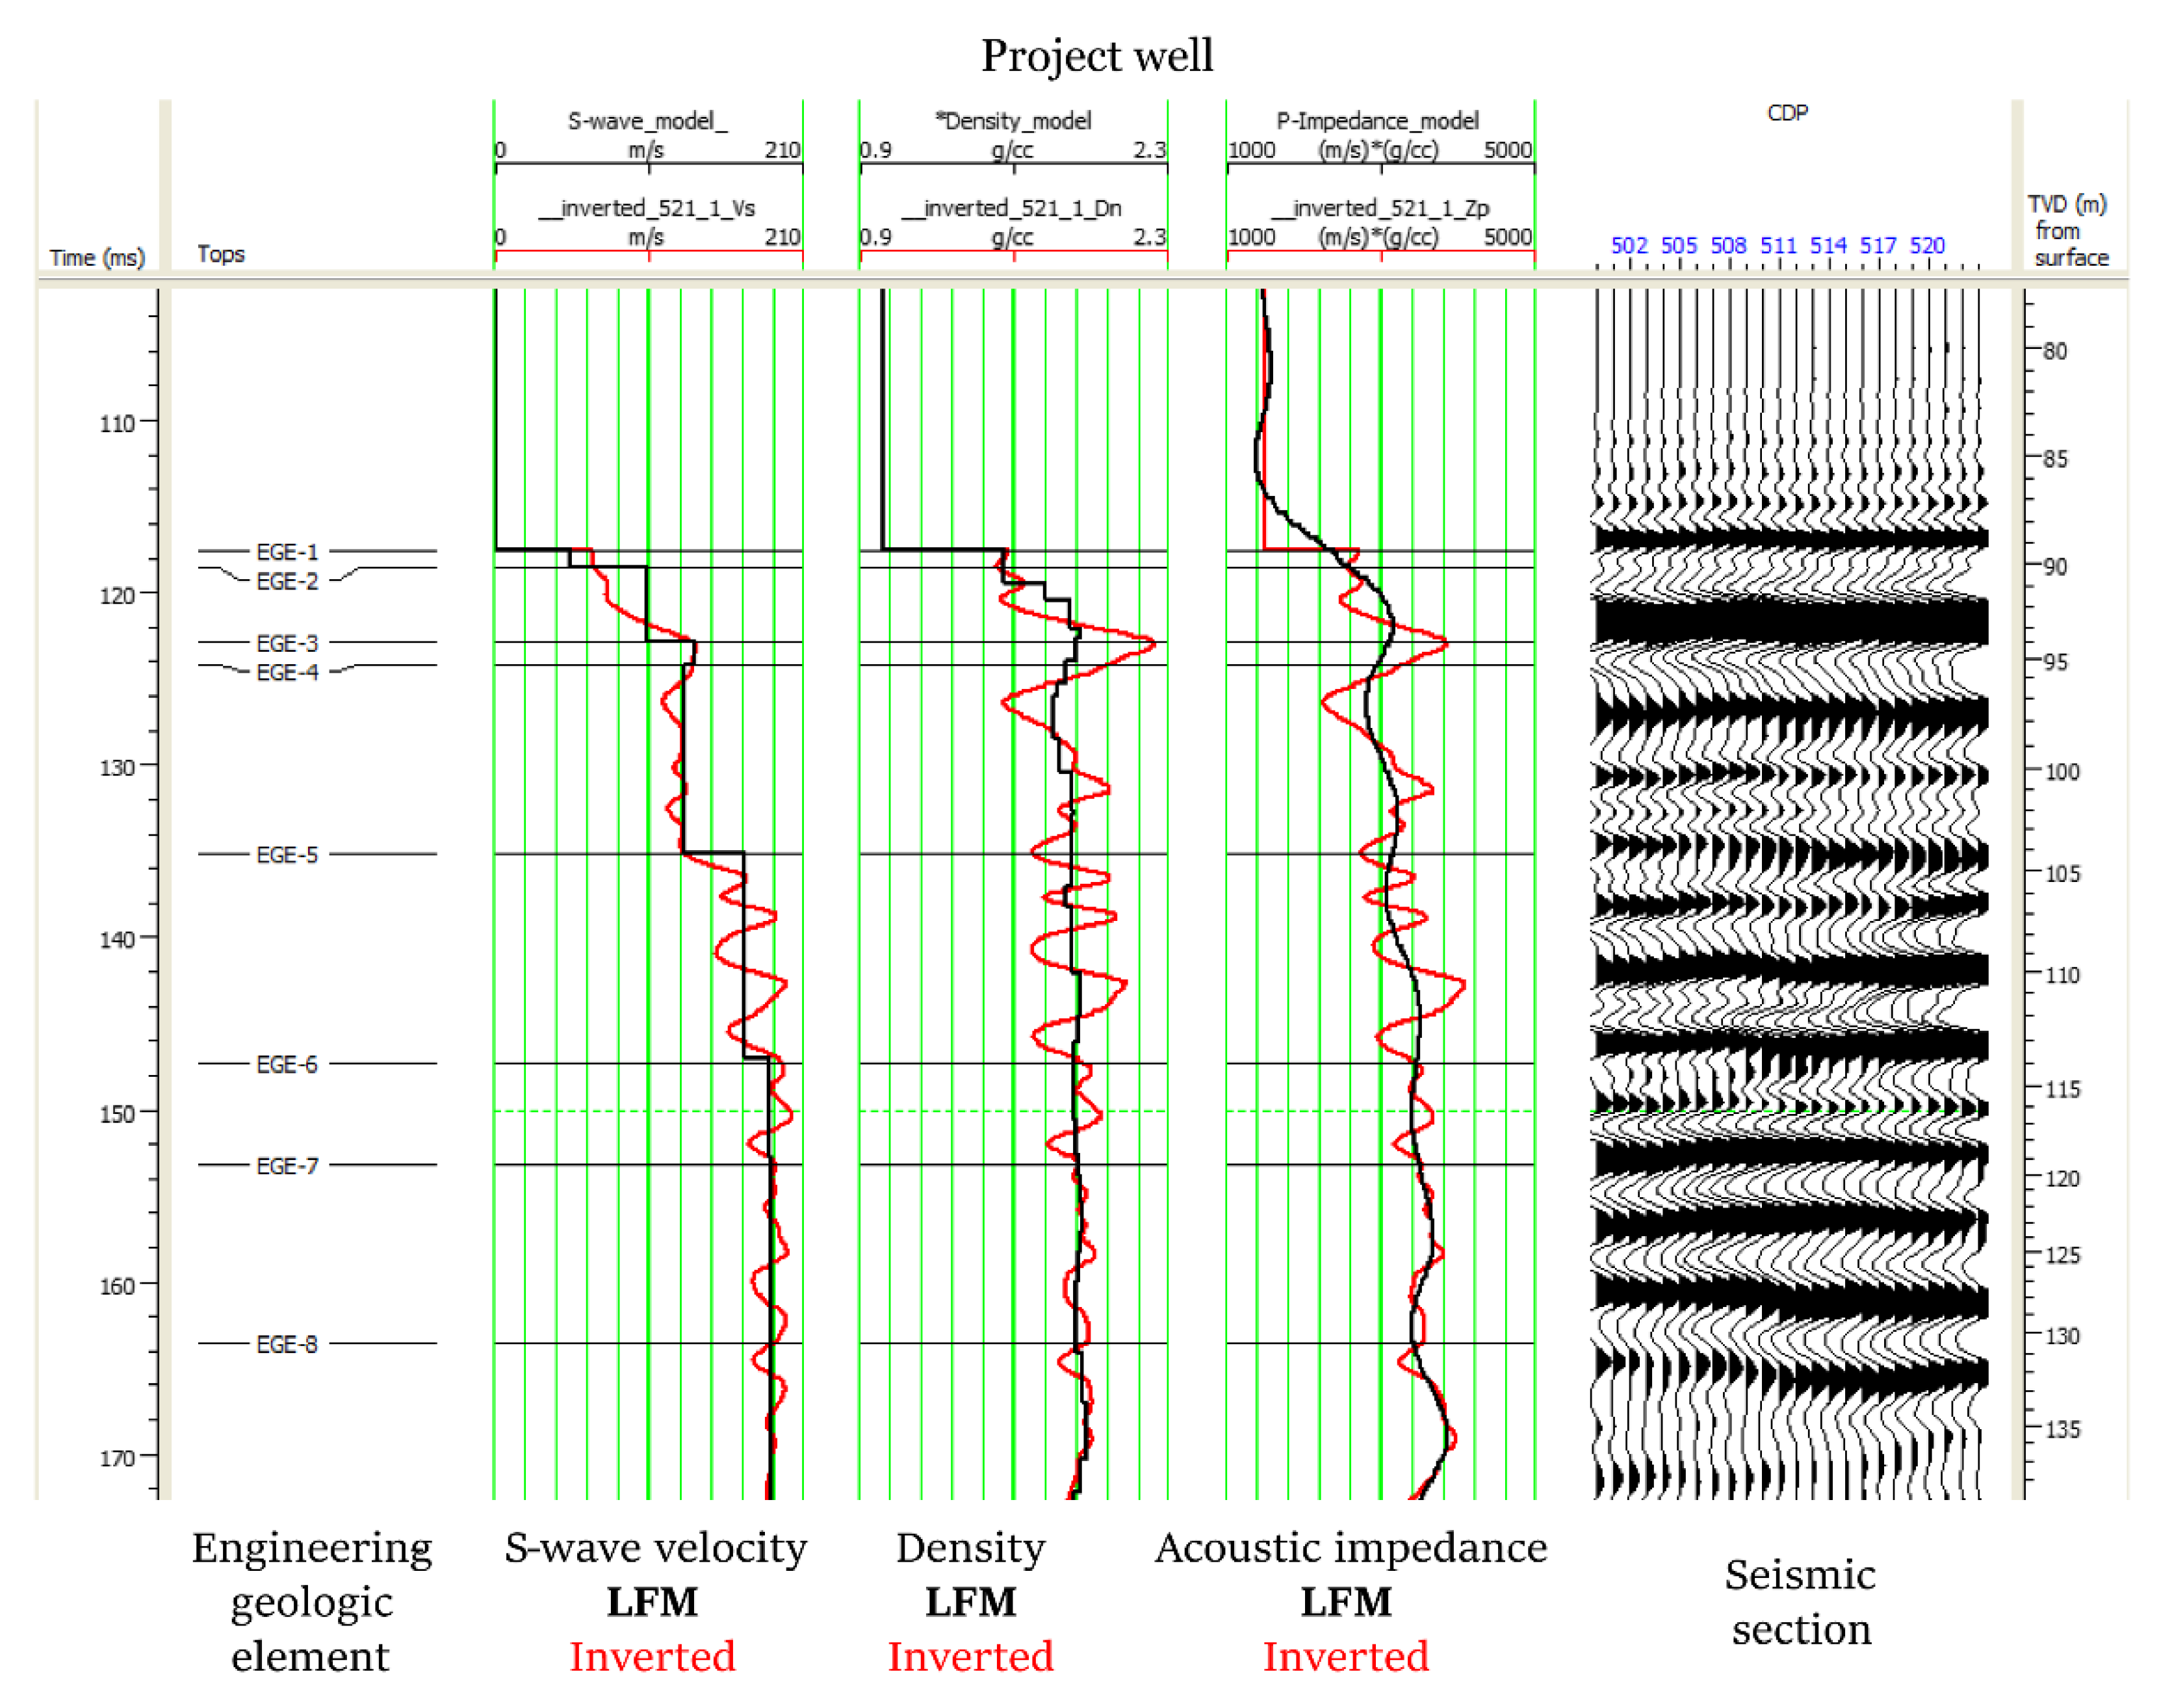
2.3. Seismic Inversion

To estimate the elastic properties of the sediments in the near-surface at the research site, we applied a pre-stack seismic data inversion on the available 2D reflection seismic datasets. The conducted inversion was based on the Zoeppritz equations for the reflection coefficients of an incident P-wave.
The pre-stack amplitude inversion of reflection seismic gathers allows one to simultaneously estimate dynamic elastic moduli and density of the subsurface. Typically, we estimate the acoustic impedance, Zp = ρVp, the bulk density ρ, and the body wave velocity ratio Vp/Vs (where Vp—compression wave velocity, Vs—shear wave velocity), by the pre-stack amplitude inversion. From these parameters, we can calculate the dynamic elastic moduli such as bulk and shear moduli, Young’s modulus, and Poisson’s ratio.
The main challenge for the inversion of the very-high-resolution seismic data is posed by the absence of the low-frequency information up to 80–120 Hz [46,47]. The absence of the low frequencies in the seismic data results in poor estimates of low-frequency trends of the elastic properties.
To fill this gap in low frequencies and stabilize the inversion results, we utilized the results of seismic P-wave velocity analysis and the laboratory measurements of the bulk density and the static elastic moduli of the soils available at the engineering wells at the research site.
We calculated the model of interval P-wave velocities from RMS P-wave seismic velocities using a Dix formula. The static Young modulus obtained in the laboratory was corrected for its dynamic analog. For the correction, we applied the coefficient 20 (the dynamic modulus is 20 times greater than its static analog), commonly used for soils. We assume that the Poisson ratio provided by the Liquidity index test is similar to its dynamic analog. The estimated dynamic Young modulus and Poisson ratio are used to predict the low-frequency S-wave velocity:
Vs = (E/2ρ(1 + v))0.5,
where E is dynamic Young’s modulus, ρ is the bulk density and v is Poisson’s ratio.
Based on these preliminary estimates, we built the low-frequency models of the P-wave, S-wave velocities, and density. Then, we conducted an acoustic post-stack inversion on the seismic stacked sections to clarify the models of the acoustic impedance, and finally, we inverted the seismic gathers to detail the models of the acoustic impedance, density, and Vp/Vs. The low-frequency models and the results of the seismic pre-stack inversion are shown in Figure 2. These results are further used for the pore pressure inversion.

2.4. Model of Mechanical Properties

The seismic data obtained in the previous section allow us to derive the P-wave velocities from the density and acoustic impedance. From P- and S-velocities and density, the dynamic moduli were calculated including the bulk and shear moduli, Young’s modulus and Poisson’s ratio. Moreover, knowing the density of the solid grain material and fluid, the porosity can be estimated. The laboratory measurements carried out for the marine sediments provides a rather high density of the mineral grain material which varies from 2.70 to 2.74 g/cm3. The density of fluid is equal to 1.024 g/cm3 that is the sea water density. The porosity, bulk modulus, and Poisson’s ratio along the project well are shown in Figure 3. Note that the Poisson ratio is rather high varying from 0.493 to 0.498 that is very close to the sea water value (0.5). These values are much greater than those obtained in the laboratory test on Liquidity index (see Table 1). For these values of Poisson’s ratio, the shear modulus does not exceed 0.08 GPa that is comparable to the experimental error of its determination. This forced us to assume that this modulus may have higher values than provided by the seismic data.
The elastic moduli and porosity of the sediments were further used for the rock-physics modeling and preconsolidation analysis.
As far as overpressure zone prediction is carried out in order to estimate various risks, problems with drilling have been analyzed as well. It is widely known [48] that seismic data without any additional information on the mechanical properties of sediments limits the opportunity to predict drilling risks. Although special methods of estimating risks solely from seismic data using data and system analysis methods have been developed [49], there are still considerable uncertainties in quantitative prediction of risks associated with overpressures. Fortunately, a number of samples have been extracted from the engineering drilling site, so there was an opportunity to carry out typical triaxial loading tests to evaluate static elastic moduli of the extracted samples.
The tests have been performed for 44 samples extracted from the depths between 1 and 50 m below seafloor. Cylindrical samples have been subjected to constant radial stress and gradually increasing vertical stress. Due to the rheological features of the studied seafloor sediments, the obtained “stress vs. strain” rheological curves were characterized by high nonlinearity. The obtained critical differential stresses (maximal obtained differences between axial and radial stress for each sample) were as low as 0.2 MPa, corresponding to low internal friction angles and cohesions of the samples—which is typical of unconsolidated seafloor sediments.
The typical procedure of analyzing drilling risks via geomechanical modelling starts from construction of the model of mechanical properties, which typically consists of: (1) transition from dynamic elastic moduli to their static analogues; (2) transition from static elastic moduli to strength properties. With the seismic data described above and available triaxial loading test results, these steps have been completed to establish the foundation of drilling risks analysis.
Figure 4 represents the transition between dynamic and static Young’s moduli. The solid blue line stands for the dynamic Young modulus calculated from seismic data described in Section 2.3 along the trajectory of the studied well. Black circles represent the results of triaxial test data processing: the linear part of the “stress vs. strain” rheological curve was analyzed to obtain its slope, which was considered as Young’s modulus for the sample at the depth of its extraction. Horizontal dotted lines are plotted to highlight 6 interfaces between layers characterized by similar mineral compositions of the extracted samples according to laboratory analysis of the extracted samples.
With the dynamic Young modulus profile and a set of dots for static Young’s modulus, one gets the opportunity to solve the linear regression problem: static Young’s modulus is expected to be linearly related to dynamic elastic modulus; the coefficients in this dependency are found from solving the optimization problem to reduce the difference between the calculated static Young modulus and its analogues from triaxial tests. The specific feature of the current case is associated with the importance of the layers: it can be clearly seen that typical dynamic Young’s moduli of the selected layers differ a lot between each other. As a result, usage of one linear correlation between static and dynamic Young’s moduli would result into considerable errors. As a result, each layer was characterized by its own solution of the optimization problem, resulting into reasonable correlation coefficients.
Poisson’s ratio for the considered sediments was rather high: it exceeded 0.4 for the studied samples from layers EGE2–EGE4. Meanwhile, for layers EGE5–EGE7, the Liquidity index test produced lower values (Table 1). However, the rock-physics modeling (see Section 3.2) suggested high values of Poisson ratio along the whole well (greater than 0.43). Therefore, the equality between static and dynamic Poisson’s ratio was considered to construct the model of mechanical properties.
Completed triaxial loading tests had also provided an opportunity to deal with strength properties of the studied samples. The linear Mohr–Coulomb failure criterion was used to deal with the strength properties of the sediments:
τn = C + µfσn,
where τn and σn are the tangential and normal stress leading to the failure, C is the inherent shear strength (cohesion), and µf is the internal friction coefficient (tangent of internal friction angle φi).
With a small number of samples extracted from each layer, the following assumption was used to evaluate failure criterion parameters: as the friction coefficients of all samples were found to be very low, while cohesion differed significantly, the internal friction coefficient was reconstructed as a step function: each layer was characterized by its own value of µ, which was evaluated from the sets of stresses leading to the failures of the samples related to each layer. After averaging the internal friction coefficients for all layers, cohesion was evaluated from the Mohr circle constructed for the failure conditions with the known slope of the Mohr–Coulomb linear failure line. While this method of dealing with two parameters independently can lead to problems with other reservoir geomechanics problems—multi-stage triaxial loading tests are necessary for the evaluation of the internal friction angle—in this particular case, averaging of the internal friction coefficient is backed by the very low strength of the sediments and low stresses, providing that cohesion alters the risk evaluation results to a higher degree compared to the internal friction coefficient.
Cohesion C, estimated using the described methodology, can be plotted as a function of static Young’s modulus obtained from triaxial tests—Figure 5. Different colors of the dots represent different layers mentioned above, yet it is clear that in this particular case, layers’ differentiation does not play an important role for transition from dynamic moduli to static: a linear dependency between static Young’s modulus and cohesion seems to be a reasonable correlation for strength property evaluation.
Once again, the parameters applied to evaluate the cohesion are obtained using the solution of the linear regression problem.
Estimation of the static elastic moduli and strength properties sums up the construction of the model of mechanical properties which will be consequently used for risk evaluation. The next steps in the geomechanical analysis of risks are associated with the reconstruction of the pore pressure and stresses acting in the studied sediments. While the latter is a relatively easy task—at least for non-consolidated sediments with known density and elastic properties—evaluation of pore pressure deserves special attention and will be described below in detail.

3. Results

The following sections provide the main results of pore pressure prediction using two methods—pressure prediction from the void ratio [18,24] and rock-physics modeling [36]. The final part contains the comparison of the results obtained via these methods.

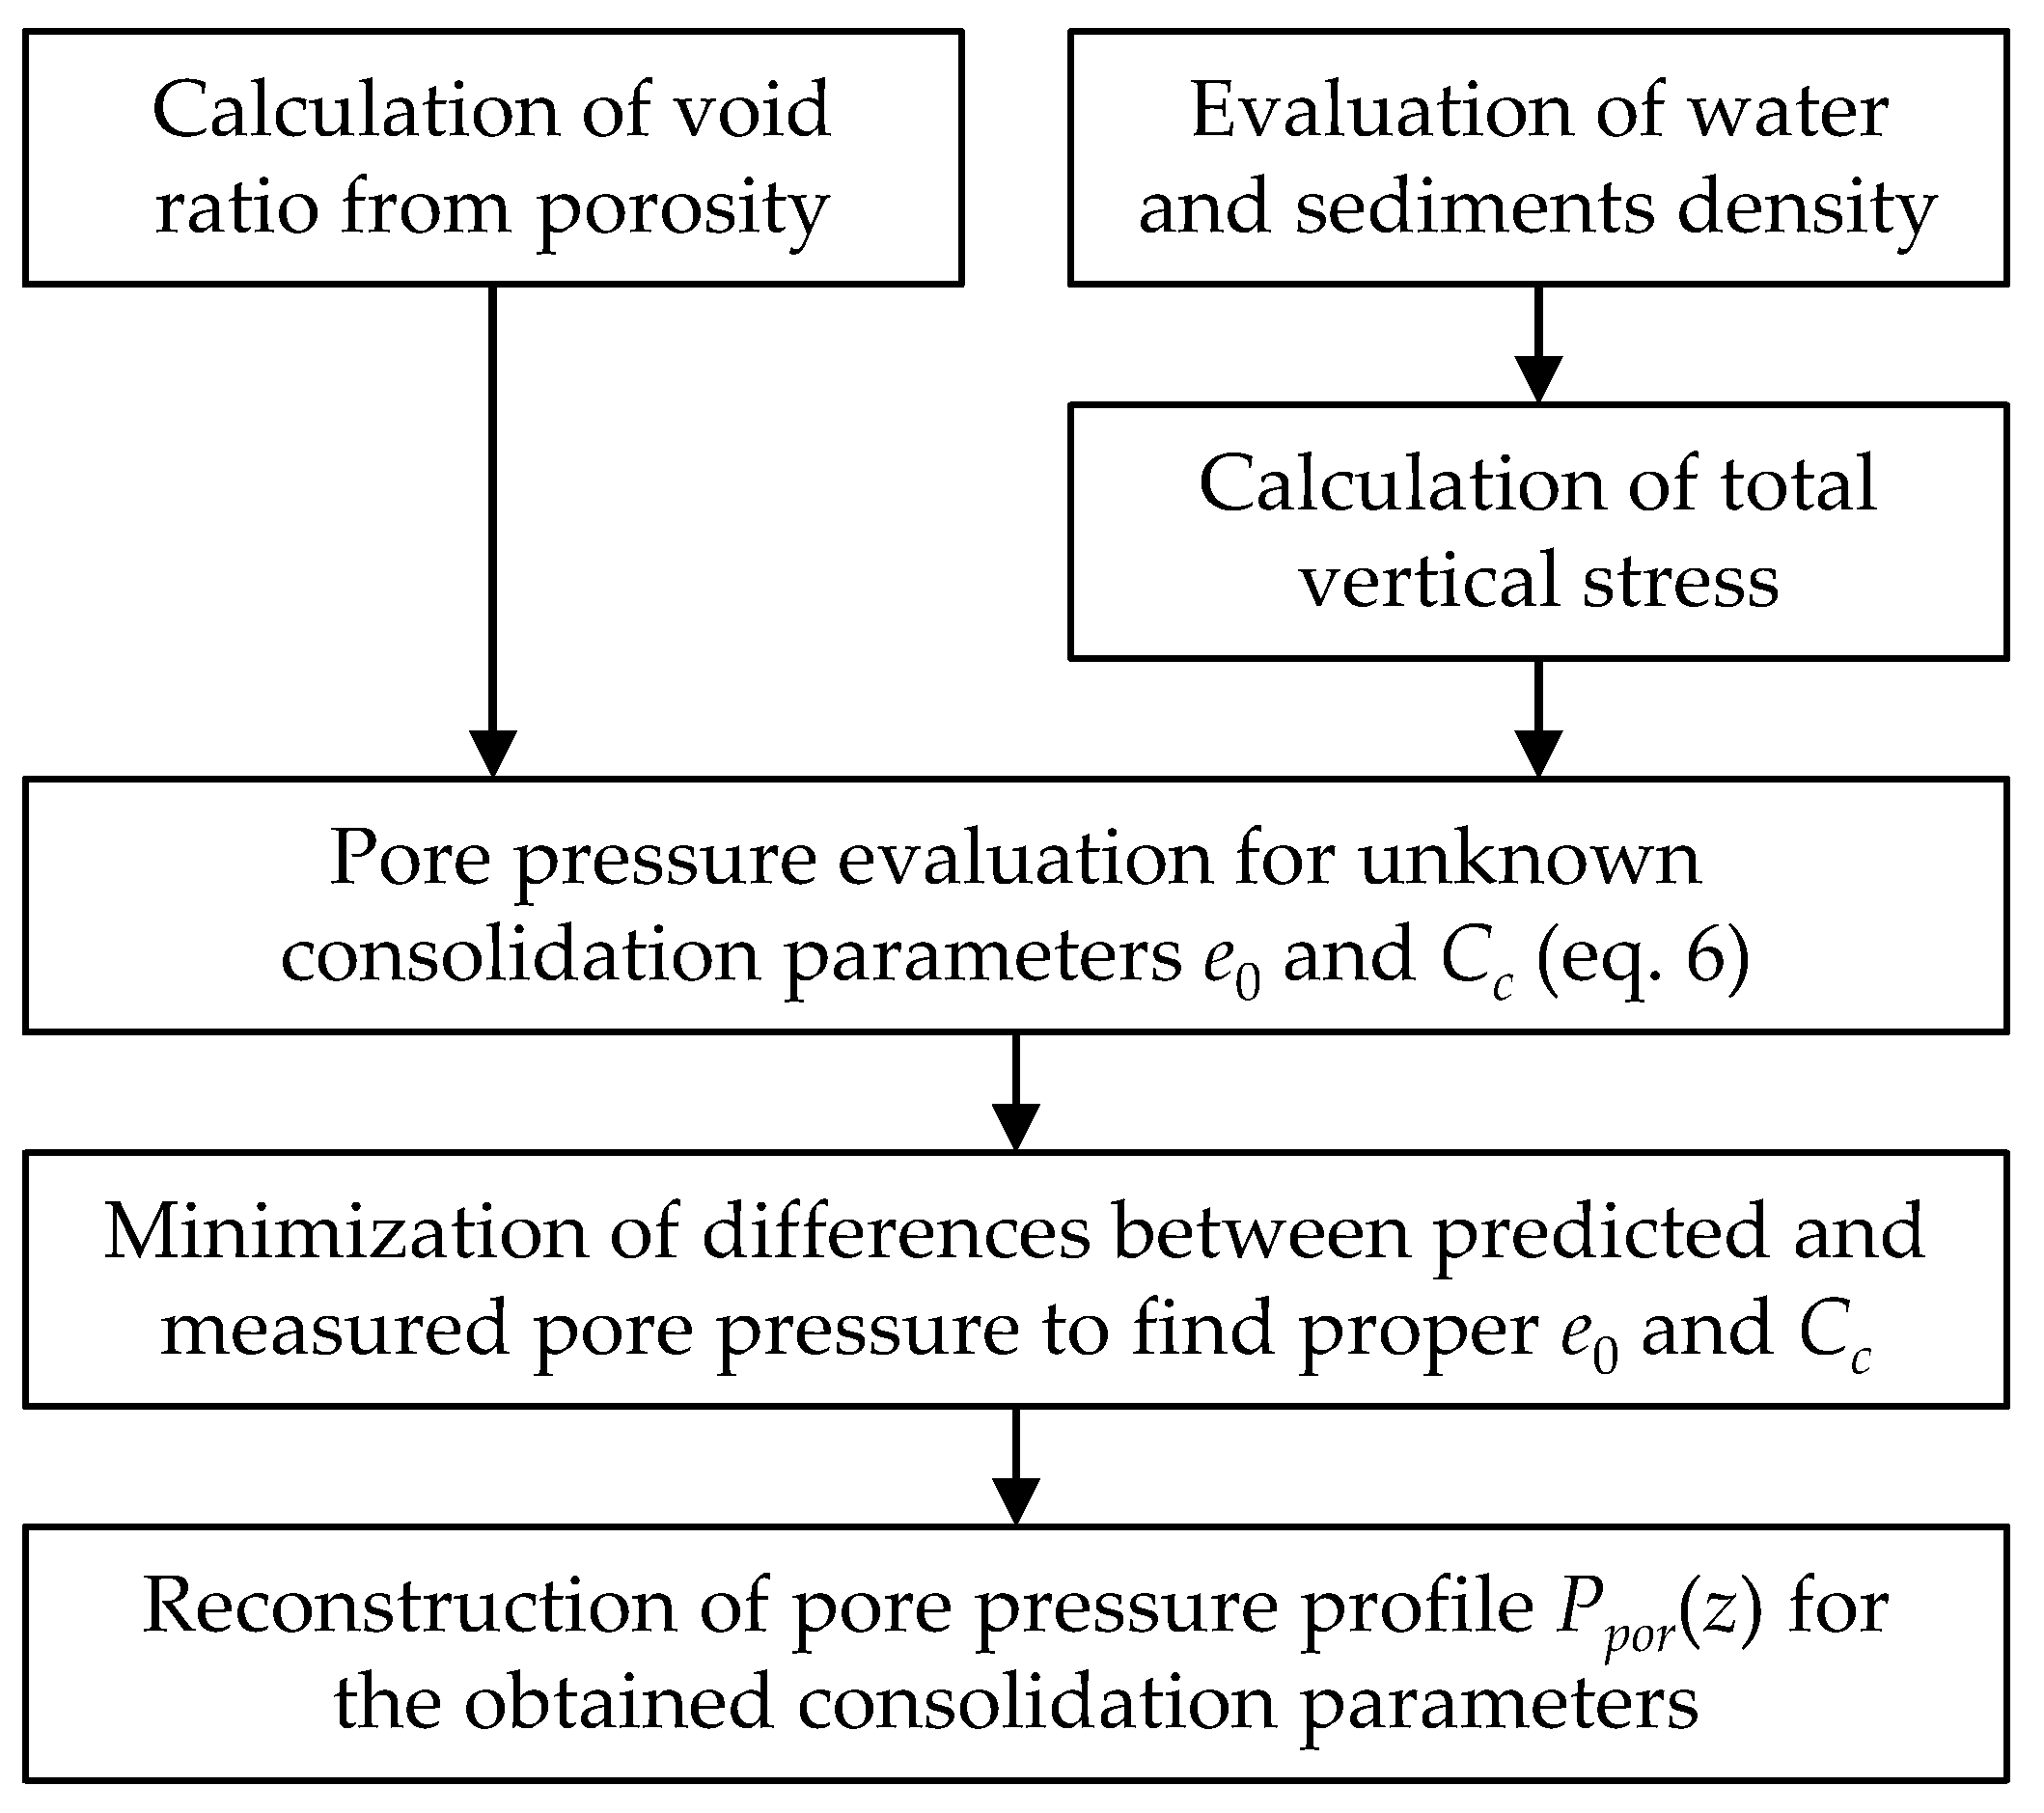
3.1. Pore Pressure Prediction from Void Ratio

As it was already highlighted above, the void ratio can be used based on the porosity of the sediments. Reconstruction of the porosity was described in Section 2.4: rock-physics methods can be successfully applied on data in the presence to reconstruct the porosity profile along the well (Figure 3).
In the current section, we focus on the pore pressure evaluation and prediction of overpressure zones based on the void ratio e which is in a simple relationship with the porosity φ:
e = φ/(1 − φ),
A specific method of interpreting the porosity profile from the perspective of consolidation was described in detail by [18,24]. Consolidation analysis considers a specific preconsolidation stress as a parameter corresponding to deformation processes taken place for the considered sediments. This term was proposed to describe the maximum vertical effective stress that the soil had been subjected to during the history of its elastic and elastoplastic deformation [50]. While specific laboratory experiments based on reconsolidation of extracted samples were developed by various researchers [51,52], there still remains the problem of estimating the true preconsolidation stress due to significant sample disturbance that leads to the risk of underestimating the preconsolidation stress from these tests [53].
Nevertheless, equations used for the pressure prediction from the void ratio discussed by [18] can still be used for this purpose: preconsolidation tests provide necessary information for finding the parameters of pore pressure prediction equations. Various data can be used to check the validity of the pore pressure prediction, including direct measurements. Engineering drilling at the studied site was characterized by an intensive gas leak visible at sea surface when a specific depth interval was drilled. Given the known depth of drilling, sea depth at the drilling site, and the intensity of the leak, the evaluation of pore pressure at the layer was completed: pore pressure in the gas-saturated zone at the depth of 20 mbsf was proved to be 1.2 MPa.
This estimation was used to find the parameters of the exponential relationship between void ratio and effective vertical stress [18] that was assumed to be valid at the studied site:
e = e0CclogσV,
where e0 is the void ratio at a vertical effective stress of unity (1 MPa), Cc is the specific compression index describing deformation along the yield surface, and σV is the effective vertical stress. Proper rearrangement of this equation provides the following dependency for the pore pressure Ppor:
Ppor(z) = SV(z) − 10–(e(z) − e0)/Cc,
where SV is the total stress, z is the depth below the seafloor. If the sea depth is known alongside with the density profile, the total stress can be obtained as:
S V ( z ) = ρ w g h w + 0 z ρ ( z ) g d z ,
where ρw is the water density, hw is the sea depth, and ρ(z) is the estimated density profile. With all these parameters described in the previous sections, the total vertical stress reconstruction is a straightforward procedure. It is worth mentioning that effective horizontal stresses for these unconsolidated sediments tend to be close to the vertical effective stress, due to both high Poisson’s ratio and considerable elasto-plastic deformation.
A block-scheme of the forward problem solution is given in Appendix A (Figure A1).
It is clear that two independent measurements are necessary for successful application of Equation (6) for pore pressure prediction. While one measurement (1.2 MPa at 20 mbsf) was obtained from direct observations, the second point was the expected hydrostatic pressure near the seafloor. As a result, two depths and two measurements were used in Equation (6) to get two parameters: Cc = 0.18, e0 = 0.88, typical of the considered site at the Black Sea. The analogous values for the Gulf of Mexico were reported to be Cc = 0.54 and e0 = 0.47 [18].
As a result, Equation (6) was used to provide a simple, preliminary evaluation of the pore pressure at the site with mentioned parameters. Nevertheless, it is clear that there are some drawbacks of using this estimation: firstly, specific consolidation tests were not carried out, so the preconsolidation stress was not known for sure; secondly, the exponential dependency between the void ratio and the effective vertical stress was not backed by experiments; finally, the assumption of hydrostatic pressure near the seafloor was drawn without a solid proof as well. These problems led to the need of using extra approaches to check the reconstructed pore pressure profiles. Rock-physics modeling can provide an approach, which is described in the following section.

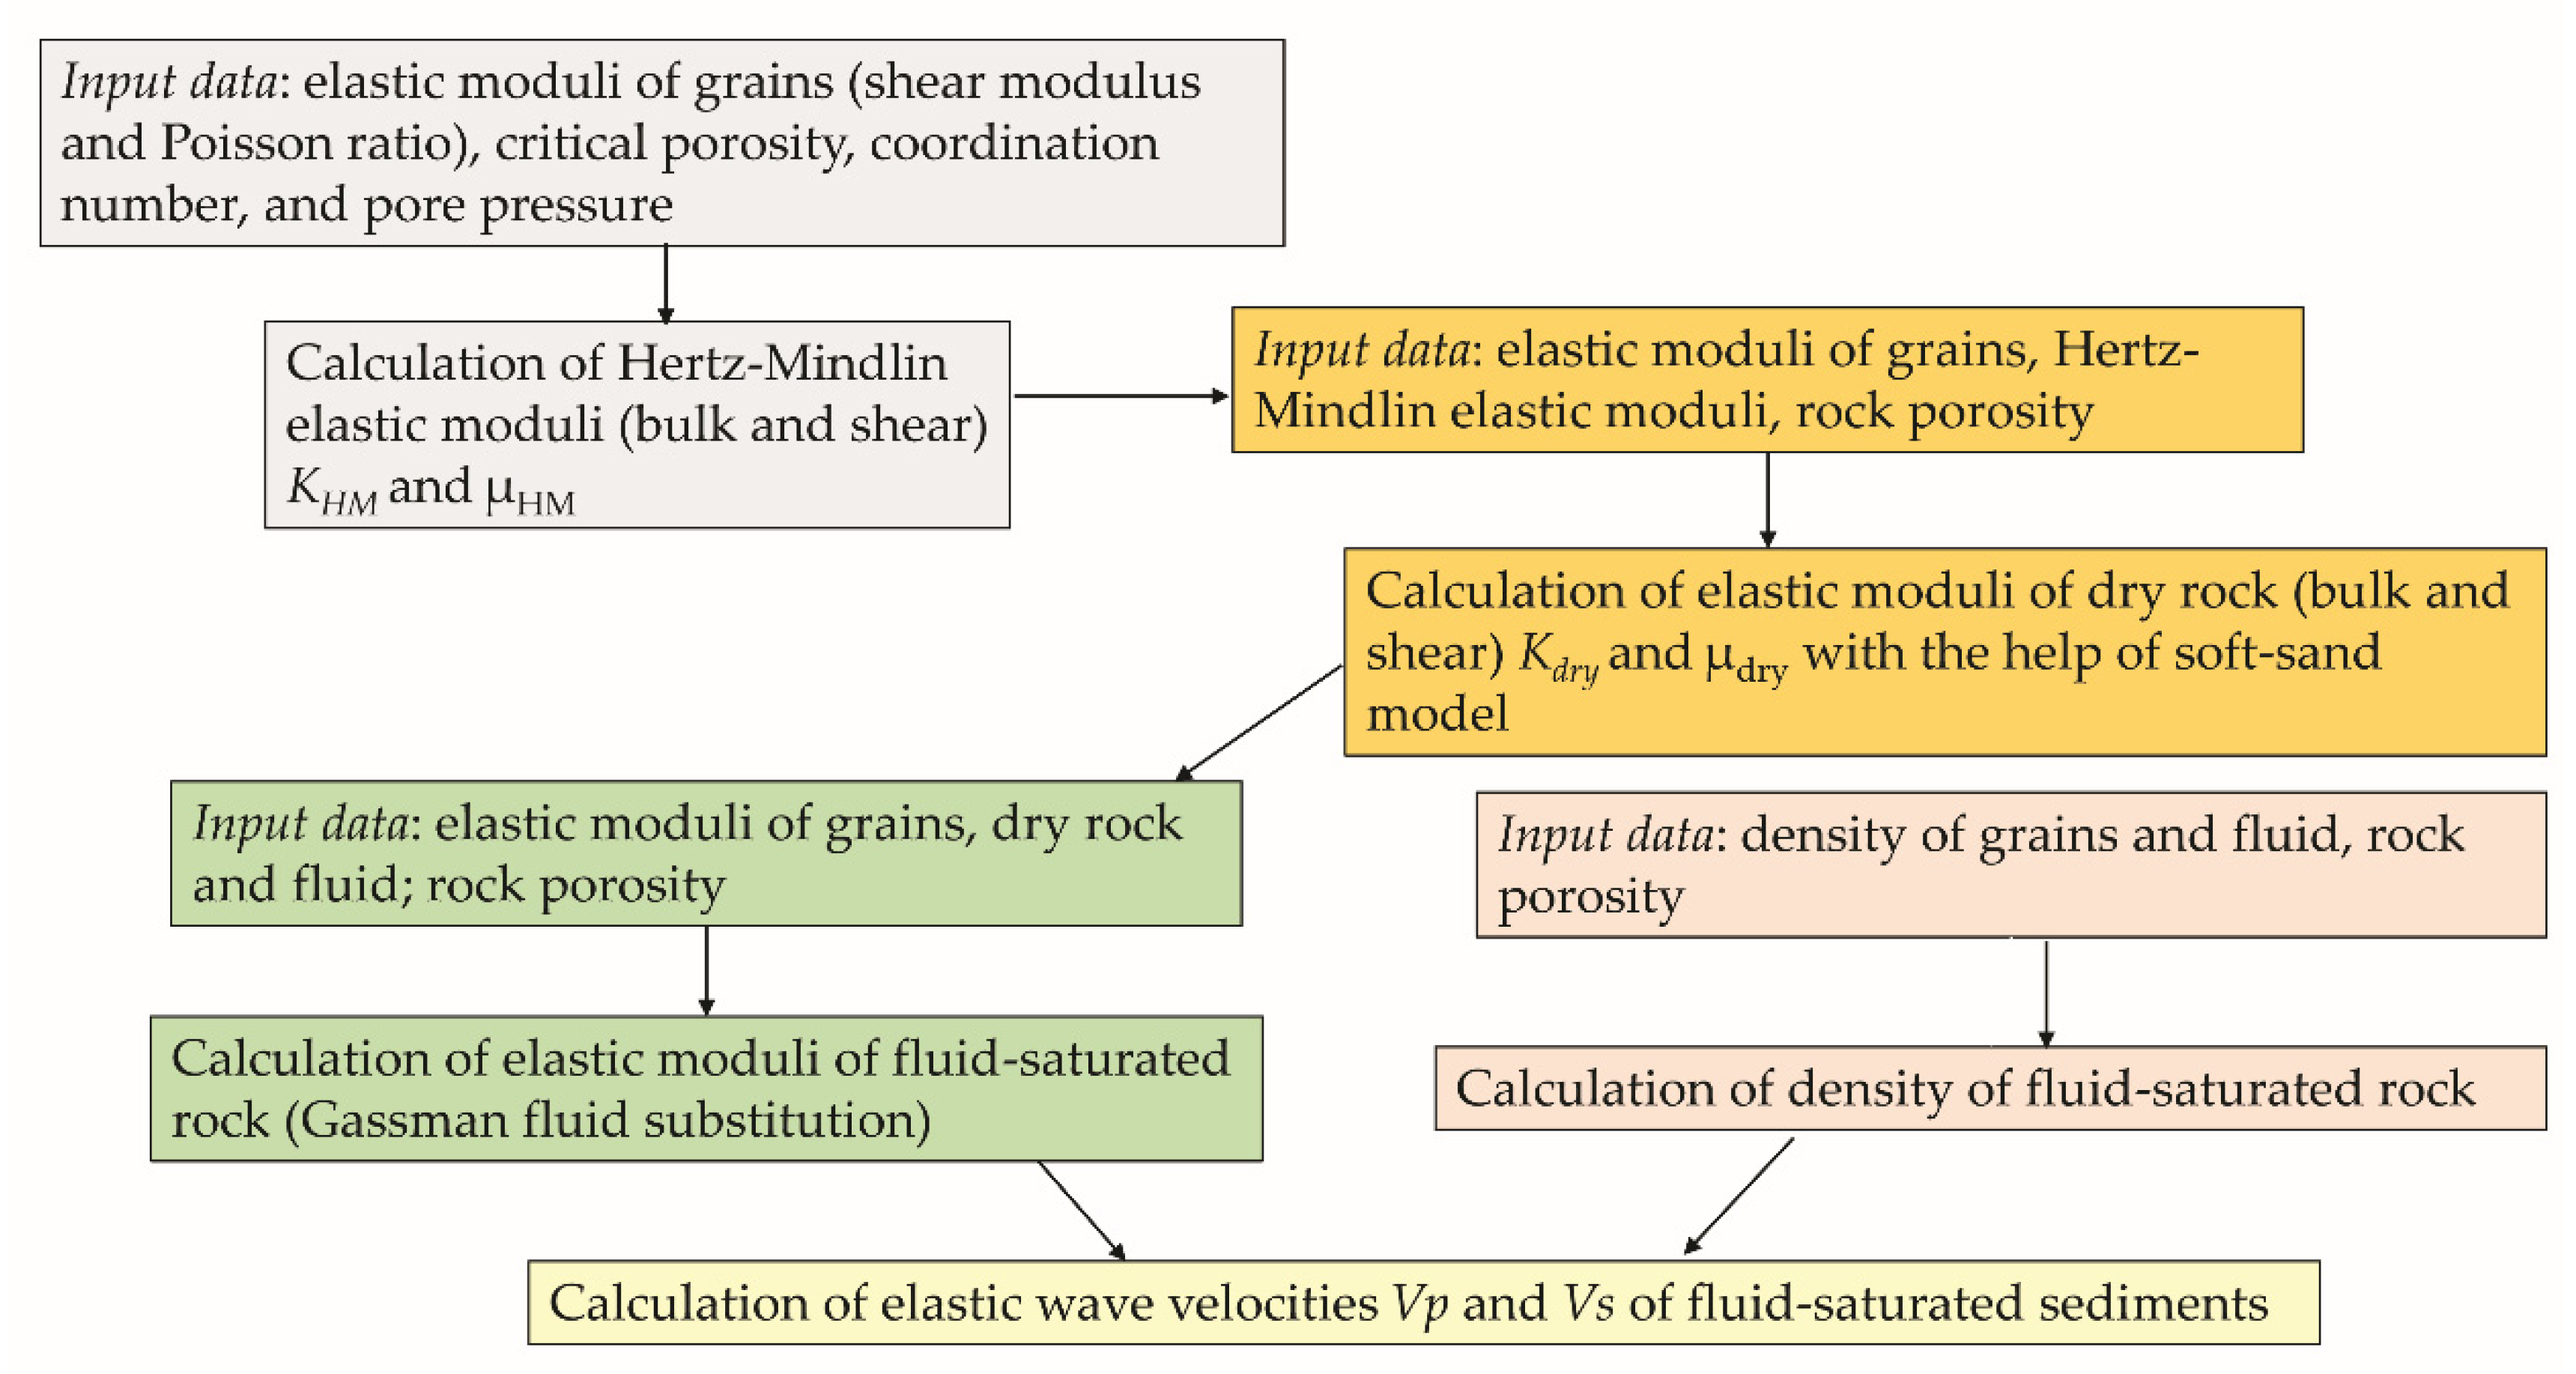
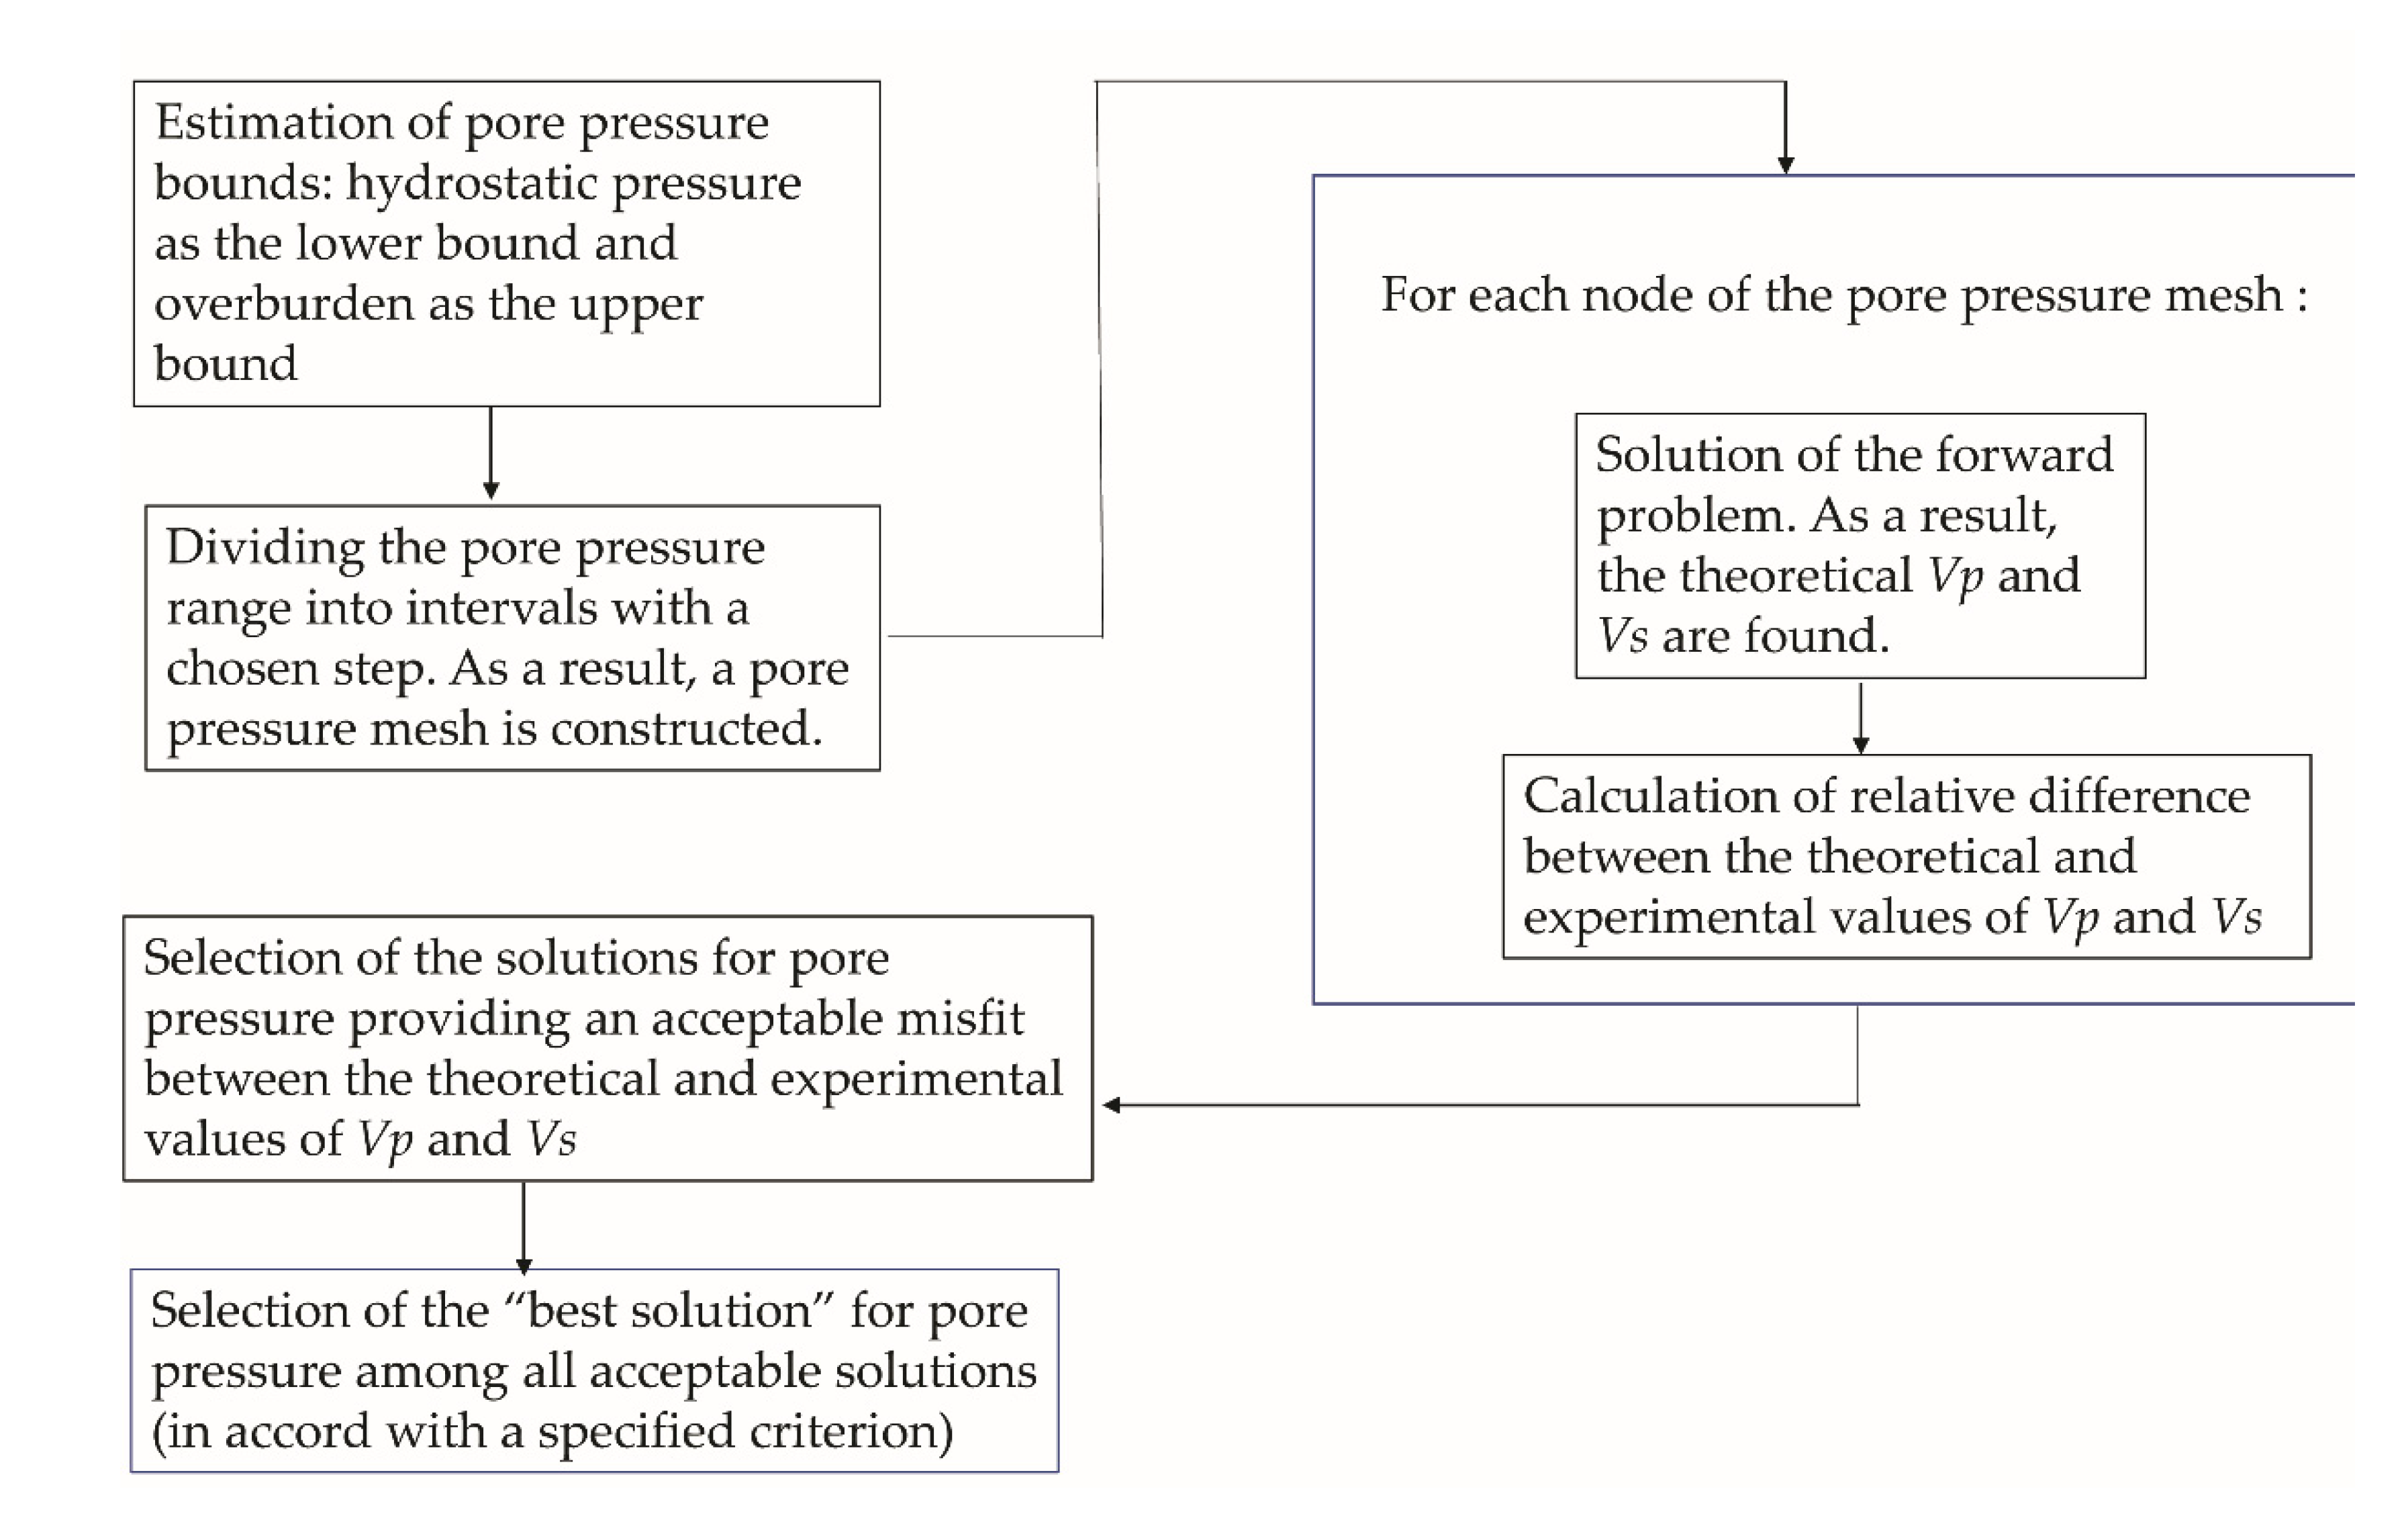
3.2. Pore Pressure Prediction from Rock-Physics Modeling

To estimate the pore pressure along the project well from the elastic wave velocities and density provided by the seismic inversion, we applied the well-known soft-sand model of Mavko et al. [36] combined with the Gassmann fluid substitution [54]. We used this scheme since as was already noted in Introduction, the soft-sand model based on the Hertz–Mindlin approach makes it possible to incorporate the pore pressure effect on the elastic moduli in explicit form. In turn, this gives an opportunity to invert the pore pressure from the elastic wave velocities and density of marine sediments. Note that we also analyzed the stiff-sand model but came to the conclusion that this model gives greatly overestimated velocities. The soft-sand model assumes that the rock is composed of isotropic particles of a solid material and a granular medium surrounding the particles. The granular medium is a dense pack of the spherical grains of the solid material and the grains have the same size. The porosity of the granular medium (so-called “critical porosity”) is larger than the rock porosity. The formulas of the soft-sand model for effective elastic moduli of dry rock are as follows:
K d r y * = [ φ ˜ M ( K H M ,   μ H M ) + 1 φ ˜ M ( K ,   μ H M ) ] 1 4 3 μ H M , μ d r y * = [ φ ˜ μ H M + μ H M 6 R ( K H M ,   μ H M ) + 1 φ ˜ μ + μ H M 6 R ( K H M ,   μ H M ) ] 1 μ H M 6 R ( K H M ,   μ H M ) ,
where
φ ˜ φ φ 0 ,   M ( K ,   μ ) K + 4 3 μ ,     R ( K ,   μ ) 9 K + 8 μ K + 2 μ
In Equations (8) and (9), K d r y * and µ d r y * are the effective bulk and shear moduli of the dry rock; φ is the porosity, φ0 is the critical porosity, K and µ are the bulk and shear moduli of the grain material, KHM and µHM are the bulk and shear moduli of the dry granular medium calculated with the help of the Hertz–Mindlin (HM) method. According to the HM method, these moduli are calculated by the formulas:
K H M = [ D ( P ) 18 ] 1 / 3 ,   μ H M = 5 4 ν 5 ( 2 ν ) [ 3 2 D ( P ) ] 1 / 3 ,   D ( P ) P [ C ˜ ( 1 φ 0 ) μ π ( 1 ν ) ] 2
In Equation (10), P is the effective pressure equal to the difference of the vertical stress and pore pressure; µ and v are the shear modulus and Poisson’s ratio of the grain material; φ0 is the critical porosity; C ˜ is the average number of contacts per grain (so-called coordination number). Definitely, φ0φ. If φ0 = φ, then the soft-sand model is reduced to the Hertz–Mindlin model.
After the effective bulk and shear moduli for dry rock are calculated, the Gassmann fluid substitution is applied and the resulting effective moduli of marine sediments saturated with sea water are found:
K s a t * = A K 0 1 + A ,     A K d r y * K 0 K d r y * + K f l φ ( K 0 K f l ) , μ s a t * = μ d r y *
where K s a t * and µ s a t * are the effective bulk and shear moduli of saturated rock, K0 and Kfl are the bulk moduli of the grain material and fluid. After the effective moduli of the saturated rock are found, the elastic wave velocities Vp and Vs are calculated by the formulas:
V P = K s a t * + 4 / 3 μ s a t * ρ * ,   V S = μ s a t * ρ *
where ρ* is the rock density. The rock density is calculated by the exact formula
ρ * = ( 1 φ ) ρ + φ ρ f l
where ρ is the density of grain material and ρfl is the density of fluid.
The coordination number C ˜ takes values from 5 to 9 [36]. However, when fitting the theoretical and experimental velocities, larger values can be used (for example, 15).
A workflow for calculating the effective elastic moduli (forward problem) according to the described rock-physics model is as follows. First, the input data on the elastic moduli of grains, critical porosity, coordination number, and pore pressure are used to calculate the HM moduli by Formula (10). Then, these moduli together with the elastic moduli of grains and rock porosity are used to estimate the dry moduli of sediments (Formulas (8) and (9) are used). Finally, the effective elastic moduli of fluid-saturated sediments are calculated with help of the Gassmann Formula (11). These moduli together with the rock density are used to calculate the elastic wave velocities Vp and Vs in the marine sediments. A block-scheme of the forward problem solution is given in Appendix A (Figure A2).
Formulas (8)–(10) contain the following unknown parameters: the coordination number, critical porosity, and pore pressure. Moreover, the elastic moduli of solid grains are rather uncertain since commonly in marine sediments, such as those in this study, this is a mixture of mud and clay with additions of carbonate material at some depth intervals [18]. As follows from the literature, the clay elastic moduli and density may vary in a considerably wide range [55]. A sensitivity study of the above formulas to the elastic moduli of grain material shows that the bulk modulus of the grain material changing from 20 to 80 GPa forces to vary the P-wave velocity only within 150 m/s, keeping Vs almost constant. The shear modulus changing from 7 to 35 GPa causes variations in Vp and Vs around 100 and 200 m/s, respectively. Note that the chosen interval for the moduli variation corresponds to the possible values of clay and carbonate minerals reported in the literature.
Since the grain density is rather high (averaging 2.71 g/cm3), we also chose rather high values of the grain material for the rock-physics modeling: the bulk and shear moduli equal to 52 GPa and 32 GPa, respectively. These moduli are close to the Voight–Reuss–Hill average of the stiffness matrices of illite, chlorite, and kaolinite addressed in the work of Katahara [56]. The corresponding density of these clay minerals are 2.79, 2.69, and 2.59 g/cm3 which, on average, gives the value close to the measured density of the grain material.
A variation in the coordination number C ˜ from 5 to 12 increases both Vp and Vs by 100 m/s for the critical porosity φ0 = 0.76. The respective increase in the velocities is 50 m/s for Vp and 150 m/s for Vs at the critical porosity φ0 = 0.5.
In order to estimate the pore pressure along the project well, all the model parameters should be chosen such that the discrepancy between the theoretical and experimental velocities does not exceed a specified level. We specified this level as 20% difference for P-wave velocities and 100% for S-wave velocities. The latter value is too large due to high uncertainty in velocities of S-waves. This is not a very large difference in the absolute values of S-wave velocities of marine sediments. Thus, if the experimental velocity is 200 m/s, the theoretical value can reach 600 m/s. In this case, the absolute value of difference in these velocities is only 400 m/s. Moreover, the Vs values for unconsolidated rocks are often reported as varying up to 600 m/s.
To solve the inverse problem on pore pressure estimation for each depth along the project well, we fixed different combinations of C ˜ and φ0. Then, for every combination, we found a set of pore pressure values satisfying the above conditions. To do this, we applied the n-dimensional mesh method. This method assumes that the range of possible values of every unknown parameter is divided into intervals. The forward problem on the determination of P- and S-wave velocities was solved for each node. Then, “good” solutions, i.e., the solutions satisfying the accepted misfit between experimental and theoretical velocities were collected. Among the “good” solutions, the most probable solution was chosen. The most probable solution is the solution having the minimum value of “misfit measure”.
In our case, n = 1 since we had only one unknown parameter—the pore pressure. The range of pore pressure variation is from the hydrostatic to overburden pressure SV. The “misfit measure” was chosen to be the relative difference between the theoretical and experimental P-wave velocity. A workflow for the inverse problem solution on the pore pressure estimation is shown in Appendix A (Figure A3).
Note that different combinations of C ˜ and φ0 show different solutions for the behavior of pore pressure along the project well. Among all combinations of these two parameters, we chose the combination providing the “reference” pore pressure 1.2 MPa at the depth 20 mbsf. These values are C ˜ = 12 and φ0 = 0.76. Note that without the knowledge of a “reference” value, the solution for pore pressure is rather uncertain and may exhibit different values between the hydrostatic pressure and overburden stress. This fact should be taken into account when inverting the pore pressure with the use of similar approaches.
A comparison of experimental and theoretical velocities and Poisson’s ratio obtained as the most probable solution is shown in Figure 6. As seen, the S-wave velocities are greater than experimental ones and may attain 600 m/s in the depth range 22–52 mbsf. At the same time, the rock-physics model provides, generally, underestimated P-wave velocity (within 20%). In the upper part of the depth interval down to 8 mbsf, the experimental and theoretical velocities are very close to one another. The Poisson ratio provided by the rock-physics modeling varies from 0.43 to 0.49 that is lower than the experimental values but higher than those obtained in the Liquidity index test for the respective layers (called engineering geologic elements) (Table 1). As seen, the difference between the Poisson ratio obtained with different methods is large. The difference between the Poisson ratio calculated from the theoretical and experimental velocities (dynamic Poisson’s ratio) is explained by the fact that the Poisson ratio is controlled by the squared ratio Vp/Vs: υ = 0.5 [ ( V P / V S ) 2 2 ] / [ ( V P / V S ) 2 1 ] . The difference between theoretical and experimental shear wave velocities my attain 400 m/s. However, the shear wave velocities have rather small values. This leads to the sufficiently large difference in the squared Vp/Vs ratio (4–10 times).
The difference in the experimental dynamic Poisson ratio and its laboratory analog provided by the Liquidity index test is due to the fact that these values are determined from different types of action on the rock. When considering the dynamic Poisson ratio, this is a short-time action of low amplitude (excitation of elastic waves). The Poisson ratio provided by the Liquidity index test is based on the measurements of the water content in the clayey sample. The water content is compared with the so-called liquid and plastic limits. The liquid limit is specified as a water content at which the plastic body starts to behave as a liquid. The opposite limit—the plastic limit is a water content that allows the clayey sample to exhibit plasticity (the rock becomes less brittle). Note that the Poisson ratio provided by the Liquidity index test was used for estimating the shear wave velocity in our study. The discrepancy in the Poisson ratio determined by these two different experimental methods suggests rather high uncertainty in shear wave velocity estimation for the studied unconsolidated rocks.
Among the solutions of the inverse problem, a solution exists that provides a good correspondence between both P- and S-wave velocities. However, this solution produces a pore pressure almost equal to the overburden stress within the whole depth interval under study. This situation seems to be unrealistic.
Note that according to the sensitivity study of the rock-physics model, S-wave velocities are more sensitive to the pore pressure compared to P-waves. This fact draws attention to the problem of increasing the reliability of the S-wave velocity determination.

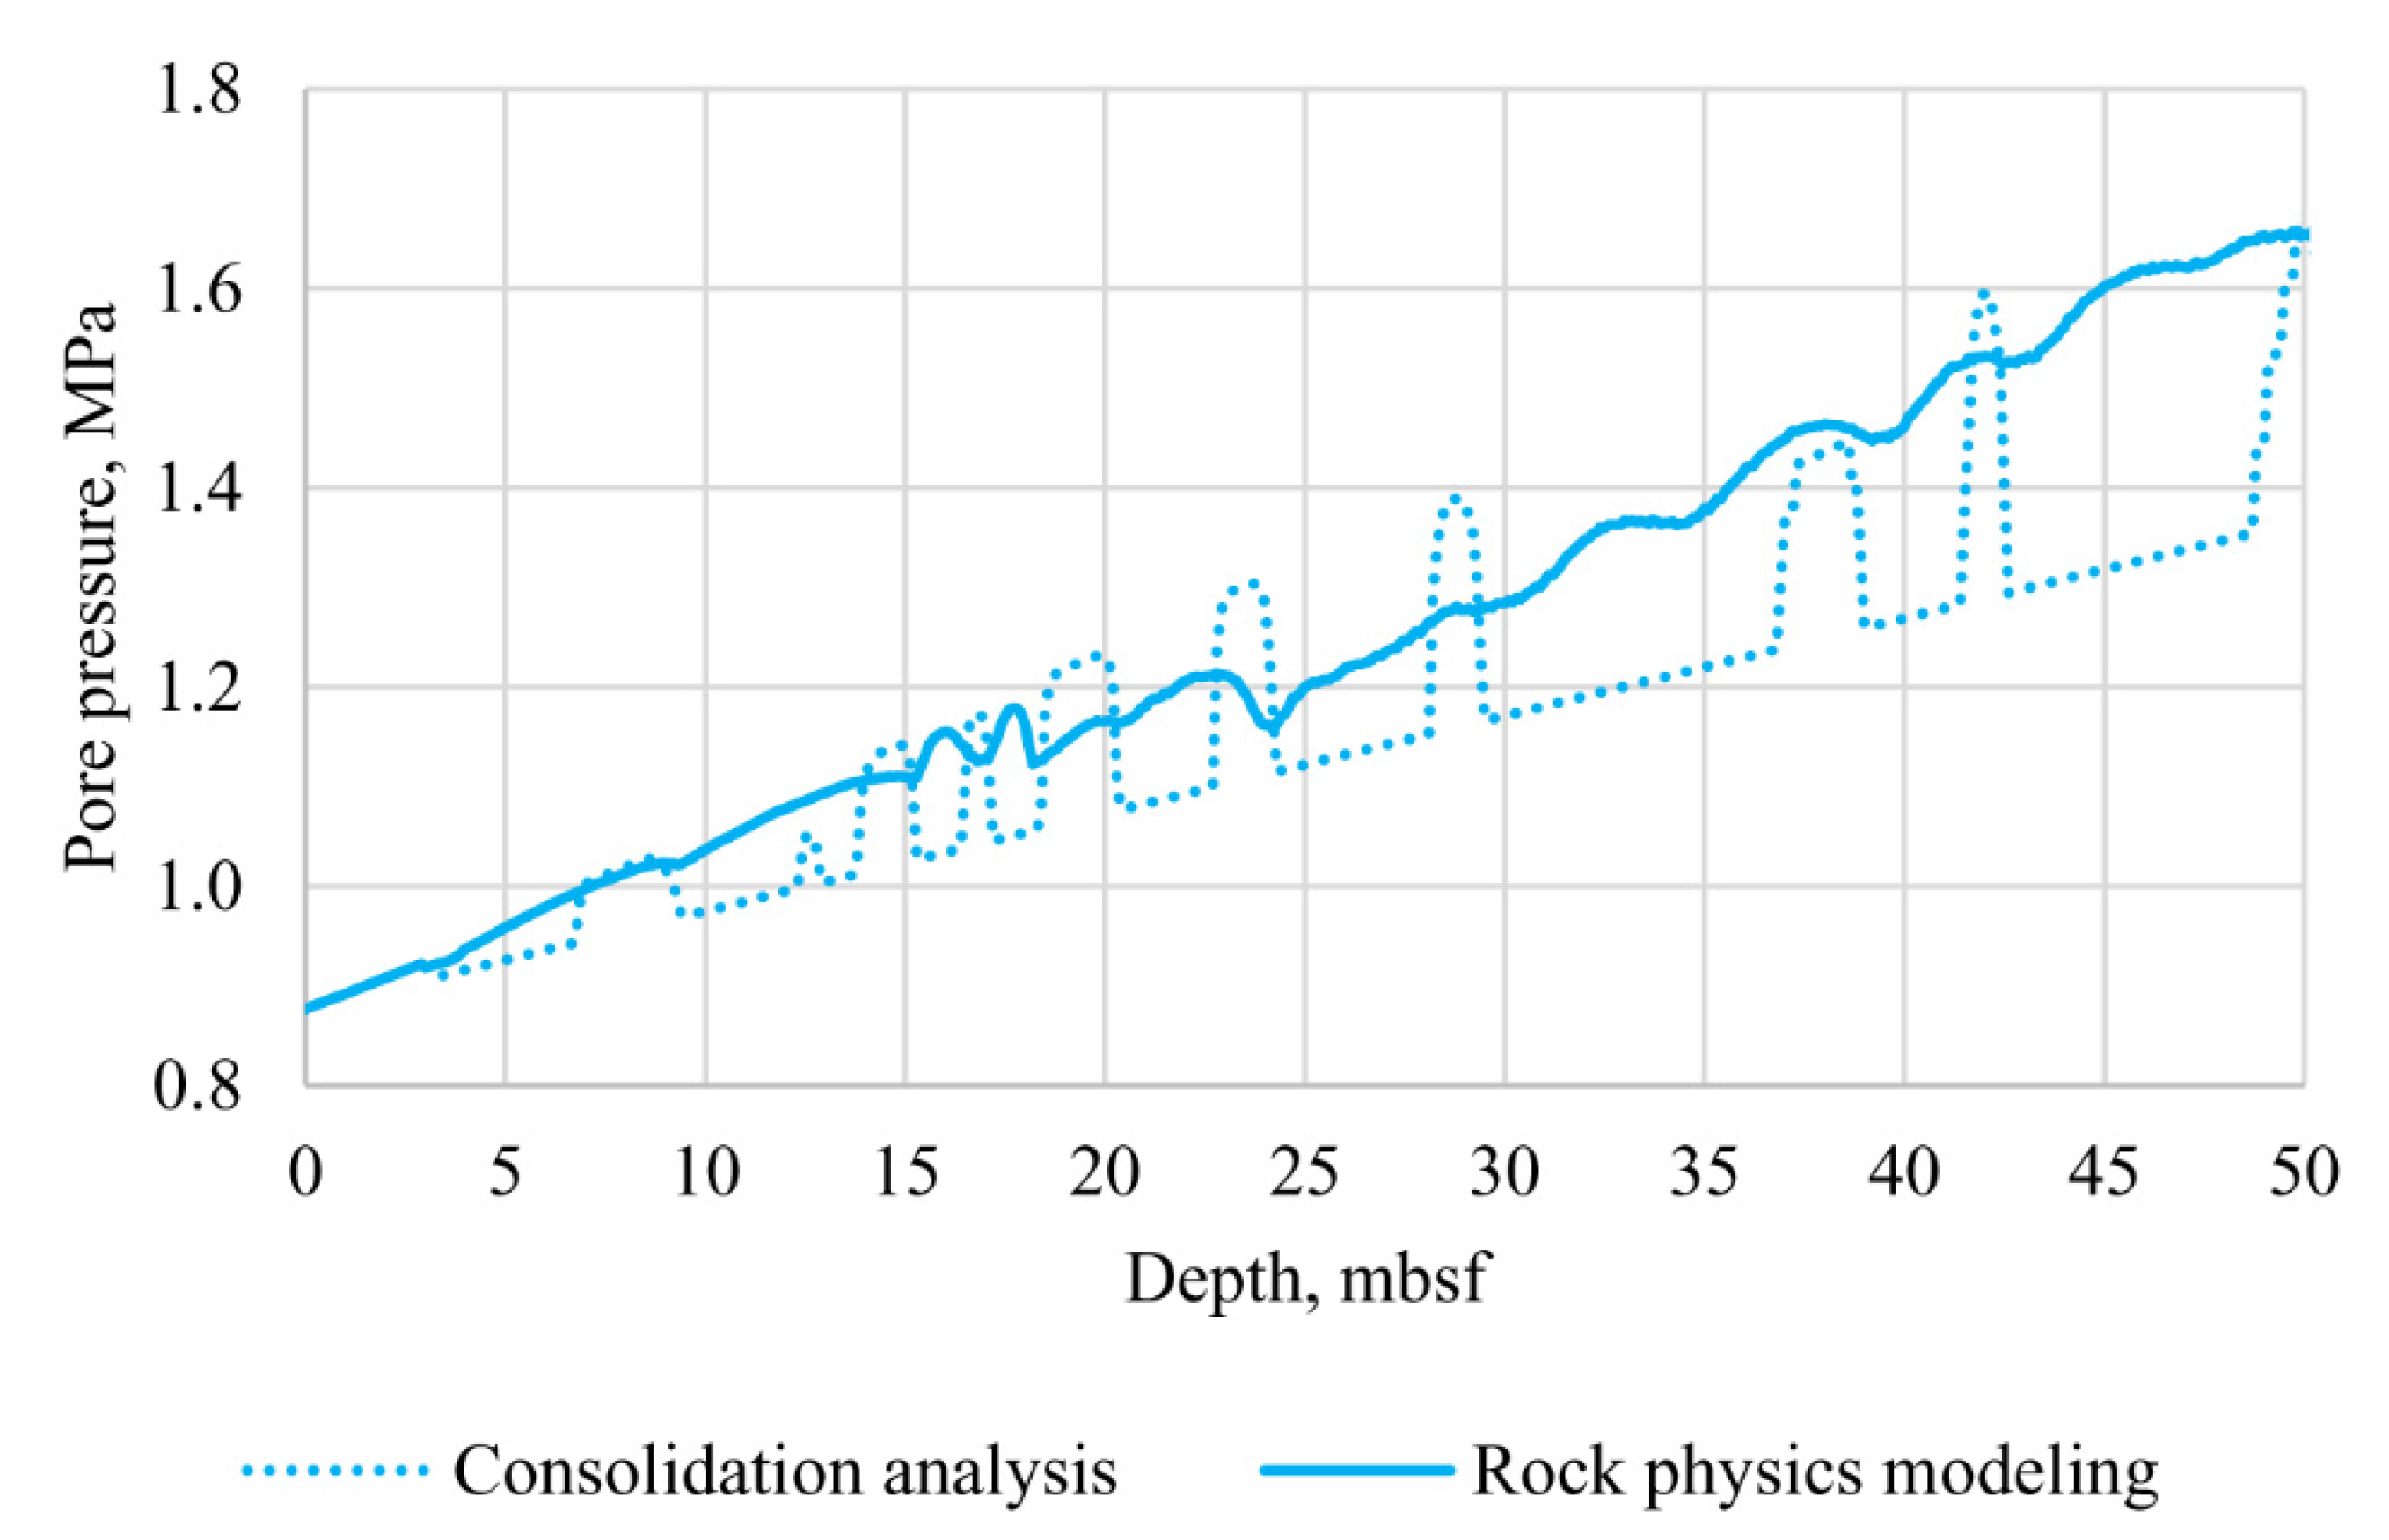
3.3. Pore pressure Prediction Comparison

The previous two sections covered the methods used for pore pressure prediction based on consolidation analysis and rock-physics modeling. Comparison of the obtained results appears to be a logical way to summarize the drawbacks and advantages of these methods.
Figure 7 represents the comparison between the predicted pore pressure profiles obtained from the two methods. The dotted line represents the pore pressure predicted from consolidation analysis – from Equation (6), while the solid line represents the best solution of the inverse problem postulated in the previous section devoted to rock-physics modeling. It should be noted that Equation (6) was used solely in cases when it provided estimations of pore pressure exceeding the hydrostatic pressure, so the hydrostatic pressure can be visualized as the lower boundary of the dotted line with a corresponding slope.
Several conclusions can be drawn from analyzing Figure 7. The first and the most general result is that both solutions are in qualitative agreement with each other. They clearly coincide at the depth of 20 mbsf, where the pore pressure should be equal to 1.2 MPa. Nevertheless, one specific difference is clear: the rock-physics modeling provides considerably smoother results. While the dotted line is close to the hydrostatic pressure trend almost in the whole interval with a number of secluded overpressure zones (7~10, 14~15, 16~17, 18~20, 28~30, 36~39, and 42~43 mbsf), the rock-physics modeling provides a more linear trend with a slope of approximately 0.8 MPa per 50 m, which is 16 kPa/m—recall that the hydrostatic pressure gradient is as low as 10 kPa/m, meaning that the whole zone should be considerably overpressured. At the same time, the local maxima of pore pressure from consolidation analysis exceed the estimations based on the rock-physics modeling results. It is also worth mentioning that local variations of the pore pressure tend to be present in both profiles, so the overpressured zones still exist even at the smoother profile obtained from rock-physics modeling.
Nevertheless, the deviation between pore pressure profiles evaluated using two different approaches remains clear and deserves additional discussion. As preconsolidation analysis is relatively straightforward compared to the rock-physics approach, its variations remain at the same level as the variations of porosity—this can be clearly seen from Equations (4)–(7). At the same time, rock-physics modeling suggests a solution of an inverse problem. So, while a minimization problem is solved for smoother data on seismic velocities, one could expect a smoother result compared to preconsolidation analysis. Given that the solution shown in Figure 7 as rock-physics modeling result is in fact only the best solution of the inverse problem, it is shown here as a profile obtained from rock-physics modeling. There are still lesser probable solutions that cannot be as smooth as shown in Figure 7; so, the apparent effect of this solution being close to the averaging of the consolidation analysis may be explained by this particular “best solution” choice. In general, the results shown in Figure 7 suggest that the two methods agree with each other, but the consolidation analysis tends to highlight the overpressured zones, with possible overestimation of the pore pressure. At the same time, the rock-physics modeling suggests that the whole depth interval is slightly overpressured. This means that analysis of risks using the rock-physics modeling should be completed from the perspective of integral analysis of the site.
A worrying result is associated with depth intervals where the rock-physics analysis highlights the local maxima of pore pressure, which are not correlated with variations of the profile obtained from consolidation analysis (intervals 31~34 and 44~47 mbsf). The origin of these zones remains unknown, so only direct observations of drilling will make it possible to assure whether these variations are related to real overpressure zones.
Nevertheless, the pore pressure profiles themselves cannot be considered as an engineering result directly associated with the drilling risks. Gas leaks and blowouts are most likely to occur in the overpressure zones, but their effect can differ a lot—and blowout prevention systems can be used to drill the well at this particular site: in fact, the largest pore pressure gradient in the most overpressure zone is roughly 20 MPa, and this zone is relatively small. Extra calculations with the help of geomechanics can be used to compare the obtained results from the perspective of drilling risks.

4. Discussion

The pore pressure profiles shown in Figure 7 can be used to deal with the drilling risks. A model of mechanical properties described in the corresponding paper consists of static and dynamic elastic moduli alongside with strength properties. It is widely known [48] that these data can be used to evaluate drilling risks: whenever effective stresses in the sediments are high enough to achieve the failure criterion, a number of problems start.
Geomechanical analysis of drilling risks at offshore sites with considerably low depths have some specific points compared to other problems. First of all, one needs both the total stress and pore pressure in order to calculate the effective stress. These data were obtained in the previous sections: the pore pressure was discussed above in detail, while the total effective stress was calculated with the use of Equation (7).
The failure criterion generally deals with all components of the stress tensor, but the considered sediments are characterized by a considerable portion of plastic flow in their total deformation, and very high Poisson’s ratio, leading to the insignificant difference between the principal components of the effective stress tensor.
At the same time, drilling procedures alter the stress state of the sediments. In the current case, we considered a pessimistic scenario when drilling procedures alter only the vertical stress (σV turns into σV + Δσ, where Δσ is an extra stress caused by the drilling operation, the weight of the drilling rig can be a simple source of this extra load), with the horizontal stress σH remaining untouched. The Mohr–Coulomb failure criterion (1) can be rearranged for this case of triaxial loading to the following form:
σ V + Δ σ σ H 2 sin 2 θ = C + ( σ V + Δ σ + σ H 2 + σ V + Δ σ σ H 2 cos 2 θ ) μ ,
where 2θ = π/2 + arctan(µ). This is true for a stress state leading to failure and consequent plastic flow of the seafloor sediments due to the extra load Δσ. So, the critical value can be found for the extra load Δσ as:
Δ σ = ( σ H + C c t g φ ) 2 sin φ i 1 sin φ i ( σ V σ H ) ,
where φi is the internal friction angle (its tangent is equal to the internal friction coefficient). The horizontal stress can be estimated as:
σH = vσV/(1 − v),
where v is the Poisson ratio. Note that effective stresses are used in this equation.
Equation (15) was used to evaluate the critical extra vertical stress Δσ necessary to exceed the bearing load of the sediments using the two pore pressure profiles discussed in the previous section. The following figures (Figure 8 and Figure 9) represent the final results associated with drilling risks. Note that due to Poisson’s ratio used in Equation (16) being close to 0.5, the effective vertical and horizontal stresses tend to be very close to each other, so the corresponding profiles in Figure 8 and Figure 9 almost completely overlap.
Critical extra load is a useful parameter to analyze bearing strength of the sediments. It is in fact the maximum extra vertical stress (addition to the existing vertical stress shown in the upper part of the figure) that can be applied to the sediments without failure—or cataclastic flow for the unconsolidated sediments. Both the pore pressure and strength of the sediments affect it, so one can consider it as a combination of different factors leading to potential drilling risks. The red curves in Figure 8 and Figure 9 should be used to optimize the weight of the drilling rig and its working conditions to maintain safe exploitation.
The smoothing of the pore pressure estimated from the rock-physics modeling discussed in the previous section finds itself at the critical load estimation as well. In general, the pore pressure estimation from the consolidation analysis is related to a more variable critical extra load for the sediments, and it is in most places higher than the critical load corresponding to the rock-physics modeling. It is worth mentioning that the changes in sediment strength parameters (primarily in cohesion) are highlighted in these figures as well, due to their presence in Equation (15). As it was already mentioned, the horizontal stress remains very close to vertical stress in the whole interval.
These results highlight the general tendency mentioned above: the rock-physics modeling seems to be a proper tool to predict overpressure and deal with its degree, while the consolidation analysis appears to be a tool aimed at overpressure zone localization, and the degree of evaluated overpressure remains questionable.
The critical extra load itself is an important result for drilling risks assessment. First, the magnitude of this extra stress is not extremely high, so that usage of a special blowout prevention system can mitigate these drilling risks. These values of stresses are relatively low, so the special redistribution of the stress state due to drilling procedures can be used to reduce drilling risks: in this particular case, a change in the drill bit diameter was altered to redistribute stresses in vicinity of the drilled well.
The drilling rig itself is an important source of extra load—and it does not have to be vertical. In fact, numerical modeling can be performed to analyze the stress state of the sediments surrounding the drilling rig legs taking into account the predicted overpressure zones, static elastic moduli, and parameters of plastic flow, which can be obtained from triaxial loading test data [57]. A detailed numerical modeling of the stress state of the sediments surrounding drilling rig legs and drill bit can provide the explicit conditions leading to a gas leak, drilling rig loss of stability, failure of weak layers, etc. This analysis suggests usage of detailed data on mechanical properties of the sediments, but can provide way more than engineering solutions based on correlations that can be unreliable for a specific site. While a detailed numerical analysis of these processes of drilled seafloor sediments is not within the scope of the current research work, the results discussed above can provide insight on the degree of reliability of numerical modeling results and discrepancy of the input data needed for it.
Detailed analysis of the sediments relatively close to the seafloor provides important insights on the lower sediments as well. Availability of seismic data inversion results for deeper layers can be used in a similar way to predict and localize overpressure zones using the discussed methods. Nevertheless, the models used for the pore pressure prediction discussed here have certain limits for application: they only provide reliable results in weak unconsolidated seafloor sediments. Other methods mentioned in the introductory section are generally used for unconsolidated rocks—search for the smooth transition from one type of prediction to another appears to be an intriguing direction of further research of this type of problems.
Another direction is associated with evolution of overpressure zones: there is an opportunity to carry out seismic surveys at the same site, but at different moments of time. Preliminary results obtained for this site suggest that some of the overpressure zones localized in the current study remain at their places, but some disappear and reappear. This rises a specific question: does drilling risk prediction remain reliable during all periods between seismic surveys and drilling procedures? Depending on the answer to this question, several ways can be suggested to drill as fast as possible after seismic surveys, or to carry out an external seismic survey at the site if preliminary seismic data prove that the potential risks can be handled.
Our study also draws attention to the problem of reliability of S-wave velocity determination for marine sediments. According to results of the rock-physics modeling, these velocities demonstrate high sensitivity to the pore pressure in this type of rocks. If the accuracy of the S-wave velocities is poor, reference values of the pore pressure are required to decrease uncertainty in the pre-pressure prediction based on the rock-physics modeling.

5. Conclusions

Pore pressure prediction remains an important practical problem, as overpressure zones can cause problems during exploitation and development of offshore hydrocarbon and gas hydrate reservoirs. While empirical methods have been developed a lot during the last decades, their application is usually limited to certain sites. To modify the existing correlations for overpressure zone localization for specific sites, one has to use external data, which can be obtained during drilling or special surveys. On the other hand, rock-physics modeling makes it possible to estimate pore pressure using a general workflow, independent of the particular site. There is still need to utilize a great amount of data—and requirements on the data quality are relatively strict. The comparison of pore pressure prediction based on these two groups of approaches remains of high practical and scientific interest.
In the current paper, we have applied these two groups of methods for a specific site at the Black Sea shelf. Pore pressure has been evaluated along the trajectory of a well to be drilled at the zone of potential hydrocarbon accumulation using two methods: preconsolidation analysis of seafloor sediments and soft-sand model with Gassmann fluid substitution. High-quality seismic data were used for this estimation alongside with indirect local measurement of pore pressure. Only the upper layers of seafloor sediments have been analyzed: the greatest depth of 50 mbsf was studied.
The results of pore pressure estimation using these two methods proved to be in qualitative agreement with each other: the same overpressure zones were proven to be in the corresponding intervals of depth. Nevertheless, rock-physics modeling provided a smoother result: it appears that preconsolidation analysis is more suitable for finding localized highly overpressure zones, while rock-physics modeling gives a better idea on total risks for the whole interval of consideration. Regardless, both methods provided the results of pore pressure evaluation to conclude that expected overpressure zones are not associated with high risks in the studied area; so, a typical blowout prevention system can deal with them.
Depending on the available data, one can still have freedom in choosing the proper empirical model of pore pressure prediction at any other site. The question of finding the optimal model remains open. Rock-physics modeling is capable of giving a hint to answer that question—but there are still different models even within the rock-physics workflow. While only a limited number of parameters within one of these models was altered during pore pressure prediction described in the current paper, there are still other parameters to be analyzed. We assume that a continuation of this study, including variation of a number of rock-physics model parameters during inverse problem solution and application of different empirical methods of pore pressure estimation, can decrease the overpressure-associated risks and geohazards.

Author Contributions

Conceptualization, A.H., A.P., I.B., K.M. and N.D.; methodology, A.H., A.P., I.B., K.M. and N.D.; software, A.P., I.B. and P.S.; validation, K.M., N.D. and A.H.; investigation A.H., A.P., I.B., K.M. and N.D.; writing A.H., A.P., I.B., K.M. and N.D.; visualization A.H., A.P., I.B., K.M., N.D. and P.S.; supervision A.H. and K.M. All authors have read and agreed to the published version of the manuscript.

Funding

Methodological aspects of the research were funded by Russian Science Foundation, grant number 19-77-10062.

Institutional Review Board Statement

Not applicable.

Informed Consent Statement

Not applicable.

Data Availability Statement

Data on simulated porosity, overburden stress, hydrostatic pressure and results of rock physics modeling including the pore pressure and other model parameters are available at https://cloud.mail.ru/public/hYeT/hy4ywu1oK (accessed on 14 July 2022).

Acknowledgments

The authors are grateful to editor and anonymous reviewers who provided the valuable comments that led to considerable increase in quality of the paper.

Conflicts of Interest

The authors declare no conflict of interest. The funders had no role in the design of the study; in the collection, analyses, or interpretation of data; in the writing of the manuscript; or in the decision to publish the results.

Appendix A

A flowchart for the preconsolidation analysis—determination of the pore pressure from porosity is shown in Figure A1.
Figure A1. Flowchart for the determination of pore pressure through consolidation analysis.
Jmse 10 01127 g0a1
A flowchart for the forward problem solution—determination of elastic wave velocities from the model parameters—is shown in Figure A2.
Figure A2. Flowchart for the determination of elastic wave velocities from the model parameters.
Jmse 10 01127 g0a2
A flowchart for the inverse problem—determination of the pore pressure from seismic data is shown in Figure A3.
Figure A3. Flowchart for the determination of the pore pressure from seismic data.
Jmse 10 01127 g0a3

References

  1. Zhang, J. Effective stress, porosity, velocity and abnormal pore pressure prediction accounting for compaction disequilibrium and unloading. Mar. Pet. Geol. 2013, 45, 2–11. [Google Scholar] [CrossRef]
  2. Holand, P.; Skalle, P. Deepwater Kicksand and BOP Performance; SINTEF Report for U.S.; Minerals Management Service: Washington, DC, USA, 2001; 123p. [Google Scholar]
  3. Skalle, P.; Podio, A.L. Trends extracted from 1200 Gulf Coast blowouts during 1960–1996. World Oil 1998, 219, 67–72. [Google Scholar]
  4. Tobin, H.J.; Saffer, D.M. Elevated fluid pressure and extreme mechanical weakness of a plate boundary thrust, Nankai Trough subduction zone. Geology 2009, 37, 679–682. [Google Scholar] [CrossRef]
  5. Tingay, M.R.P.; Hillis, R.R.; Swarbrick, R.E.; Morley, C.K.; Damit, A.R. Origin of overpressure and pore-pressure prediction in the Baram province, Brunei. AAPG Bull. 2009, 93, 51–74. [Google Scholar] [CrossRef]
  6. Yin, Z.; Linga, P. Methane hydrates: A future clean energy source. Chin. J. Chem. Eng. 2019, 27, 2026–2036. [Google Scholar] [CrossRef]
  7. Bhatnagar, G.; Chapman, W.G.; Hirasaki, G.J.; Dickens, G.R.; Dugan, B. Effect of Overpressure on Gas Hydrate Distribution. In Proceedings of the 6th International Conference on Gas Hydrates (ICGH 2008), Vancouver, BC, Canada, 6–10 July 2008. [Google Scholar]
  8. Ren, J.; Liu, X.; Niu, M.; Yin, Z. Effect of sodium montmorillonite clay on the kinetics of CH4 hydrate-implication for energy recovery. Chem. Eng. J. 2022, 437, 135368. [Google Scholar] [CrossRef]
  9. York, P.; Prithard, D.; Dodson, J.K.; Dodson, T.; Rosenberg, S.; Gala, D.; Utama, B. Eliminating Non-productive Time Associated Drilling Trouble Zone. In Proceedings of the Offshore Technology Conference, Houston, TX, USA, 4–7 May 2009. [Google Scholar] [CrossRef]
  10. Holand, P.; Awan, H. Reliability of Deepwater Subsea BOP Systems and Well Kicks; ExproSoft AS Report no. 201252/02; Exprosoft: Trondheim, Norway, 2012; 164p. [Google Scholar]
  11. Hottmann, C.E.; Johnson, R.K. Estimation of Formation Pressures from Log-Derived Shale Properties. J. Pet. Technol. 1965, 17, 717–722. [Google Scholar] [CrossRef]
  12. Eaton, B.A. The Effect of Overburden Stress on Geopressures Prediction from Well Logs. J. Pet. Technol. 1972, 24, 929–934. [Google Scholar] [CrossRef]
  13. Eaton, B.A. The Equation for Pore Pressure Prediction from Well Logs. In Proceedings of the Fall Meeting of the Society of Petroleum Engineers of AIME, Dallas, TX, USA, 28 September–1 October 1975. [Google Scholar]
  14. Bowers, G.L. Pore Pressure Estimation from Velocity Data; Accounting for Overpressure Mechanisms Besides Undercompaction. SPE Drill. Compl. 1995, 10, 89–95. [Google Scholar] [CrossRef]
  15. Zhang, J. Pore pressure prediction from well logs: Methods, modifications, and new approaches. Earth-Sci. Rev. 2011, 108, 50–63. [Google Scholar] [CrossRef]
  16. Wang, Z.; Wang, R. Pore pressure prediction using geophysical methods in carbonate reservoirs: Current status, challenges and way ahead. J. Nat. Gas Sci. Eng. 2015, 27, 986–993. [Google Scholar] [CrossRef]
  17. Mondol, N.H.; Bjorlykke, K.; Jahren, J.; Hoeg, K. Experimental mechanical compaction of clay mineral aggregates–changes in physical properties of mudstones during burial. Mar. Pet. Geol. 2007, 24, 289–311. [Google Scholar] [CrossRef]
  18. Schneider, J.; Flemings, P.B.; Dugan, B.; Long, H.; Germaine, J.T. Overpressure and consolidation near the seafloor of Brazos-Trinity Basin IV, northwest deepwater Gulf of Mexico. J. Geophys. Res. 2009, 114, B05102. [Google Scholar] [CrossRef]
  19. Long, H.; Flemings, P.B.; Germaine, J.T. Interpreting in situ pressure and hydraulic properties with borehole penetrometers in ocean drilling: DVTPP and Piezoprobe deployments at southern Hydrate Ridge, offshore Oregon. J. Geophys. Res. 2007, 112, B04101. [Google Scholar] [CrossRef]
  20. Sultan, N.; Lafuerza, S. In situ equilibrium pore-water pressures derived from partial piezoprobe dissipation tests in marine sediments. Can. Geotech. J. 2013, 50, 1294–1305. [Google Scholar] [CrossRef]
  21. Radwan, A.E.; Abudeif, A.M.; Attia, M.M.; Mohammed, M.A. Pore and fracture pressure modeling using direct and indirect methods in Badri Field, Gulf of Suez, Egypt. J. Afr. Earth Sci. 2019, 156, 133–143. [Google Scholar] [CrossRef]
  22. Rostami, S.A.; Kinik, K.; Gumus, F.; Kirchhoff, M. Dynamic Calibration of the Empirical Pore Pressure Estimation Methods Using MPD Data. In Proceedings of the Offshore Technology Conference, Houston, TX, USA, 4–7 May 2015. [Google Scholar] [CrossRef]
  23. Ganguli, S.S.; Sen, S. Investigation of present-day in-situ stresses and pore pressure in the south Cambay Basin, western India: Implications for drilling, reservoir development and fault reactivation. Mar. Pet. Geol. 2020, 118, 104422. [Google Scholar] [CrossRef]
  24. Long, H.; Flemings, P.B.; Germaine, J.T.; Saffer, D.M. Consolidation and overpressure near the seafloor in the Ursa Basin, Deepwater Gulf of Mexico. Earth Planet. Sci. Let. 2011, 305, 11–20. [Google Scholar] [CrossRef]
  25. Han, T.; Pervukhina, M.; Clennell, M.B.; Dewhurst, D.N. Model-based pore-pressure prediction in shales: An example from the Gulfof Mexico, North America. Geophysics 2017, 82, M37–M42. [Google Scholar] [CrossRef]
  26. Ziegler, F.E.; Jones, J.F. Predrill pore-pressure prediction and pore pressure and fluid loss monitoring during drilling: A case study for a deepwater subsalt Gulf of Mexico well and discussion on fracture gradient, fluid losses, and wellbore breathing. Interpretation 2014, 2, SB45–SB55. [Google Scholar] [CrossRef]
  27. Zhang, J.; Yin, S. Real-Time Pore Pressure Detection: Indicators and Improved Methods. Geofluids 2017, 2017, 3179617. [Google Scholar] [CrossRef]
  28. Oloruntobi, O.; Adedigba, S.; Khan, F.; Chunduru, R.; Butt, S. Overpressure prediction using the hydro-rotary specific energy concept. J. Nat. Gas Sci. Eng. 2018, 55, 243–253. [Google Scholar] [CrossRef]
  29. Tanikawa, W.; Hirose, T.; Hamada, Y.; Gupta, L.P.; Ahagon, N.; Masaki, Y.; Abe, N.; Wu, H.Y.; Sugihara, T.; Nomura, S.; et al. Porosity, permeability, and grain size of sediment cores from gas-hydrate-bearing sites and their implication for overpressure in shallow argillaceous formations: Results from the national gas hydrate program expedition 02, Krishna-Godavari Basin, India. Mar. Pet. Geol. 2019, 108, 332–347. [Google Scholar] [CrossRef]
  30. Mindlin, R.D. Compliance of elastic bodies in contact. J. Appl. Mech. 1949, 16, 259–268. [Google Scholar] [CrossRef]
  31. Brandt, H. A study of the speed of sound in porous granular media. J. Appl. Mech. 1955, 22, 479–486. [Google Scholar] [CrossRef]
  32. Digby, P.J. The effective elastic moduli of porous granular rocks. J. Appl. Mech. 1981, 48, 803–808. [Google Scholar] [CrossRef]
  33. Walton, K. The effective elastic moduli of a random packing of spheres. J. Mech. Phys. Sol. 1987, 35, 213–226. [Google Scholar] [CrossRef]
  34. Jenkins, J.; Johnson, D.; La Ragione, L.; Makse, H. Fluctuations and the effective moduli of an isotropic, random aggregate of identical, frictionless spheres. J. Mech. Phys. Sol. 2005, 53, 197–225. [Google Scholar] [CrossRef]
  35. Dvorkin, J.; Prasad, M.; Sakai, A.; Lavoie, D. Elasticity of marine sediments. Geophys. Res. Lett. 1999, 26, 1781–1784. [Google Scholar] [CrossRef]
  36. Mavko, G.; Mukerdji, T.; Dvorkin, J. Rock Physics Handbook, 3rd ed.; Cambridge University Press: Cambridge, UK, 2020; pp. 220–308. [Google Scholar]
  37. Hashin, Z.; Shtrikman, S. A variational approach to the elastic behavior of multiphase materials. J. Mech. Phys. Sol. 1963, 11, 127–140. [Google Scholar] [CrossRef]
  38. Polukhtovich, V.M.; Popadok, I.V.; Samarski, A.D.; Khnykin, V.I. Features of the geological structure and prospects for oil and gas potential in the southwestern part of the Indolo-Kuban trough. Geol. Oil Gas 1981, 1, 43–47. [Google Scholar]
  39. Gorshkov, A.S.; Meisner, L.B.; Soloviev, V.V.; Tugolesov, D.A.; Khakhalev, E.M. Album of Structural Maps and Thickness Maps of the Cenozoic Deposits of the Black Sea Depression, m 1:1,500,000; Tugolesov, D. A.M., GUGK pri CM USSR: Moscow, Russia, 1989. [Google Scholar]
  40. Bogaets, A.T.; Bondarchuk, G.K.; Les’kiv, I.V.; Novociletskiy, R.M.; Pavlyuk, M.I.; Paliy, A.M.; Panchenko, D.E.; Samarski, A.D.; Khnykin, V.I.; Chir, N.M.; et al. Geology of the Shelf of the Ukrainian SSR. Oil and Gas Potential; Naukova Dumka: Kyiv, Ukraine, 1986; 152p. [Google Scholar]
  41. Terekhov, A.A.; Shimkus, K.M. Young sediments and thrust structures in the Prikrymskaya and the Caucasian zones of the Black Sea depression. Geotectonics 1989, 1, 72–79. [Google Scholar]
  42. Bagriy, I.D.; Voitsitsky, Z.I.; Maslun, N.V.; Naumenko, U.Z.; Aksem, S.D.; Grieg, M.Y. Integrated geological-structural-thermo-atmo-geochemical studies—A tool for forecasting and searching for hydrocarbons and methane hydrates on the continental slope of the Black Sea. In Geology and Mineral Resources of the World Ocean; National Academy of Sciences of Ukraine: Kyiv, Ukraine, 2014; Volume 4, pp. 24–47. [Google Scholar]
  43. Gozhik, P.F.; Maslun, N.V.; Plotnikova, L.F.; Ivanik, M.M.; Yakushin, L.M.; Ishchenko, I.I. Stratigraphy of the Meso-Cenozoic Clades of the Peninsular-Western Shelf of the Black Sea; Institute of Geological Sciences of the National Academy of Sciences of Ukraine: Kyiv, Ukraine, 2006; 171p. [Google Scholar]
  44. Maslun, N.V.; Ivanik, M.M.; Tsikhotska, N.N.; Klyushina, G.V. Detailed Stratification of Maikop Clade in the Peninsula-Zahodny Shelf of the Black Sea; Biostratigraphic Criteria for the Analysis and Correlations in the Clade of the Phanerozoic of Ukraine; Institute of Geological Sciences of the National Academy of Sciences of Ukraine: Kyiv, Ukraine, 2005; pp. 153–159. [Google Scholar]
  45. Tsytovich, N.A. Soil Mechanics; Gosstroiizdat: Moscow, Russia, 1963; pp. 73–76. (In Russian) [Google Scholar]
  46. Vardy, M.E. Deriving shallow-water sediment properties using post-stack acoustic impedance inversion. Near Surf. Geophys. 2014, 13, 143–154. [Google Scholar] [CrossRef]
  47. Pirogova, A.S.; Tikhotskii, S.A.; Tokarev, M.Y.; Suchkova, A.V. Estimation of Elastic Stress-Related Properties of Bottom Sediments via the Inversion of Very- and Ultra-High-Resolution Seismic Data. Izv. Atmos. Ocean. Phys. 2019, 55, 1755–1765. [Google Scholar] [CrossRef]
  48. Zoback, M.D. Reservoir Geomechanics, 1st ed.; Cambridge University Press: Cambridge, UK, 2007; 490p. [Google Scholar]
  49. Dubinya, N.V.; Vershinin, A.V.; Pirogova, A.S.; Tikhotsky, S.A. Usage of Imitational Geological-Petrophysical Models to Reduce Drilling Risks for Offshore Reservoirs Exploration. In Proceedings of the SPE Russian Petroleum Technology Conference 2020, Moscow, Russia, 26–29 October 2020. [Google Scholar] [CrossRef]
  50. Becker, D.E.; Crooks, J.H.A.; Been, K.; Jefferies, M.G. Work as a criterion for determining in situ and yield stresses in clays. Can. Geotech. J. 1987, 24, 549–564. [Google Scholar] [CrossRef]
  51. Saffer, D.M.; Silver, E.A.; Fisher, A.T.; Tobin, H.; Moran, K. Inferred pore pressures at the Costa Rica subduction zone: Implications for dewatering processes. Earth Planet. Sci. Lett. 2000, 177, 193–207. [Google Scholar] [CrossRef]
  52. Dugan, B.; Germaine, J. Near-seafloor overpressure in the deep-water Mississippi Canyon, northern Gulf of Mexico. Geophys. Res. Lett. 2008, 35, L02304. [Google Scholar] [CrossRef]
  53. Jamiolkowski, M. New Developments in Field and Laboratory Testing of Soils. In Proceedings of the 11th International Conference on Soil Mechanics and Foundation Engineering, San Francisco, CA, USA, 12–16 August 1985. [Google Scholar]
  54. Gassmann, F. Über die Elastizität Poröser Medien; Vierteljahrsschrift der Naturforschenden Gesellschaft in Zurich: Zurich, Switzerland, 1951; Volume 96, pp. 1–23. [Google Scholar]
  55. Bayuk, I.; Ammerman, M.; Chesnokov, E. Elastic moduli of anisotropic clay. Geophysics 2007, 72, D107–D117. [Google Scholar] [CrossRef]
  56. Katahara, K.W. Clay minerals elastic properties. SEG Tech. Program Exp. Abstr. 1996, 1691–1694. [Google Scholar] [CrossRef]
  57. Vasilev, I.; Dubinya, N.; Tikhotskiy, S.; Nachev, V.; Alekseev, D. Numerical model of jack-up rig’s mechanical behavior under seismic loading. Comput. Res. Model. 2022, 14. accepted. [Google Scholar]
Figure 1. The 2D seismic profile along the project well (X-proj is the projection of the engineering well X). The 1D model of the bulk density measured in the laboratory for the well X is shown on the seismic profile and on the right.
Jmse 10 01127 g001
Figure 2. The low-frequency and the inverted models of S-wave velocity, density, and acoustic impedance along the project well. The seismic section in the vicinity of the well is shown on the right.
Jmse 10 01127 g002
Figure 3. Porosity, bulk modulus, and Poisson’s ratio along the project well calculated from the seismic data (P- and S-wave velocities and density) and density of solid grain material and sea water.
Jmse 10 01127 g003
Figure 4. Young’s modulus for the studied well.
Jmse 10 01127 g004
Figure 5. Reconstruction of cohesion using the static Young modulus.
Jmse 10 01127 g005
Figure 6. Comparison of seismic data (exp), results of rock-physics modeling (theor), and laboratory data (lab): (a) velocities of P- and S-waves and (b) Poisson’s ratio.
Jmse 10 01127 g006
Figure 7. Pore pressure predictions using two approaches.
Jmse 10 01127 g007
Figure 8. Critical load estimation for consolidation analysis.
Jmse 10 01127 g008
Figure 9. Critical load estimation for rock-physics modeling.
Jmse 10 01127 g009
Table 1. Description of engineering geologic elements identified at the research site. The depth and thickness ranges are given according to several engineering wells.
Engineering Geologic Element (EGE)Depth (from the Seafloor), mThick-Ness, mDescriptionPoisson’s RatioDen-sity,
g/cc
Young’s Modulus, MPa
EGE 10.15–1.70.15–1.80Silt-1.541
EGE 24.65–5.503.0–3.90Fluid-saturated plastic clay with an admixture of organic matter0.431.873
EGE 35.90–6.200.40–1.55Fluid-saturated plastic clay loam with an admixture of organic matter0.461.866
EGE 414.75–15.408.80–9.40Calcareous fluid-saturated plastic clay with an admixture of organic matter0.401.814
EGE 524.50–24.909.40–10.15Calcareous high-plastic clay with an admixture of organic matter0.281.857
EGE 641.2516.55Calcareous high-plastic clay with an admixture of organic matter0.311.909
EGE 7>50.5>9.25Calcareous high-plastic clay with an admixture of organic matter0.301.91-
Publisher’s Note: MDPI stays neutral with regard to jurisdictional claims in published maps and institutional affiliations.

