Article

Spatiotemporal Variation in Extreme Precipitation in Beijiang River Basin, Southern Coastal China, from 1959 to 2018

1
Research Center for Ecological Civilization Construction and Sustainable Development in Xijiang & Beijiang River Basin of Guangdong Province, Foshan University, Foshan 528000, China
2
Department of Geography and Environment Science, University of Reading, Reading RG6 6AB, UK
3
State Key Laboratory of Hydrology-Water Resources and Hydraulic Engineering, Hohai University, Nanjing 210098, China
*
Author to whom correspondence should be addressed.
J. Mar. Sci. Eng. 2023, 11(1), 73; https://doi.org/10.3390/jmse11010073
Submission received: 18 November 2022 / Revised: 15 December 2022 / Accepted: 22 December 2022 / Published: 3 January 2023
(This article belongs to the Special Issue Water Pollution under Climate Change in Coastal Areas)

Abstract

:
Extreme precipitation events have caused serious impacts on natural ecosystem and human society and have attracted increasing attention in recent years. IPCC AR6 WG I report highlighted a lack of conclusive consensus on the change trend of extreme precipitation in some basins and variation (increase or decrease) between regions. Based on seven precipitation indexes defined by ETCCDI, using daily precipitation data observed by 18 national reference meteorological stations in China during 1959–2018, this study analysed spatiotemporal variation trend of extreme precipitation in the Beijiang River Basin, Southern Coastal China, in recent 60 years, using Mann–Kendall (M-K) trend test, coefficient of variation, and continuous wavelet transformation. M-K test results showed that there were mutations in all seven precipitation indexes, and mutation points were mainly concentrated in two periods (1986–1991 and 2005–2010). The change range of each index after mutation was generally greater than that before mutation. Continuous wavelet transformation showed that each indicator had a significant oscillation period of 2–4 year in most time domains. The southeastern part of the basin (Fogang and Qingyuan) was the center of extremely heavy precipitation, and most precipitation indexes decreased from this area to the surrounding area. As far as the basin as a whole was concerned, consecutive wet days (CWD) declined significantly (passing 0.05 of confidence test), and there was a significantly positive correlation between annual distribution of R95ds and monthly precipitation (p < 0.001). The research results expand our understanding of regional water cycle and extreme climate change, guide the allocation and management of water resources related to regional industrial and agricultural activities, and provide reference for disaster prevention and mitigation.

1. Introduction

Intergovernmental Panel on Climate Change (IPCC) working group I the sixth assessment report Climate Change 2021: Foundation of Natural Science (hereinafter referred to as the AR6 WG I report) pointed out that climate change caused by human activities has affected extreme weather and climate events in various regions on the Earth since the 1950s [1]. Although extreme weather events belong to small probability events, they are often sudden and harmful and easy to cause other natural disasters, thus posing serious threats to the natural ecosystem and human society [2,3,4,5]. In order to facilitate the study of extreme climate, Expert Team on Climate Change Detection and Index (ETCCDI) established jointly by World Meteorological Organization (WMO), World Climate Research Program (WCRP), the Joint WMO/IOC Technical Commission for Oceanography and Marine Meteorology (JCOMM) define 27 representative and globally applicable extreme climate indexes [6,7,8].
In view of the serious impact on economic development and people’s lives, extreme precipitation events have become the research focus of global scholars in recent years [9,10,11]. Studies have found that the extreme precipitation events in the middle and high latitudes had an overall increasing trend over the past 50 years [12], with complex changes and obvious regional differences [13]. Specifically, the extreme precipitation events in North America, south part of South America, northwest Europe, and east part of Asia showed an increasing trend; the change was not obvious in north South America, Africa and central Oceania; however, the extreme precipitation events indicated a decreasing trend in other regions [12,14,15].
In many areas of China, the frequency and intensity of heavy rainfall and extremely heavy rainfall events have increased, while light rain decreased [16,17,18,19]. In general, there are significant regional differences in the changes of extreme precipitation in China. Most extreme precipitation indexes showed an increasing trend in Northwest China, Southeast China and the middle and lower reaches of the Yangtze River, while they indicated a decreasing trend in North China, Northeast China and Southwest China [20,21,22,23,24,25]. Some scholars have also studied the changes of extreme precipitation in large river basins [26], such as the Yangtze River Basin [27,28,29], the Yellow River Basin [30,31], the Pearl River Basin [32,33], the Huaihe River Basin [34,35], and the Song-liao River Basin [36]. However, studies in different basins are mostly based on different methods and various precipitation indexces, and the time periods concerned are also different, so the results cannot be compared directly. The above research results indicated obvious spatial and temporal variations in extreme precipitation. Therefore, for the better management of local water resource, the study of extreme precipitation from a smaller spatial scale is an important supplement to the large-scale regional research. Some scholars have also pointed out that the change rates of extreme precipitation in some areas are faster than the average precipitation in the region as a whole, which brings more challenges to local water resources management [37]. Scholars have also highlighted a lack of conclusive consensus on the change trend of extreme precipitation in some basins, and big variations in the changes (increase or decrease) between areas [38].
Beijiang River is the second largest tributary of the Pearl River in Southern Coastal China, playing an important role in society and ecosystem in the region. Despite some studies on precipitation in the Beijiang River Basin in recent decades [39,40], the systematic research on extreme precipitation in the whole basin is still lacking. Considering the length and consistency of the data, 18 meteorological stations that were established earlier in the region were selected for this study. Based on seven precipitation indexes defined by ETCCDI and daily precipitation data observed in 18 national reference meteorological station of China during 1959–2018, this paper analysed the spatiotemporal variation of extreme precipitation in the Beijiang River Basin in recent 60 years, using Mann–Kendall M-K trend test, coefficient of variation, and continuous wavelet transformation. The following scientific questions were addressed: (1) How did the average precipitation and extreme precipitation change in the Beijiang River Basin in the past 60 years? (2) What are the spatial variations in the change trend within the basin? (3) What are the differences of the long-term changes of extreme precipitation indexes in the Beijiang River Basin?
The research results will increase our knowledge of regional water cycle and extreme climate change, guide the allocation and management of water resources required for regional industrial and agricultural production, and provide reference for floods prevention and mitigation.

2. Materials and Methods

2.1. Study Area

The Beijiang River runs through the north central part of Guangdong Province, one of the important rivers in Southern Coastal China. The total length of the river is 582 km (Figure 1). The Beijiang River Basin (23.12–25.69° N, 111.82–114.97° E) belongs to transition region from central subtropical zone to south subtropical zone, with the total area of 43 000 km2 and total population of 9.1 million by the end of 2021. Due to complex topography and extreme climate, natural disasters such as flood and drought have occurred frequently in the basin in recent decades, causing serious casualties and property losses. According to statistics, in the summers of 1968, 1982, 1994, 1997, 1998 and 2005, the Beijiang River Basin was hit by heavy rainstorms and floods [41]. In the middle of July 2006, the middle and upper reaches of the Beijiang River were hit by heavy rain, which caused serious flood disaster in some areas. In Shaoguan, 1.08 million people were affected, 53 people died, 87,520 houses collapsed, more than 42,000 hm2 of crops were affected, more than 76,000 head of livestock were killed, 41 reservoirs were damaged, 316 industrial and mining enterprises were suspended, most of the communication, transportation, power and water supply were interrupted, and the direct economic losses amounted to 15.2 billion RMB Yuan [42]. From 21–23 June 2012, heavy rain and floods occurred in the middle and lower reaches of Lianjiang River (a tributary of Beijiang River), which affected about 312,800 people in northern Guangdong, displaced about 22,300 people, killed 2 people and left 3 people missing, and caused direct economic losses of 728 million RMB Yuan [43]. In northern Guangdong, where the Beijiang River Basin is located, more than 60% of the cultivated land suffers from droughts in autumn and winter [44].

2.2. Data Source and Precipitation Indexes

The precipitation data were collected from 18 national standard meteorological observation stations in the Beijiang River Basin (Figure 1). All of the stations continuously collected daily precipitation data from 1959 to 2018. The precipitation datasets were obtained from the National Climate Center (NCC) of the China Meteorological Administration (CMA). There are three stations containing missing data. At all of stations, the missing values are less than 0.3% of all data. The durations of continuous gaps were mainly in one day. The missing data were replaced by the average values of neighbouring days. This gap filling method has little influence on the result [45]. The datasets were checked with strict quality control, and three aspects inspection (reliability, consistency, and representativeness) showed good integrity. Then, seven precipitation indexes defined by ETCCDI (Table 1) were calculated based on daily precipitation data.

2.3. Data Processing Method

2.3.1. The Mann–Kendall Trend Test

The Mann–Kendall method (M-K), developed by Mann and Kendall [46], is a nonparametric statistical method based on rank. The advantage of M-K method is no requirement for sample following a certain distribution and without interference by several outliers. As one of the effective methods for analysing time series trend, the M-K method performs well to identify overall trend of time series evolution and abrupt changes [47,48]. It has been recommended by the WMO and widely applied in the research of the time series of hydrological and meteorological variables [49].
(1)
Inspection statistics
Inspection statistics (S) is defined by non-parametric Mann–Kendall trend test as follows:
S = i = 2 n   j = 1 i 1 Sign   ( D i D j )
where: ij, and i, jn. Sign ( ) is a Sign function. When DiDj is >, =, or < 0, Sign (DiDj) is 1, 0, or −1, respectively. For the long time series (n > 10), the statistic Z is estimated as follows:
Z = { ( S 1 ) / n ( n 1 ) ( 2 n + 5 ) / 18   S > 0   0   S = 0 ( S + 1 ) / n ( n 1 ) ( 2 n + 5 ) / 18   S < 0
When Z > 0 and Z < 0, the time series shows an increasing and decreasing trends, respectively. When | Z | ≥ 1.28, 1.64, or 2.32, it indicates that the discriminant results have passed the significance test with the reliability of 90%, 95%, or 99%, respectively [47,48].
(2)
Detection of Mann–Kendall mutation
Time series (D2, D3, …, and Dn) construct an orderly column ri, which represents the sample accumulation number of Di > Dj (1 ≤ ji). The rank series (Sk) is calculated as follows:
S k = i = 1 k r i ( k = 2 ,   3 , ,   n )
When Di > Dj, ri = 1; when DiDj, ri = 0 (j = 1, 2, …, i). The expected value E(Sk) of Sk and its sequence variance Var(Sk) are calculated as follows:
E ( S k ) = n ( n + 1 ) / 4
V a r ( S k ) = n ( n 1 )   ( 2 n + 5 ) / 72
The data sequence is considered independent, and the test statistics (UFk) is calculated as follows:
U F k = S k E ( S k ) V a r ( S k )   ( k = 1 ,   2 , ,   n )
UFk obeys the standard normal distribution and provides a significance level α. The critical value Uα can be obtained from the standard normal distribution table. For instance, when α is 0.05, its critical value Uα is ± 1.96; when | UFk | > | Uα |, the time series has a significant decrease or increase trend. The UFk points over the study period are plotted as a curve to analyse if they have a decreasing or increasing trend. The calculation of the above steps was conducted again in a reverse sequence. The result was multiplied by −1 to obtain the new time series UBk. UFk and UBk sequence diagrams were drawn. UFk > 0 and UFk < 0 mean the sequences are an increasing and decreasing trend, respectively. When UFk exceeds the critical value, the decreasing or increasing trend reaches the significant level. When the two curves of UFk and UBk intersect, the intersection point is the beginning of mutation [47,48].
This study found that the autocorrelation of the time series of hydrological and meteorological elements had an impact on the M-K test results. Therefore, the autocorrelation of the relative humidity time series was tested before the M-K test, and the influence of significant correlation was eliminated by the means of variance correction [50,51].

2.3.2. The Linear Trend Estimation

In the analysis of precipitation index series variation trend, this study also used the linear trend method (using the least square method to estimate parameters) [52].

2.3.3. Coefficient of Variation (CV)

If the dimensions of the two groups of data are different, the standard deviation should not be used when comparing the degree of dispersion, and the influence of the dimension should be eliminated. This can be achieved by CV, which is the ratio of the standard deviation of the data series to the average of the data series [53]. CV is dimensionless and can be compared directly.

2.3.4. Continuous Wavelet Transform (CWT)

CWT was adopted to analyze the multi-scale periodic characteristics of precipitation index series [54,55,56]. Morlet wavelet was selected as the basic wavelet and calculated as follows:
Ψ ( t ) = e i ω 0 t e t 2 / 2
where i is the imaginary number, ω0 is the dimensionless frequency, and t is the time variable. When ω0 is ≥ 5, Morlet wavelet satisfies the permissibility condition.
To eliminate the effect of internal circulation, low-pass filtering was applied to filter out the variability less than two years before wavelet transform of precipitation index time series [57].
The data analyses were conducted using Matlab 2016a (MathWorks, Natick, MA, USA), the maps were created using ArcGIS 10.3 (ESRI Inc., Redlands, CA, USA), and Kriging interpolation was applied for the interpolation of the spatial distribution of precipitation indexes [58,59].

3. Results

3.1. Annual Average and Spatial Variation

The averages of all precipitation indexes in the basin were shown in Table 2, while there were spatial variations in all indicators within the basin (Figure 2). For PRCPTOT (Figure 2a), the high-values appeared in the southeastern basin, particularly 2185.3 and 2138.8 mm in Fogang and Qingyuan, respectively. The low-values were observed in northeast part (Lechang, Renhua, Nanxiong, and Shixing), between 1400 and 1600 mm. The middle values, between 1600 and 1900 mm, appeared in other areas. Overall, PRCPTOT gradually decreased from Fogang and Qingyuan to the periphery.
SDII (Figure 2b), Rx1day (Figure 2c) and Rx5day (Figure 2d) showed similar spatial patterns to PRCPTOT. High-values were observed in southeast part, and low-values appeared mainly in northeast and northwest parts.
In terms of CDD (Figure 2e), they were 35–37 d in the south of the basin (Sanshui, Sihui and Qingyuan), 30–31 d in the west (Lianzhou, Liannan, and Lianshan) and northeast (Shixing), and 32–34 d in other regions. Overall, it gradually decreased from south to north.
For CWD (Figure 2f), they were 16–17 d in southeast part (Yingde, Qingyuan and Fogang), 12–13 d in Nanxiong, Shixing and Sanshui, and 14–16 d in other regions. Its spatial pattern showed an overall gradual decrease from southeast to the periphery.
Regarding R95ds (Figure 2g), they were 7 d in the west (Lianzhou, Lianshan, and Yangshan) and the southeast (Fogang and Qingyuan), 5 d in the northeast (Wengyuan, Shixing, and Nanxiong) and the south (Sanshui and Guangning) and 6 d in other regions. Overall, it gradually decreased from southeast-northwest strip area to both sides.

3.2. Analysis of Mutation Point and Change Trend

3.2.1. Analysis of Mutation Point and Linear Trend

As shown in Figure 3a and Table 3, PRCPTOT mutated in 2006. According to the linear fitting and M-K test before and after mutation, PRCPTOT showed an increasing trend before and after mutation, but increasing trend after mutation was larger than that before mutation. Seen from coefficients of variation (CV) before and after mutation, change amplitude after mutation was larger than that before mutation. In contrast, the mean values before (1737.5 mm, 1959–2005) and after (1549.5 mm, 2006–2018) the mutation were significantly different. The overall trend decreased from 1959 to 2018.
As shown in Figure 3b and Table 3, there were two mutations in SDII during 1959–2018: 1990 and 2007. In 1959–1989, the mean, CV, and change trend were 13.8 mm/d, 0.087, and decreasing, respectively; during 1990–2006, the mean, CV, and change trend were 14.8 mm/d, 0.081, and decreasing, respectively; from 2007 to 2018, the mean, CV, and change trend were 13.6 mm/d, 0.078, and rising, respectively. Obviously, the mean during 1990–2006 was the maximum. On the whole, it decreased from 1959 to 2018.
As indicated in Figure 3c and Table 3, there were two mutations in Rx1day during 1959–2018: 1982 and 2007. In 1959–1981, the mean, CV, and change trend were 105.9 mm, 0.149, and decreasing, respectively; during 1982–2006, the mean, CV, and change trend were 113.0 mm, 0.137, and rising, respectively; from 2007 to 2018, the mean, CV, and change trend were 98.6 mm, 0.137, and rising, respectively. The largest change rate appeared during 1959–1981, while the smallest change rate happened in 2007–2018. Overall, it declined from 1959 to 2018.
Seen from Figure 3d and Table 3, there were two mutations in Rx5day during 1959–2018: 1991 and 2009. In 1959–1990, the mean, CV, and change trend were 190.1 mm, 0.150, and decreasing, respectively; during 1991–2008, the mean, CV, and change trend were 203.8 mm, 0.181, and decreasing, respectively; from 2009 to 2018, the mean, CV, and change trend were 176.0 mm, 0.160, and rising, respectively. The change velocity was the fastest during 1959–1990, while it was slowest in 2009–2018. The overall trend decreased from 1959 to 2018.
As shown in Figure 3e and Table 3, CDD mutated in 1986. It showed a decreasing trend before and after mutation, but the decreasing trend after mutation was greater than that before mutation. The change amplitude after mutation was larger than that before mutation. In contrast, the mean values before (30.8 d, 1959–1985) and after (34.8 d, 1986–2018) the mutation were significantly different. On the whole, the change trend rose from 1959 to 2018.
As indicated in Figure 3f and Table 3, CWD mutated in 2000. It showed a decreasing trend before and after mutation, but the decreasing trend after mutation was slightly greater than that before mutation. The change amplitude after mutation was larger than that before mutation. The means were 15.7 d before mutation (1959–1999) and 13.1 d after mutation (2000–2018), respectively. The statistical value of MK trend test during 1959–2018 was −2.54, a significant decrease (passed the 95% level of significance test).
Seen from Figure 3g and Table 3, R95ds mutated in 2005. It showed a rising trend before mutation and a decreasing trend after mutation. The change amplitude after mutation was larger than that before mutation. In contrast, the mean values before (6.2 d, 1959–2005) and after (5.3 d, 2006–2018) the mutation were significantly different. The overall change trend decreased from 1959 to 2018.

3.2.2. Analysis of Spatial Difference of Change Trend

As shown in Figure 3 and Table 3, in the entire basin, CDD showed a rising trend, while other indicators illustrated decreasing trends. However, there were spatial differences within the basin (Figure 4). Only sites with significant change trend (passed the 95% level of significance test) were further analyzed here. As indicated in Figure 4a, PRCPTOT declined significantly in Wengyuan, and southwest part of the basin (Huaiji, Sihui, and Sanshui). SDII rose significantly in Shaoguan and Lianzhou (Figure 4b). For Rx1day (Figure 4c), it showed a significant rising and decreasing trend in Shaoguan and Ruoyuan, respectively. In terms of Rx5day (Figure 4d), it significantly rose in Lianzhou and decreased in Renhua and Huaiji, respectively. Regarding CWD (Figure 4f), 13 stations (accounting for more than 2/3 of all) showed a significant decline trend, which were distributed in all regions of the basin. For R95ds (Figure 4g), there were seven stations with significant decrease trend, four in the south and three in the northeast.

3.3. Analysis of Continuous Wavelet Transformation

To analyze the main oscillation cycle and corresponding period, continuous wavelet transform of annual mean RH in each subarea was conducted (Figure 5). To eliminate the effect of internal circulation, low-pass filtering was applied to filter out the variability less than two years before wavelet transform of each time series.
As shown in Figure 5 and Table 4, each index had a significant oscillation period of 2–4 a, while there were different time domains corresponding to the significant period of different scales. According to the change of significant period, it can be divided into the following three categories: (1) PRCPTOT, Rx1day, and Rx5day. They were roughly divided into two parts based on 1990; the periodic scale was smaller before 1990 but larger after 1990. (2) SDII and R95ds. They were roughly divided into two parts based on 1984; the periodic scale was smaller before 1984 but larger after 1984. Compared with other indexes, the time domain corresponding to their significant periods was relatively continuous. (3) CDD and CWD. The significant periodic scales had large changes. They were roughly divided into two parts based on 1985; the periodic scale was larger before 1985 but smaller after 1985.

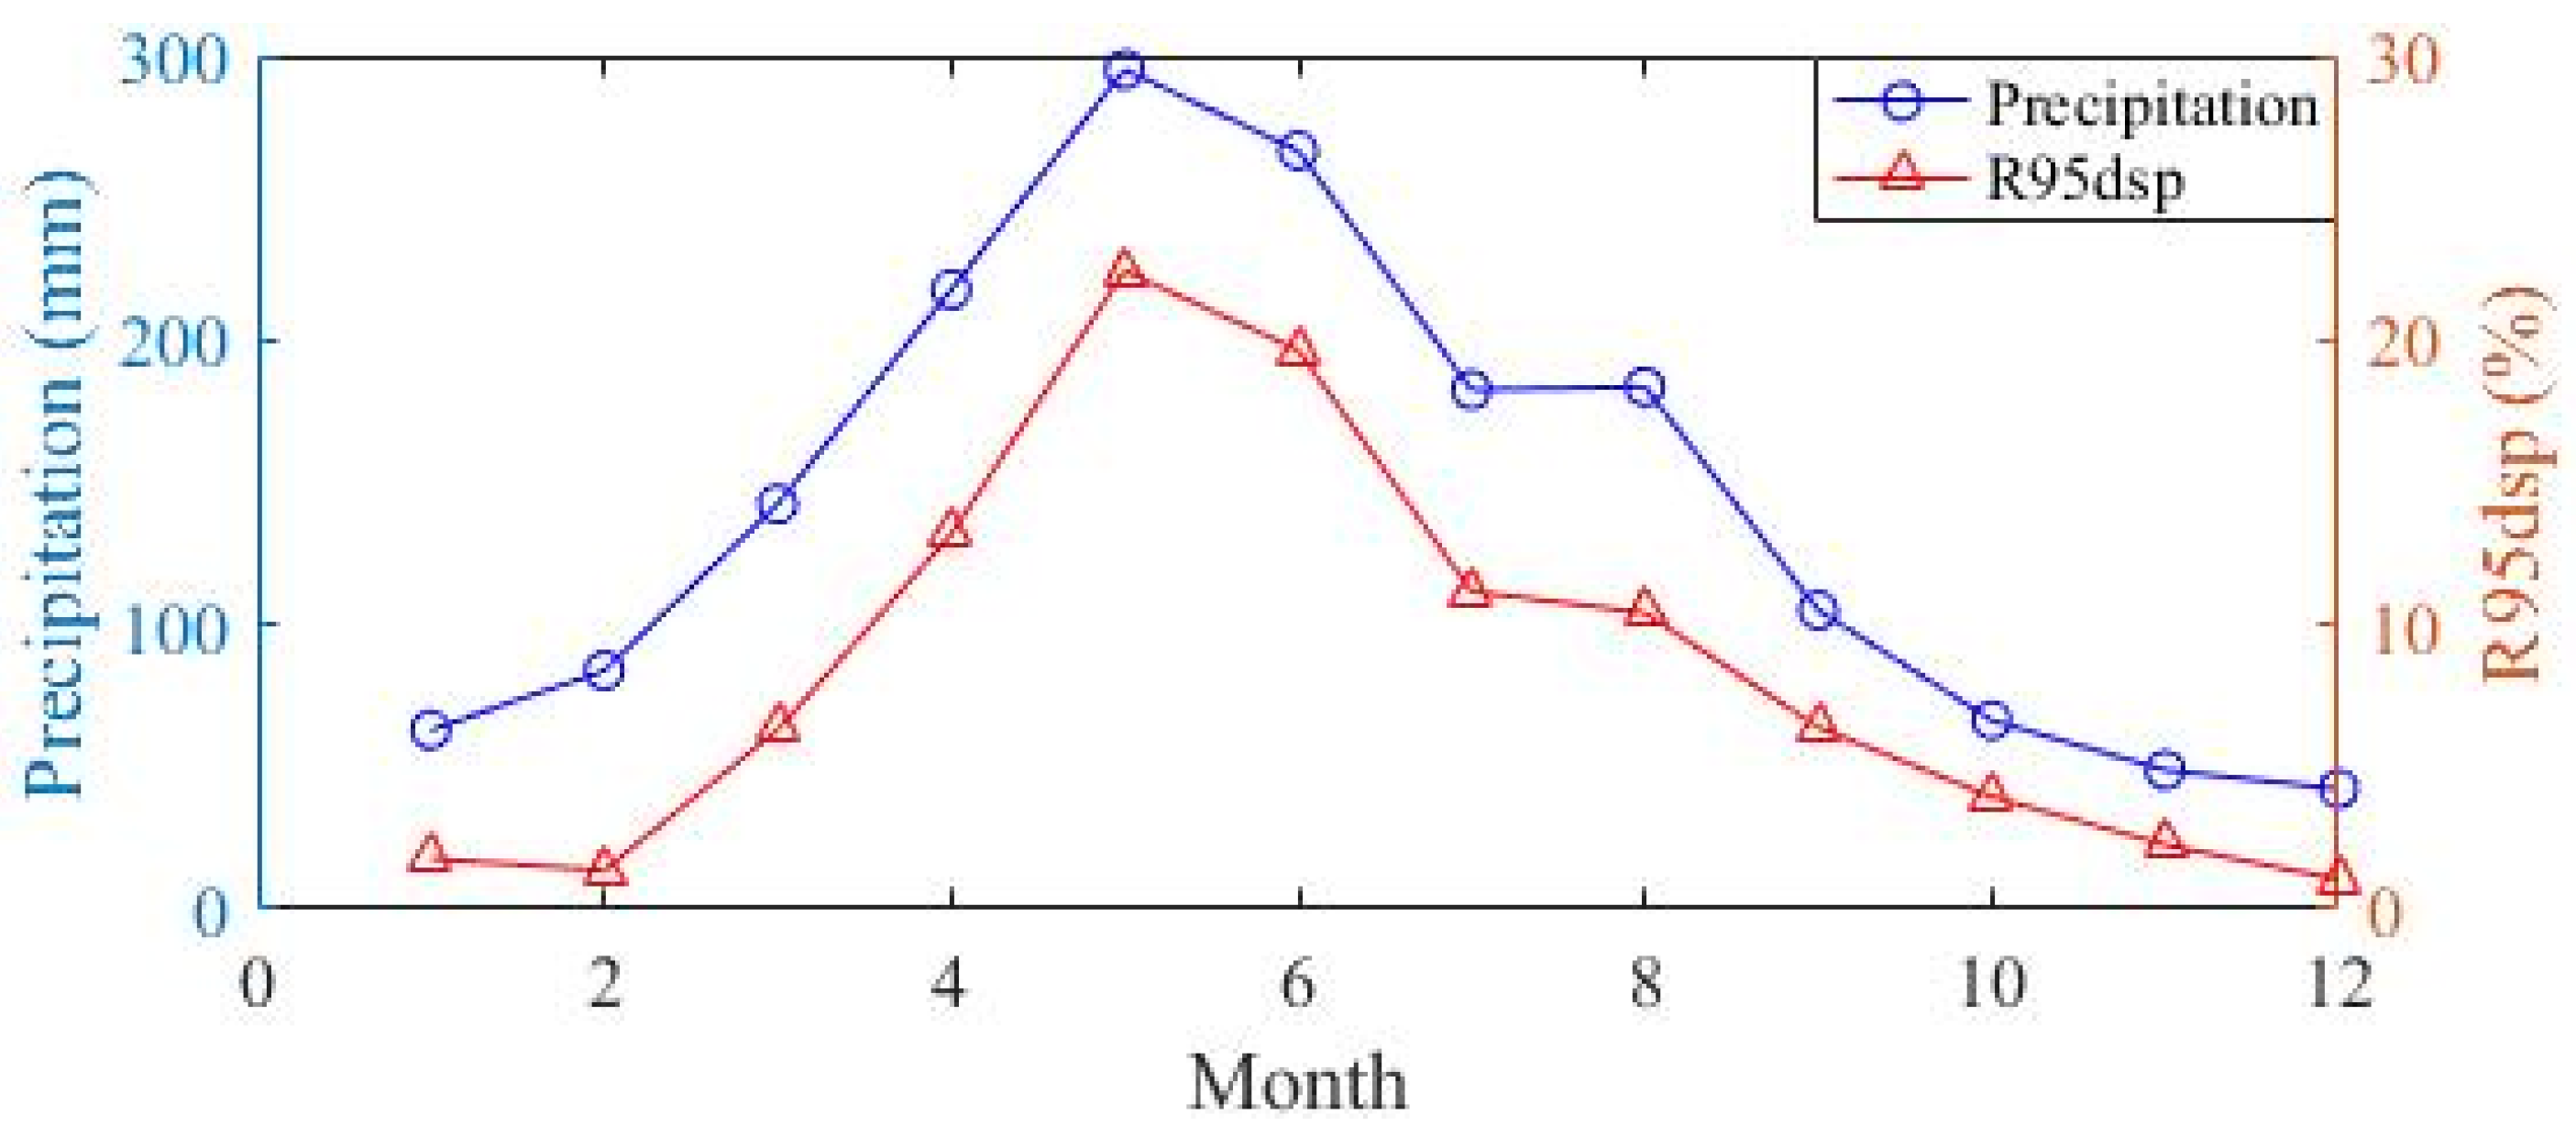
3.4. Correlation Analysis between R95ds Distribution within the Year and Monthly Precipitation

To explore distribution rule of R95ds within the year, the statistics on distribution situation of R95ds in each month during 1959–2018 was conducted, namely the proportion of R95ds in each month (R95dsp). As shown in Figure 6, R95dsp distribution within the year was generally unimodal, with peak (22.43%) in May. It was 10–20% in April, June, July, and August; 6–7% in March and September; 1–4% in January, February, October, November and December. Although R95ds appeared less, it produced a large amount of precipitation.
Monthly precipitation in the Beijiang River Basin was shown in Figure 6. Monthly precipitation during March–September was more than 100 mm. Among them, monthly precipitation during April–June was more than 200 mm, and the maximum was in May (295.1 mm). Monthly precipitation from October to next February was between 40 and 100 mm. Similar to R95dsp, monthly precipitation showed unimodal. Moreover, the highest value and the lowest value appeared at the same time, both in May and December. Correlation analysis showed the significantly positive correlation between R95dsp and monthly precipitation (R2 = 0.9577, p < 0.001).

4. Discussion

4.1. Spatial Variation in Annual Average Values

In the Beijiang River Basin, PRCPTOT, SDII, Rx1day, Rx5day, and CWD had similar spatial change trend, and the overall performance decreased from the southeast to the periphery (Figure 2a–d,f). The high values appeared in the southeast, including mainly Fogang and Qingyuan. Similarly, previous studies found that Fogang and Qingyuan were the main areas affected by frontal rain [40,60]. Under the comprehensive influence of various weather systems (subtropical high pressure, subtropical jet, frontal or shear line position change, etc.), continuous precipitation often happens in this area, and extreme heavy precipitation occurs frequently. This area is also one of the three rainstorm centers in Guangdong Province. Our results confirmed this precipitation pattern.

4.2. Mutation Point

In Beijiang River Basin, all precipitation sequences had a mutation phenomenon, and some sequences even had multiple mutation points (Figure 3 and Table 3). Under the complex impacts from both climate change and human activities, the consistency hypothesis of precipitation sequence has been questioned [61,62,63], while the non-consistency was supported by more and more observation facts [64,65,66,67]. In our research area, the occurrence time of mutation point was mainly concentrated in two periods: 2005–2010 (Figure 3(a1,b1,c1,d1,g1)) and 1986–1991 (Figure 3(b1,d1,e1)). The mutations of precipitation were caused by several possible reasons, mainly related to human activities in the basin. In last four decades, Guangdong Province, where the Beijiang River Basin is located, has been the forefront of China’s reform and opening up [68,69]. With the rapid industrialization and urbanization, the impact of human activities on the surface environment has become much stronger than before [70,71,72]. The change trend of each time period before and after the mutation may be the same, but the mean value, change speed and change range were significantly different. Among them, change amplitude after mutation was generally larger than that before mutation, indicating the increased uncertainty of extreme precipitation change.

4.3. Significant Decline of CWD

The Beijiang River Bain experienced significant decrease of CWD (Table 3 and Figure 4f). The correlation analysis indicated the significantly positive correlation between R95ds distribution within the year and monthly precipitation. It showed that although the number of extremely heavy precipitation was small, the precipitation intensity was large in Beijiang River Basin. Therefore, the precipitation produced by extremely heavy rainfall accounted for a large proportion of the monthly precipitation in the long term. The significant decline of CWD in the Beijing River Basin was also related to the anthropogenic activities in the region. With both the national and local policies, Beijiang River Basin has experienced a series of large-scale industry and mining development and rapid urbanization in recent decades [73]. Vegetation destruction and surface hardening have changed the regional microclimate, resulting in a decrease in the number of light rain and drizzle days [40,70,74]. Our research highlighted the big change of precipitation in this region and other parts of China, causing risks to the industrial and agricultural water use [75]. In the last decade, China has paid more attention to environmental protection, along economic development [76,77]. To mitigate the extreme weather in the future, reducing carbon emission and achieving zero emission, along with other ecological conservation measures, will be indispensable [78].
The Beijiang River Basin is an important drinking water source and ecological security barrier in the Guangdong Province. There are 26 drinking water source protection areas in the Beijiang River basin, providing drinking water for nearly 30 million people in the basin and the northern part of the Pearl River Delta, especially for Guangzhou and Foshan [40]. Due to the serious shortage of water storage projects in the basin, more than 80% of the precipitation in the flood season flows into the main stream of the Beijiang River in the form of surface runoff, with the maximum flow of 14 900 m3/s. This increases not only the flood control burden along the river, but also a large amount of fresh water flowing into the sea. In the dry season, however, the water volume of main stream is very small, and the minimum flow is only 130 m3/s [79].
The Beijiang River Basin is rich in mineral resources. At present, more than 100 kinds of minerals with proven reserves have been found in the basin. There are a large number of small and medium-sized mining sites, quarries and metallurgical plants in the basin. The mining activities have caused a series of problems such as vegetation destruction, debris exposure, soil and water loss, and water environment pollution [80,81].
There are more mountains and less cropland in the basin, and the conflict between people and land is prominent. For example, the area of slope farmland planted with dry crops accounted for about 52% of the total cultivated area in the basin [82]. Due to the large proportion of sloping farmland, many areas are suffered from the large threat of soil and water loss [83].
In the context of tackling global climate change, the Chinese government announced the “Double Carbon Target” in 2020, “it strives to reach the peak of carbon dioxide emissions by 2030 and strives to achieve carbon neutrality by 2060” [78]. China’s CO2 emissions from energy consumption accounted for about 88% of the total emissions in 2020, of which the electricity industry accounted for about 42.5% of the total CO2 emissions of the energy industry [84,85]. Therefore, one of the important ways to achieve the “Double Carbon Target” is to optimize the energy structure and promote the develop of renewable energy [86,87,88]. Hydropower plays an important role in China’s renewable energy system, an indispensable part for achieving the “Double Carbon Target” [89,90,91,92,93,94]. Considering the possible impacts of hydropower dams on ecosystem, care planning, construction and operation of hydropower in Beijiang River Basin is crucial. For example, pumped storage hydropower may enhance the regulation and storage capacity of water resources in the basin, thereby mitigating drought and flood hazards [95,96,97].

4.4. Oscillating Periods of Extreme Precipitation

Climate change, including the extreme weather, is influenced by many factors. The weather systems, affecting the precipitation in the Beijiang River Basin, mainly include the location and intensity of subtropical high [98], the intensity of monsoon [99], mesoscale convective system [100], low-frequency weather system [101], El Niño and La Niña (ENSO) and other teleconnecting phenomena [102,103,104,105]. However, precipitation is often affected by multiple factors, and it is not easy to quantify the influence degree of each factor [106]. Despite the progress, many studies are still needed to determine the influence of ENSO and other teleconnecting phenomena on extreme precipitation cycle.

4.5. Limitations and Future Research

Similar to many studies, there are some limitations in the current study. The precipitation data used in this paper were observation data from meteorological stations. Due to long data sequence, there may be some bias in the early observation data. Especially in the 1950s, the 1960s, and even the 1970s, the whole area was underdeveloped, and the observation equipment, observation methods, data recording and storage of the meteorological stations were not as advanced as they are now. However, after inspection, correction and re-evaluation by professionals of China Meteorological Administration (CMA) and National Climate Center (NCC), the data are still robust and reliable [45,74].
Under the comprehensive influence from both global warming and anthropogenic activities in recent years, the non-uniformity of hydrological series has been increasingly confirmed and has gradually become a new research direction. On the basis of this study, it is necessary to further explore the inconsistency of extreme precipitation in this region and other regions experiencing the similar changes in the future.

5. Conclusions

Due to the large impact of extreme weathers, increasing attention has been paid the extreme precipitation in regions experiencing climate change and anthropogenic disturbance. This study researched the spatiotemporal variation trend of extreme precipitation in the Beijiang River Basin in Southern Coastal China in the recent six decades. The main conclusions are as follows:
(1)
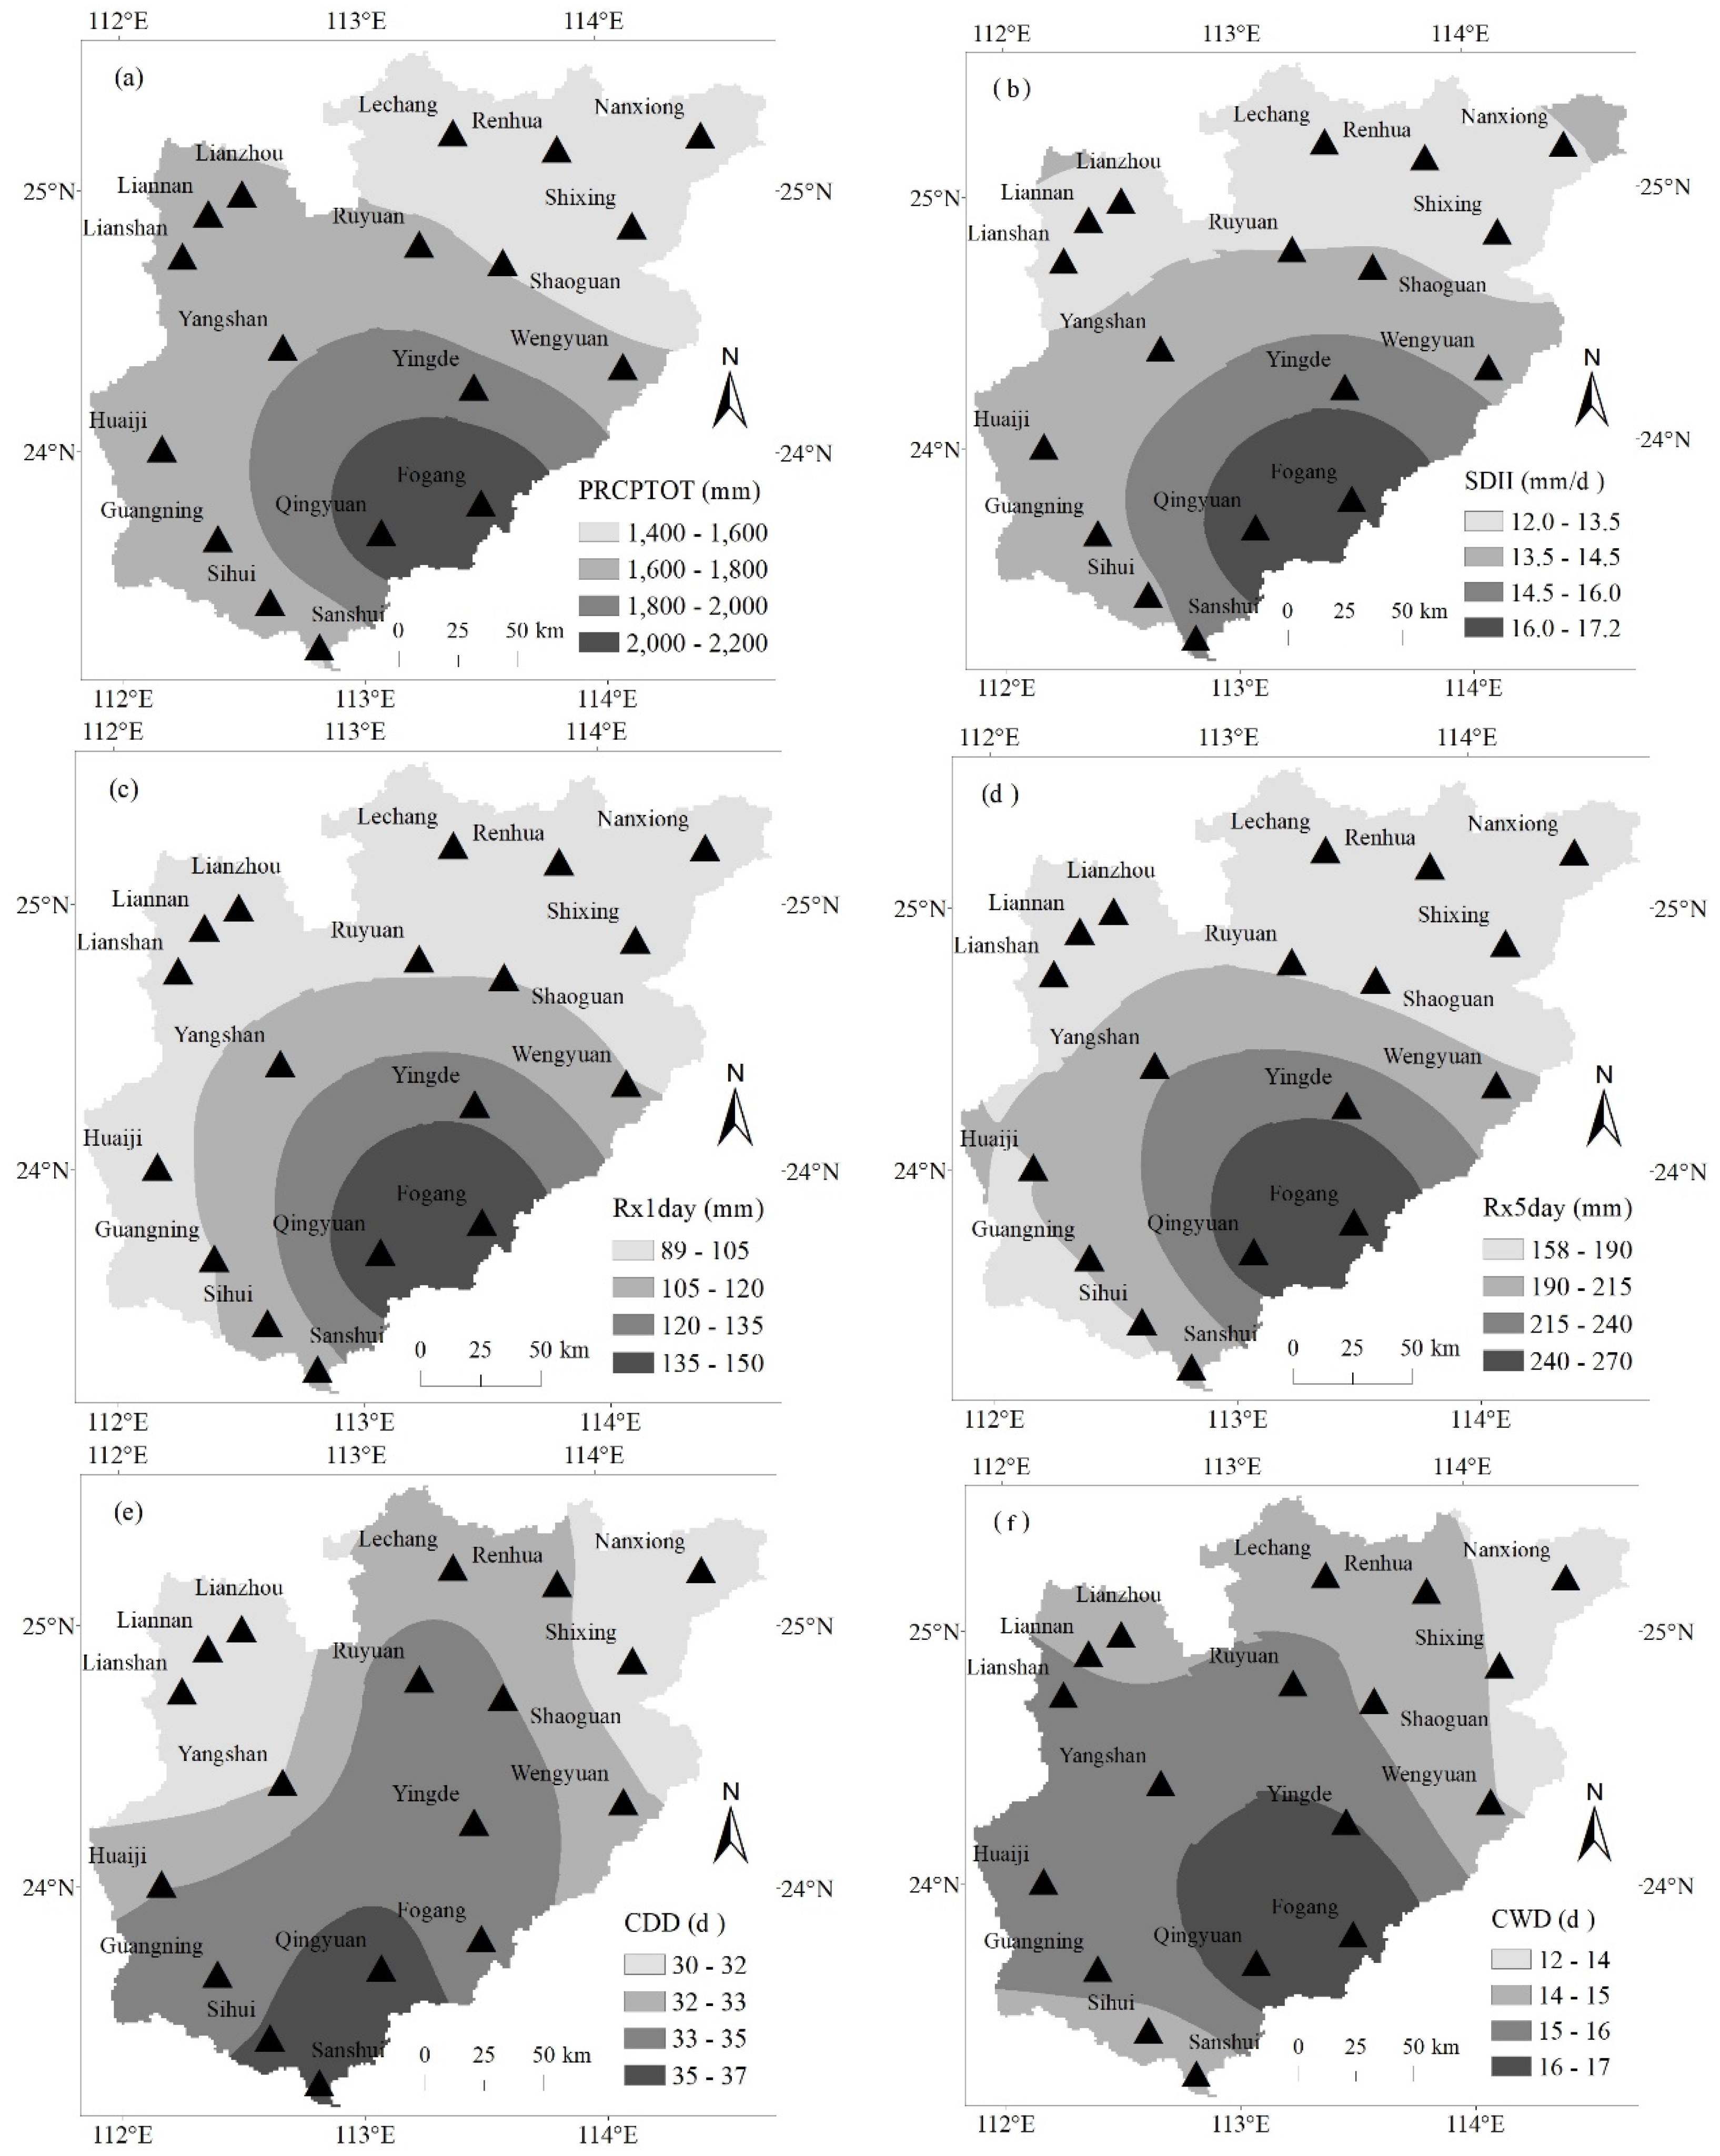
The spatial variations in annual average PRCPTOT, SDII, Rx1day, Rx5day, and CWD were similar, and the values decreased from the southeast (Fogang and Qingyuan) to the periphery. CDD values decreased from south to north, while R95ds roughly showed a decreasing trend from the southeast-northwest strip to both sides.
(2)
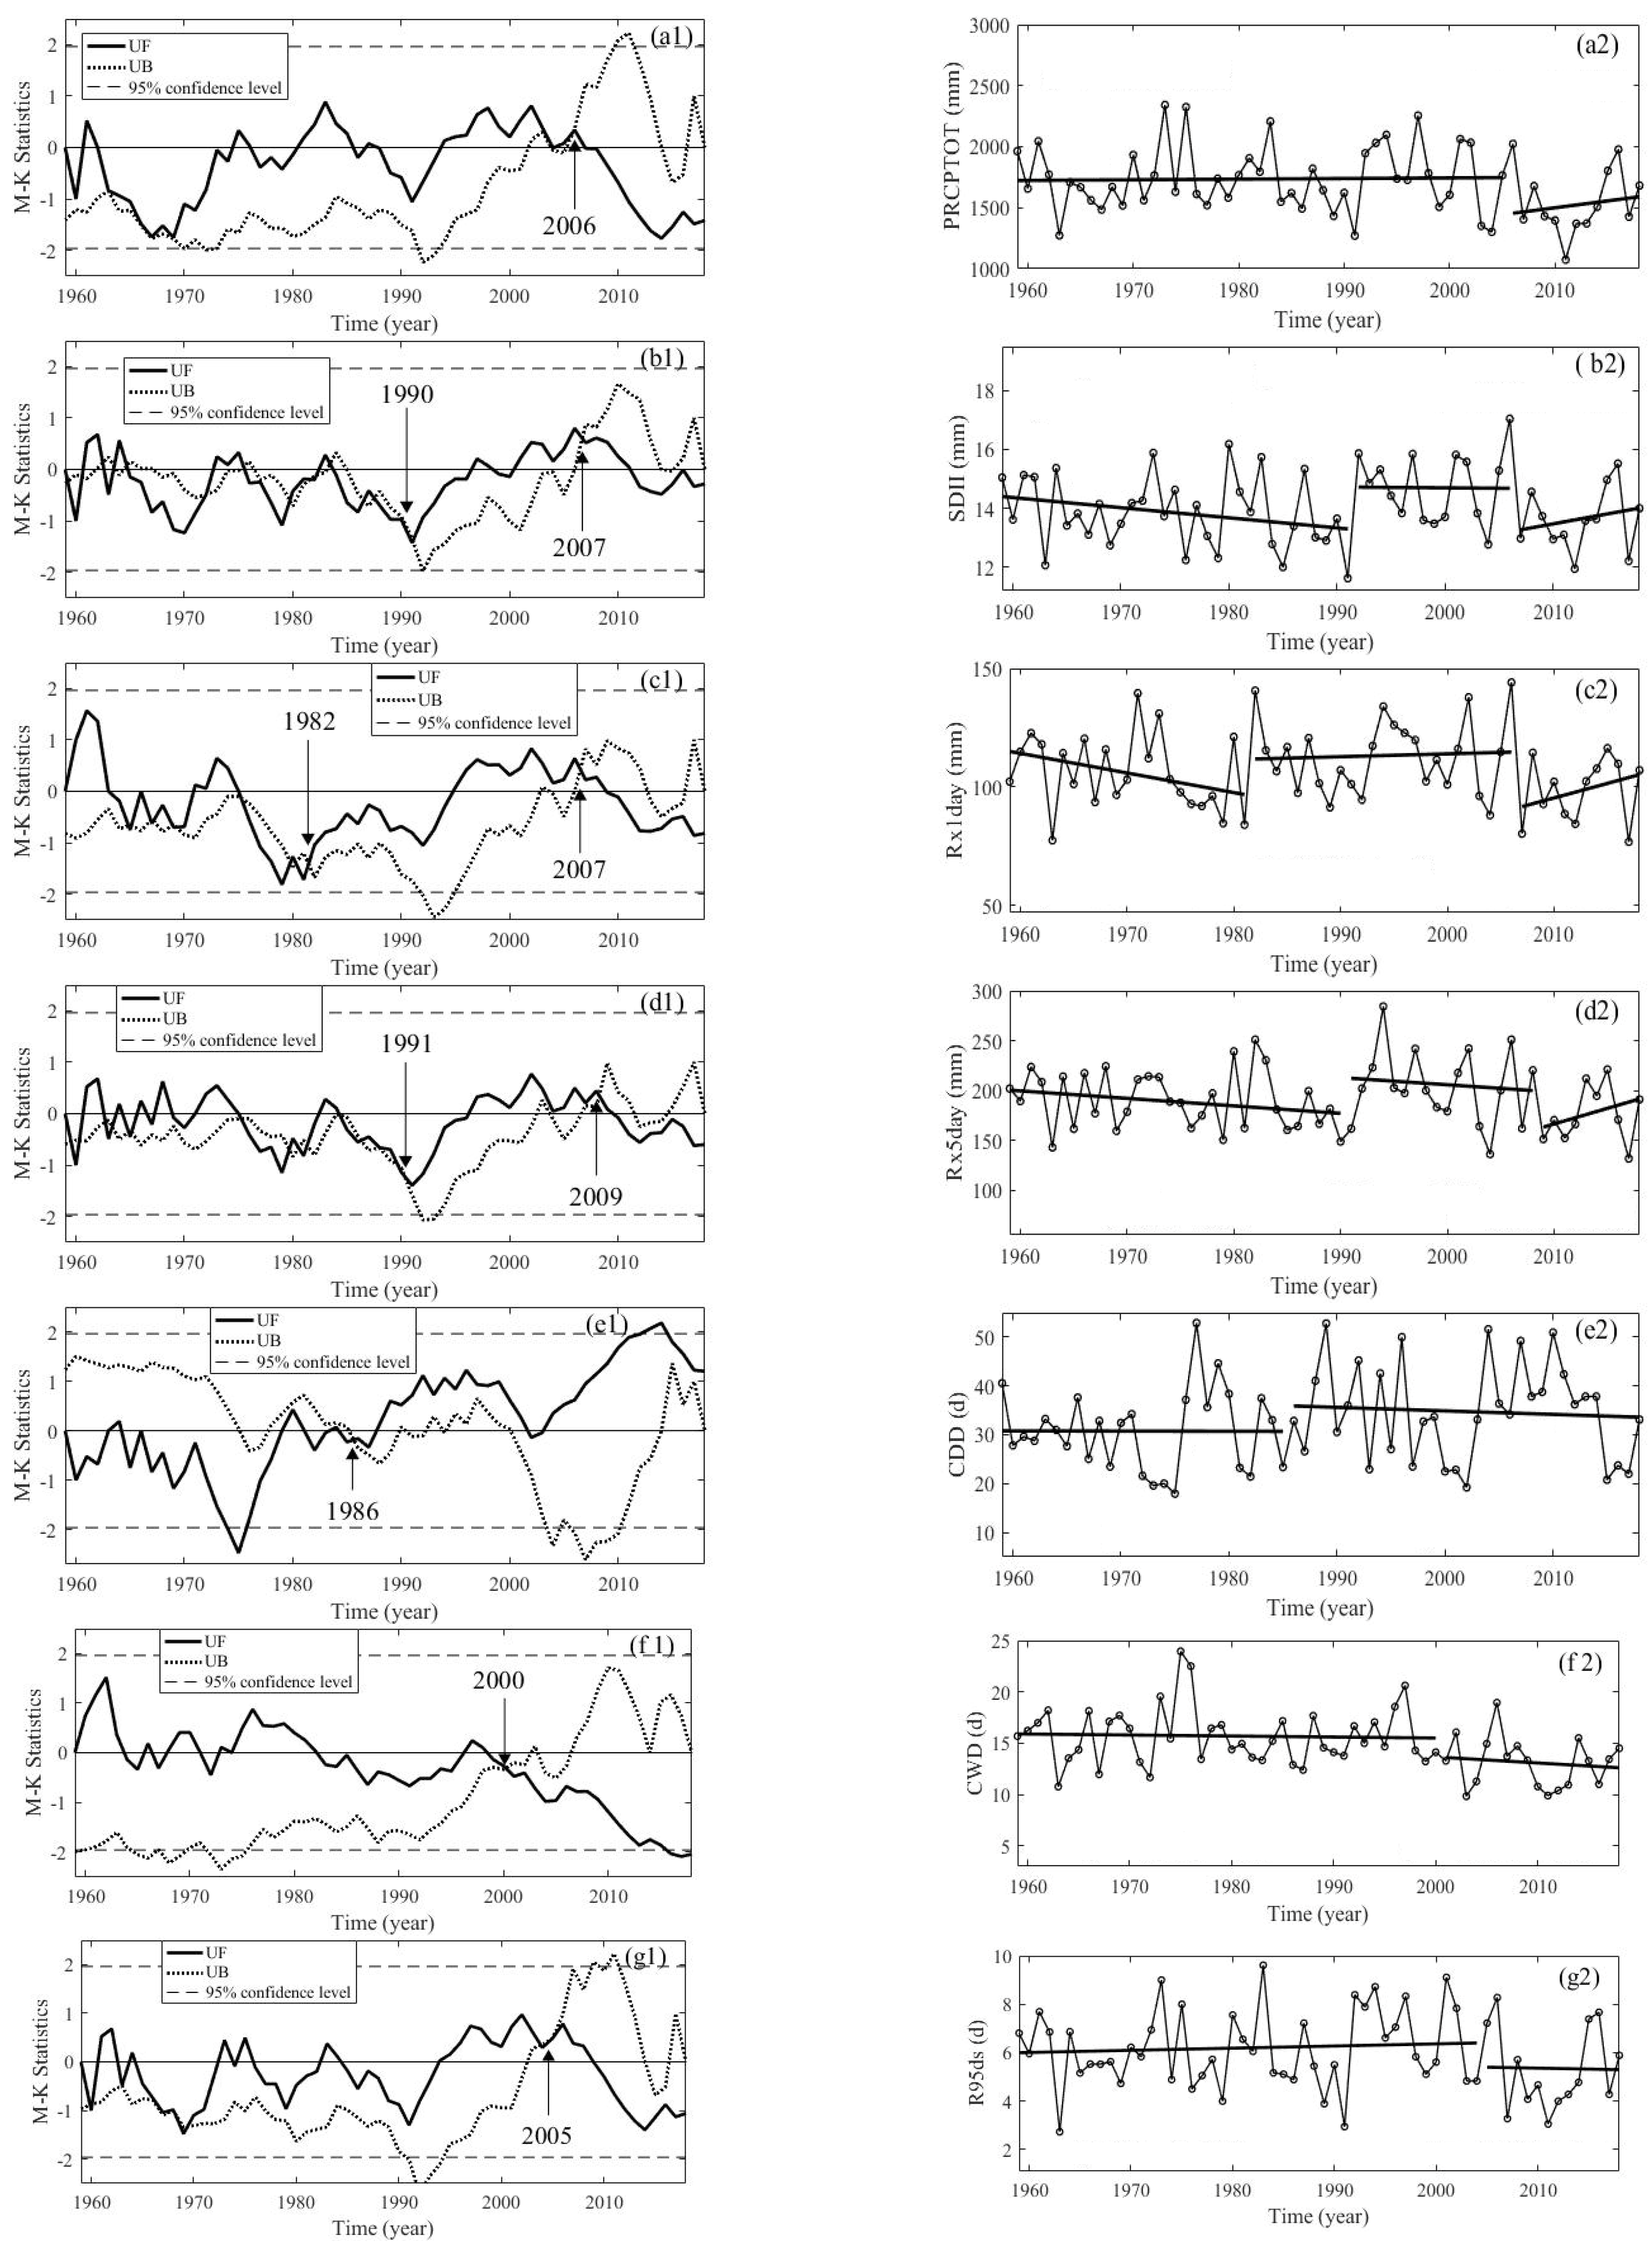
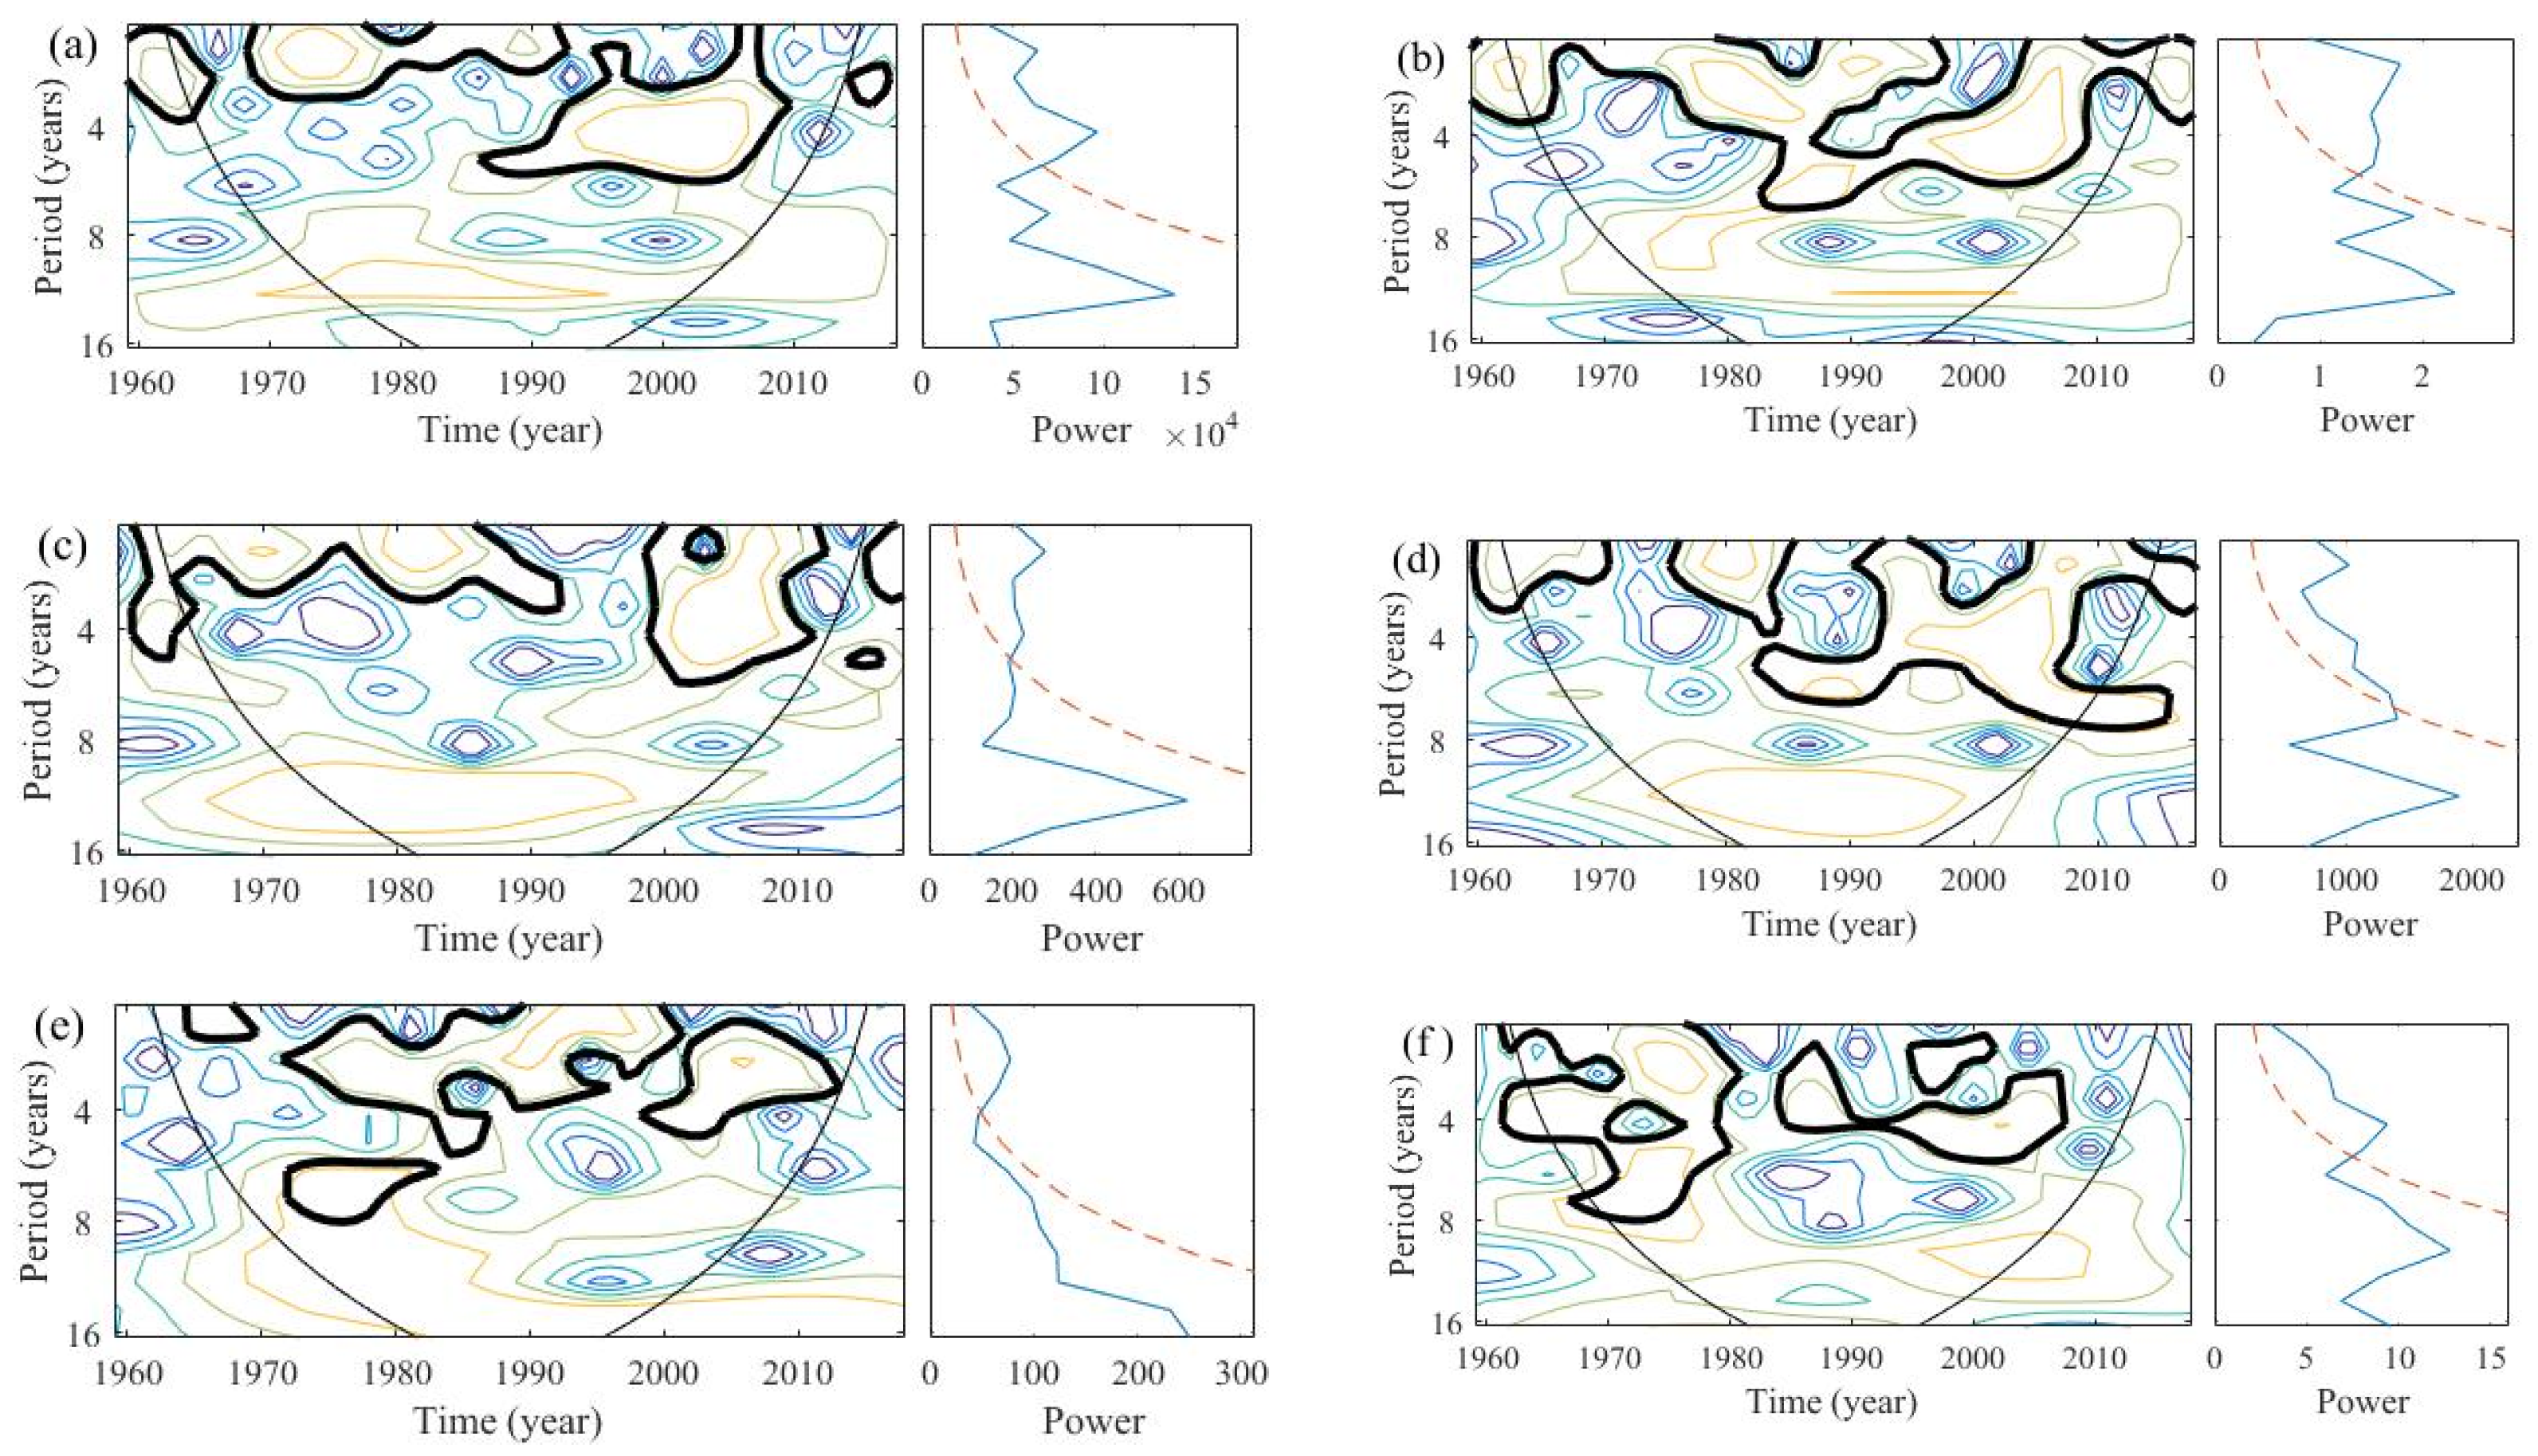
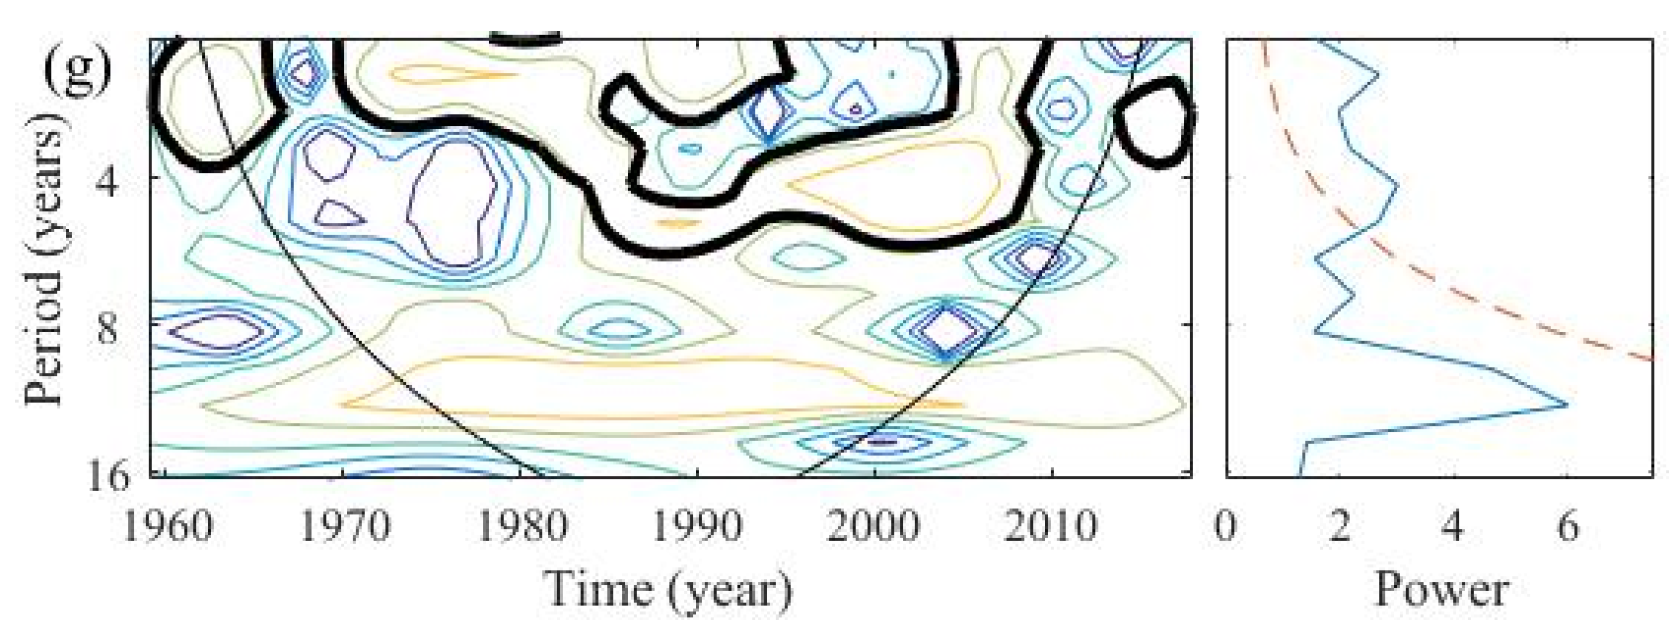
M-K trend tests showed that there were mutations in all precipitation index sequences, and mutation points were mainly concentrated in 1986–1991 and 2005–2010. Change amplitude after mutation was generally larger than that before mutation. Continuous wavelet transformation results showed that each precipitation index had a significant oscillation period of 2–4 year in most of the time domain.
(3)
There were some spatial differences in the temporal changes of each precipitation index, and CWD declined significantly. R95ds distribution within the year showed a significantly positive correlation with monthly precipitation.

Author Contributions

Conceptualization, Z.L. (Zhanming Liu) and H.Y.; data curation, Z.L. (Zhanming Liu), H.Y. and Z.L. (Zhaoxiong Liang); funding acquisition, Z.L. (Zhanming Liu), H.Y. and X.W.; investigation, X.W.; methodology, Z.L. (Zhanming Liu); software, Z.L. (Zhanming Liu) and Z.L. (Zhaoxiong Liang); validation, H.Y. and X.W.; formal analysis, Z.L. (Zhanming Liu); project administration, X.W.; resources, X.W.; visualization, H.Y.; writing—original draft preparation, Z.L. (Zhanming Liu); writing—review and editing, H.Y.; All authors have read and agreed to the published version of the manuscript.

Funding

This study was financially supported by Youth Fund of Humanistic and Social Sciences of the Ministry of Education of PRC in 2017 (No. 17YJCZH114); Foshan University Interdisciplinary Program in Art and Science (No. 2019xw102), the Belt and Road Special Foundation of the State Key Laboratory of Hydrology-Water Resources and Hydraulic Engineering (No. 2019491611), and Foshan University Lingnan Visiting Professor scheme.

Institutional Review Board Statement

Not applicable.

Informed Consent Statement

Not applicable.

Data Availability Statement

Not applicable.

Acknowledgments

The authors thank the National Climate Central (NCC), China Meteorological Administration (CMA) for providing the data for this study.

Conflicts of Interest

The authors declare no conflict of interest.

References

  1. IPCC. Climate Change 2021: The Physical Science Basis [eb/ol]. Available online: https://www.Ipcc.Ch/report/ar6/wg1/ (accessed on 6 May 2022).
  2. Chen, Y.; Li, W.; Jiang, X. Detectable intensification of hourly and daily scale precipitation extremes across eastern china. J. Clim. 2021, 34, 1185–1201. [Google Scholar] [CrossRef]
  3. Wasko, C.; Nathan, R. Influence of changes in rainfall and soil moisture on trends in flooding. J. Hydrol. 2019, 575, 432–441. [Google Scholar] [CrossRef]
  4. Zhao, S.; Cong, D.; He, K.; Yang, H.; Qin, Z. Spatial-temporal variation of drought in china from 1982 to 2010 based on a modified temperature vegetation drought index (mtvdi). Sci. Rep. 2017, 7, 17473. [Google Scholar] [CrossRef] [PubMed] [Green Version]
  5. Lai, P.; Zhang, M.; Ge, Z.; Hao, B.; Song, Z.; Huang, J.; Ma, M.; Yang, H.; Han, X. Responses of seasonal indicators to extreme droughts in southwest china. Remote Sens. 2020, 12, 818. [Google Scholar] [CrossRef] [Green Version]
  6. Yin, H.; Sun, Y. Characteristics of extreme temperature and precipitation in china in 2017 based on etccdi indices. Progress. Inquisitiones De Mutat. Clim. 2019, 15, 363–373. (In Chinese) [Google Scholar] [CrossRef]
  7. ETCCDI. Etccdi Climate Change Indices: Definitions of the 27 Core Indices [eb/ol]. Available online: http://etccdi.Pacificclimate.Org/list_27_indices.Shtml (accessed on 23 April 2022).
  8. Zhang, X.B.; Alexander, L.; Hegerl, G.C. Indices for monitoring changes in extremes based on daily temperature and precipitation data. WIREs Clim. Chang. 2011, 2, 851–870. [Google Scholar] [CrossRef]
  9. Li, Y.; Huang, J.J.; Hu, M.; Yang, H.; Tanaka, K. Design of low impact development in the urban context considering hydrological performance and life-cycle cost. J. Flood Risk Manag. 2020, 13, e12625. [Google Scholar] [CrossRef]
  10. Liu, Y.; Huang, X.; Yang, H. An integrated approach to investigate the coupling coordination between urbanization and flood disasters in china from 2001 to 2018. J. Clean. Prod. 2022, 375, 134191. [Google Scholar] [CrossRef]
  11. Hu, M.; Zhang, X.; Li, Y.; Yang, H.; Tanka, K. Flood mitigation performance of low impact development technologies under different storms for retrofitting an urbanized area. J. Clean. Prod. 2019, 222, 373–380. [Google Scholar] [CrossRef]
  12. Groisman, P.Y.; Karl, T.R.; Easterling, D.R. Changes in the probability of heavy precipitation: Important indicators of climatic change. Clim. Change 1999, 42, 243–283. [Google Scholar] [CrossRef]
  13. Alexander, L.V.; Zhang, X.; Peterson, T.C. Global observed changes in daily climate extremes of temperature and precipitation. J. Geophys. Res. Atmos. 2006, 111, D05109. [Google Scholar] [CrossRef] [Green Version]
  14. IPCC. Summary for Policymakers. Climate Change 2014: Impacts, Adaptation, and Vulnerability. Part A: Global and Sectoral Aspects; Cambridge University Press: Cambridge, UK; New York, NY, USA, 2014. [Google Scholar]
  15. IPCC. Summary for Policymakers. Climate Change 2013: The Physical Science Basis; Cambridge University Press: Cambridge, UK; New York, NY, USA, 2013. [Google Scholar]
  16. Li, W.; Chen, Y. Detectability of the trend in precipitation characteristics over china from 1961 to 2017. Int. J. Climatol. 2021, 41, E1980–E1991. [Google Scholar] [CrossRef]
  17. He, B.; Zhai, P. Characteristics of the persistent and non-persistent extreme precipitation in china from 1961 to 2016. Clim. Change. Res. 2018, 14, 437–444. [Google Scholar] [CrossRef]
  18. Ma, S.; Zhou, T.; Stone, D. Detectable anthropogenic shift toward heavy precipitation over eastern china. J. Clim. 2017, 30, 1381–1396. [Google Scholar] [CrossRef] [Green Version]
  19. Zheng, J.; Fan, J.; Zhang, F. Spatiotemporal trends of temperature and precipitation extremes across contrasting climatic zones of china during 1956–2015. Theor. Appl. Climatol. 2019, 138, 1877–1897. [Google Scholar] [CrossRef]
  20. Wu, W.B.; You, Q.L.; Wang, D. Characteristics of extreme precipitation in china based on homogenized precipitation data. J. Nat. Resour. 2016, 31, 1015–1026. (In Chinese) [Google Scholar] [CrossRef]
  21. Wang, Y.; Zhou, B.; Qin, D. Changes in mean and extreme temperature and precipitation over the arid region of northwestern china: Observation and projection. Adv. Atmos. Sci. 2017, 34, 289–305. [Google Scholar] [CrossRef]
  22. Ma, S.M.; Zhou, T.J.; Dai, A.G. Observed changes in the distributions of daily precipitation frequency and amount over china from 1960 to 2013. J. Clim. 2015, 28, 6960–6978. [Google Scholar] [CrossRef]
  23. Zhai, P.; Zhang, X.; Wan, H. Trends in total precipitation and frequency of daily precipitation extremes over china. J. Clim. 2005, 18, 1096–1108. [Google Scholar] [CrossRef]
  24. Gao, T.; Xie, L. Study on progress of the trends and physical causes of extreme precipitation in china during the last 50 years. Adv. Earth Sci. 2014, 29, 577–589. (In Chinese) [Google Scholar] [CrossRef]
  25. Zhou, B.; Xu, Y.; Wu, J. Changes in temperature and precipitation extreme indices over china: Analysis of a high resolution grid dataset. Int. J. Climatol. 2016, 36, 1051–1066. [Google Scholar] [CrossRef]
  26. Jiang, J.; Zhou, T.; Zhang, W. Temporal and spatial variations of extreme precipitation in the main river basins of china in the past 60 years. Chin. J. Atmos. Sci. 2022, 46, 707–724. (In Chinese) [Google Scholar] [CrossRef]
  27. Sun, H.; Zhang, X.; Luo, Z. Analyses on characteristics of extreme precipitation indices in the yangtze river basin in the past 53 years. Resour. Environ. Yangtze Basin 2018, 27, 1879–1890. (In Chinese) [Google Scholar] [CrossRef]
  28. Dong, Q.; Chen, X.; Chen, T. Characteristics and changes of extreme precipitation in the yellow–huaihe and yangtze–huaihe rivers basins, china. J. Clim. 2011, 24, 3781–3795. (In Chinese) [Google Scholar] [CrossRef]
  29. Su, B.D.; Xiao, B.; Zhu, D.M.; Jiang, T. Trends in frequency of precipitation extremes in the yangtze river basin, china: 1960–2003. Hydrol. Sci. J. -J. Des Sci. Hydrol. 2005, 50, 479–492. [Google Scholar] [CrossRef]
  30. Ma, J.; Gao, Y. Analysis of annual precipitation and extreme precipitation change in the upper yellow river basin in recent 50 years. Plateau Meteorol. 2019, 38, 124–135. (In Chinese) [Google Scholar] [CrossRef]
  31. Hu, Y.; Maskey, S.; Uhlenbrook, S. Trends in temperature and rainfall extremes in the yellow river source region, China. Clim. Change 2012, 110, 403–429. [Google Scholar] [CrossRef] [Green Version]
  32. Zhang, Q.; Singh, V.P.; Peng, J. Spatial-temporal changes of precipitation structure across the pearl river basin, China. J. Hydrol. 2012, 440, 113–122. (In Chinese) [Google Scholar] [CrossRef]
  33. Yang, T.; Shao, Q.; Hao, Z. Regional frequency analysis and spatio-temporal pattern characterization of rainfall extremes in the pearl river basin, china. J. Hydrol. 2010, 380, 386–405. (In Chinese) [Google Scholar] [CrossRef]
  34. Xia, J.; She, D.; Zhang, Y. Spatio-temporal trend and statistical distribution of extreme precipitation events in huaihe river basin during 1960–2009. J. Geogr. Sci. 2012, 22, 195–208. [Google Scholar] [CrossRef]
  35. Pan, X.; Yin, Y.; Wang, X. Spatio–temporal characteristics of the occurrence timing of extreme precipitation in the huai river basin from 1960 to 2014. Plateau Meteorol. 2019, 38, 377–385. (In Chinese) [Google Scholar] [CrossRef]
  36. Xi, Z.; Yang, X.; Liu, Y. Characteristics of extreme precipitation change from 1961 to 2017 in Songliao Basin. Res. Soil Water Conserv. 2019, 26, 199–203, 212. (In Chinese) [Google Scholar] [CrossRef]
  37. IPCC. The Physical Science Basis. Contribution of Working Group I to the Sixth Assessment Report of the Intergovernmental Panel on Climate Change; Masson-Delmotte, V., Zhai, P.A., Pirani, S.L., Connors, C., Péan, S., Berger, N., Caud, Y., Chen, L., Goldfarb, M.I., Gomis, M., Eds.; Cambridge University Press: Cambridge, UK; New York, NY, USA, 2021; p. 2391. [Google Scholar]
  38. IPCC, C.C. The Physical Science Basis. Contribution of Working Group I to the Fourth Assessment Report of the Intergovernmental Panel on Climate Change; Cambridge University Press: Cambridge UK; New York, NY, USA, 2007; pp. 113–119. [Google Scholar]
  39. Wu, C.; Xian, Z.; Huang, G. Meteorological drought in the beijiang river basin, South China: Current observations and future projections. Stoch. Environ. Res. Risk Assess. 2016, 30, 1821–1834. [Google Scholar] [CrossRef]
  40. Liu, Z.; Xu, D.; Wei, X.; Wang, X.; Liang, Z.; Jiang, X. Variation characteristics of the precipitation structure during the rainy season in the beijiang river basin, China. Trop. Geogr. 2020, 40, 145–153. (In Chinese) [Google Scholar] [CrossRef]
  41. Wen, K.; Song, L. The Meteorology Disaster Almanac over China (Guangdong); Wen, K., Song, L., Eds.; China Meteorological Press: Beijing, China, 2007; Chapter 1: Rainstorms and floods; pp. 13–115. (In Chinese) [Google Scholar]
  42. Liu, Y.; Hong, G. Drought and Water-logging New Characteristic Analysis in Beijing River Basin During Flooding Season and Future Forecasting. Pearl River 2008, 39, 21–25. [Google Scholar]
  43. Li, J. Analysis of “2012 6” rainstorm flood in Lianjiang River Basin. Pearl River 2013, 34, 26–27. [Google Scholar] [CrossRef]
  44. Wen, K.; Song, L. The Meteorology Disaster Almanac over China (Guangdong); Wen, K., Song, L., Eds.; China Meteorological Press: Beijing, China, 2007; Chapter 3: Drought disaster; pp. 203–207. (In Chinese) [Google Scholar]
  45. Zhang, Q.; Zhou, Y.; Vijay, P. Scaling and clustering effects of extreme precipitation distributions. J. Hydrol. 2012, 454, 187–194. [Google Scholar] [CrossRef]
  46. Burn, D.; Hag Elnur, M. Detection of hydrologic trends and variability. J. Hydrol. 2002, 255, 107–122. [Google Scholar] [CrossRef]
  47. Lamchin, M.; Lee, W.; Jeon, S.; Wang, S.; Lim, C.; Song, C.; Sung, M. Long-term trend and correlation between vegetation greenness and climate variables in asia based on satellite data. Sci. Total Environ. 2018, 618, 1089–1095. [Google Scholar] [CrossRef]
  48. Wang, J. Determining the most accurate program for the mann-kendall method in detecting climate mutation. Theor. Appl. Climatol. 2020, 142, 847–854. [Google Scholar] [CrossRef]
  49. Phuong, D.N.D.; Tram, V.N.Q.; Nhat, T.T. Hydro-meteorological trend analysis using the mann-kendall and innovative-sen methodologies: A case study. Int. J. Glob. Warm. 2020, 20, 145–164. [Google Scholar] [CrossRef]
  50. Sa’adi, Z.; Shahid, S.; Ismail, T. Trends analysis of rainfall and rainfall extremes in sarawak, malaysia using modified mann-kendall test. Meteorol. Atmos. Phys. 2019, 131, 263–277. [Google Scholar] [CrossRef]
  51. Wang, F.; Shao, W.; Yu, H. Re-evaluation of the power of the mann-kendall test for detecting monotonic trends in hydrometeorological time series. Front. Earth Sci. 2020, 8, e14. [Google Scholar] [CrossRef]
  52. He, Q.; Gu, Y.; Zhang, M. Spatiotemporal trends of pm2.5 concentrations in central china from 2003 to 2018 based on maiac-derived high-resolution data. Environ. Int. 2020, 137, 105536. [Google Scholar] [CrossRef]
  53. Tucker, C.J.; Newcomb, W.W.; Los, S.O. Mean and inter-year variation of growing-season normalized difference vegetation index for the sahel 1981-1989. Int. J. Remote Sens. 1991, 12, 1133–1135. [Google Scholar] [CrossRef]
  54. Chen, X.; Yin, L.; Fan, Y. Temporal evolution characteristics of pm2.5 concentration based on continuous wavelet transform. Sci. Total Environ. 2020, 699, 134244. [Google Scholar] [CrossRef] [PubMed]
  55. Lapins, S.; Roman, D.C.; Rougier, J. An examination of the continuous wavelet transform for volcano-seismic spectral analysis. J. Volcanol. Geotherm. Res. 2020, 389, 106728. [Google Scholar] [CrossRef]
  56. Peng, J.; Luo, X.X.; Liu, F.; Zhang, Z.H. Analysing the influences of enso and pdo on water discharge from the yangtze river into the sea. Hydrol. Process. 2018, 32, 1090–1103. [Google Scholar] [CrossRef]
  57. Sagaidachnyi, A.; Fomin, A.; Usanov, D.; Skripal, A. Real-time technique for conversion of skin temperature into skin blood flow: Human skin as a low-pass filter for thermal waves. Comput. Methods Biomech. Biomed. Eng. 2019, 22, 1009–1019. [Google Scholar] [CrossRef]
  58. Shao, Y.; Ma, Z.; Wang, J.; Bi, J. Estimating daily ground-level pm2.5 in china with random-forest-based spatiotemporal kriging. Sci. Total Environ. 2020, 740, 139761. [Google Scholar] [CrossRef]
  59. Shukla, K.; Kumar, P.; Mann, G.; Khare, M. Mapping spatial distribution of particulate matter using kriging and inverse distance weighting at supersites of megacity delhi. Sustain. Cities Soc. 2020, 54, 101997. [Google Scholar] [CrossRef]
  60. Li, S.; Chen, X.; Lai, C. Spatio-temporal change characteristics of precipitation in the pearl river basin in recent 40 years. J. China Hydrol. 2016, 36, 31–37. (in Chinese). [Google Scholar] [CrossRef]
  61. Milly, P.C.; Betancourt, J.; Falkenmark, M. Climate change. Stationarity is dead: Whither water management? Science 2008, 319, 573–574. [Google Scholar] [CrossRef] [PubMed]
  62. Hao, W.; Shao, Q.; Hao, Z. Non-stationary modelling of extreme precipitation by climate indices during rainy season in hanjiang river basin, china. Int. J. Climatol. 2019, 39, 4154–4169. [Google Scholar] [CrossRef]
  63. Romero, L.; Perez-Sanchez, M.; Lopez, P. Improvement of sustainability indicators when traditional water management changes: A case study in alicante (spain). AIMS Environ. Sci. 2017, 4, 502–522. [Google Scholar] [CrossRef]
  64. He, C.; Chen, F.; Wang, Y. Flood frequency analysis of manas river basin in china under non-stationary condition. J. Flood Risk Manag. 2021, 14, 12745. [Google Scholar] [CrossRef]
  65. Faulkner, D.; Warren, S.; Spencer, P. Can we still predict the future from the past? Implementing non-stationary flood frequency analysis in the uk. J. Flood Risk Manag. 2020, 13, 17–31. [Google Scholar] [CrossRef] [Green Version]
  66. Slater, L.J.; Anderson, B.; Buechel, M. Non-stationary weather and water extremes: A review of methods for their detection, attribution, and management. Hydrol. Earth Syst. Sci. 2021, 25, 3897–3935. [Google Scholar] [CrossRef]
  67. Ansa, T.S.; Chithra, N.R.; Thampi, S.G. Assessment of non-stationarity and uncertainty in precipitation extremes of a river basin under climate change. Environ. Model. Assess. 2021, 26, 295–312. [Google Scholar] [CrossRef]
  68. Luo, Y.; Gu, R. The pattern and evolutional trend of Chinese manufacturing’s spatial agglomeration: An empirical analysis based on data from 1980 to 2011. Econ. Geogr. 2014, 34, 82–89. (In Chinese) [Google Scholar]
  69. Qiao, J.; Shi, H. China’s industrial structure and its changes since 1990s. Hum. Geogr. 2007, 22, 55–59. (In Chinese) [Google Scholar] [CrossRef]
  70. He, C.F.; Chen, T.M.; Mao, X.Y.; Zhou, Y. Economic transition, urbanization and population redistribution in china. Habitat Int. 2016, 51, 39–47. [Google Scholar] [CrossRef]
  71. Yang, H. China must continue the momentum of green law. Nature 2014, 509, 535–537. [Google Scholar] [CrossRef] [Green Version]
  72. Li, L.; Huang, X.; Wu, D.; Wang, Z.; Yang, H. Optimization of ecological security patterns considering both natural and social disturbances in china’s largest urban agglomeration. Ecol. Eng. 2022, 19, 106647. [Google Scholar] [CrossRef]
  73. Liu, Z.; Yang, H.; Wei, X. Spatiotemporal variation in precipitation during rainy season in beibu gulf, south china, from 1961 to 2016. Water 2020, 12, 1170. [Google Scholar] [CrossRef] [Green Version]
  74. Liu, Z.; Yang, H.; Wei, X. Spatiotemporal variation in relative humidity in guangdong, china, from 1959 to 2017. Water 2020, 12, 3576. [Google Scholar] [CrossRef]
  75. Strokal, M.; Janssen, A.; Chen, X.; Kroeze, C.; Li, F.; Ma, L.; Yu, H.; Zhang, F.; Wang, M. Green agriculture and blue water in china: Reintegrating crop and livestock production for clean water. Front. Agric. Sci. Eng. 2021, 8, 72–80. [Google Scholar] [CrossRef]
  76. Yang, H.; Flower, R.J.; Thompson, J.R. China’s new leaders offer great hope. Nature 2013, 493, 163. [Google Scholar] [CrossRef] [Green Version]
  77. Yang, H.; Huang, X.; Thompson, J.R.; Flower, R.J. Enforcement key to china’s environment. Science 2015, 347, 834–835. [Google Scholar] [CrossRef]
  78. Yang, H.; Huang, X.; Hu, J.; Thompson, J.R.; Flower, R.J. Achievements, challenges and global implications of china’s carbon neutral pledge. Front. Environ. Sci. Eng. 2022, 16, 111. [Google Scholar] [CrossRef]
  79. Wang, H.; Feng, J.; Fan, Z. Analysis of flood risk in temporary flood storage and detention area of feilaixia reservoir area. China Rural. Water Hydropower 2022, 41, 111–116. (In Chinese) [Google Scholar] [CrossRef]
  80. Chen, S.; Xie, L.; Tao, D. Study on heavy metal migration characteristics with runoff sediment of polymetallic mine in beijiang river basin. Pearl River 2012, 43, 59–63. (In Chinese) [Google Scholar] [CrossRef]
  81. Yang, H.; Ma, M.; Flower, R.J.; Thompson, J.R.; Ge, W. Preserve precambrian fossil heritage from mining. Nat. Ecol. Evol. 2017, 1, 1048–1049. [Google Scholar] [CrossRef] [PubMed]
  82. Li, J.; Luo, X.; Zhu, S. Effect of lucc on hydrological response in beijiang basin. Yangtze River 2020, 51, 89–96. (In Chinese) [Google Scholar] [CrossRef]
  83. Zhang, X.; Hu, M.; Guo, X.; Yang, H.; Zhang, Z.; Zhang, K. Effects of topographic factors on runoff and soil loss in southwest china. Catena 2018, 160, 394–402. [Google Scholar] [CrossRef]
  84. Xiao, X.; Zheng, Z. New power systems dominated by renewable energy towards the goal of emission peak & carbon neutrality: Contribution, key techniques, and challenges. Adv. Eng. Sci. 2022, 54, 47–59. (In Chinese) [Google Scholar] [CrossRef]
  85. Yang, Y.; Zhang, C. Key aspects of the future hydropower development in China. Hydropower New Energy 2021, 35, 1–7. (In Chinese) [Google Scholar] [CrossRef]
  86. Yang, Y.; Wang, L.; Sun, Z. The complementary between wind power, solar power and hydropower is the only way to neutralize carbon in china. Hydropower Pumped Storage 2021, 7, 15–19. (In Chinese) [Google Scholar] [CrossRef]
  87. Jacobson, M.Z.; Delucchi, M.A.; Cameron, M.A. Low-cost solution to the grid reliability problem with 100% penetration of intermittent wind, water, and solar for all purposes. Proc. Natl. Acad. Sci. USA 2015, 112, 15060–15065. [Google Scholar] [CrossRef] [Green Version]
  88. Rahman, M.M.; Oni, O.A.; Gemechu, E.; Kumar, A. Assessment of energy storage technologies: A review. Energy Convers. Manag. 2020, 223, 113295. [Google Scholar] [CrossRef]
  89. Yu, G.; Hao, T.; Zhu, J. Discussion on action strategies of china’s carbon peak and carbon neutrality. Bull. Chin. Acad. Sci. 2022, 37, 423–434. (In Chinese) [Google Scholar] [CrossRef]
  90. Zhou, J.; Du, X.; Zhou, X. Study on hydropower development strategy for new power systems. J. Hydroelectr. Eng. 2022, 41, 106–115. (In Chinese) [Google Scholar] [CrossRef]
  91. Yang, Z.; Wei, C.; Liu, D.; Lin, Q.; Huang, Y.; Wang, C.; Ji, D.; Ma, J.; Yang, H. The influence of hydraulic characteristics on algal bloom in three gorges reservoir, china: A combination of cultural experiments and field monitoring. Water Res. 2022, 211, 118030. [Google Scholar] [CrossRef] [PubMed]
  92. Yang, H.; Xie, P.; Ni, L.; Flower, R.J. Pollution in the yangtze. Science 2012, 337, 410. [Google Scholar] [CrossRef] [PubMed]
  93. Hirsch, P.E.; Eloranta, A.P.; Amundsen, P.-A.; Brabrand, Å.; Charmasson, J.; Helland, I.P.; Power, M.; Sánchez -Hernández, J.; Sandlund, O.T.; Sauterleute, J.F.; et al. Effects of water level regulation in alpine hydropower reservoirs: An ecosystem perspective with a special emphasis on fish. Hydrobiologia 2017, 794, 287–301. [Google Scholar] [CrossRef] [Green Version]
  94. Wu, X.; Wang, Z.; Xiang, X.; Yang, H.; Li, C.; Li, S.; Wu, L. Dynamic simulation of co2 flux in a hydropower reservoir in southwest china. J. Hydrol. 2022, 613, 128354. [Google Scholar] [CrossRef]
  95. Cheng, C. Function remolding of hydropower systems for carbon neutral and its key problems. Autom. Electr. Power Syst. 2021, 45, 29–36. (In Chinese) [Google Scholar] [CrossRef]
  96. Zheng, Q.; Jiang, L.; Xu, Y. Research progress and development suggestions of energy storage technology under background of carbon peak and carbon neutrality. Bull. Chin. Acad. Sci. 2022, 37, 529–540. (In Chinese) [Google Scholar] [CrossRef]
  97. Zhou, J.; Li, S.; Gao, J. Technical and economic analysis of water energy storage to promote new energy development. J. Hydroelectr. Eng. 2022, 41, 1–10. (In Chinese) [Google Scholar] [CrossRef]
  98. Ding, T.; Gao, H. Atmospheric circulation in East Asia in summer 2019 and its influence on climate of China. Meteor. Mon. 2020, 46, 129–137. [Google Scholar] [CrossRef]
  99. Gao, H.; Jiang, W.; Li, W. Changed relationships between the East Asian summer monsoon circulations and the summer rainfall in Eastern China. J. Meteor. Res. 2014, 28, 1075–1084. [Google Scholar] [CrossRef]
  100. Lin, Z.; Lin, K.; Li, Y.; Lin, M. A study of the development process of a mesoscale convective system ahead of a upper-level trough and its mechanism. Acta Meteorol. Sin. 2011, 69, 770–781. [Google Scholar] [CrossRef]
  101. Chen, S.; Sun, G.; Zeng, D. Study of atmospheric low-frequency system and strong precipitation processes in Southern China. Plateau Meteorol. 2017, 36, 480–490. [Google Scholar] [CrossRef]
  102. Paek, H.; Yu, J.; Zheng, F. Impacts of ENS0 diversity on the westem Pacific and North Pacific subtmpical highs during boreal summer. CliInate Dyn. 2016, 27, 211–221. [Google Scholar] [CrossRef]
  103. Lv, A.; Qu, B.; Jia, S. Influence of three phases of Eino-Southern Oscillation on daily precipitation regimes in China. Hydrol. Earth Syst. Sci. 2019, 23, 883–896. [Google Scholar] [CrossRef] [Green Version]
  104. Liu, Z.; Chen, Z.; Lu, J. Analysis of Correlation between the Spatio-Temporal Distribution of Precipitation in Beijiang River Basin and SST in Nino 3. J. Nat. Resour. 2013, 28, 786–798. [Google Scholar] [CrossRef]
  105. Liu, Z.; Chen, Z. Correlational study between the precipitation in the first rainy season in Guangdong Beijiang river basin and the global SST and teleconnections. Sci. Geogr. Sin. 2014, 34, 1239–1246. [Google Scholar] [CrossRef]
  106. Qian, W.; Jiang, N.; Du, J. Seven Anomalous Synoptic Patterns of Regional Heavy Rain in Eastern China. Meteorol. Mon. 2016, 42, 674–685. [Google Scholar] [CrossRef]
Figure 1. The location of the Beijiang River Basin in South China and 18 rain-gauge stations in this area.
Jmse 11 00073 g001
Figure 2. Spatial distribution of perennial mean of precipitation indexes PRCPTOT (a), SDII (b), Rx1day (c), Rx5day (d), CDD (e), CWD (f), and R95ds (g) in Beijiang River Basin.
Jmse 11 00073 g002aJmse 11 00073 g002b
Figure 3. Mann–Kendall test and linear trends of PRCPTOT (a1,a2), SDII (b1,b2), Rx1day (c1,c2), Rx5day (d1,d2), CDD (e1,e2), CWD (f1,f2), and R95ds (g1,g2). UF is forward data sequence Mann−Kendall statistics, and UB is reverse data sequence Mann−Kendall statistics.
Jmse 11 00073 g003
Figure 4. Spatial distribution of change trend of PRCPTOT (a), SDII (b), Rx1day (c), Rx5day (d), CDD (e), CWD (f), and R95ds (g) in Beijiang River Basin from 1959 to 2018.
Jmse 11 00073 g004aJmse 11 00073 g004b
Figure 5. Continuous wavelet transform of PRCPTOT (a), SDII (b), Rx1day (c), Rx5day (d), CDD (e), CWD (f), and R95ds (g). The closed areas of the black thick coils passed the standard red noise test at 95% confidence level. The square cone areas below the black thin solid lines were the cone of influence (COI) areas, and they were the areas where the edge effect of the wavelet transform data were more significant.
Jmse 11 00073 g005aJmse 11 00073 g005b
Figure 6. Annual distribution of R95ds and monthly precipitation in Beijiang River Basin from 1959 to 2018.
Jmse 11 00073 g006
Table 1. Information for seven precipitation indexes defined by ETCCDI.
IndexesDefinitionsUnits
PRCPTOTAnnual total precipitation.mm
SDIIThe ratio of annual precipitation to the number of precipitation days. The precipitation day is defined as the day with precipitation ≥ 1 mm.mm/d
Rx1dayMaximum 1-day precipitation in a year.mm
Rx5dayMaximum consecutive 5-day precipitation in a year.mm
CDDMaximum number of consecutive dry days of a year.
The dry day is defined as the day with precipitation < 1 mm.
d
CWDMaximum number of consecutive wet days of a year.
The wet day is defined as the day with precipitation ≥ 1 mm.
d
R95dsAnnual number of days with daily precipitation exceeding the 95th percentile threshold. The 95th percentile threshold is calculated based on the precipitation series of all wet days at each station.d
Table 2. Annual mean of precipitation indexes in Beijiang River Basin.
IndexesPRCPTOT
(mm)
SDII
(mm/d)
Rx1day
(mm)
Rx5day
(mm)
CDD
(d)
CWD
(d)
R95ds
(d)
Annual mean1696.814.02107.4191.833156
Table 3. Test results of change trend before and after the mutation points.
IndexesMutation YearBefore the MutationAfter the MutationThe Overall Trend
M-K StatisticsTrendAnnual MeanCVM-K StatisticsTrendAnnual MeanCVM-K StatisticsTrend
PRCPTOT20060.081737.50.1530.371549.50.174−1.27
SDII1990−1.4313.830.087−0.6414.750.080−0.28
2007−0.6414.750.0800.8213.600.080
Rx1day1982−1.72105.90.1490.02113.00.137−0.81
20070.02113.00.1370.8298.60.138
Rx5day1991−1.14190.10.150−0.42203.80.181−0.60
2009−0.42203.80.1810.98176.00.160
CDD1986−0.2330.80.272−0.3134.80.2821.20
CWD2001−0.3615.70.177−0.3413.10.188−2.54
R95ds20050.296.20.258−0.185.30.321−1.06
Note: “↑” denotes an increasing trend, and “↓” indicates a decreasing trend.
Table 4. Significant oscillation cycles and corresponding periods of continuous wavelet transforms of precipitation indexes in Beijiang River Basin.
IndexesSignificant Cycles (a)Corresponding PeriodsIndexesSignificant Cycles (a)Corresponding Periods
PRCPTOT2.1~3.8
2~3
2.7~5.2
1959–1965
1969–1992
1992–2009
SDII2~4
2~6
2.2~3.8
1959–1982
1983–2009
2010–2018
Rx1day2~3
2~4.5
1961–1989
1999–2011
Rx5day2~2.5
2~3
2~6
1960–1970
1976–1985
1992–2012
CDD2~2.3
2~4
2.2~4
1965–1968
1973–1999
2000–2012
CWD2~7
2.3~4.5
1961–1980
1984–2008
R95ds2~3.7
2~3
2~5
1959–1966
1970–1994
1987–2009
Disclaimer/Publisher’s Note: The statements, opinions and data contained in all publications are solely those of the individual author(s) and contributor(s) and not of MDPI and/or the editor(s). MDPI and/or the editor(s) disclaim responsibility for any injury to people or property resulting from any ideas, methods, instructions or products referred to in the content.

