
New Insights into Sea Turtle Propulsion and Their Cost of Transport Point to a Potential New Generation of High-Efficient Underwater Drones for Ocean Exploration


Abstract
:1. Introduction
2. Methods
2.1. Method Overview
2.2. CFD Calculations
2.3. Dye Visualisation
3. Results and Discussion
3.1. Results Overview
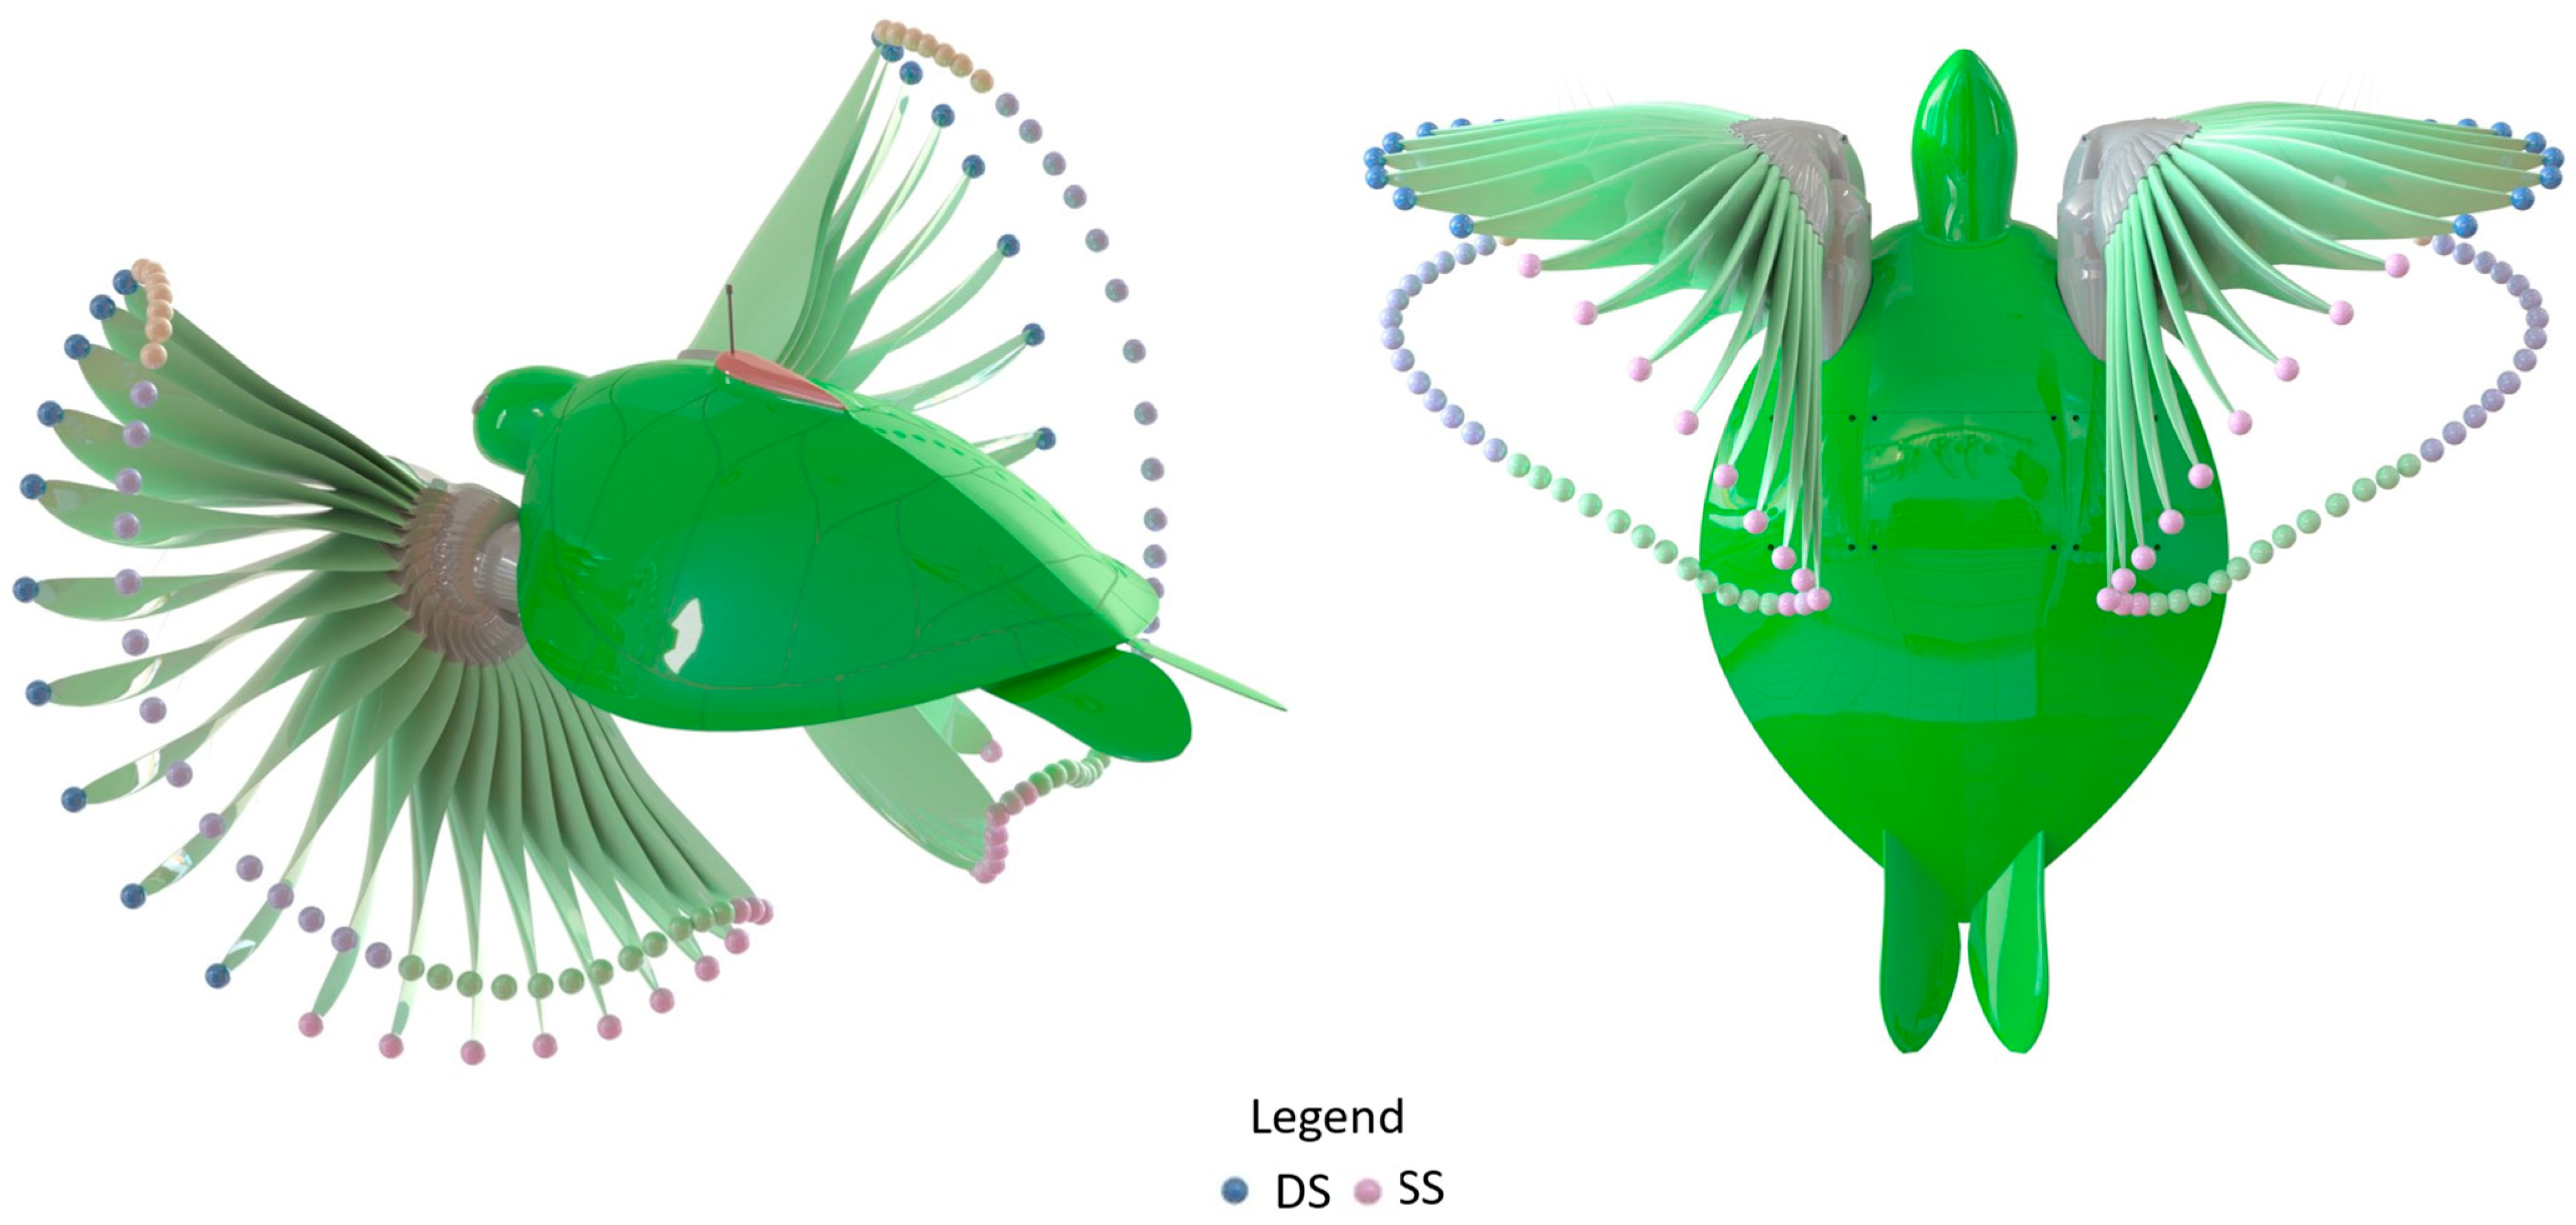
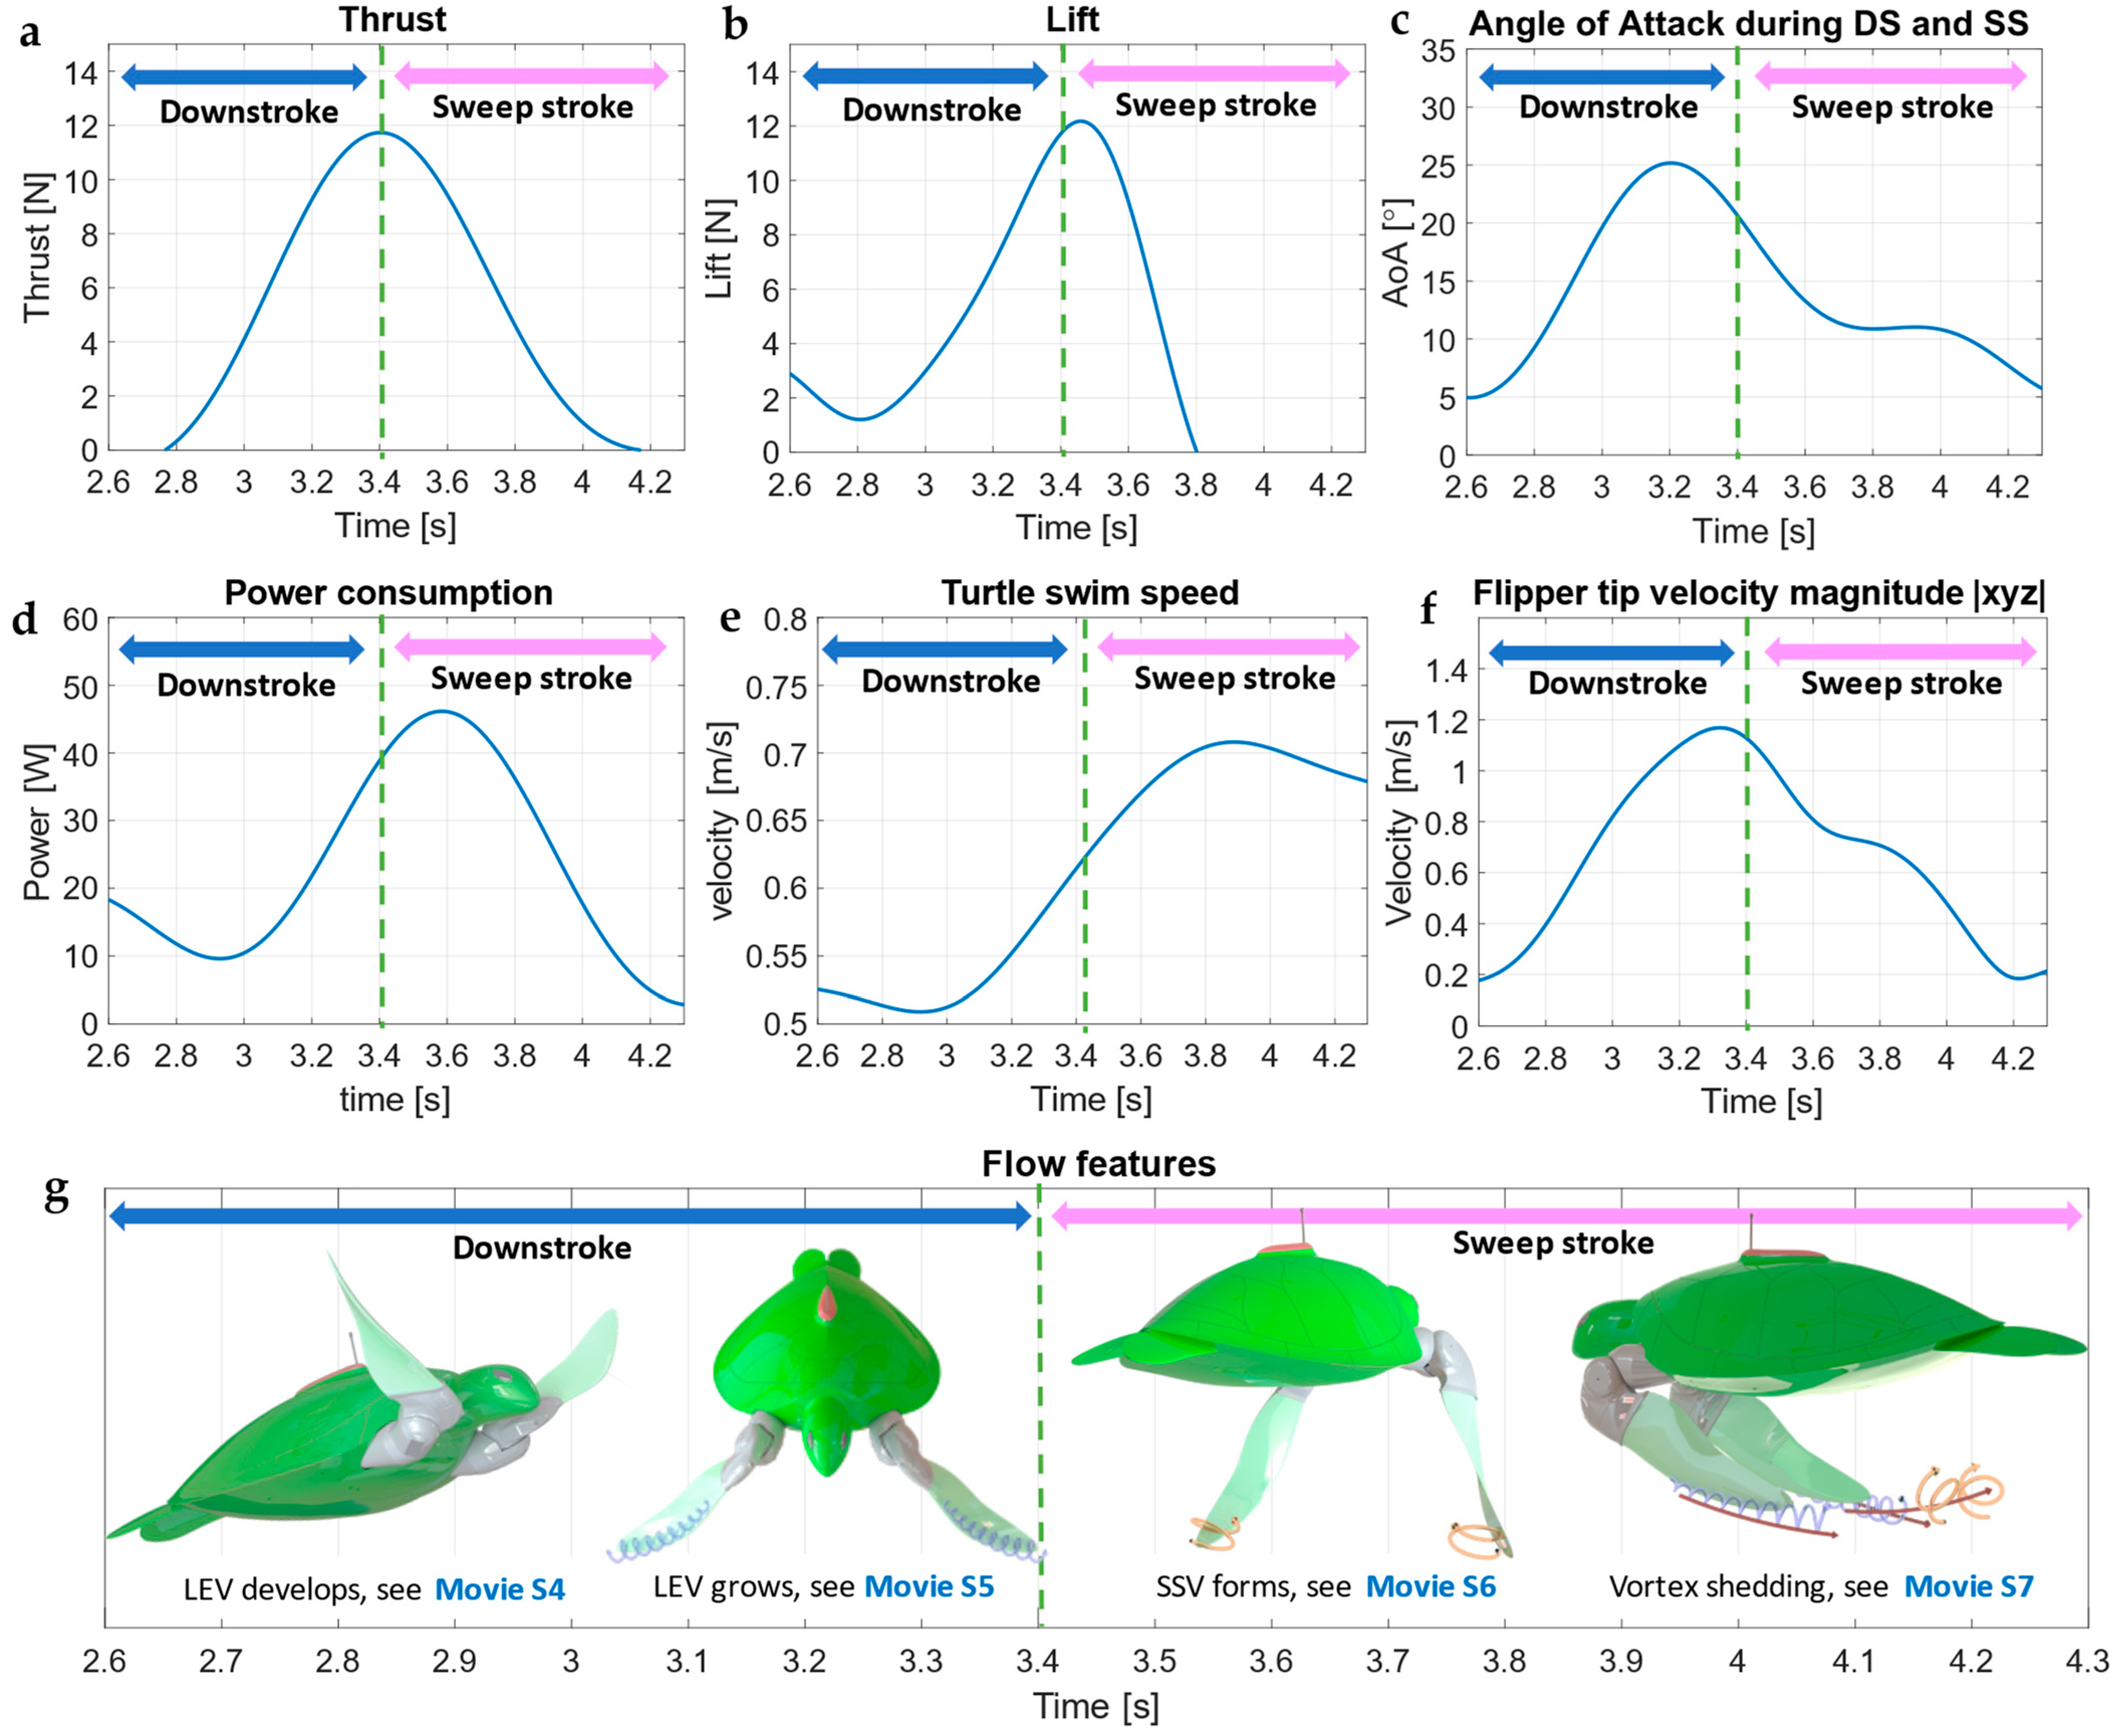
3.2. Flipper Angle of Attack (AoA)
3.3. Downstroke
3.4. Sweep Stroke
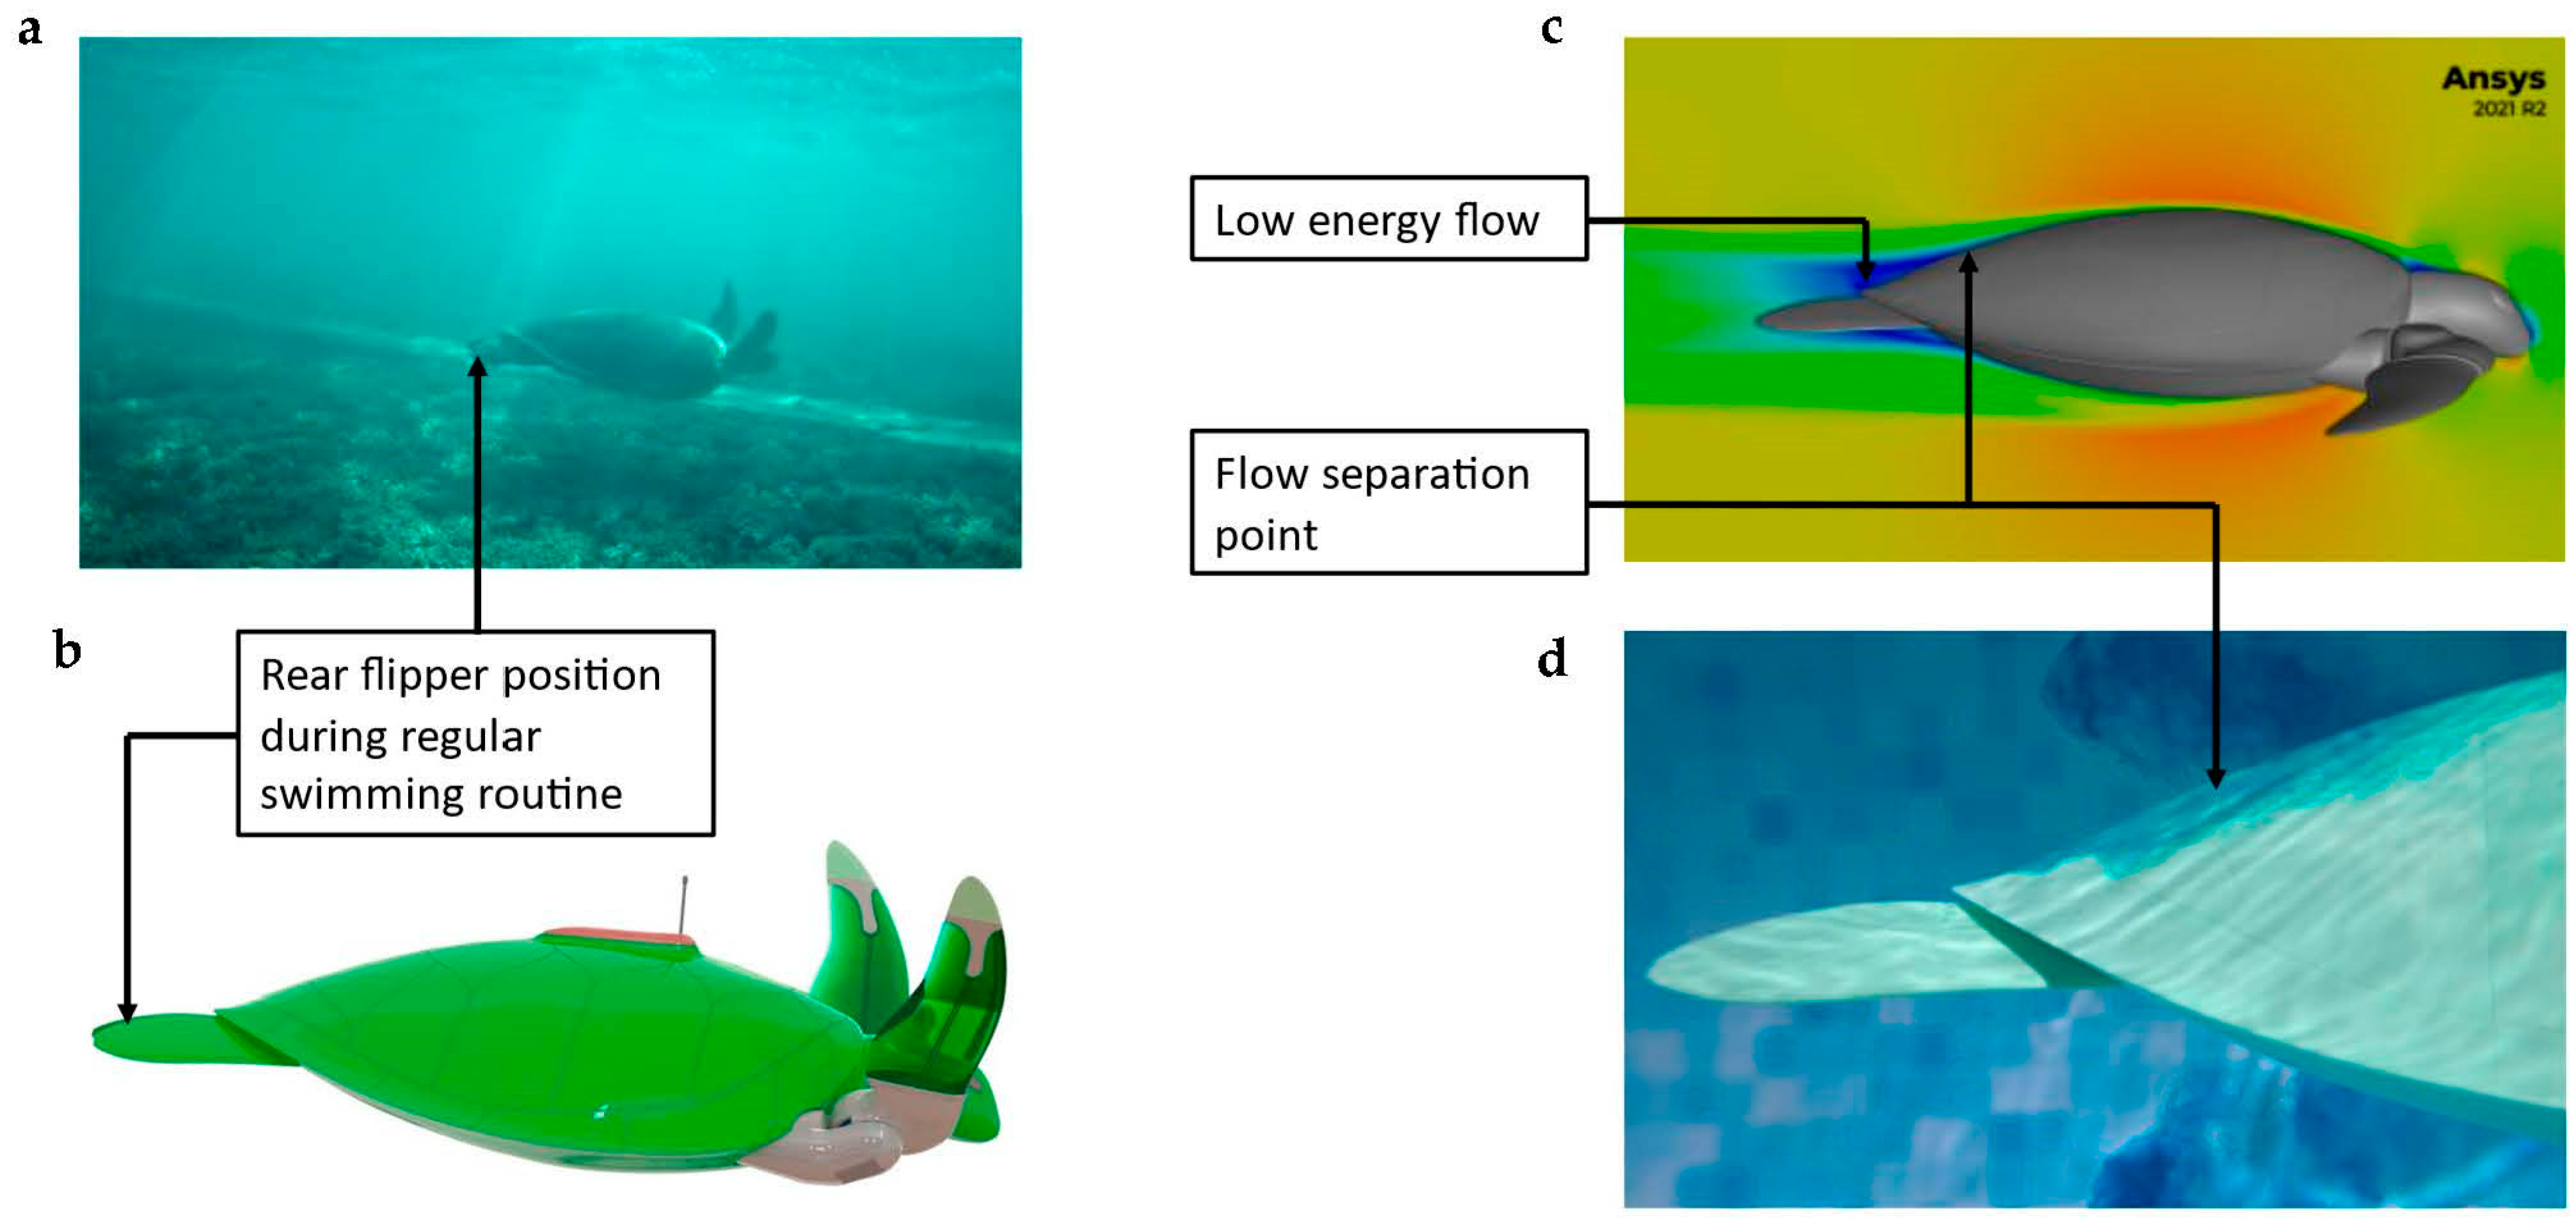
3.5. Rear Flippers
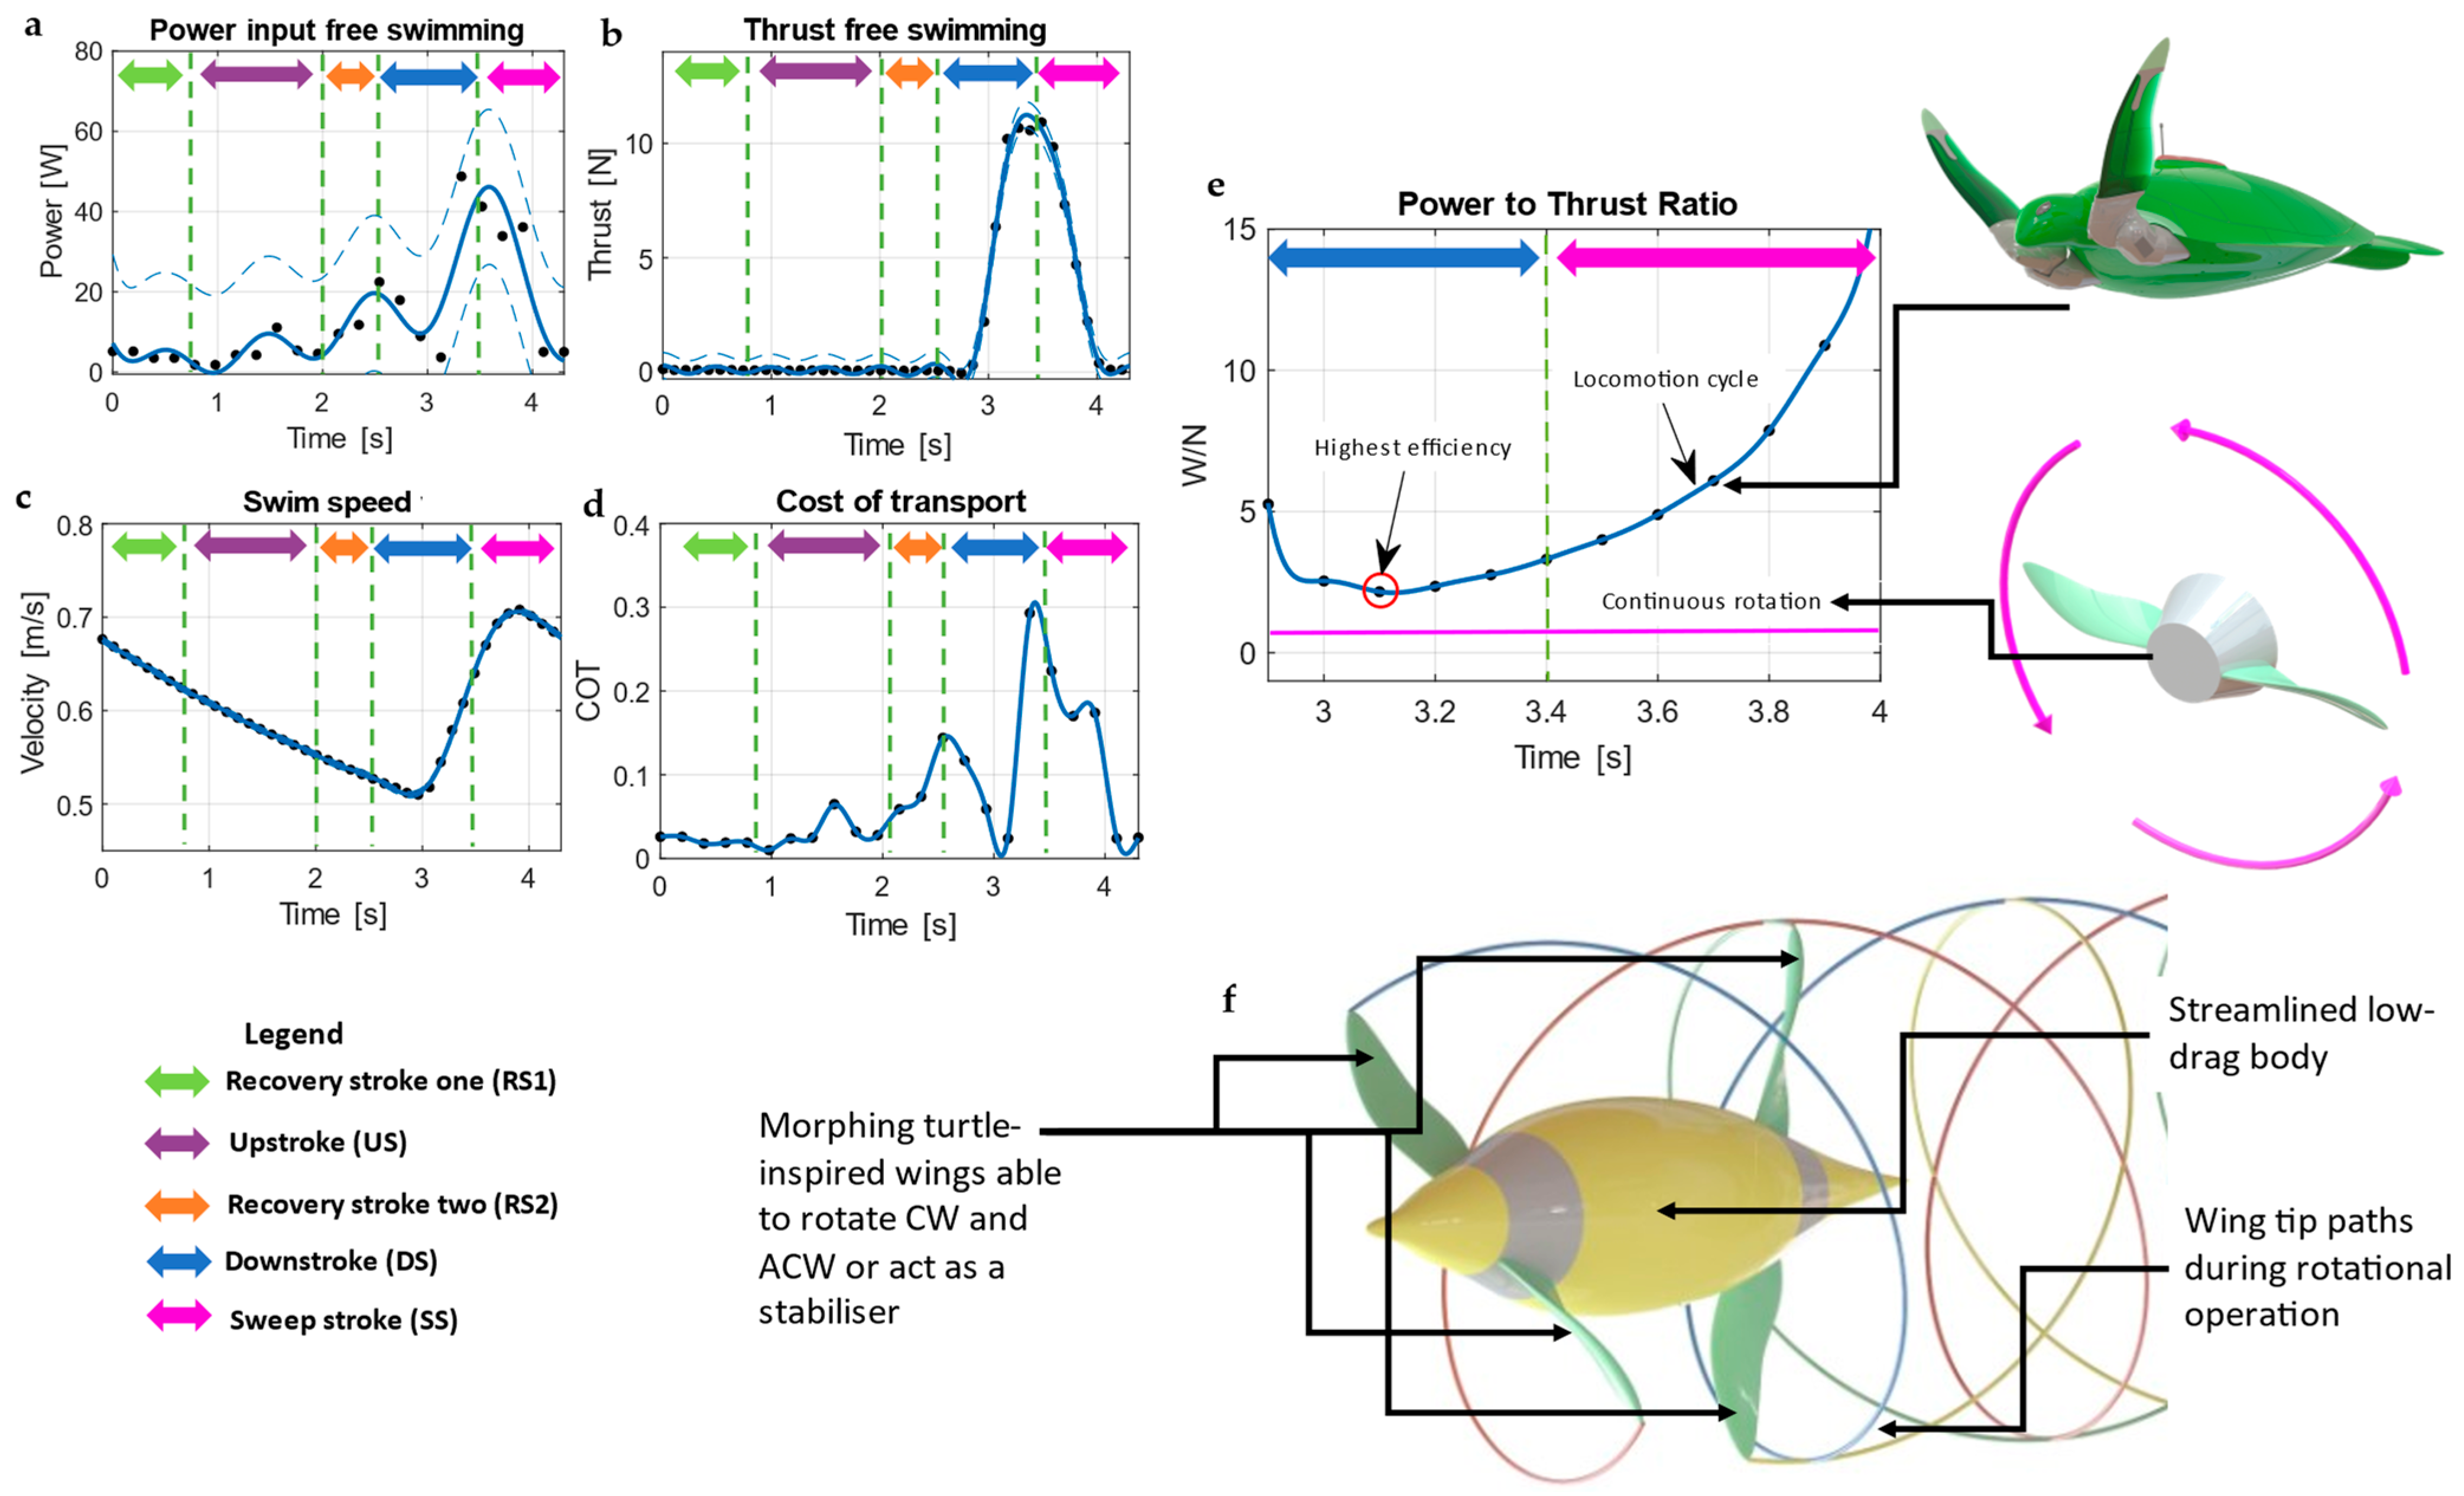
3.6. Turtle Swimming Efficiency and Cost of Transport
4. Conclusions and Future Work
Supplementary Materials
Author Contributions
Funding
Institutional Review Board Statement
Informed Consent Statement
Data Availability Statement
Acknowledgments
Conflicts of Interest
References
- Hays, G.C.; Scott, R. Global patterns for upper ceilings on migration distance in sea turtles and comparisons with fish, birds and mammals. Funct. Ecol. 2013, 27, 748–756. [Google Scholar] [CrossRef]
- Eckert, S.A. High-use oceanic areas for Atlantic leatherback sea turtles (Dermochelys coriacea) as identified using satellite telemetered location and dive information. Mar. Biol. 2006, 149, 1257–1267. [Google Scholar] [CrossRef]
- Heaslip, S.G.; Iverson, S.J.; Bowen, W.D.; James, M.C. Jellyfish Support High Energy Intake of Leatherback Sea Turtles (Dermochelys coriacea): Video Evidence from Animal-Borne Cameras. PLoS ONE 2012, 7, e33259. [Google Scholar] [CrossRef]
- Alerstam, T.; Hedenström, A.; Åkesson, S. Long-distance migration: Evolution and determinants. Oikos 2003, 103, 247–260. [Google Scholar] [CrossRef]
- Luschi, P.; Hays, G.C.; Del Seppia, C.; Marsh, R.; Papi, F. The navigational feats of green sea turtles migrating from Ascension Island investigated by satellite telemetry. Proc. R. Soc. Lond. Ser. B Biol. Sci. 1998, 265, 2279–2284. [Google Scholar] [CrossRef]
- van der Geest, N.; Garcia, L.; Nates, R.; Godoy, D.A. New insight into the swimming kinematics of wild Green sea turtles (Chelonia mydas). Sci. Rep. 2022, 12, 18151. [Google Scholar] [CrossRef]
- Davenport, J.; Munks, S.A.; Oxford, P.J. A Comparison of the swimming of Marine and Freshwater Turtles. R. Soc. London. Ser. B Biol. Sci. 1984, 220, 447–475. [Google Scholar] [CrossRef]
- van der Geest, N.; Garcia, L.; Borret, F.; Nates, R.; Gonzalez, A. Soft-robotic green sea turtle (Chelonia mydas) developed to replace animal experimentation provides new insight into their propulsive strategies. Sci. Rep. 2023, 13, 11983. [Google Scholar] [CrossRef]
- Booth, D.T. Kinematics of swimming and thrust production during powerstroking bouts of the swim frenzy in green turtle hatchlings. Biol. Open 2014, 3, 887–894. [Google Scholar] [CrossRef]
- van der Geest, N.; Garcia, L.; Nates, R.; Gonzalez-Vazquez, A. Sea Turtles Employ Drag-Reducing Techniques to Conserve Energy. J. Mar. Sci. Eng. 2022, 10, 1770. [Google Scholar] [CrossRef]
- Izraelevitz, J.S.; Triantafyllou, M.S. Adding in-line motion and model-based optimisation offers exceptional force control authority in flapping foils. J. Fluid Mech. 2014, 742, 5–34. [Google Scholar] [CrossRef]
- Licht, S.C.; Wibawa, M.S.; Hover, F.S.; Triantafyllou, M.S. In-line motion causes high thrust and efficiency in flapping foils that use power downstroke. J. Exp. Biol. 2010, 213, 63–71. [Google Scholar] [CrossRef] [PubMed]
- Jardin, T. Coriolis effect and the attachment of the leading edge vortex. J. Fluid Mech. 2017, 820, 312–340. [Google Scholar] [CrossRef]
- Johansson, L.C.; Engel, S.; Kelber, A.; Heerenbrink, M.K.; Hedenstrom, A. Multiple leading edge vortices of unexpected strength in freely flying hawkmoth. Sci. Rep. 2013, 3, 3264. [Google Scholar] [CrossRef]
- Nabawy, M.R.A.; Crowther, W.J. The role of the leading edge vortex in lift augmentation of steadily revolving wings: A change in perspective. J. R. Soc. Interface 2017, 14, 20170159. [Google Scholar] [CrossRef]
- Birch, J.M.; Dickinson, M.H. Spanwise flow and the attachment of the leading-edge vortex on insect wings. Nature 2001, 412, 729–733. [Google Scholar] [CrossRef]
- Menzer, A.; Gong, Y.; Fish, F.E.; Dong, H. Bio-Inspired Propulsion: Towards Understanding the Role of Pectoral Fin Kinematics in Manta-like Swimming. Biomimetics 2022, 7, 45. [Google Scholar] [CrossRef]
- Videler, J.J.; Stamhuis, E.J.; Povel, G.D.E. Leading-Edge Vortex Lifts Swifts. Science 2004, 306, 1960–1962. [Google Scholar] [CrossRef]
- Kashi, E.; Kulkarni, A.A.; Perrotta, G.; Leftwich, M.C. Flowfields produced by a robotic sea lion foreflipper starting from rest. Bioinspir. Biomim. 2020, 15, 035002. [Google Scholar] [CrossRef]
- Liu, Y.; Li, H.; Deng, S.; Wang, S.; Liu, S.; Wang, Z. Biomimetic Robotic Sea Lion Foreflippers: Design, Modeling, and Experimentation. IEEE ASME Trans. Mechatron. 2022, 27, 5679–5689. [Google Scholar] [CrossRef]
- Nguyen, D.Q.; Ho, V.A. Anguilliform Swimming Performance of an Eel-Inspired Soft Robot. Soft Robot. 2022, 9, 425–439. [Google Scholar] [CrossRef] [PubMed]
- Kwak, B.; Choi, S.; Bae, J. Development of a Stiffness-Adjustable Articulated Paddle and its Application to a Swimming Robot. Adv. Intell. Syst. 2023, 5, 2200348. [Google Scholar] [CrossRef]
- Berlinger, F.; Saadat, M.; Haj-Hariri, H.; Lauder, G.V.; Nagpal, R. Fish-like three-dimensional swimming with an autonomous, multi-fin, and biomimetic robot. Bioinspir. Biomim. 2021, 16, 026018. [Google Scholar] [CrossRef] [PubMed]
- Baines, R.; Patiballa, S.K.; Booth, J.; Ramirez, L.; Sipple, T.; Garcia, A.; Fish, F.; Kramer-Bottiglio, R. Multi-environment robotic transitions through adaptive morphogenesis. Nature 2022, 610, 283–289. [Google Scholar] [CrossRef] [PubMed]
- Bujard, T.; Giorgio-Serchi, F.; Weymouth, G.D. A resonant squid-inspired robot unlocks biological propulsive efficiency. Sci. Robot. 2021, 6, eabd2971. [Google Scholar] [CrossRef]
- Lu, B.; Zhou, C.; Wang, J.; Zhang, Z.; Tan, M. Toward Swimming Speed Optimization of a Multi-Flexible Robotic Fish With Low Cost of Transport. IEEE Trans. Autom. Sci. Eng. 2023, 20, 1–12. [Google Scholar] [CrossRef]
- Zhu, J.; White, C.; Wainwright, D.K.; Di Santo, V.; Lauder, G.V.; Bart-Smith, H. Tuna robotics: A high-frequency experimental platform exploring the performance space of swimming fishes. Sci. Robot. 2019, 4, eaax4615. [Google Scholar] [CrossRef]
- White, C.H.; Lauder, G.V.; Bart-Smith, H. Tunabot Flex: A tuna-inspired robot with body flexibility improves high-performance swimming. Bioinspir. Biomim. 2021, 16, 026019. [Google Scholar] [CrossRef]
- Wang, T.; Joo, H.J.; Song, S.; Hu, W.; Keplinger, C.; Sitti, M. A versatile jellyfish-like robotic platform for effective underwater propulsion and manipulation. Sci. Adv. 2023, 9, eadg0292. [Google Scholar] [CrossRef]
- Yasuda, T.; Arai, N. Changes in flipper beat frequency, body angle and swimming speed of female green turtles Chelonia mydas. Mar. Ecol. Prog. Ser. 2009, 386, 275–286. [Google Scholar] [CrossRef]
- Gurka, R.; Nafi, A.S.; Weihs, D. On an adaptation of the Reynolds number, applicable to body-caudal-fin aquatic locomotion. Front. Mar. Sci. 2022, 9, 914214. [Google Scholar] [CrossRef]
- Taylor, G.K.; Nudds, R.L.; Thomas, A.L.R. Flying and swimming animals cruise at a Strouhal number tuned for high power efficiency. Nature 2003, 425, 707–711. [Google Scholar] [CrossRef] [PubMed]
- Eloy, C. Optimal Strouhal number for swimming animals. J. Fluids Struct. 2012, 30, 205–218. [Google Scholar] [CrossRef]
- Triantafyllou, G.S.; Triantafyllou, M.S.; Grosenbaugh, M.A. Optimal Thrust Development in Oscillating Foils with Application to Fish Propulsion. J. Fluids Struct. 1993, 7, 205–224. [Google Scholar] [CrossRef]
- Carr, L.W.; Chandrasekhara, M.S. Compressibility effects on dynamic stall. Prog. Aerosp. Sci. 1996, 32, 523–573. [Google Scholar] [CrossRef]


| COT in Recent State-of-the-Art Swimming Robot | Data Obtained From | |
|---|---|---|
| Cornelia | 0.072 | Results from this current study |
| ART | 3 | Baines et al. [24] |
| Eel inspired robot | 10.72 | Nguyen et al. [21] |
| Flexible swimming robot | 2.5 | Kwak et al. [22] |
| FINBOT | 8.2 | Berlinger et al. [23] |
| Squid-inspired robot | 0.087 | Bujard et al. [25] |
| Flexible robotic fish | 0.293 | Lu et al. [26] |
| Tunabot | 2.83 | Zhu et al. [27] |
| Tunabot flex | 1.876 | White et al. [28] |
| HASEL jellyfish | 1.619 | Wang et al. [29] |
Disclaimer/Publisher’s Note: The statements, opinions and data contained in all publications are solely those of the individual author(s) and contributor(s) and not of MDPI and/or the editor(s). MDPI and/or the editor(s) disclaim responsibility for any injury to people or property resulting from any ideas, methods, instructions or products referred to in the content. |
© 2023 by the authors. Licensee MDPI, Basel, Switzerland. This article is an open access article distributed under the terms and conditions of the Creative Commons Attribution (CC BY) license (https://creativecommons.org/licenses/by/4.0/).
Share and Cite
van der Geest, N.; Garcia, L.; Nates, R.; Borrett, F. New Insights into Sea Turtle Propulsion and Their Cost of Transport Point to a Potential New Generation of High-Efficient Underwater Drones for Ocean Exploration. J. Mar. Sci. Eng. 2023, 11, 1944. https://doi.org/10.3390/jmse11101944
van der Geest N, Garcia L, Nates R, Borrett F. New Insights into Sea Turtle Propulsion and Their Cost of Transport Point to a Potential New Generation of High-Efficient Underwater Drones for Ocean Exploration. Journal of Marine Science and Engineering. 2023; 11(10):1944. https://doi.org/10.3390/jmse11101944
Chicago/Turabian Stylevan der Geest, Nick, Lorenzo Garcia, Roy Nates, and Fraser Borrett. 2023. "New Insights into Sea Turtle Propulsion and Their Cost of Transport Point to a Potential New Generation of High-Efficient Underwater Drones for Ocean Exploration" Journal of Marine Science and Engineering 11, no. 10: 1944. https://doi.org/10.3390/jmse11101944