Author Contributions
Conceptualization, Z.M., H.C., J.-F.C., M.B., and J.H.; methodology, H.C.; software, Z.M., Y.C.; validation, H.C., and Z.M.; writing—original draft preparation, Z.M.; writing—review and editing, H.C., J.-F.C., N.A.-A., J.H., M.B., and J.K.; visualization, Z.M.; supervision, H.C., J.-F.C., J.H., and M.B.; project administration, H.C.; funding acquisition, H.C. and M.B. All authors have read and agreed to the published version of the manuscript.
Figure 1.
Block diagram of the structure of the vessel hybrid power system.
Figure 1.
Block diagram of the structure of the vessel hybrid power system.
Figure 2.
Power demand in a working cycle (from [
11]).
Figure 2.
Power demand in a working cycle (from [
11]).
Figure 3.
Equivalent circuit diagram of two energy storage modules connected in parallel.
Figure 3.
Equivalent circuit diagram of two energy storage modules connected in parallel.
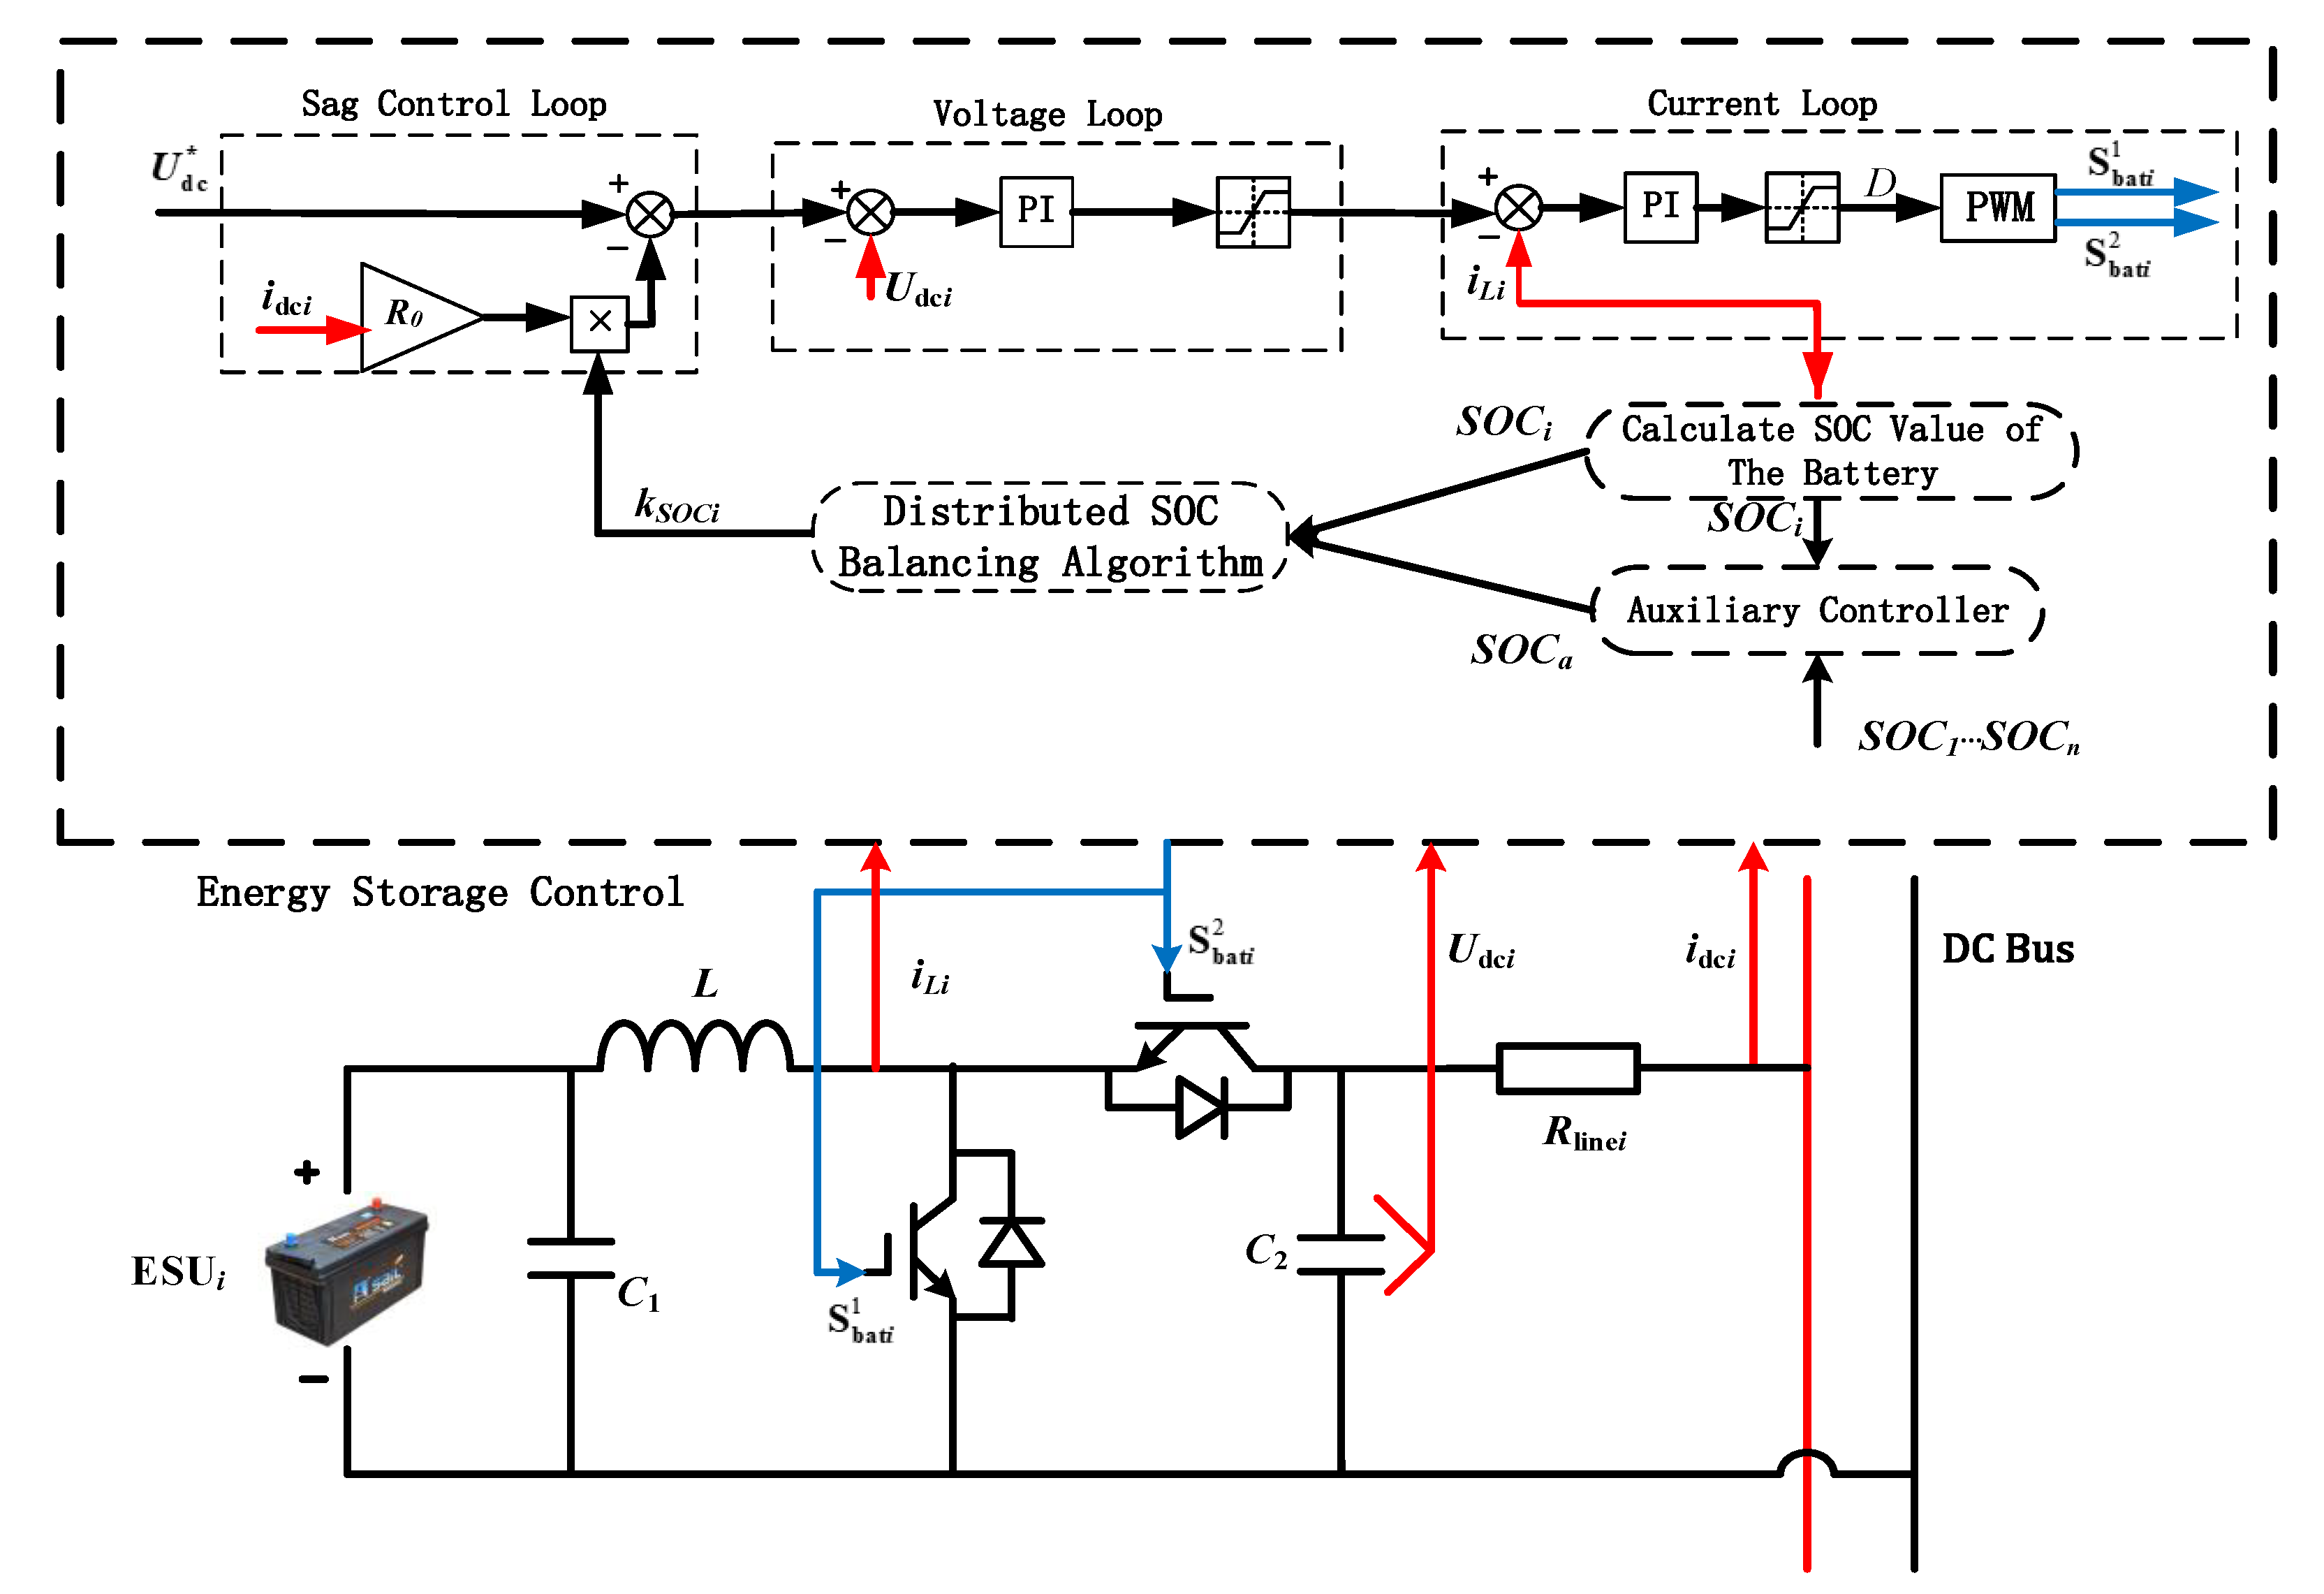
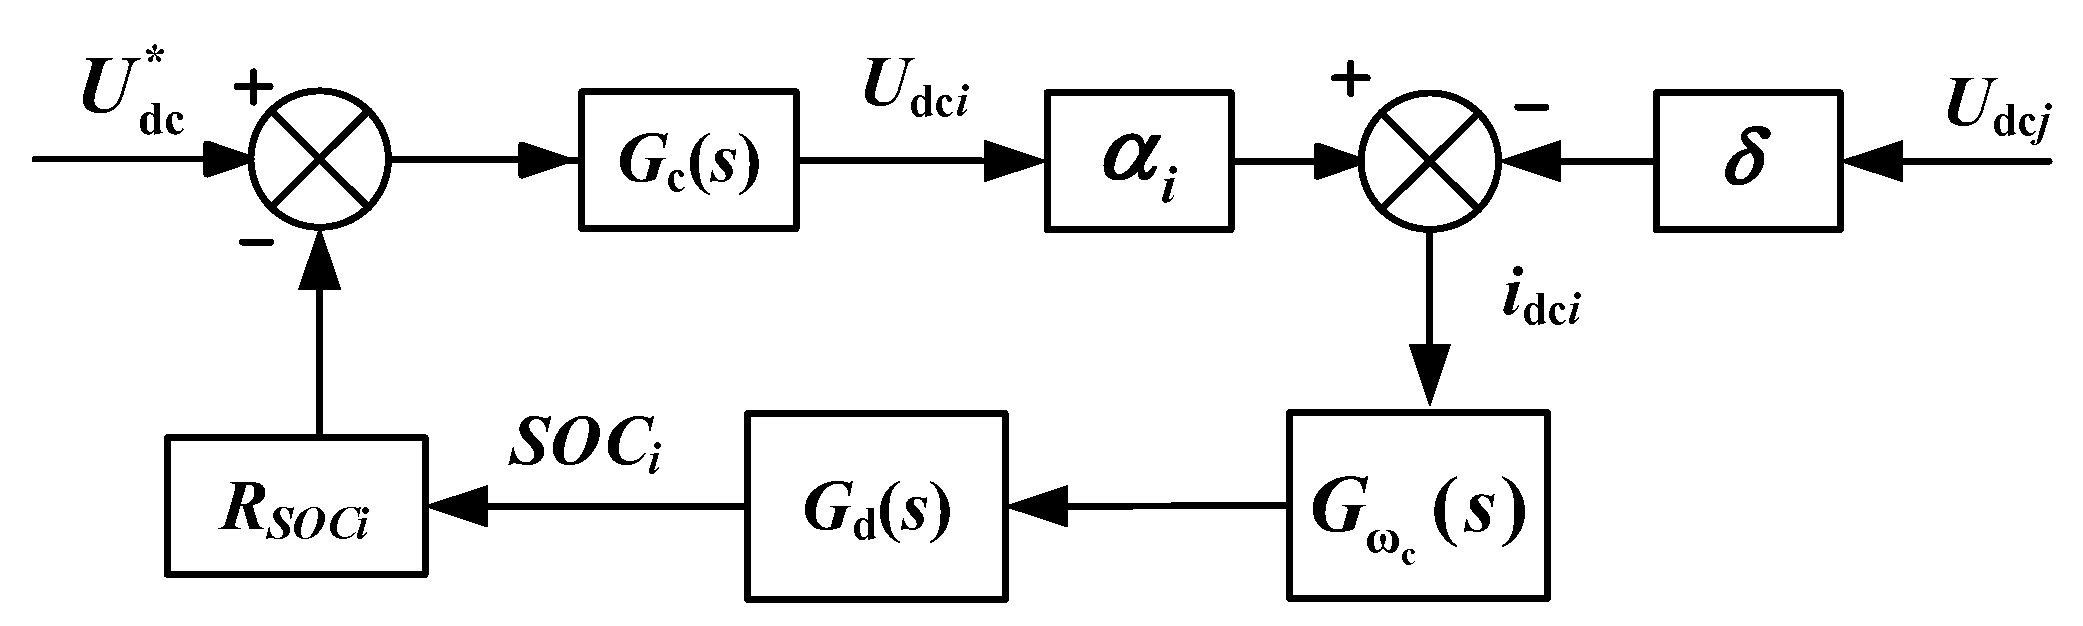
Figure 4.
Distributed variable sag slope control schematic.
Figure 4.
Distributed variable sag slope control schematic.
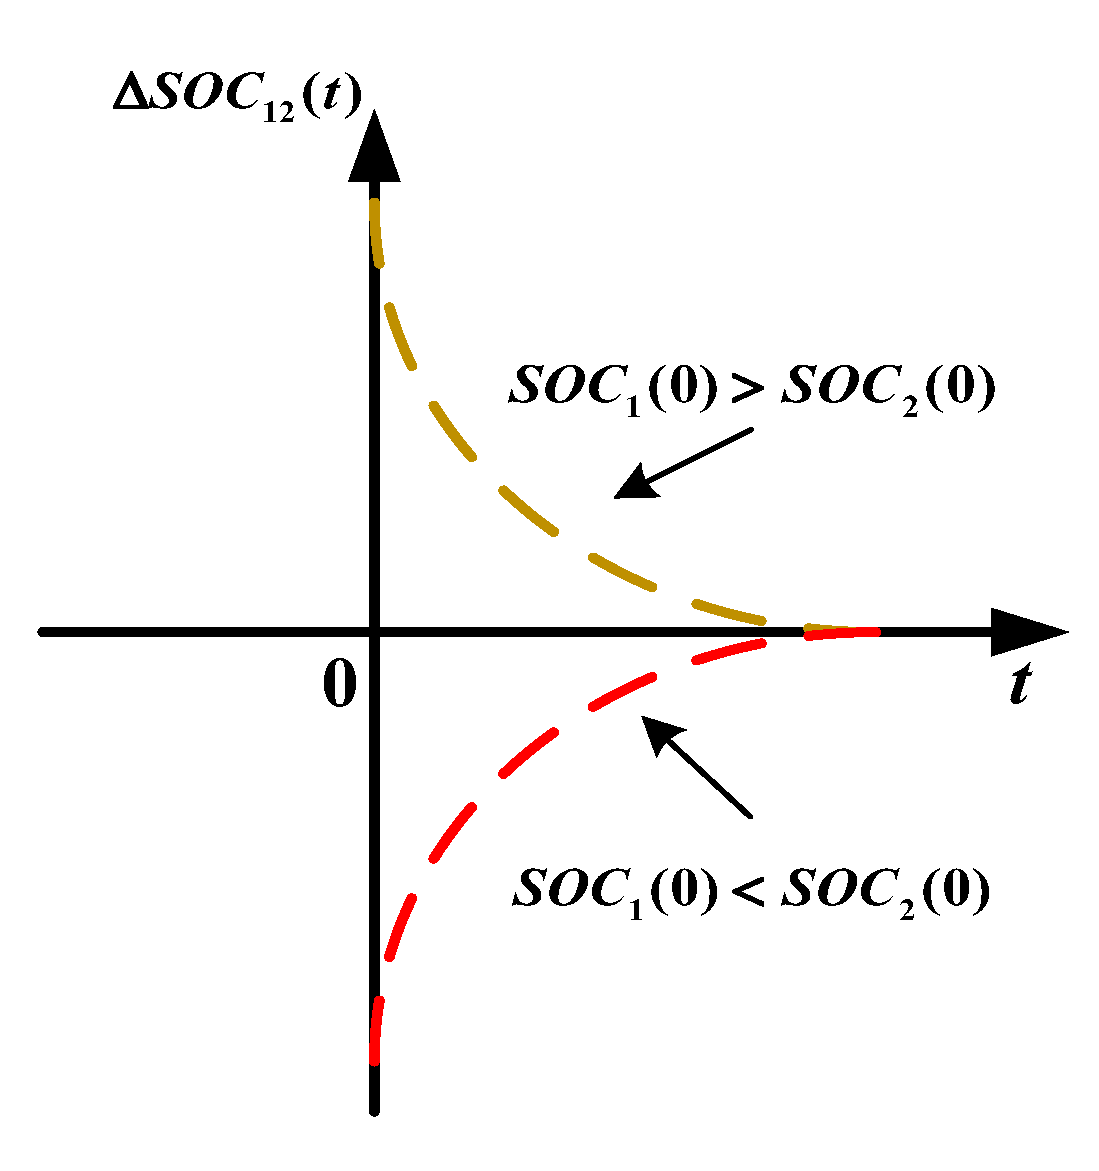
Figure 5.
convergence curve.
Figure 5.
convergence curve.
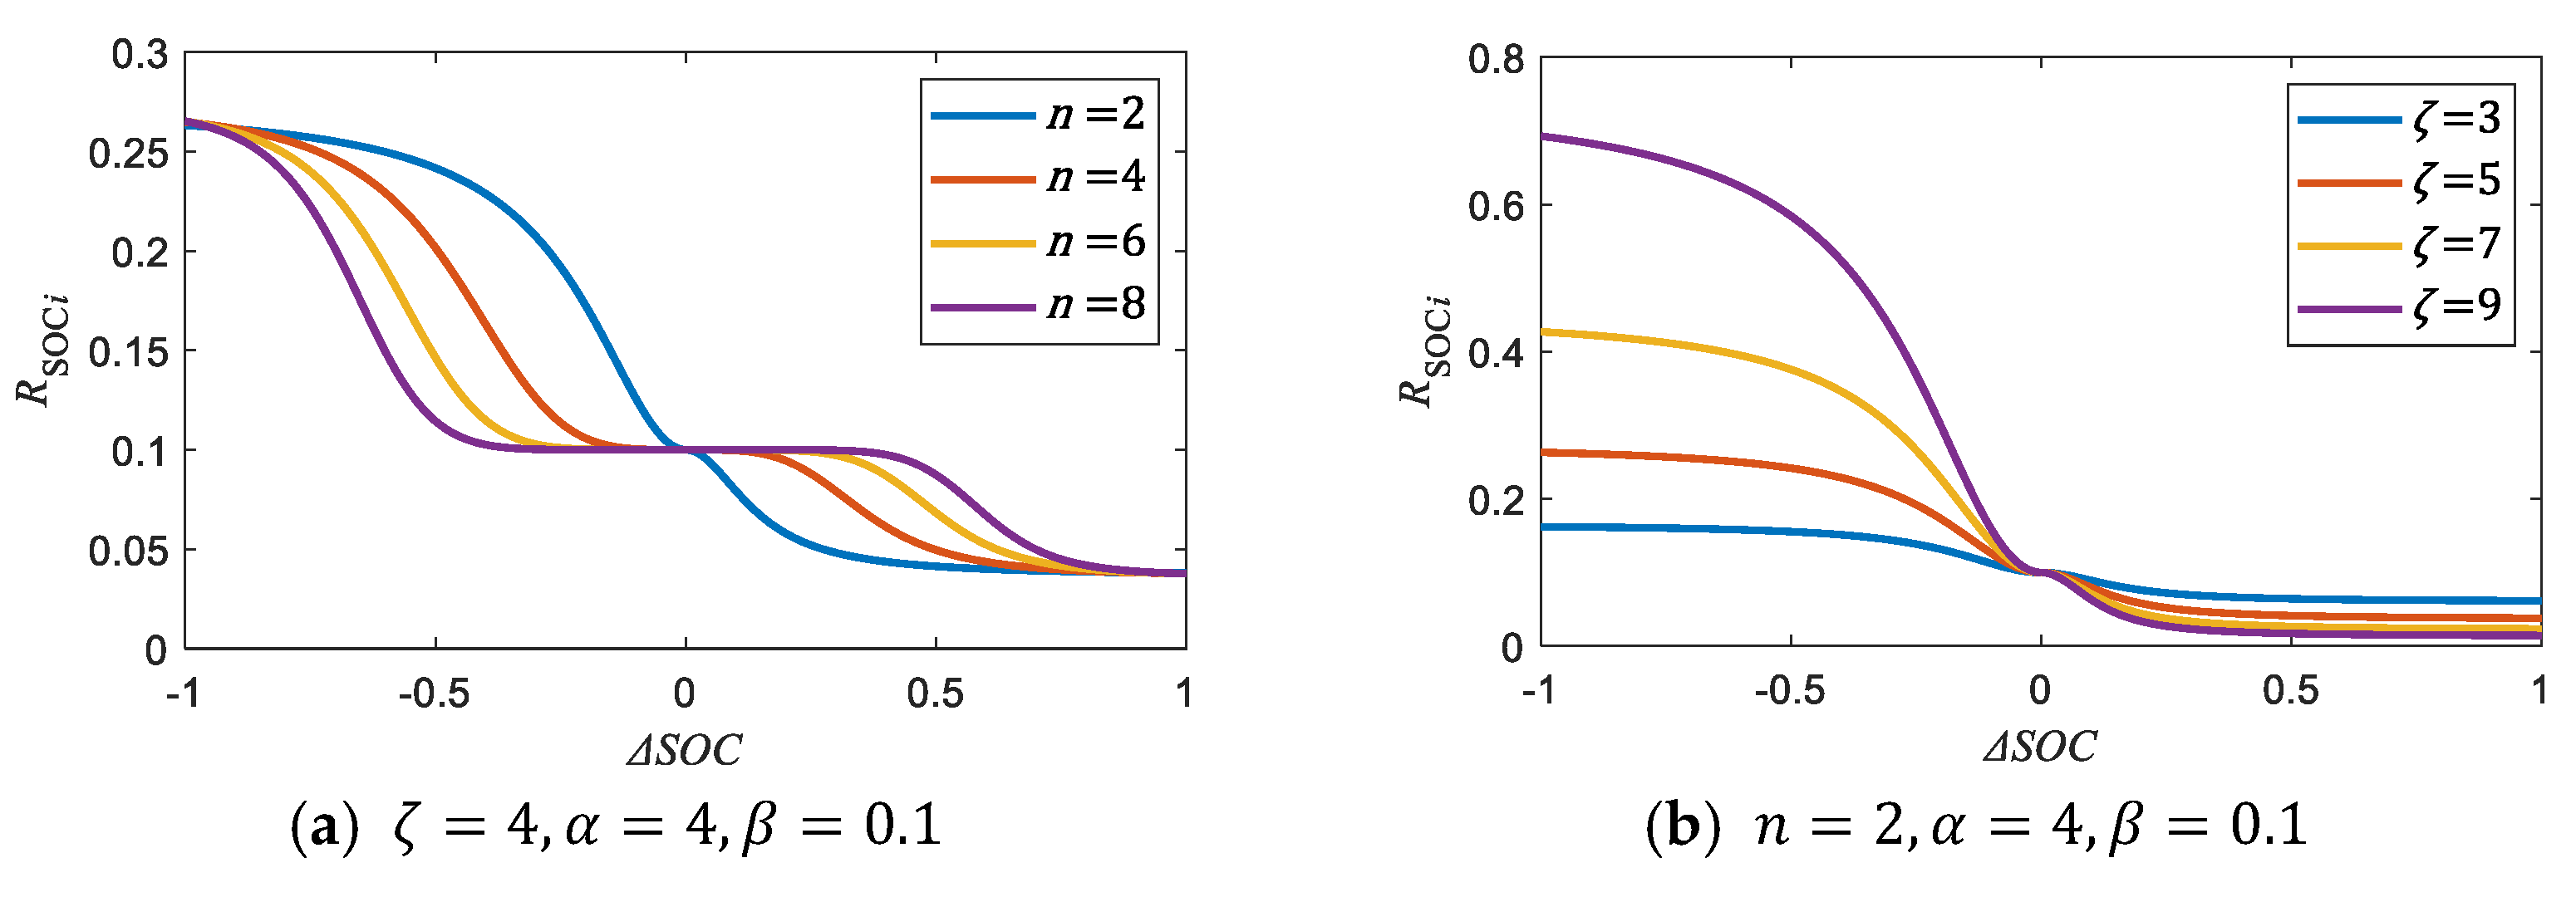
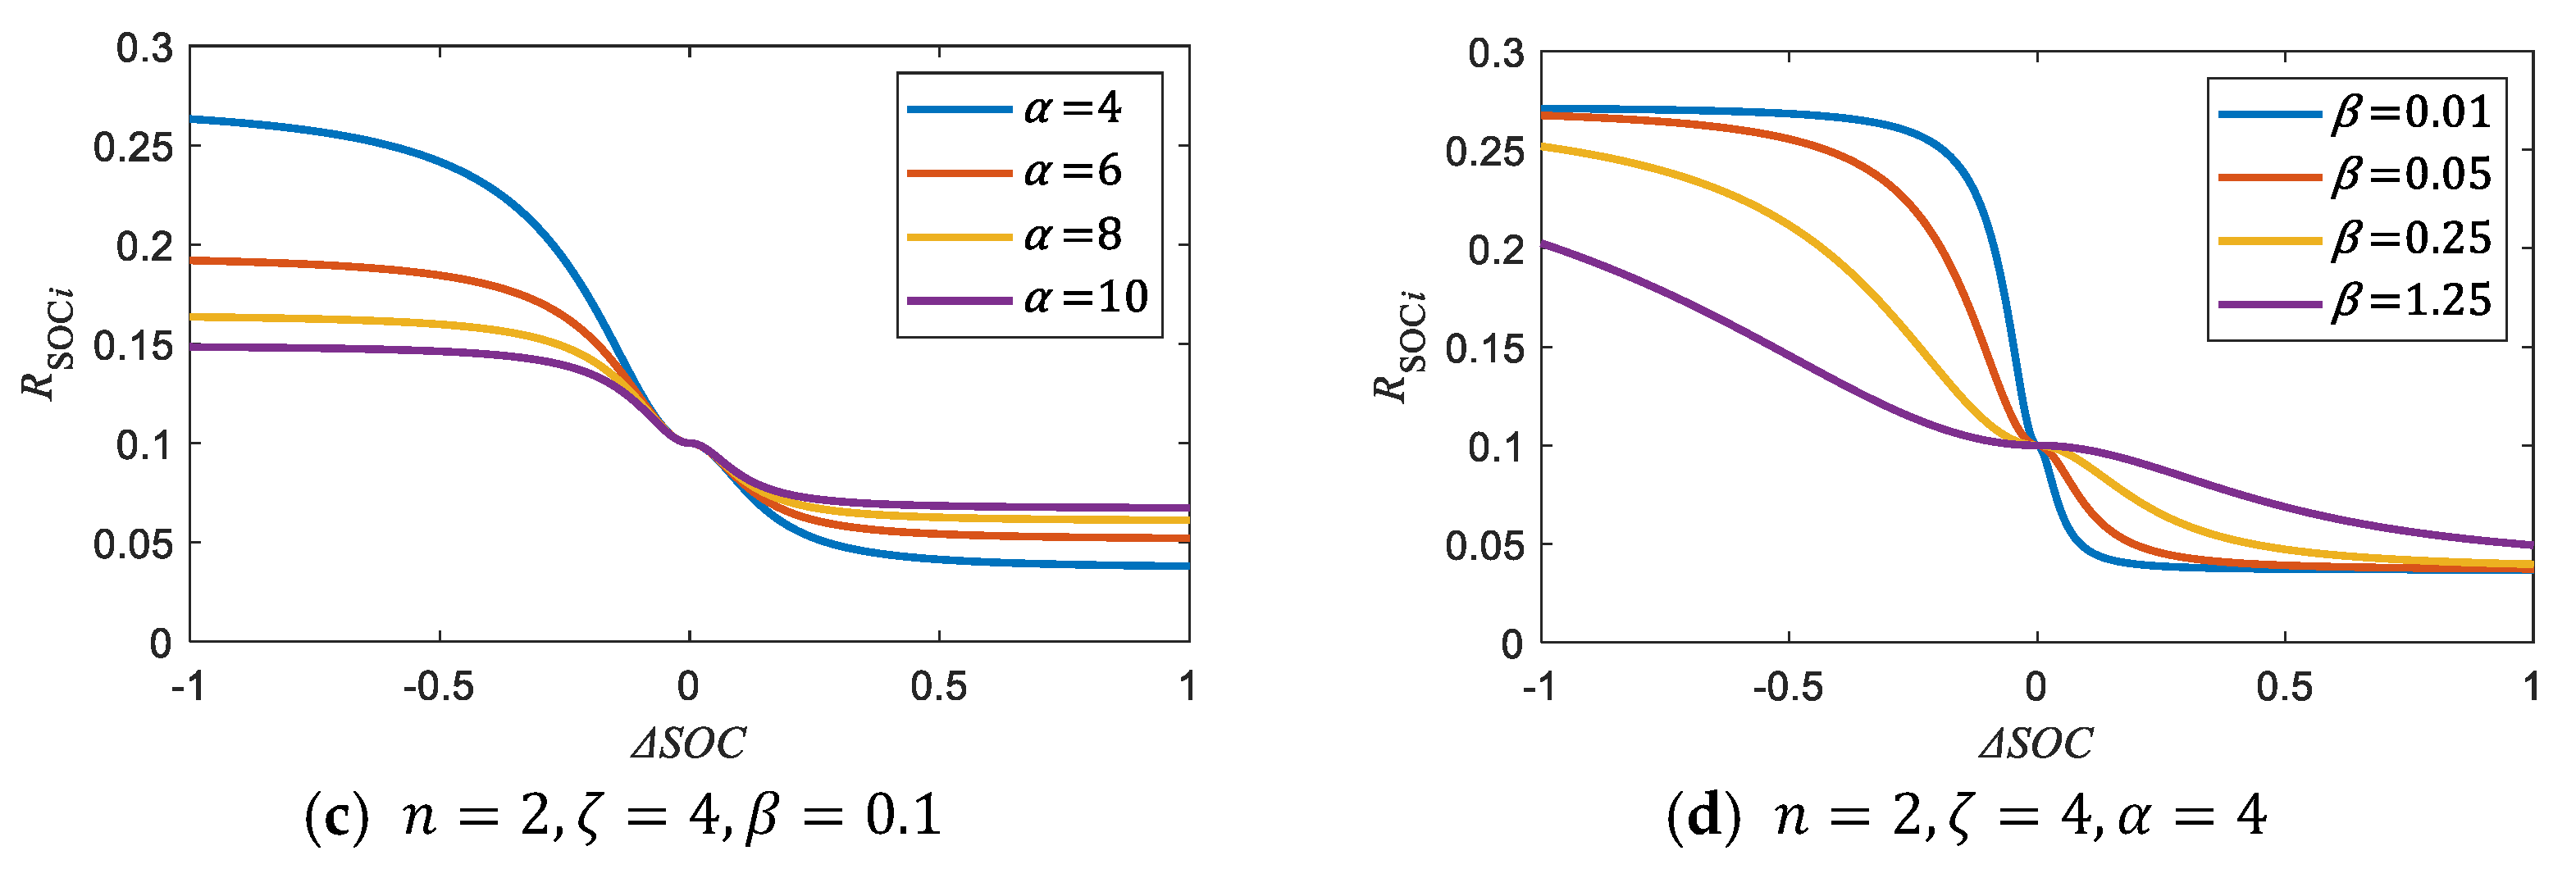
Figure 6.
as a function of for several factor set values.
Figure 6.
as a function of for several factor set values.
Figure 7.
Equivalent model for stability analysis.
Figure 7.
Equivalent model for stability analysis.
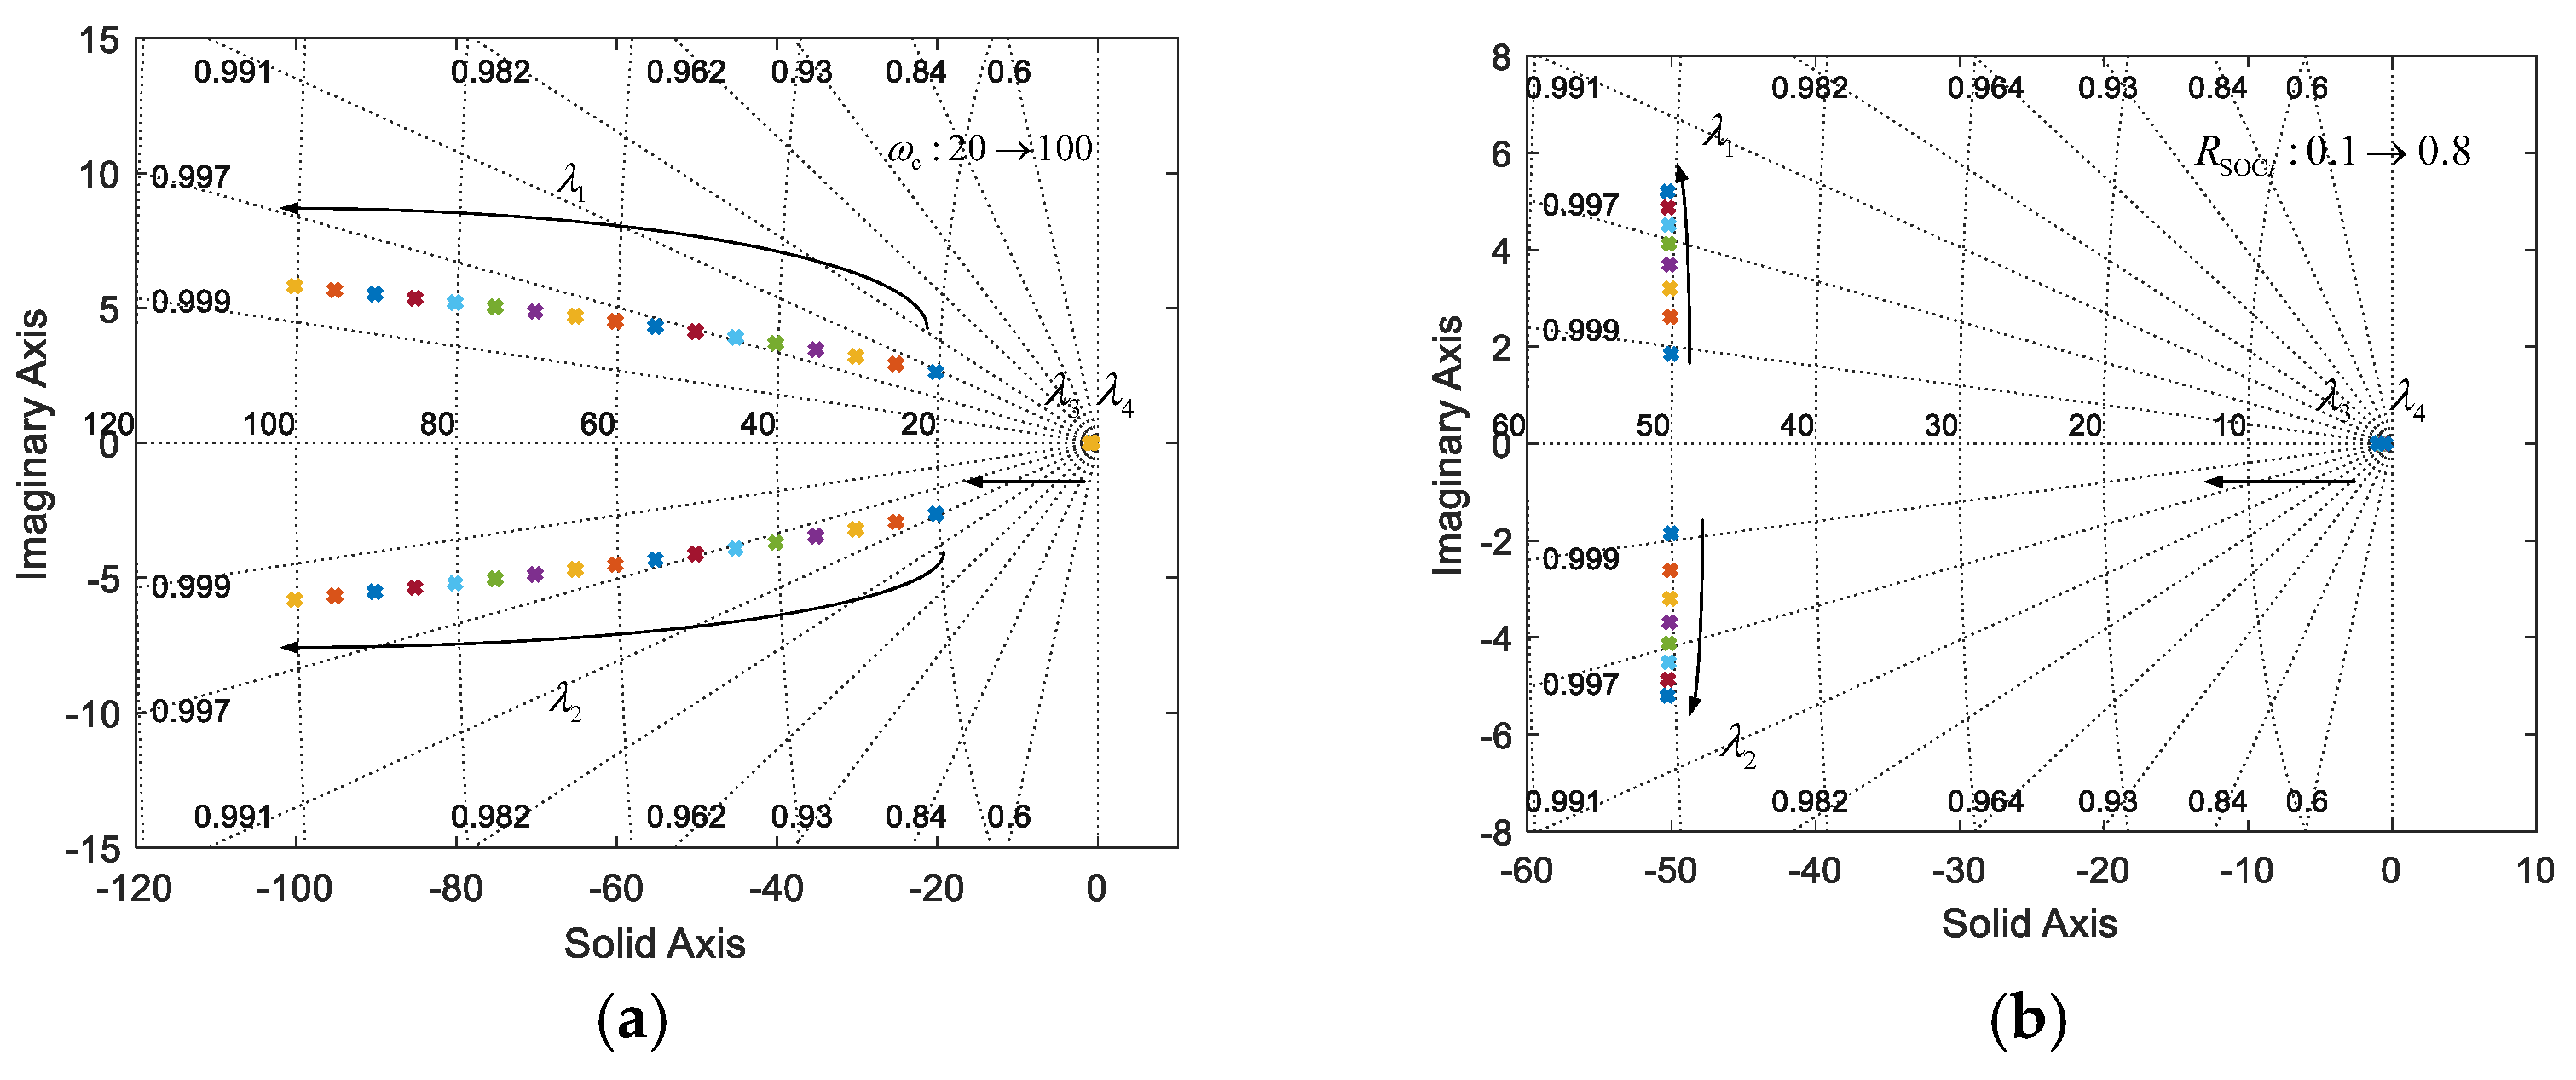
Figure 8.
Root trajectory diagram: (a) cutoff frequency change; (b) change in sag factor.
Figure 8.
Root trajectory diagram: (a) cutoff frequency change; (b) change in sag factor.
Figure 9.
Principle diagram of supercapacitor operating mode switching.
Figure 9.
Principle diagram of supercapacitor operating mode switching.
Figure 10.
Supercapacitor operating mode hysteresis loop switching diagram.
Figure 10.
Supercapacitor operating mode hysteresis loop switching diagram.
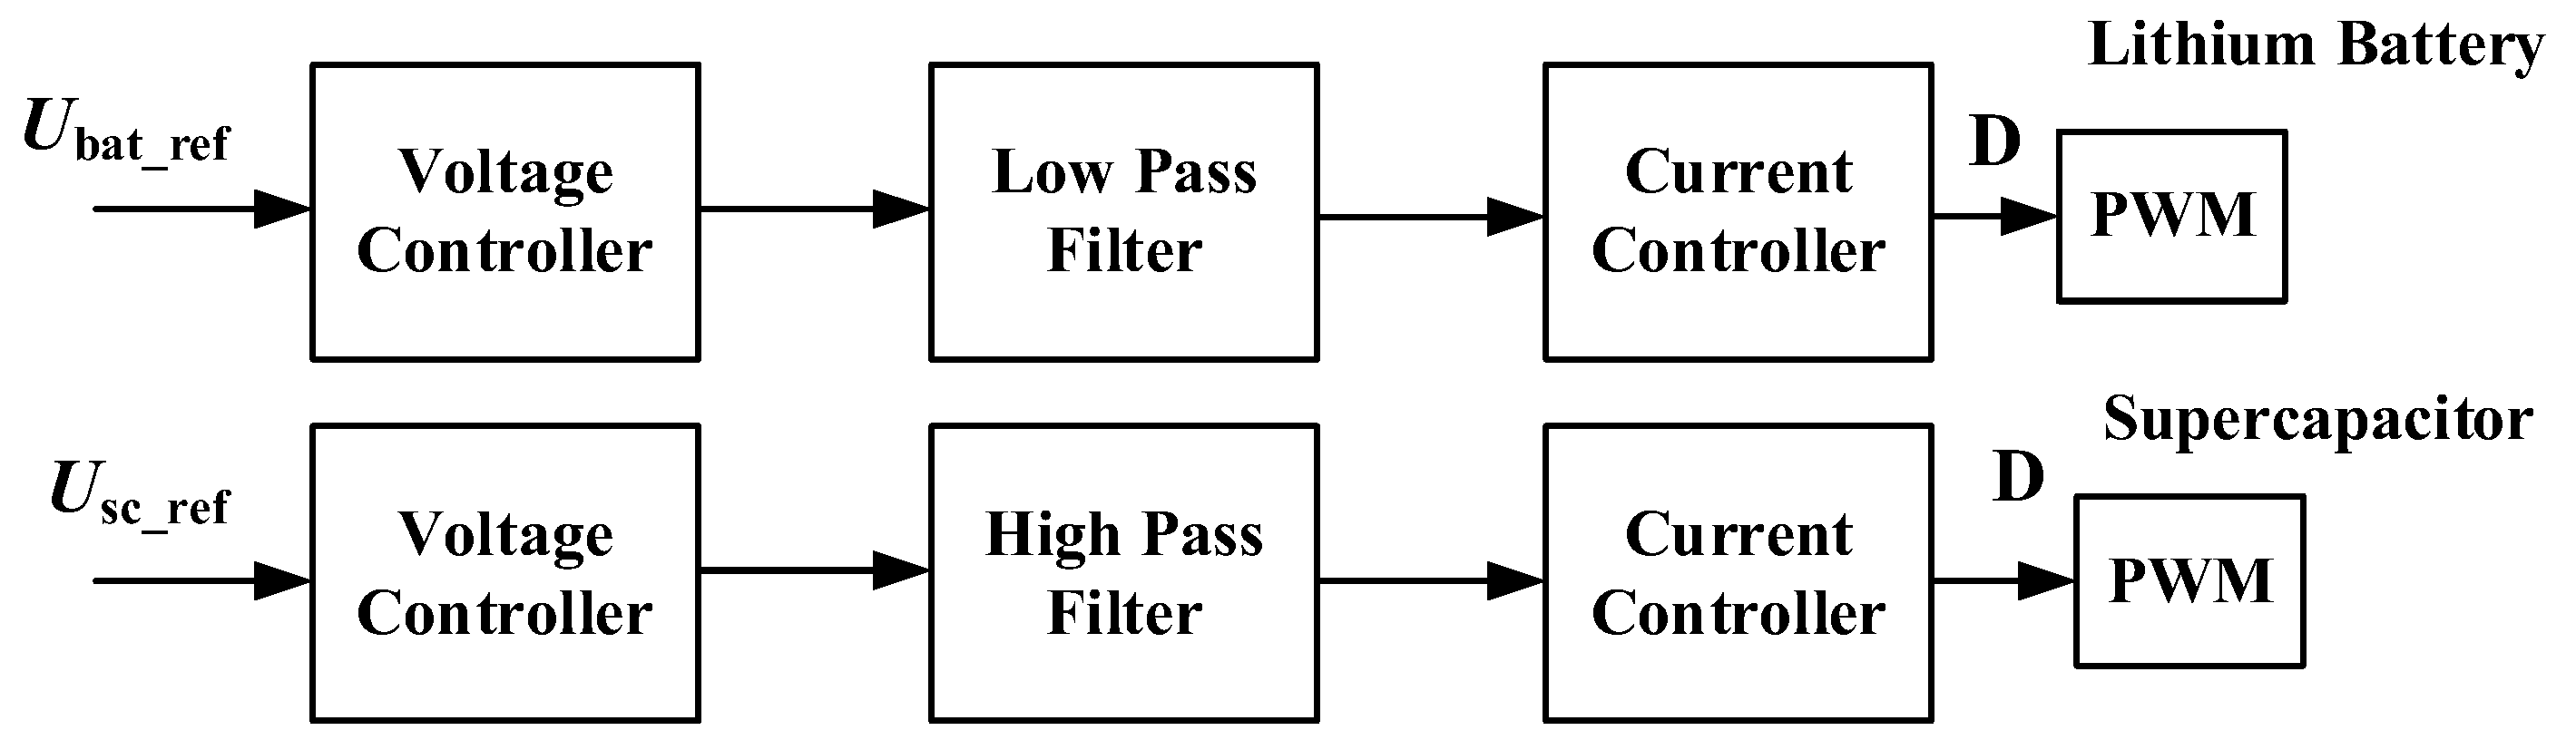
Figure 11.
Control block diagram with filter added between the double closed loop.
Figure 11.
Control block diagram with filter added between the double closed loop.
Figure 12.
Upper and lower output power switching diagram for each power generation device.
Figure 12.
Upper and lower output power switching diagram for each power generation device.
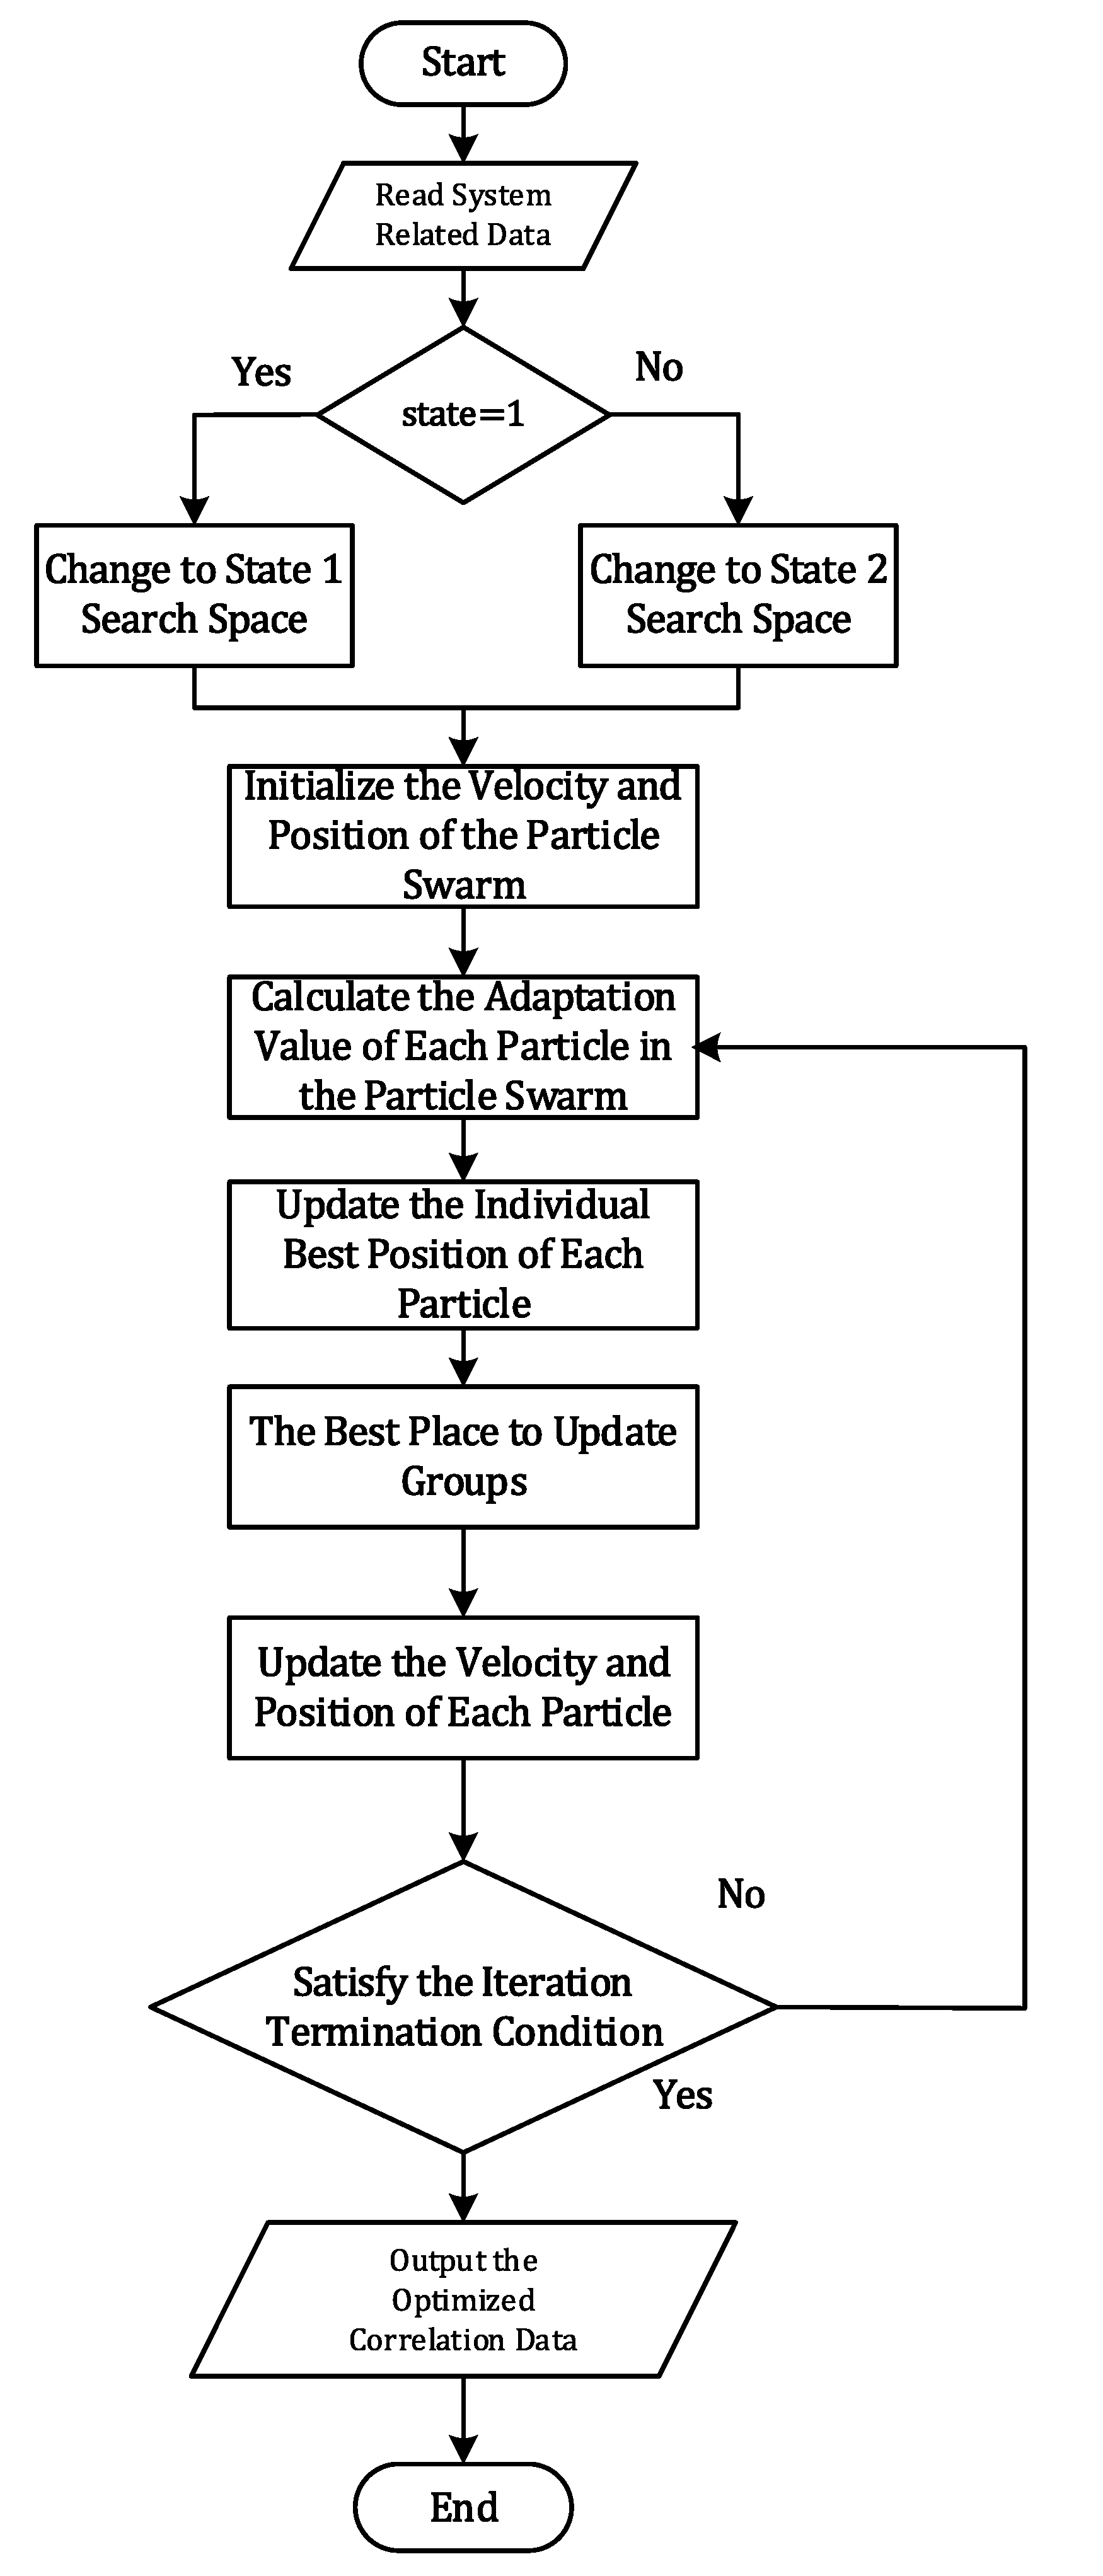
Figure 13.
Flowchart of the global rules of PSO.
Figure 13.
Flowchart of the global rules of PSO.
Figure 14.
Simplified simulation model of the vessel system.
Figure 14.
Simplified simulation model of the vessel system.
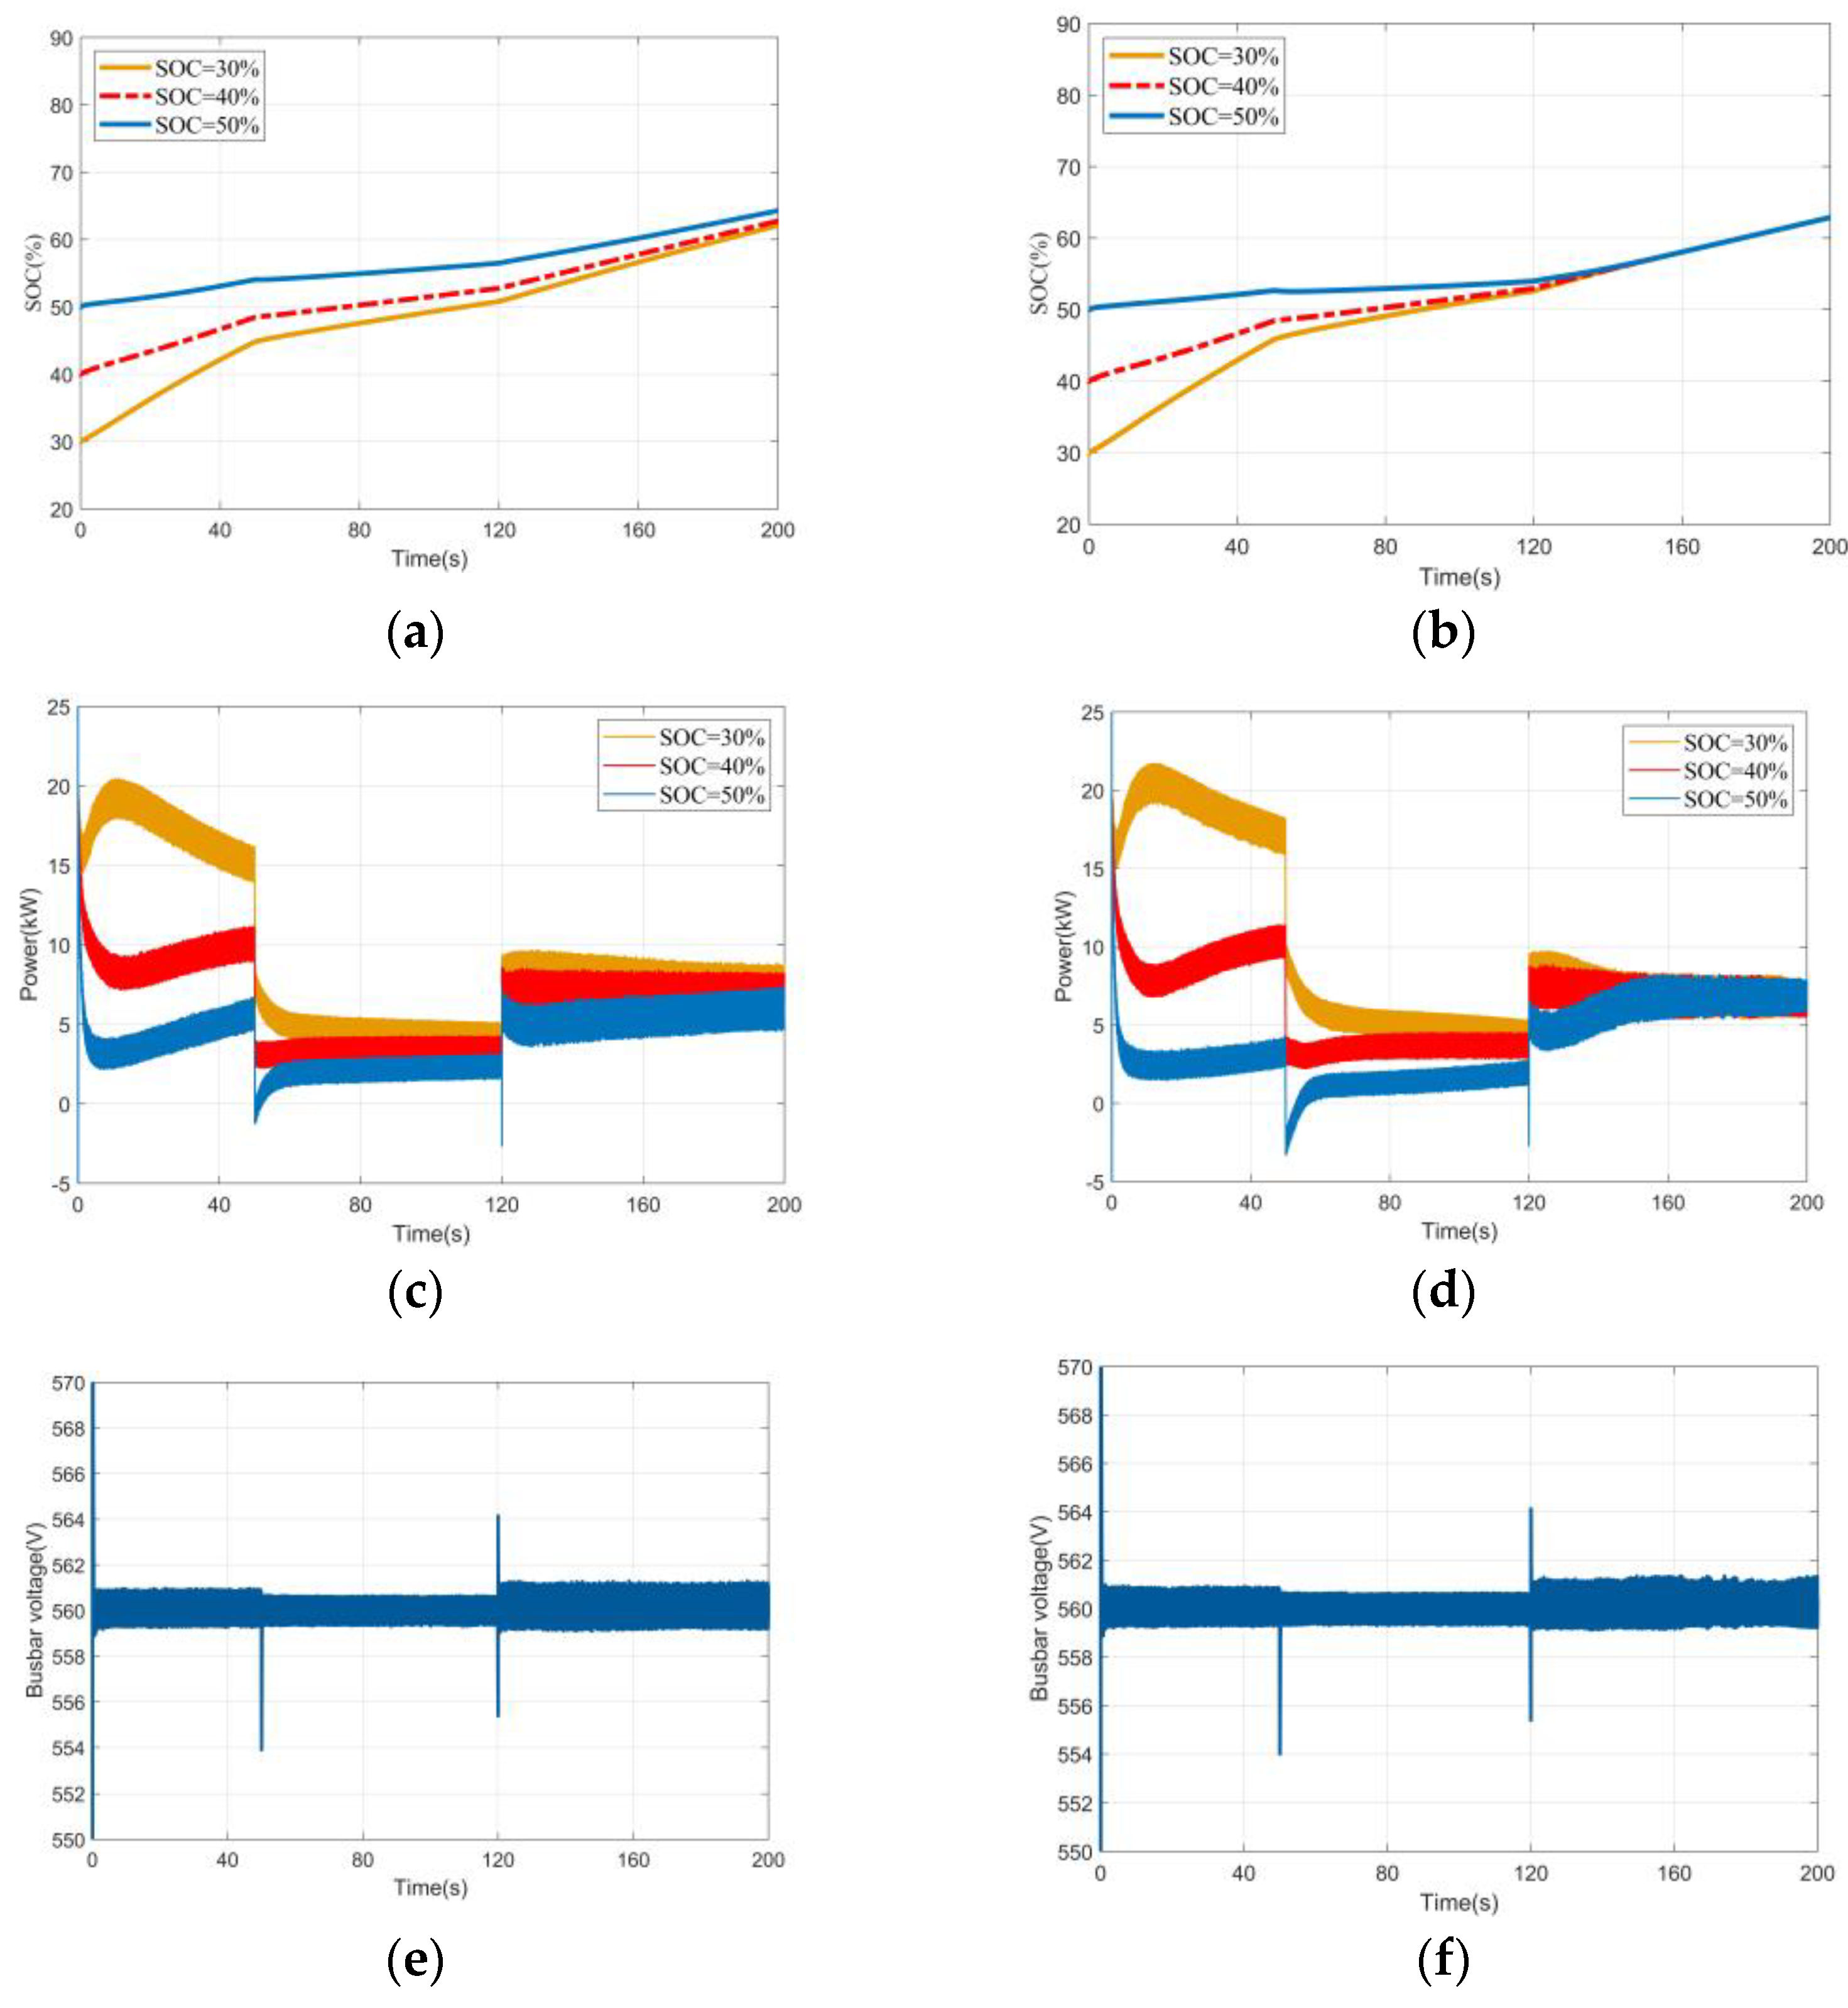
Figure 15.
Simulation waveform of discharge under load and FC power variation. (a) SOC sag control, lithium battery SOC waveform; (b) improved SOC sag control, lithium battery SOC waveform; (c) SOC sag control, lithium battery power waveform; (d) improved SOC sag control, lithium battery power waveform; (e) SOC sag control, bus voltage waveform; (f) improved SOC sag control, bus voltage waveform.
Figure 16.
Simulation waveform of charging under load and FC power variation. (a) SOC sag control, lithium battery SOC waveform; (b) improved SOC sag control, lithium battery SOC waveform; (c) SOC sag control, lithium battery power waveform; (d) improved SOC sag control, lithium battery power waveform; (e) SOC sag control, bus voltage waveform; (f) improved SOC sag control, bus voltage waveform.
Figure 17.
Power curve for a fixed filter time constant.
Figure 17.
Power curve for a fixed filter time constant.
Figure 18.
Power curve with variable filter time constants.
Figure 18.
Power curve with variable filter time constants.
Figure 19.
Variation in filter time constants for energy storage devices.
Figure 19.
Variation in filter time constants for energy storage devices.
Figure 20.
Comparison of the change in the SOC value of the lithium battery: (a) fixed filter time constant; (b) variable filter time constant.
Figure 20.
Comparison of the change in the SOC value of the lithium battery: (a) fixed filter time constant; (b) variable filter time constant.
Figure 21.
Comparison of the supercapacitor’s SOC value change under constant and variable filter time constants.
Figure 21.
Comparison of the supercapacitor’s SOC value change under constant and variable filter time constants.
Figure 22.
FC reference current curve.
Figure 22.
FC reference current curve.
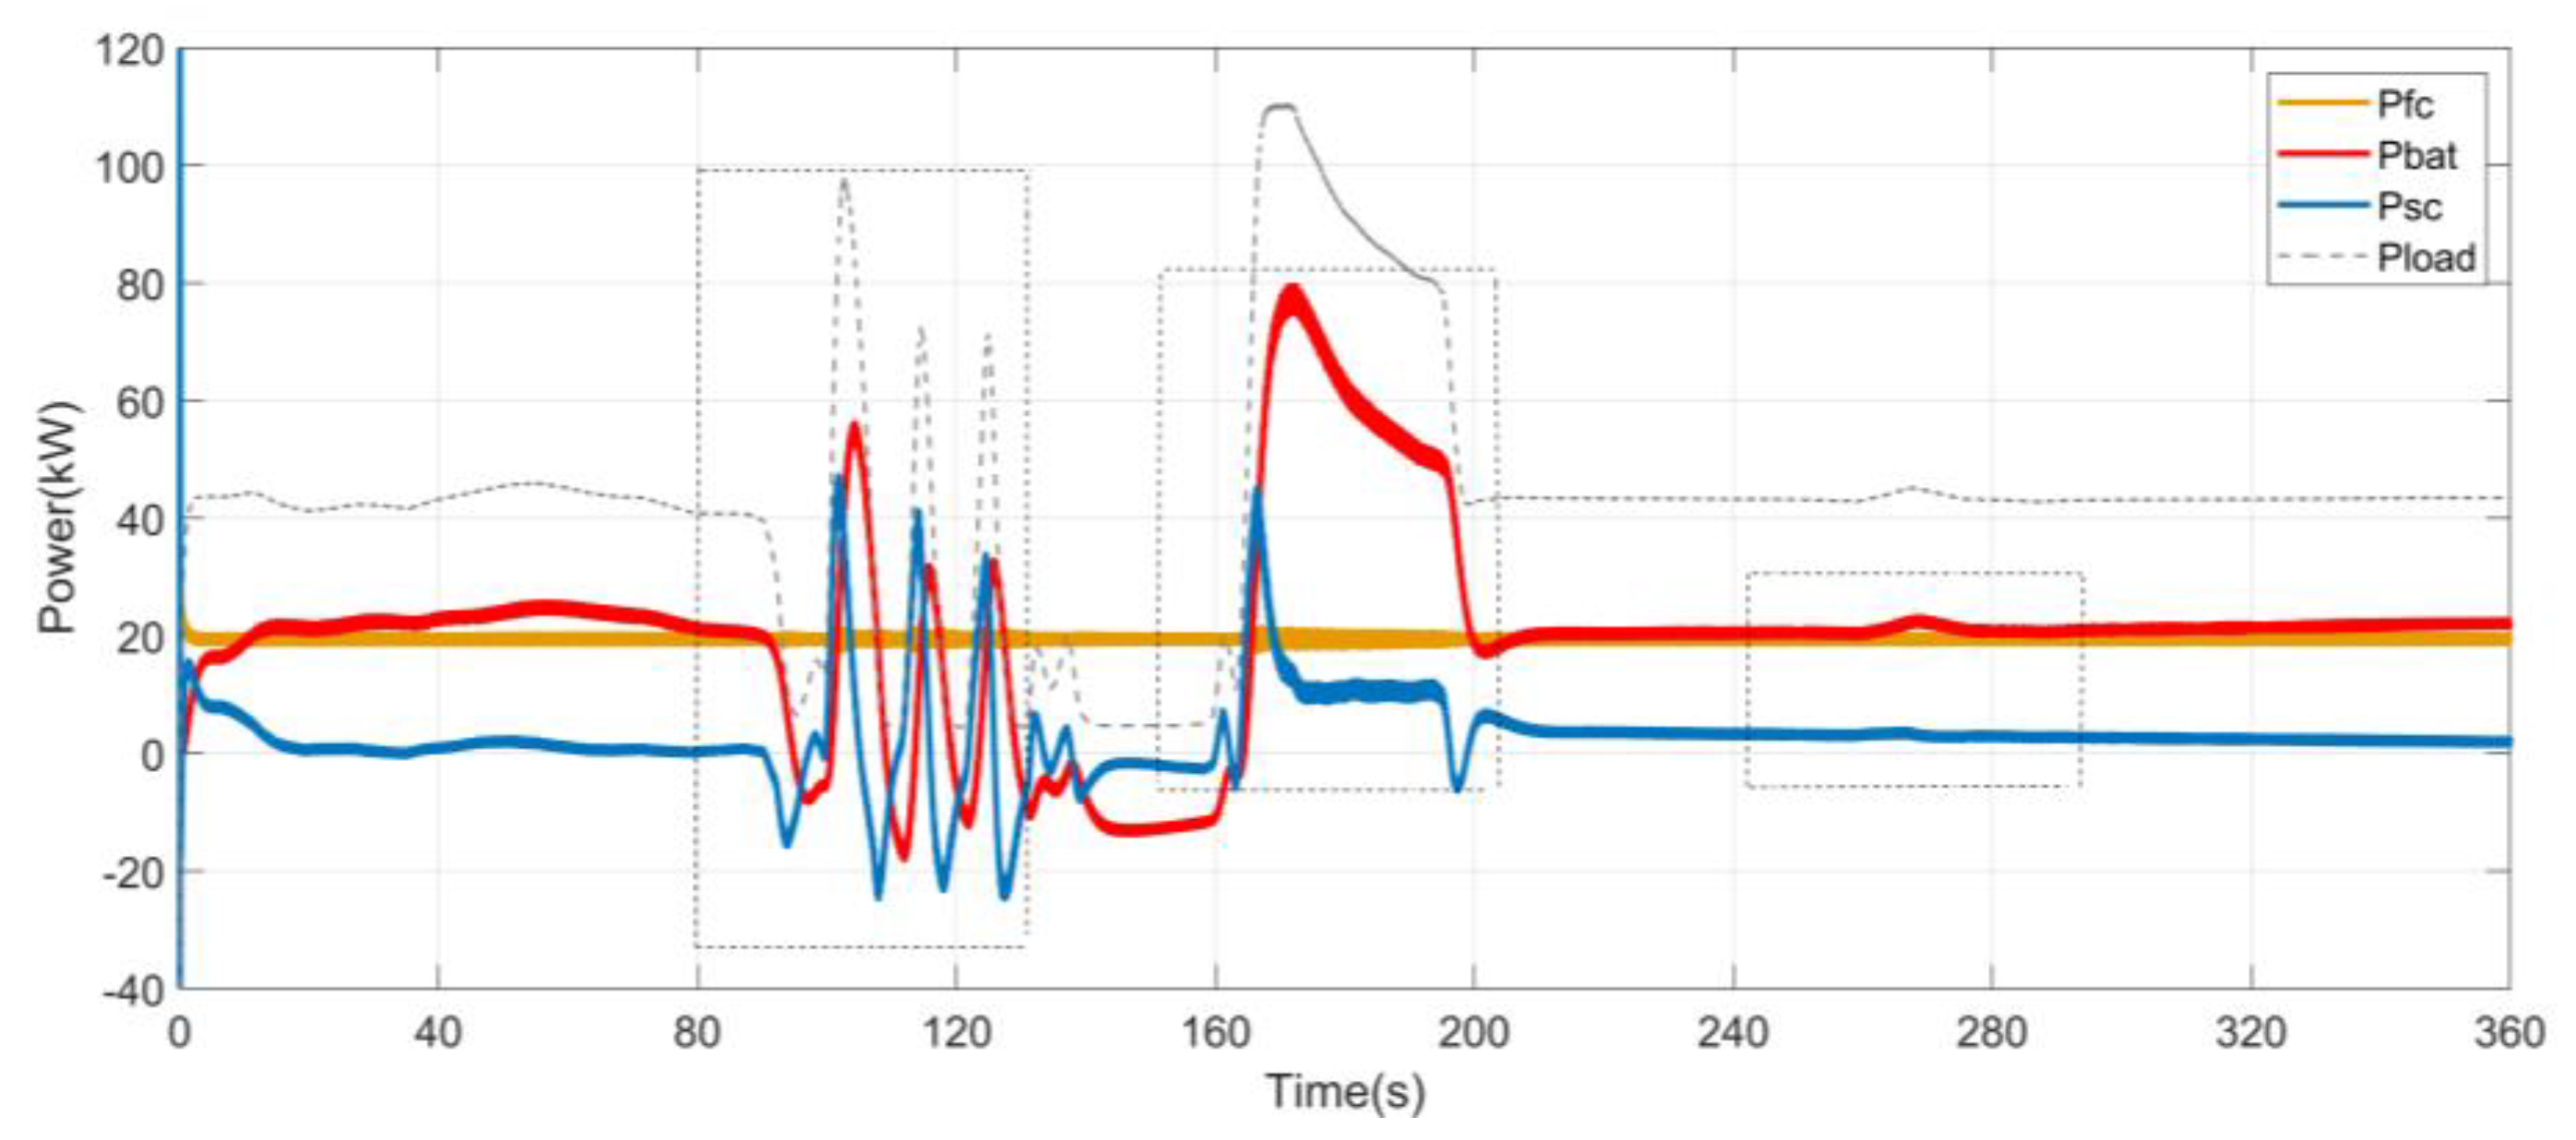
Figure 23.
Power curve under the conventional vessel energy management strategy.
Figure 23.
Power curve under the conventional vessel energy management strategy.
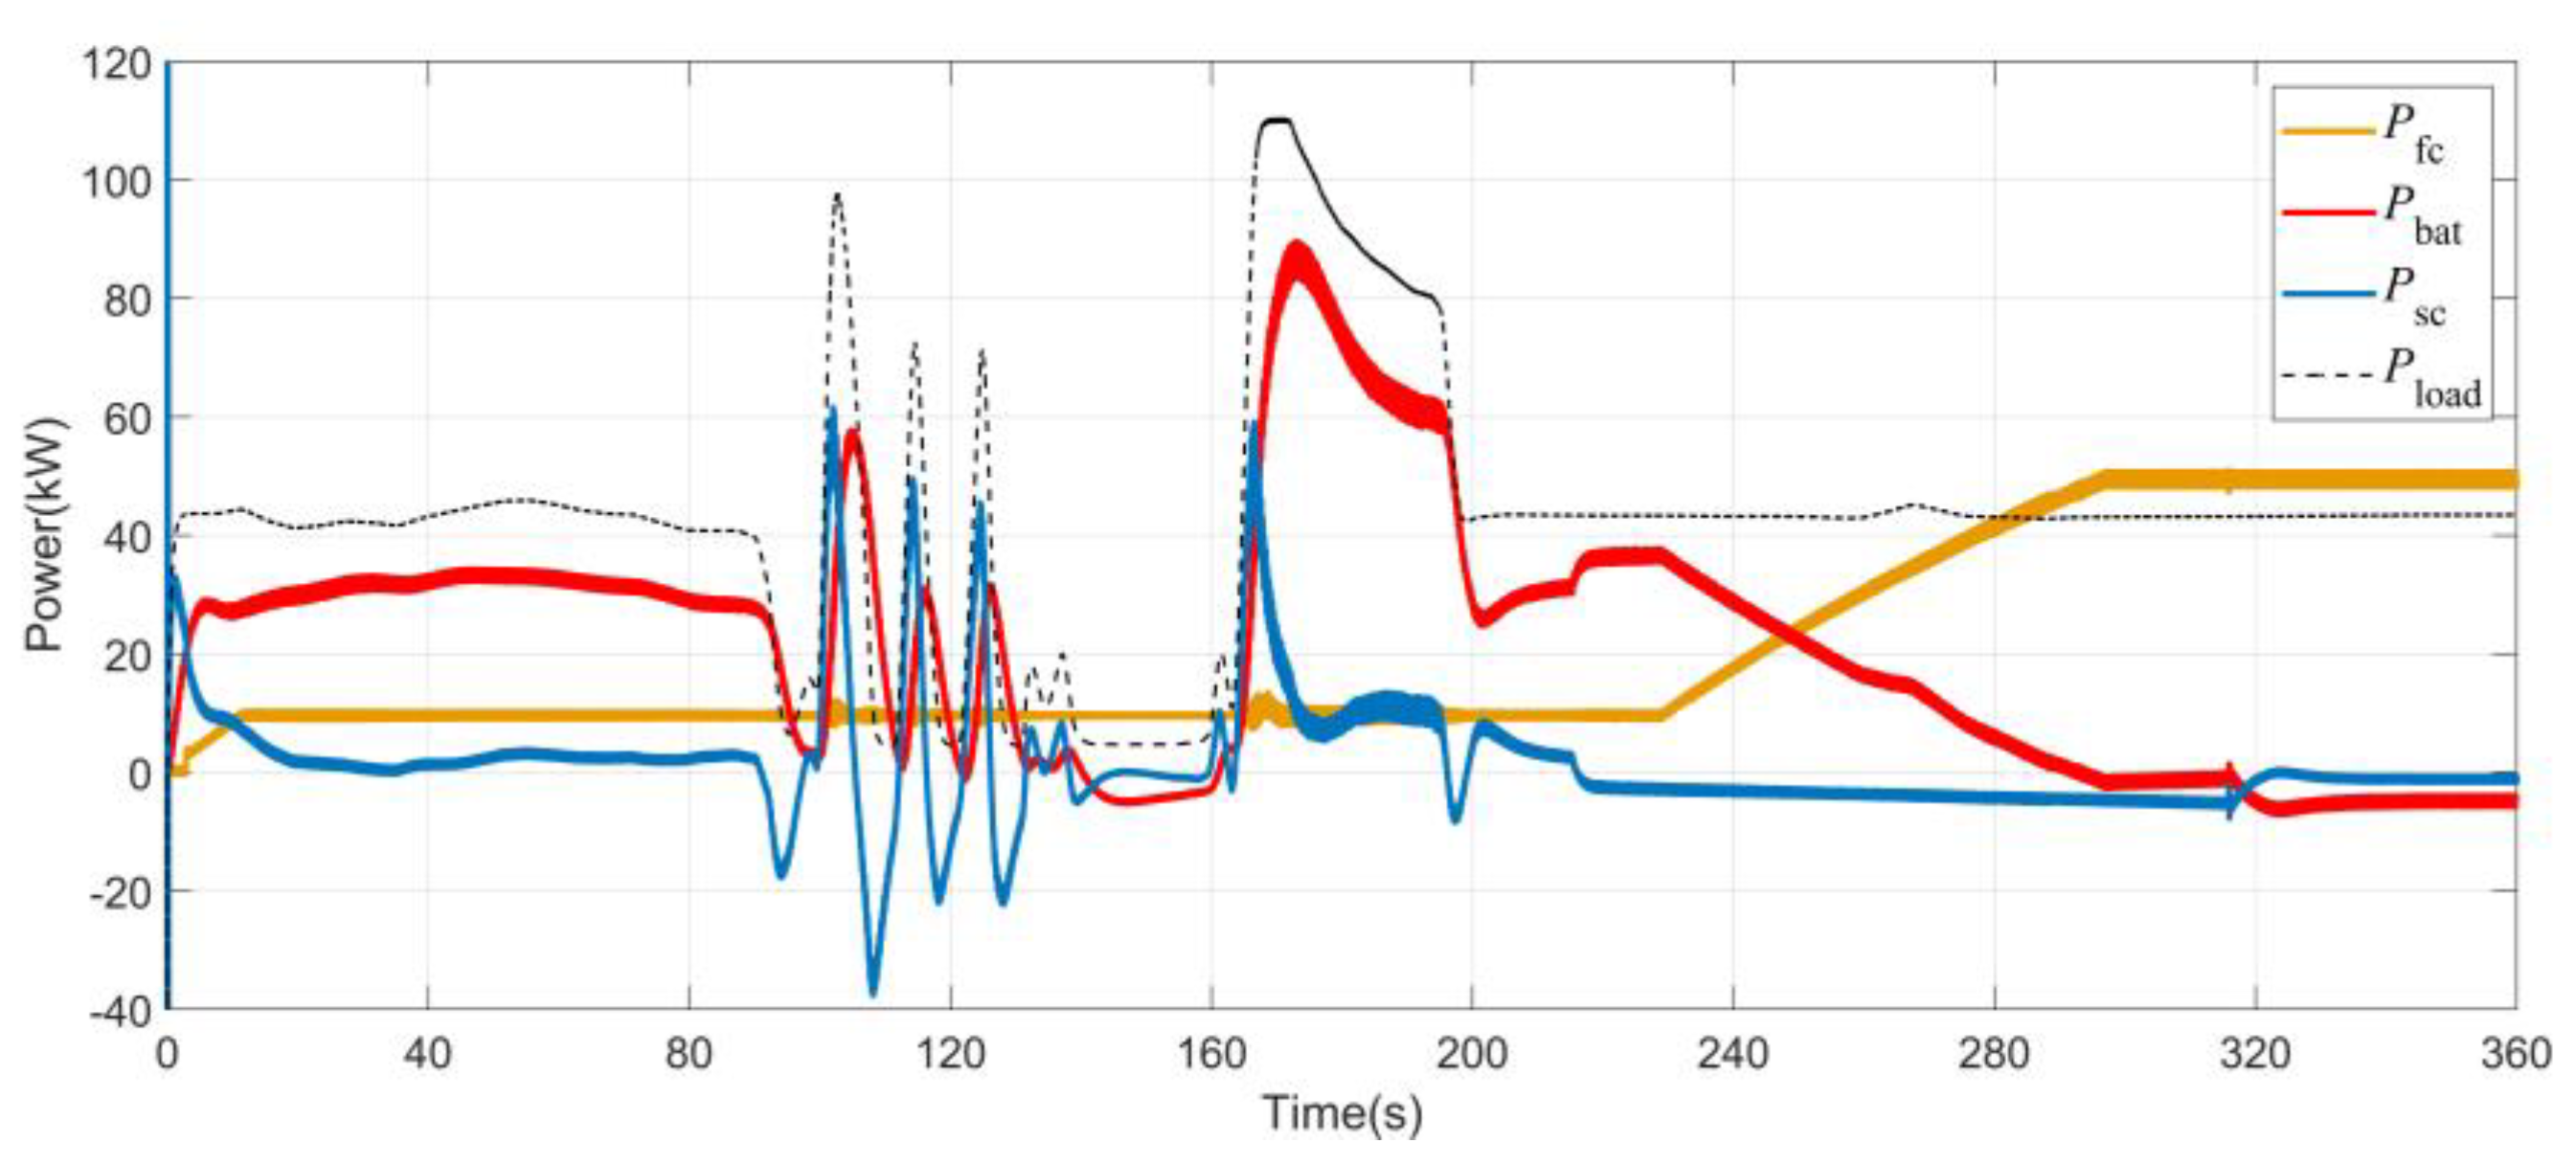
Figure 24.
Power curve plot with the improved vessel energy management strategy.
Figure 24.
Power curve plot with the improved vessel energy management strategy.
Figure 25.
Variation in the SOC value of two lithium batteries under different strategies: (a) conventional vessel energy management strategy; (b) improved vessel energy management strategy.
Figure 25.
Variation in the SOC value of two lithium batteries under different strategies: (a) conventional vessel energy management strategy; (b) improved vessel energy management strategy.
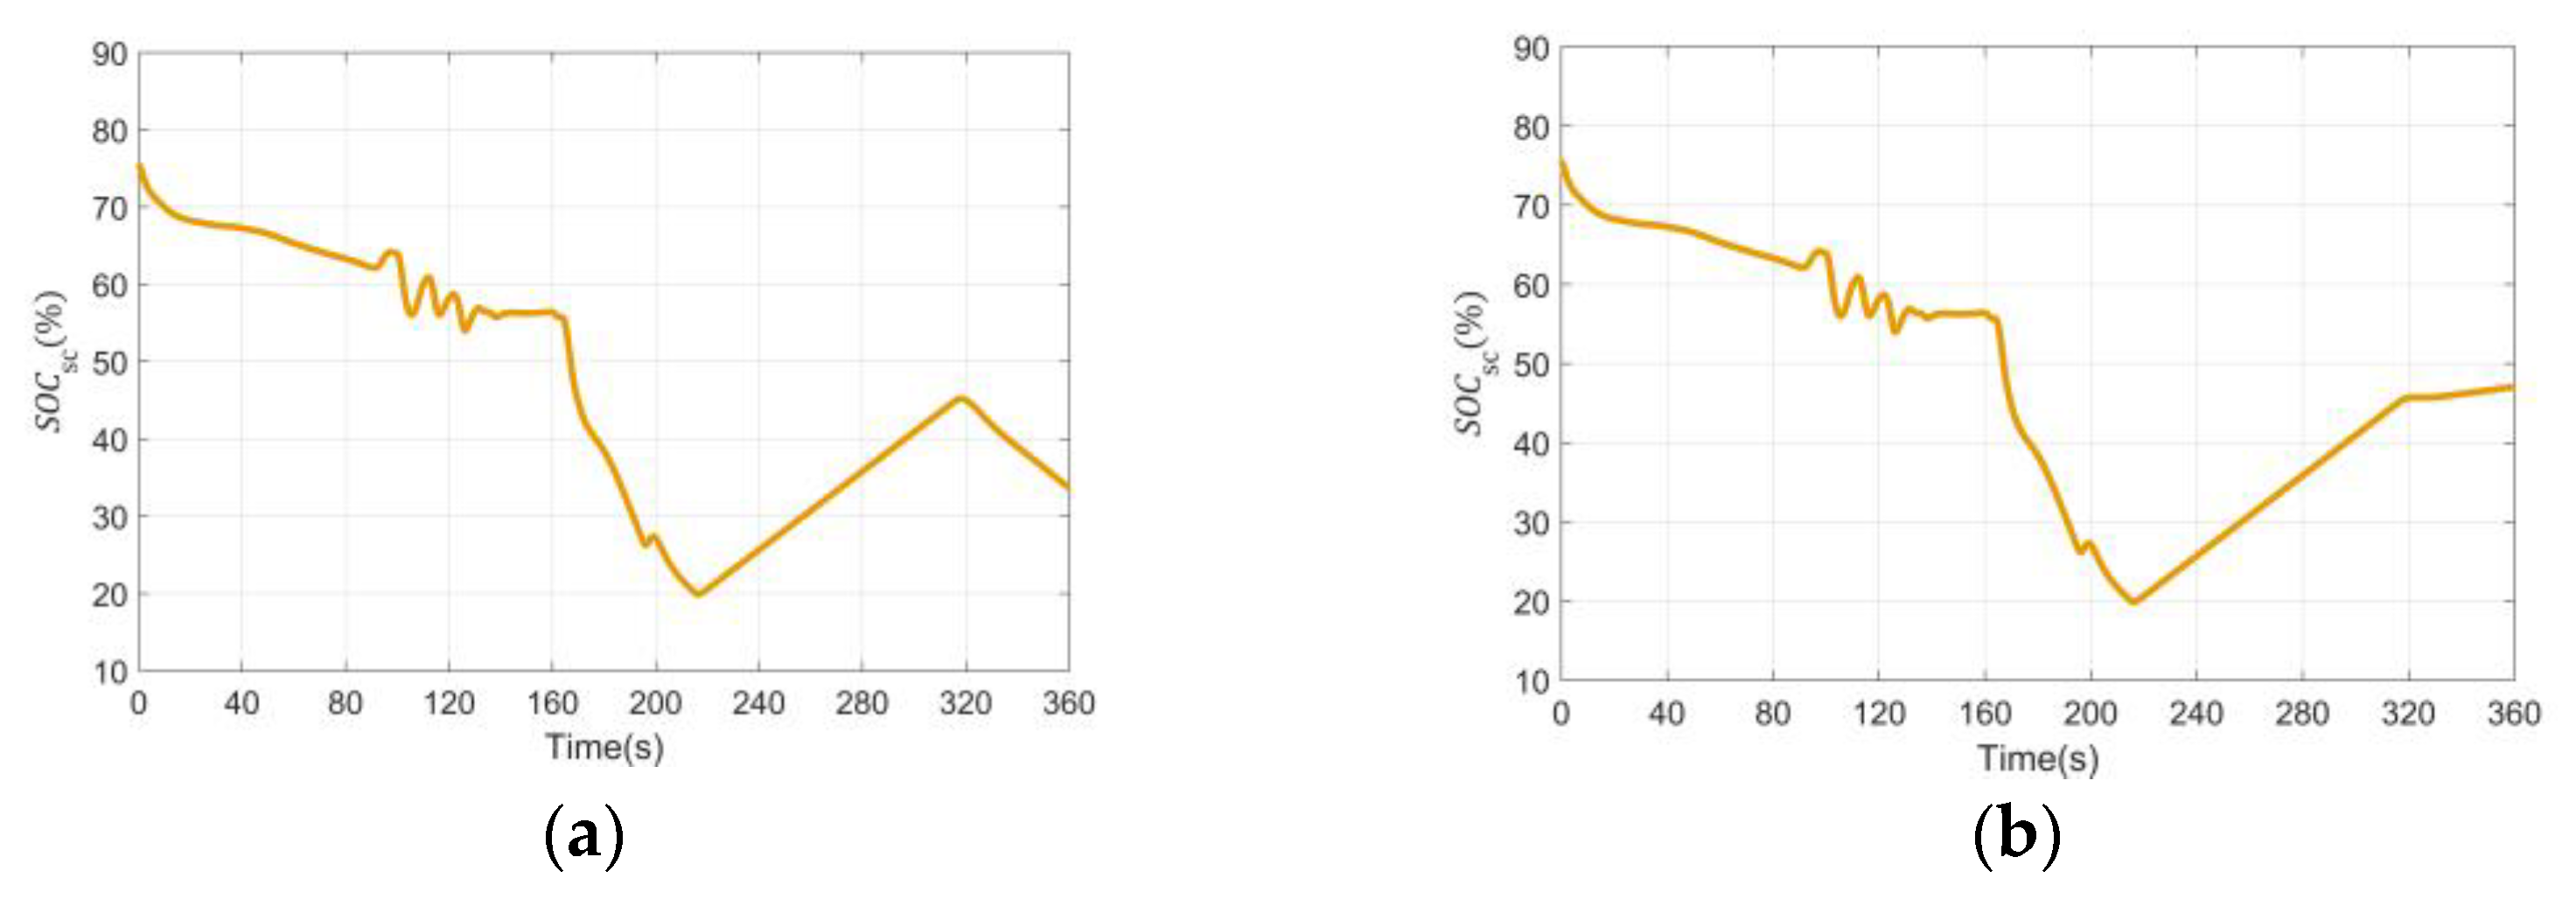
Figure 26.
Variation in the SOC value of the supercapacitor with different strategies: (a) conventional vessel energy management strategy; (b) improved vessel energy management strategy.
Figure 26.
Variation in the SOC value of the supercapacitor with different strategies: (a) conventional vessel energy management strategy; (b) improved vessel energy management strategy.
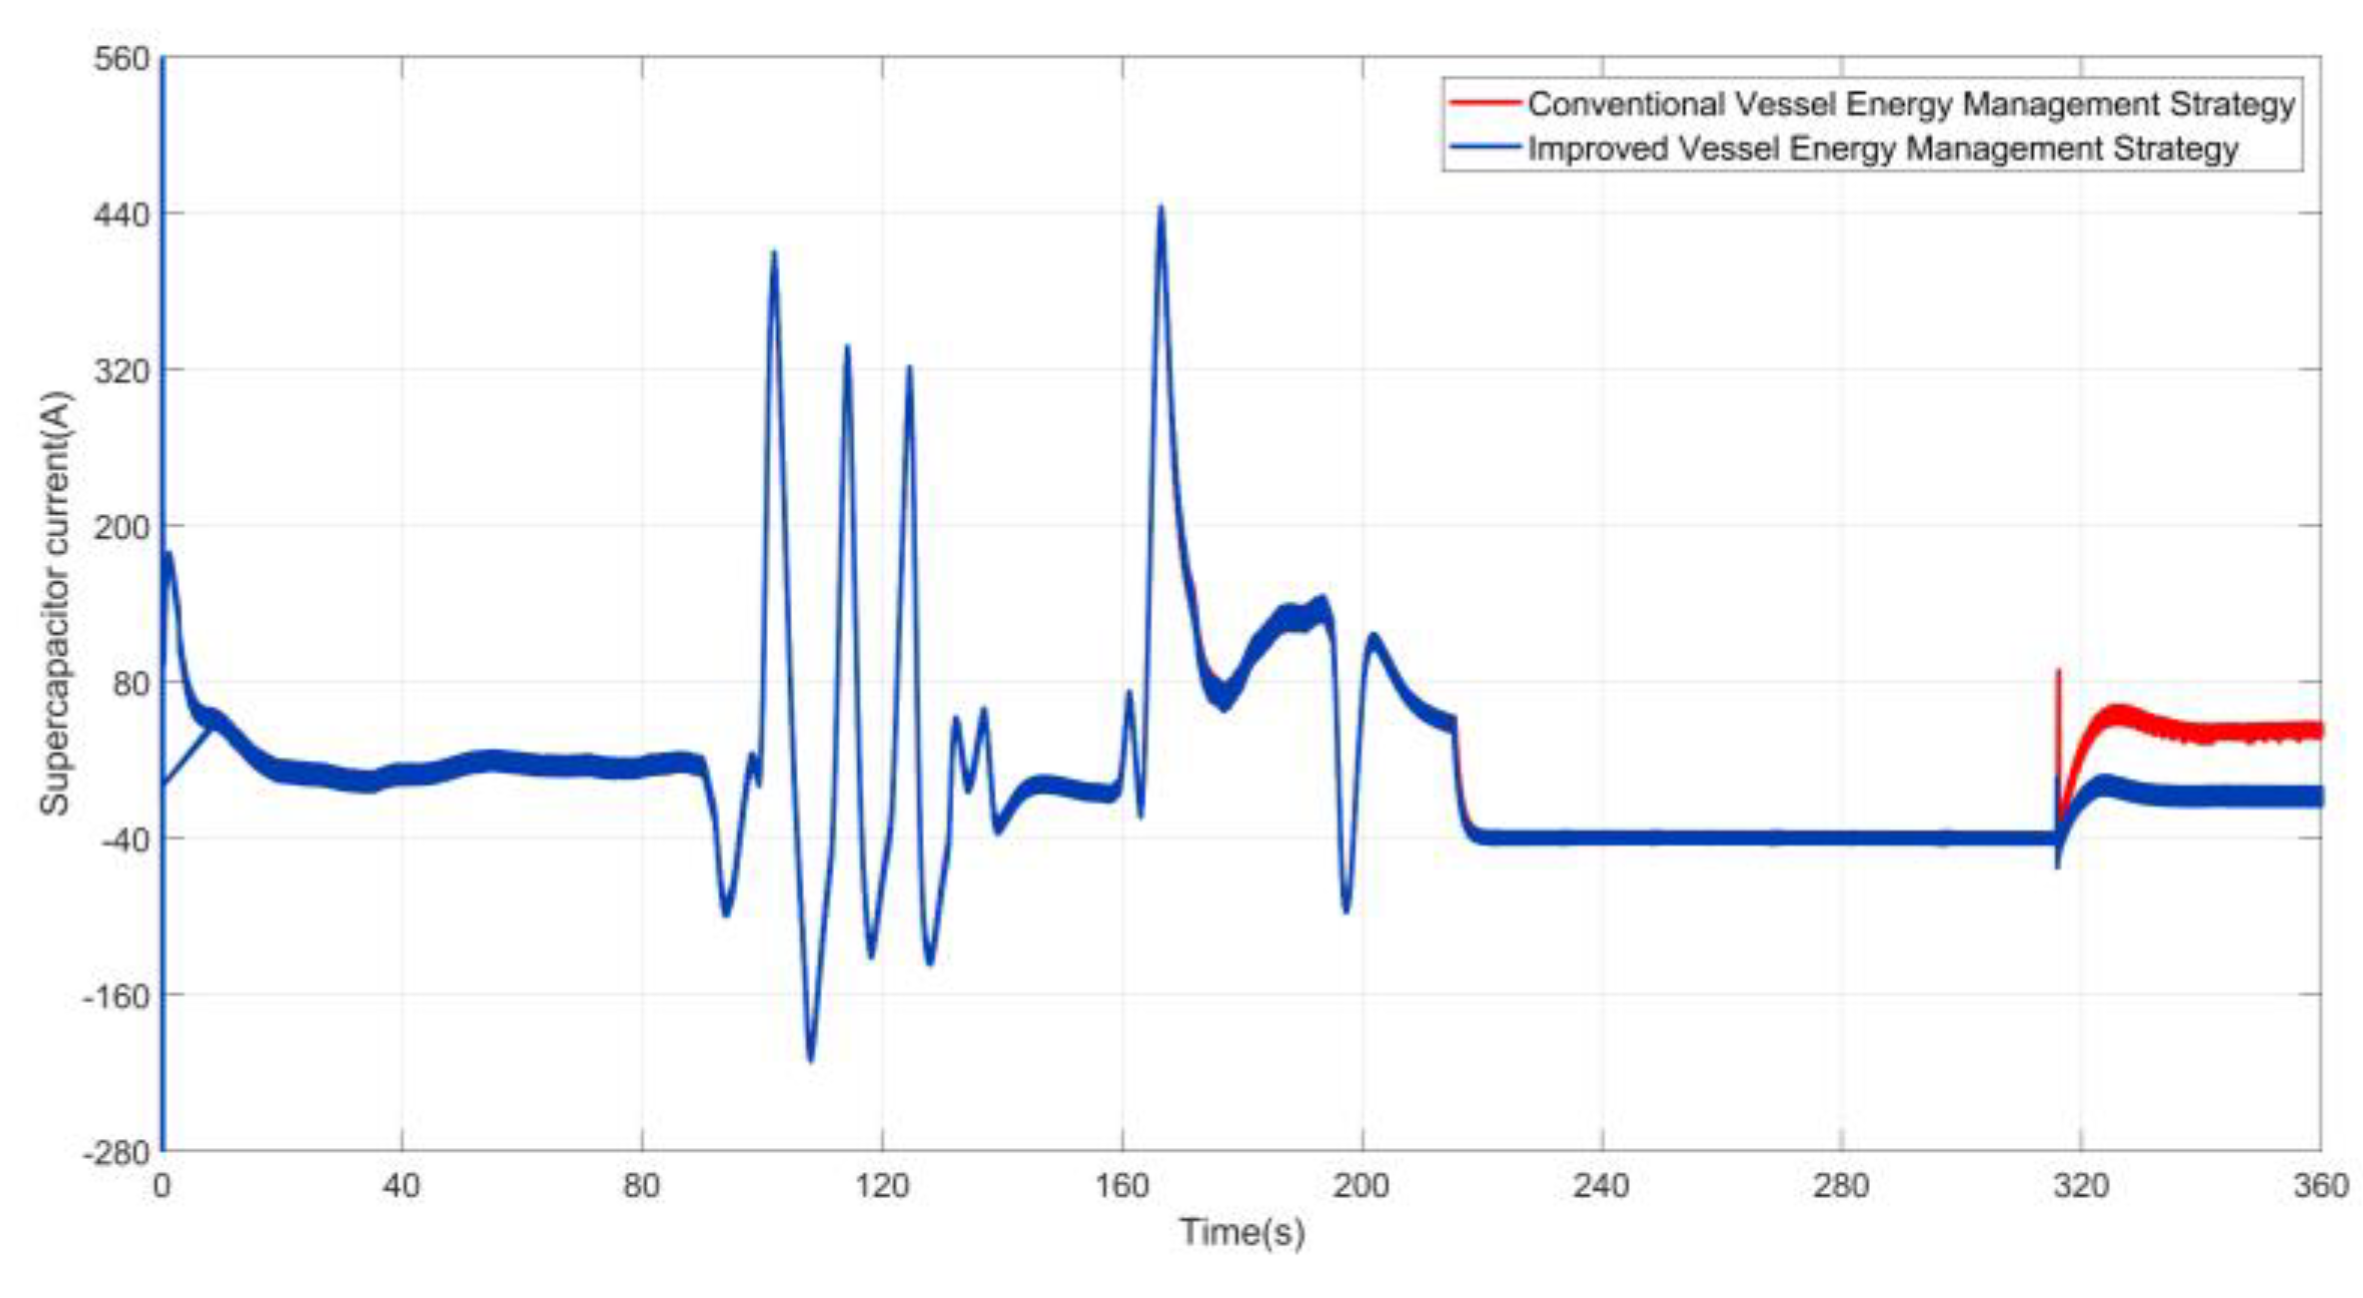
Figure 27.
Variation in the supercapacitor output current under different strategies.
Figure 27.
Variation in the supercapacitor output current under different strategies.
Figure 28.
Bus voltage fluctuation graph for different strategies: (a) conventional vessel energy management strategy; (b) improved vessel energy management strategy.
Figure 28.
Bus voltage fluctuation graph for different strategies: (a) conventional vessel energy management strategy; (b) improved vessel energy management strategy.
Table 1.
Parameters related to stability analysis.
Table 1.
Parameters related to stability analysis.
| Parameters | Value |
|---|
| |
| |
| |
| |
| 20~100 rad/s |
Table 2.
Table of rules for variable filter time constants.
Table 2.
Table of rules for variable filter time constants.
| | SOCess < SOCmin | SOCmin ≤ SOCess ≤ SOCmax | SOCmax ≤ SOCess |
|---|
| Normal Navigation Phase |
|
|
|
| Port Call, Shore, and Offshore Phase |
|
|
|
Table 3.
Relationship between the depth of discharge of a lithium battery and its cycle life.
Table 3.
Relationship between the depth of discharge of a lithium battery and its cycle life.
| Discharge Depth | Cycle Life/Time |
|---|
| 0.2 | 50,000 |
| 0.4 | 14,000 |
| 0.6 | 8000 |
| 0.8 | 6000 |
| 1 | 4000 |
Table 4.
Improvement strategy table.
Table 4.
Improvement strategy table.
| | FC Output Power | Lithium Battery Output Power | Ultracapacitor Output Power |
|---|
| State = 1 | ] | ] | ] |
| State = 2 | ] | ] | ] |
Table 5.
Table of simulation parameters for applying sag control.
Table 5.
Table of simulation parameters for applying sag control.
| Parameter Name | Take Value | Parameter Name | Take Value |
|---|
| Lithium Battery Voltage | 240 V | Initial Sag Factor | 0.01 |
| DC Bus Voltage | 560 V | Rated Capacity of Energy Storage Module | 5 Ah |
| Input-Side Capacity | | Output-Side Capacity | 4 mF |
| Inductance | 5 mH | Switching Frequency | 10 kHz |
Table 6.
Parameter setting table of the simulation model of the vessel hybrid power system.
Table 6.
Parameter setting table of the simulation model of the vessel hybrid power system.
| Category | Parameter | Numerical Value |
|---|
| DC Bus | Nominal Voltage | 560 V |
| FC | Nominal Power | 100 kW |
| Current Loop Controller (P/I) | 21.92/6232.88 |
| Lithium Battery | Nominal Capacity | 2 × 50 Ah |
| Nominal Voltage | 240 V |
| Voltage Loop Controller (P/I) | 3.5/52.5 |
| Current Loop Controller (P/I) | 21.92/6232.88 |
| Initial Value of Sag Coefficient | 0.3 |
| Supercapacitor | Nominal Capacity | 63 F |
| Nominal Voltage | 250 V |
| Voltage Loop Controller (P/I) | 3.5/52.5 |
| Current Loop Controller (P/I) | 21.92/6232.88 |
| Constant Current Discharge Reference Current | 40 A |
| Constant Current Charging Reference Current | 40 A |
| Load | Load Power | 4.45~110 kW |
Table 7.
Comparison of the results of each index before and after considering the depth of discharge of lithium batteries.
Table 7.
Comparison of the results of each index before and after considering the depth of discharge of lithium batteries.
| Indicator | Conventional Vessel
Energy Management Strategy | Improved Vessel Energy Management Strategy |
|---|
| Hydrogen Consumption/g/day | 3200 | 4032 |
| Life Loss | 2.9 × 10⁻³ | 1.83 × 10⁻³ |


 ,
, 


