

Punctiform Breakup and Initial Oceanization in the Central Red Sea Rift
by
 , ,
, ,
Ya-Di Sang
1,
Bakhit M. T. Adam
1,
Chun-Feng Li
1,2,3,*,
Liang Huang
1,
Yong-Lin Wen
1,
Jia-Ling Zhang
1,4 and
Yu-Tao Liu
1,5 1
Ocean College, Zhejiang University, Zhoushan 316021, China
2
Hainan Institute, Zhejiang University, Sanya 572025, China
3
Laboratory for Marine Mineral Resources, Qingdao National Laboratory for Marine Science and Technology, Qingdao 266237, China
4
Key Laboratory of Submarine Geoscience, Second Institute of Oceanography, Ministry of Natural Resources, Hangzhou 310012, China
5
Science & Technology on Integrated Information System Laboratory, Institute of Software, Chinese Academy of Sciences, Beijing 100190, China
*
Author to whom correspondence should be addressed.
J. Mar. Sci. Eng. 2023, 11(4), 808; https://doi.org/10.3390/jmse11040808
Submission received: 9 March 2023
/
Revised: 6 April 2023
/
Accepted: 7 April 2023
/
Published: 10 April 2023
(This article belongs to the Special Issue Recent Advances in Geological Oceanography II)
Abstract
:The Central Red Sea Rift is a natural laboratory to study the transition from rifting to spreading. Based on new reflection seismic profiles and gravity modeling, we examined the crustal structure, tectonic evolution, breakup mechanism, and future evolution of the Central Red Sea Rift. Along this rift axis, the breakup of continental lithosphere is discontinuous and the oceanic crust is limited to the axial deeps. The punctiform breakup and formation of deeps is assisted by mantle upwelling and topographic uplift, but the nucleation is directly controlled by the normal-fault system. The discontinuities spaced between axial deeps within the relatively continuous central troughs are presently axial domes or highs and will evolve into new deeps with tectonic subsidence. Isolated deeps will grow and connect with each other to become a continuous central trough, before transitioning into a unified spreading center.
1. Introduction
The mechanism forming the very first piece of oceanic crust during continental breakup has yet to be better understood [1,2,3,4,5,6]. The Central Red Sea Rift is transitional between the southern Red Sea Rift, which has developed typical seafloor spreading with continuous seafloor magnetic stripes, and the northern part, which lacks a rift valley and magnetic anomalies (Figure 1a) [1,7,8,9]. The Central Red Sea Rift provides a unique window to understanding the initial formation of oceans, as it is now undergoing the final breakup and initial oceanization [10,11,12,13].
The Red Sea Rift connects with the East Africa Rift System and the Gulf of Aden at the Afar Triple Junction (Figure 1a). It developed on the broad Precambrian Arabian–Nubian shield that was strongly influenced by the Neoproterozoic Pan-African collisions that formed NW-striking shear systems, suture zones, and lineaments [1,14]. The Arabian–Nubian shield, as a part of Gondwanaland, has drifted northwards since the early Paleozoic and collided with Eurasia by the end of the Eocene to Oligocene, forming the Bitlis–Zagros Thrust (Figure 1a) [15,16,17]. The Arabian block relatively moved counter-clockwise with respect to the Nubia block (Figure 1a), and the Cenozoic NW-striking intercontinental rift systems started to develop along Pan-African inherited weak zones, in coincidence with Afar volcanism (~30 Ma) [17,18,19,20,21].
The Central Red Sea Rift has developed a series of spaced deeps with hypothesized formation of oceanic crust along the rift axis. Magnetic anomalies and high seismic velocity imply massive basaltic intrusions in the axial trough [22,23], and fresh basaltic rocks were collected at Deep Sea Drilling Project (DSDP) Site 226 in the Atlantis Ⅱ Deep (Figure 1b) [24,25,26]. The deeps become sparser, narrower, shorter, and shallower northwards (Figure 1b) [1,27,28,29]. Groups of relatively closely spaced deeps form central troughs, separated by inter-trough zones (ITZs) [22,27,30,31]. Within the troughs, deeps are further spaced by second-order discontinuities in axial domes or highs (Figure 1b). There exist marked differences in magnetic and gravity anomalies and structure and composition between the deeps and inter-trough zones [22,30,32,33,34,35,36]. Similar geomorphic and structural segmentation is also found in other propagation tips of spreading centers, such as the Ostler fault zone in New Zealand [37], the Cocos–Nazca spreading ridge [38], and the Woodlark spreading ridge [39], reflecting the mechanisms of initiation and propagation of mid-ocean ridges. The formation of the deeps and breakup mechanism of these initial spreading centers need to be clarified [37,38,39].
Figure 1.
(a) Tectonic settings and the magnetic anomaly map of the Red Sea Rift. Bathymetry data are from the GEBCO Compilation Group 2021 (https://www.gebco.net, accessed on 3 September 2021); magnetic anomaly data are from EMAG2 (https://ngdc.noaa.gov/geomag/emag2.html, accessed on 2 March 2020). Grey arrows show the plate movement of the Arabian Plate relative to the Nubia Plate, and the direction and velocity are calculated from the model MORVEL [40]. Grey dashed box shows the area of Figure 1b. (b) Bathymetry of the Central Red Sea. Red lines show the locations of the reflection seismic profiles used in this study, the black dots show sites 225–228 on the DSDP Leg 23 [24,41,42,43], and the white lines represent the “discontinuities” between axial deeps within the trough.

In the Central Red Sea Rift, the nature of crust outside the deeps and the forces controlling continental lithosphere breakup are still controversial. It was proposed that the deeps are nuclei oceanic crusts formed by hotspot [25,27], or edge-driven mantle convection [10,18], surrounded by continental crust with basaltic intrusions [11,18,22,44,45,46]. The deeps may also be pull-apart basins under regional pure shear crustal stretching, in the early stage of punctiform fracturing [31,47,48]. In a two-stage seafloor spreading model (41–34 and 4–5 Ma, respectively), Girdler and Styles [19] suggested that the oceanic crust is not limited within the main trough, but even extend over the whole shelves of the Red Sea. Finally, the deeps may be just “windows” of the underlying well-developed spreading center, exposed by the dissolution of salt deposits [5,32,49,50,51,52].
Existing models fail to reach a consensus on the distribution of oceanic crust in the Red Sea Rift, and often neglect the interaction between mantle activities and tectonism. To study the rifting process and the formation of the axial deeps, we interpret three new reflection seismic profiles perpendicular to the rift axis. The eastern ends of the three profiles reach different axial zones of the Central Red Sea Rift (Figure 1b), providing a chance to reveal evolution from axial deeps to the inter-trough zones. We establish the initial oceanization model of the Central Red Sea Rift to explain how a continuous spreading center forms and how the rift to drift transition will be achieved.
2. Materials and Methods
2.1. Reflection Seismic Data Acquisition and Interpretation
The reflection seismic lines extend from the west shelf, crossing the main trough margin, to Red Sea Rift axis, for more than 80 km in distance (Figure 1b). They were acquired and processed during the CPOC08 survey in 2008 by the Oil Exploration and Production Authority, Sudan Ministry of Energy. The data acquisition parameters are listed in Table 1. The data processing steps include low-cut band pass filtering, auto despike/manual bad trace editing, F–K filtering, wave equation multiple reduction, geometrical spreading compensation and exponential gain, surface consistent amplitude correction, Tau-P deconvolution, surface related multiple elimination, high resolution demultiple filtering, prestack time migration (PSTM), poststack zero phase deconvolution, FX-DCON, AGC, time variant band pass, and equalization.
Based on the extensive geological studies and DSDP drill results [17,24,41,42,43,45,46,48,53,54,55,56,57,58,59], three regional seismic unconformities in addition to the acoustic basement can be identified: the top and bottom of salt deposition, and the reflector S, which can be traced in the whole rift basin and is regarded as the transition from rifting to drifting at 5 Ma in the Southern Red Sea Rift [16,17,19,22,60] (Figure 2).
From the Oligocene to the Middle Miocene, the Red Sea Rift experienced constant extension and subsidence [15,16,17]. The seawater channels at the northern and southern ends of the Red Sea rift opened successively and the sedimentary facies evolved from terrestrial to hemipelagic-deep marine deposits (Figure 2) [61,62]. Due to the reorganization of the plate kinematics along the Aqaba–Levant transform boundary at ~14 Ma, the seawater exchange with the Mediterranean was restricted [12,16,62,63,64,65]. In addition, the climate became arid to semiarid [32]. From the middle of Middle Miocene to the end of Middle Miocene, evaporites were widely deposited across the whole Red Sea (Figure 2), with thickness varying from tens of meters to thousands of meters [32,59,66]. After the long period of tectonic quiescence and saline lake sediment (Figure 2) [25,60,67,68], during the late Miocene, the Red Sea Rift basin reconnected with the Indian Ocean [62,69], forming layered evaporite and shallow marine deposits (Figure 2). The top of this sequence is truncated by the reflector S. During the Plio–Pleistocene, the Red Sea Rift Basin maintained a shallow marine environment (Figure 2). The sedimentary unit deposited in a stable and relatively low-energy hydrodynamic environment.
2.2. Free-Air Gravity Modeling
To study the nature of crust and deep structure of the Central Red Sea Rift, we apply gravity modeling to explore the density structure of the study area.
The Moho reflector is unrecognizable in our profiles, so we calculated the Moho depths through gravity inversion based on the Parker–Oldenburg method [70,71], following the procedures of Bai et al. [72]. We estimated the mantle residual anomaly from the Bouguer gravity anomaly model WGM2012 [73], after sediment thickness correction based on Crust 1.0 [74] and GlobSed [75], and lithospheric thermal correction based on the global age model of oceanic crust [76,77].
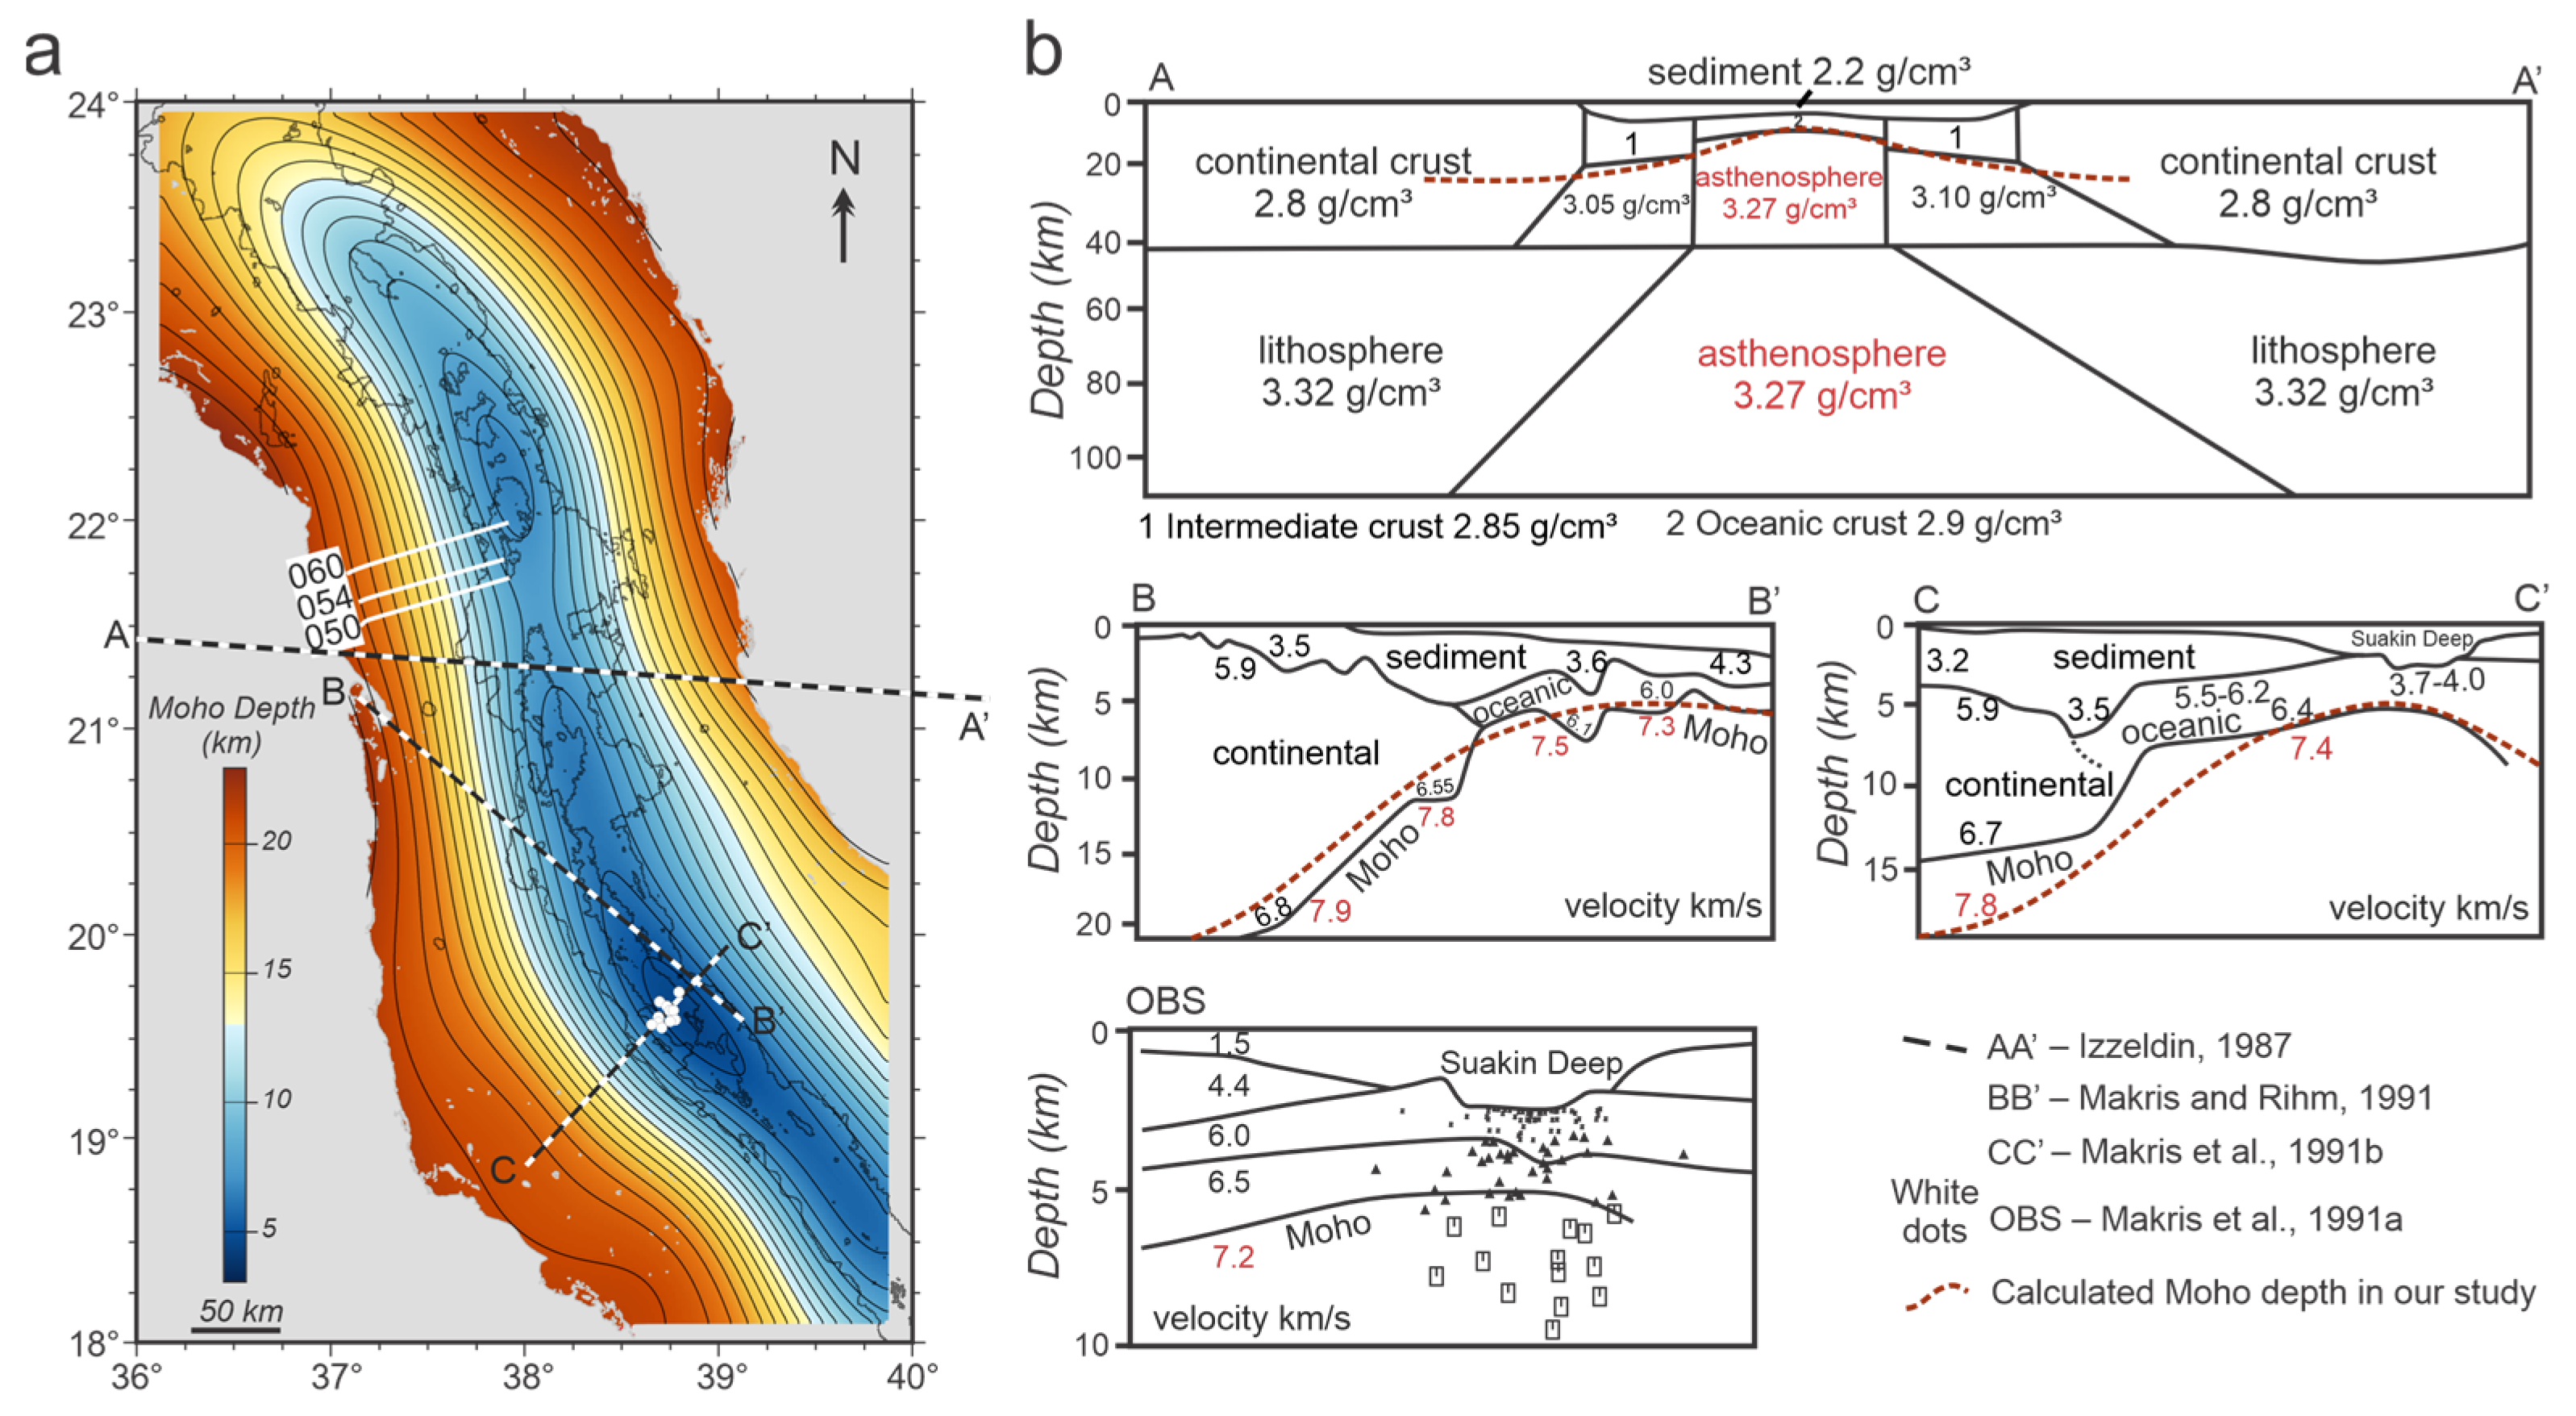
Figure 3a shows the calculated Moho depth in the Central Red Sea region. We compared our results with some published density and velocity structure profiles around the study area to test the reliability of our results (Figure 3b) [16,35,47,78,79]. Our calculated values are close to previously observed results especially near the rift axis (Figure 3b). The errors in the continental margins were caused by thick and variable sediments, and the gravity effects of these sediments may have been inadequately corrected. Moho depths vary from a maximum of >20 km at the continental margin to about 5 km at the southern rift axis (Figure 3a). Along the rift axis, Moho rises under the troughs and deepens under inter-trough zones. Moho also deepens northwards, consistent with the northward propagation of the Red Sea Rift (Figure 3a).
Initial density models were built based on reflection seismic data. In gravity modeling, we update the model until the error between calculated values and observed free-air gravity anomaly is acceptable. The structural layers and parameters we set are shown in Table 2, with references to previously published results [7,9,47,78,79,80,81].
3. Tectonic Evolution and Density Structure of the Central Red Sea Rift
3.1. Tectonic Evolution of the Central Red Sea Rift
Referring to the sedimentary evolution of the Red Sea (Figure 2) [17,24,41,42,43,45,46,48,53,54,55,56,57,58,59], we can identify four major unconformities in the reflection seismic profiles. The top of the acoustic basement reflectors are indistinct, but can be identified as the bottom of the sediment cover. The top and bottom of evaporite deposition are mainly traced according to the different reflector characteristics between evaporite deposition and sub- and supraevaporite seismic units (Figure 4, Figure 5 and Figure 6). Evaporite deposition shows chaotic and blank internal reflection and minor high amplitude reflectors from thin beds of anhydrite, shale, mudstone, and siltstone [56,57], and the sub- and supraevaporite strata show moderately continuous reflectors of intermediate to high amplitudes (Figure 4, Figure 5 and Figure 6). The reflector S is a significant regional unconformity, showing continuous strong reflectors. Faults are marked by offsets in sequences, continuous reflectors, and major interpreted horizons (Figure 4, Figure 5 and Figure 6).
3.1.1. Differential Sedimentary and Tectonic Evolution between the Axial Deep and ITZ
In the center of the Hatiba Deep, the acoustic basement is exposed to the seafloor with a strong reflector distinguishable from the reflectors in the marginal area (Figure 4). In profiles 054 and 050, the basement close to the southern inter-trough zone deepens and flattens again (Figure 5 and Figure 6). Intense fault activities concentrated at the boundaries of axial deeps along the central trough, forming step-fault zones (Figure 4). On the contrary, in the inter-trough zones, basement faults occurred on the rift axis before the late Miocene (Figure 6), and the inter-trough zones experienced more uniform subsidence without active fault activities in the later stage (Figure 5 and Figure 6). Salt tectonics developed in the Central Red Sea Rift are mainly salt domes, salt walls, diapirism, salt pillows, and salt anticlines, usually forming angular unconformities and halokinetic sequences with the suprasalt strata (Figure 4, Figure 5 and Figure 6). Reflection seismic data reveals that evaporites were only exposed at the boundary fault escarpments of the axial deep, and they uniformly deposited at the ITZ, but were absent at the center of the deep (Figure 4, Figure 5 and Figure 6).
During the Plio–Pleistocene, the southern part of the Red Sea Rift started seafloor spreading and experienced the post-rift stage, while the central Red Sea Rift was still in the syn-rift stage. Intense fault activities during the third rifting stage only concentrated at the boundary of axial deep, shaping the step-fault zone and axial deep (Figure 4), leaving the southern inter-trough zone subsided uniformly (Figure 6). The development and structural style of salt tectonics correspond to the tectonic evolution of the whole rift basin. In the Central Red Sea Rift, salt flowage towards the axis driven by heterogeneous gravity load can strongly shape the geomorphology of the central trough [5,32,49,50,51]. The distribution of evaporites along the rift axis reflects potential differential salt movement towards the axial deep and ITZ influenced by the basement topography [5,32], or dissolution of the salt deposits in the axial deep associated with the hydrothermal circulation [32,52]. The differential tectonism and evaporite deposition between the axial deep and the ITZ shaped the rift axis with geomorphic segmentation.
3.1.2. Deformed Zone and Postevaporite Uplift
The acoustic basement in the wide marginal area has reflectors with moderate amplitude and continuity, and has gentle topography and forms horsts and grabens during the development of the continental margin (Figure 4, Figure 5 and Figure 6). Close to the rift axis, the basement becomes less continuous, intensively disturbed, and tends to bulge upward (Figure 4, Figure 5 and Figure 6) compared with acoustic basement reflectors in the wide marginal area. Evaporite deposition in our reflection seismic profiles shows chaotic or blank internal reflection (Figure 4, Figure 5 and Figure 6); while corresponding to the deformation of the basement, discontinuous strong reflectors were formed within the evaporites (Figure 7). The Pliocene–Pleistocene strata significantly thinned around the deep and are absent in the center of the Hatiba Deep (Figure 4 and Figure 5), but thickened again in the inter-trough zone (Figure 6). Evaporites that flow into the rift axis uniformly deposited at the ITZ, but were absent at the center of the deep (Figure 4, Figure 5 and Figure 6).
Based on the observations, we define the domain where the basement formed a dome-like structure and was significantly deformed as the deformed zone (Figure 4, Figure 5 and Figure 6). The up-bulge basement, significant thinning of Pliocene–Pleistocene strata, and the disturbance in the evaporites (Figure 4, Figure 5, Figure 6 and Figure 7) imply crustal vertical movements along the Central Red Sea Rift axis after the evaporite deposition. Similar basement deformation and regional sedimentary interruption were reported near the axial deeps, and are thought to be influenced by crustal vertical movements during lithospheric thinning [19,22,27,32,82].
3.1.3. Formation of the Axial Deep
Our reflection seismic data further revealed the differential sediment and tectonic evolution between the Hatiba Deep and the southern ITZ, suggesting differential vertical crustal movements between the axial deep and the inter-trough zone. Thinner Pliocene–Pleistocene strata around the deep than the inter-trough zone and the absence of evaporites in the center of the deep (Figure 7) indicate a high topography around the deep before subsidence. Evaporites uniformly deposited at the ITZ, but were absent at the center of the deep, implying the differential uplift that can influence the evaporite flowage into the rift axis. The high topography around the axial deep can obstruct salt flowage towards the deep [16,32], and the lack of the overlying Pliocene–Pleistocene strata can induce the dissolution of evaporites at the center of the deep [32]. Without the uplift and higher topography, the axial deep should be invaded by evaporites and covered by Pliocene–Pleistocene strata, like the inter-trough zone (Figure 6).
Therefore, we proposed that the axial deep was the center of the “Postevaporite Uplift” before collapsing to form deeps. After the evaporite was deposited, regional uplift occurred along the rift axis. The basement was deformed and bulged upward, overlying evaporite deposition was disturbed, and the Pliocene–Pleistocene sediments pinched out towards the rift axis (Figure 8a). During the third rifting stage, intense fault activities focused on the stress concentrations of early uplift, forming isolated axial deeps (Figure 4 and Figure 8b). However, the subsidence outside of the centers of uplift was uniform, forming gentle inter-trough zones without the development of the normal-fault system (Figure 7c).
3.2. Gravity Modeling Results
From the continental margin to the rift axis, the free-air gravity anomalies first reach a low (~−20 mGal) at the model distance of 20 km due to thick deposition of low-density salt, then increase to the maxima (~20 mGal) at the model distance of 60–80 km at the deformed zones, and finally decrease towards the rift axis (Figure 9). In the deformed zones, the free-air gravity anomaly highs in all three models are too large to be caused only by the bulge of the basement that we observed in the reflection seismic profiles (Figure 4, Figure 5 and Figure 6), even taking the high-density oceanic crust into account. Denser materials are needed under the deformed zones.
In the Central Red Sea Rift, high-density anomaly at the depths of 8–15 km can be caused by newborn oceanic crust under the whole main trough [22], prespreading igneous intrusions to the Precambrian Arabian–Nubian shield [11], mantle diapirs into the crust [27], or other processes related to the initial oceanization [83,84]. We have tested the newborn oceanic crust or igneous intrusion with densities ranging from 2.9 to 3.0 g/cm3 [80], but the calculated gravity anomalies were not high enough to fit the free-air gravity anomalies at the deformed zones, especially in profile 050. Tramontini and Davis [22] also noticed the density of the high-velocity layer under the axial trough almost needs to exceed the maximum density of igneous rocks to fit the free-air gravity anomaly and suggested the contribution of the mantle. We interpret the dense materials as upwelled mantle rocks (Figure 9). High average heat-flow value in the Red Sea and the formation of hot hydrothermal brine indicate a relatively shallower heat source [85]. Initial oceanic basalts collected in the rift axis reveal a high temperature but low-pressure melting, implying ascending mantle during the initial burst of oceanic crust [10]. Blocks of mantle-derived peridotite support the involvement of mantle upwelling during the evolution of the Central Red Sea Rift [45,46,53]. Mantle upwelling is a possible driven force for the postevaporite uplift we interpreted (Figure 8).
We confirm that the oceanic crust is only limited to the center of the axial deep. In profile 060 (Figure 9a), the low relief at the eastern end would have given much lower free-air gravity values than observation if the underlying crust was not oceanic. We model the range of the intermediate crust and find it is limited to the boundary of the deep, where the normal fault system is active. On the contrary, in profiles 054 and 050 (Figure 9b,c), the nature of the crust at the eastern ends of these profiles can not be oceanic or intermediate with the low free-air gravity anomalies, and the crust even thickens again to about 8 km in profile 050 (Figure 9c). The extremely thinned crust above the upwelled mantle in profiles 054 and 050 cannot be intermediate or/and oceanic crust either, or the calculated gravity values would exceed the observed values (Figure 9b,c).
3.3. Tectono-Geomorphic Segmentation of the Central Red Sea Rift
The Red Sea is a narrow young ocean with a burst of oceanic crust younger than 3–5 Ma in its southern part. Since ~5 Ma, the third rifting stage has strongly shaped the Central Red Sea Rift valley (Figure 4, Figure 5 and Figure 6). However, the Central Red Sea Rift does not have a typical spreading center yet, but formed segmentations of geomorphology, tectonism, and deep structure.
Geomorphic segmentation of the rift axis developed in two orders. The first-order segmentation consists of relatively continuous central troughs and inter-trough zones; within the troughs, there are still second-order discontinuities (axial domes or highs) between deeps (Figure 10). Salt movement and local dissolution influenced the geomorphology along the rift axis [5,32,49,50,51], but a simple sedimentary genesis cannot explain the regular segmentation.
The seismic reflection data reveal the differences in sedimentary and tectonic evolution between the axial deep and the inter-trough zone. Close to the axial deep, the reflector S was interrupted, and Pliocene–Pleistocene strata were quite thinned or even absent. The border faults controlled the significant tectonic subsidence (Figure 4). While the inter-trough zone had a variable tectonic condition, subsidence was uniform and hardly influenced by the fault activities during the third rifting stage, and the basement was deeply buried by thick sediments (Figure 5 and Figure 6). Correspondingly, differences in the nature of the crust between the axial deeps and inter-trough zones were further revealed by gravity models. The oceanic crust is only limited in the center of deeps bounded by the normal fault systems that developed during the third rifting stage (Figure 9), whereas in the inter-trough zone the continental crust thickens (Figure 9). Besides, the Moho tends to rise under the main troughs and deepens under the inter-trough zones (Figure 3). Bouguer gravity anomaly is higher in the axial deeps than the inter-trough zone and discontinuities [35], indicating the deep structure segmentation along the rift axis.
4. Punctiform Breakup and Initial Oceanization Mechanism
In contrast to previous views of a continuously developed spreading center or oceanic crust extending coast to coast [19,51], we argue that the Central Red Sea Rift is still at its initial oceanization. Differential evolution between the axial deeps and the intervals/segmentations support the punctiform breakup, which formed sparse oceanization windows interweaving with continental crust along the rift axis at first.
After the evaporite deposition in the middle Miocene, a regional uplift occurred, causing the basement bulge, sediment deformation, and anomalous thinning of the Pliocene–Pleistocene strata (Figure 4, Figure 5 and Figure 6). Gravity modeling suggests that the driving force of the uplift is mantle upwelling (Figure 9). Huismans et al. [86] also proposed the occurrence of asthenosphere upwelling and surface doming during passive extension of the intraplate rift after the end of syn-rift through numerical models. However, mantle upwelling did not directly cause the breakup of the continental lithosphere, contradicting previously proposed mantle-dominate breakup models [11,18,27,87,88]. Mantle upwelling thinned the continental crust to <5 km in thickness, but did not change the nature of the crust (Figure 9).
Mantle upwelling and regional uplift also concentrate stress. By comparing the effects of the uplift between the deep and the southern inter-trough zone (Figure 7), we conclude that the centers of the uplift were located in the present axial deeps. Consequently, the fault activities during the third rifting stage concentrated at the deep boundary controlled significant tectonic subsidence, while leaving the inter-trough zones tectonically quiescent (Figure 4, Figure 5 and Figure 6). It was the nucleation of the fault system that directly led to the punctiform breakup and the initial oceanization limited in the center of the deep (Figure 9).
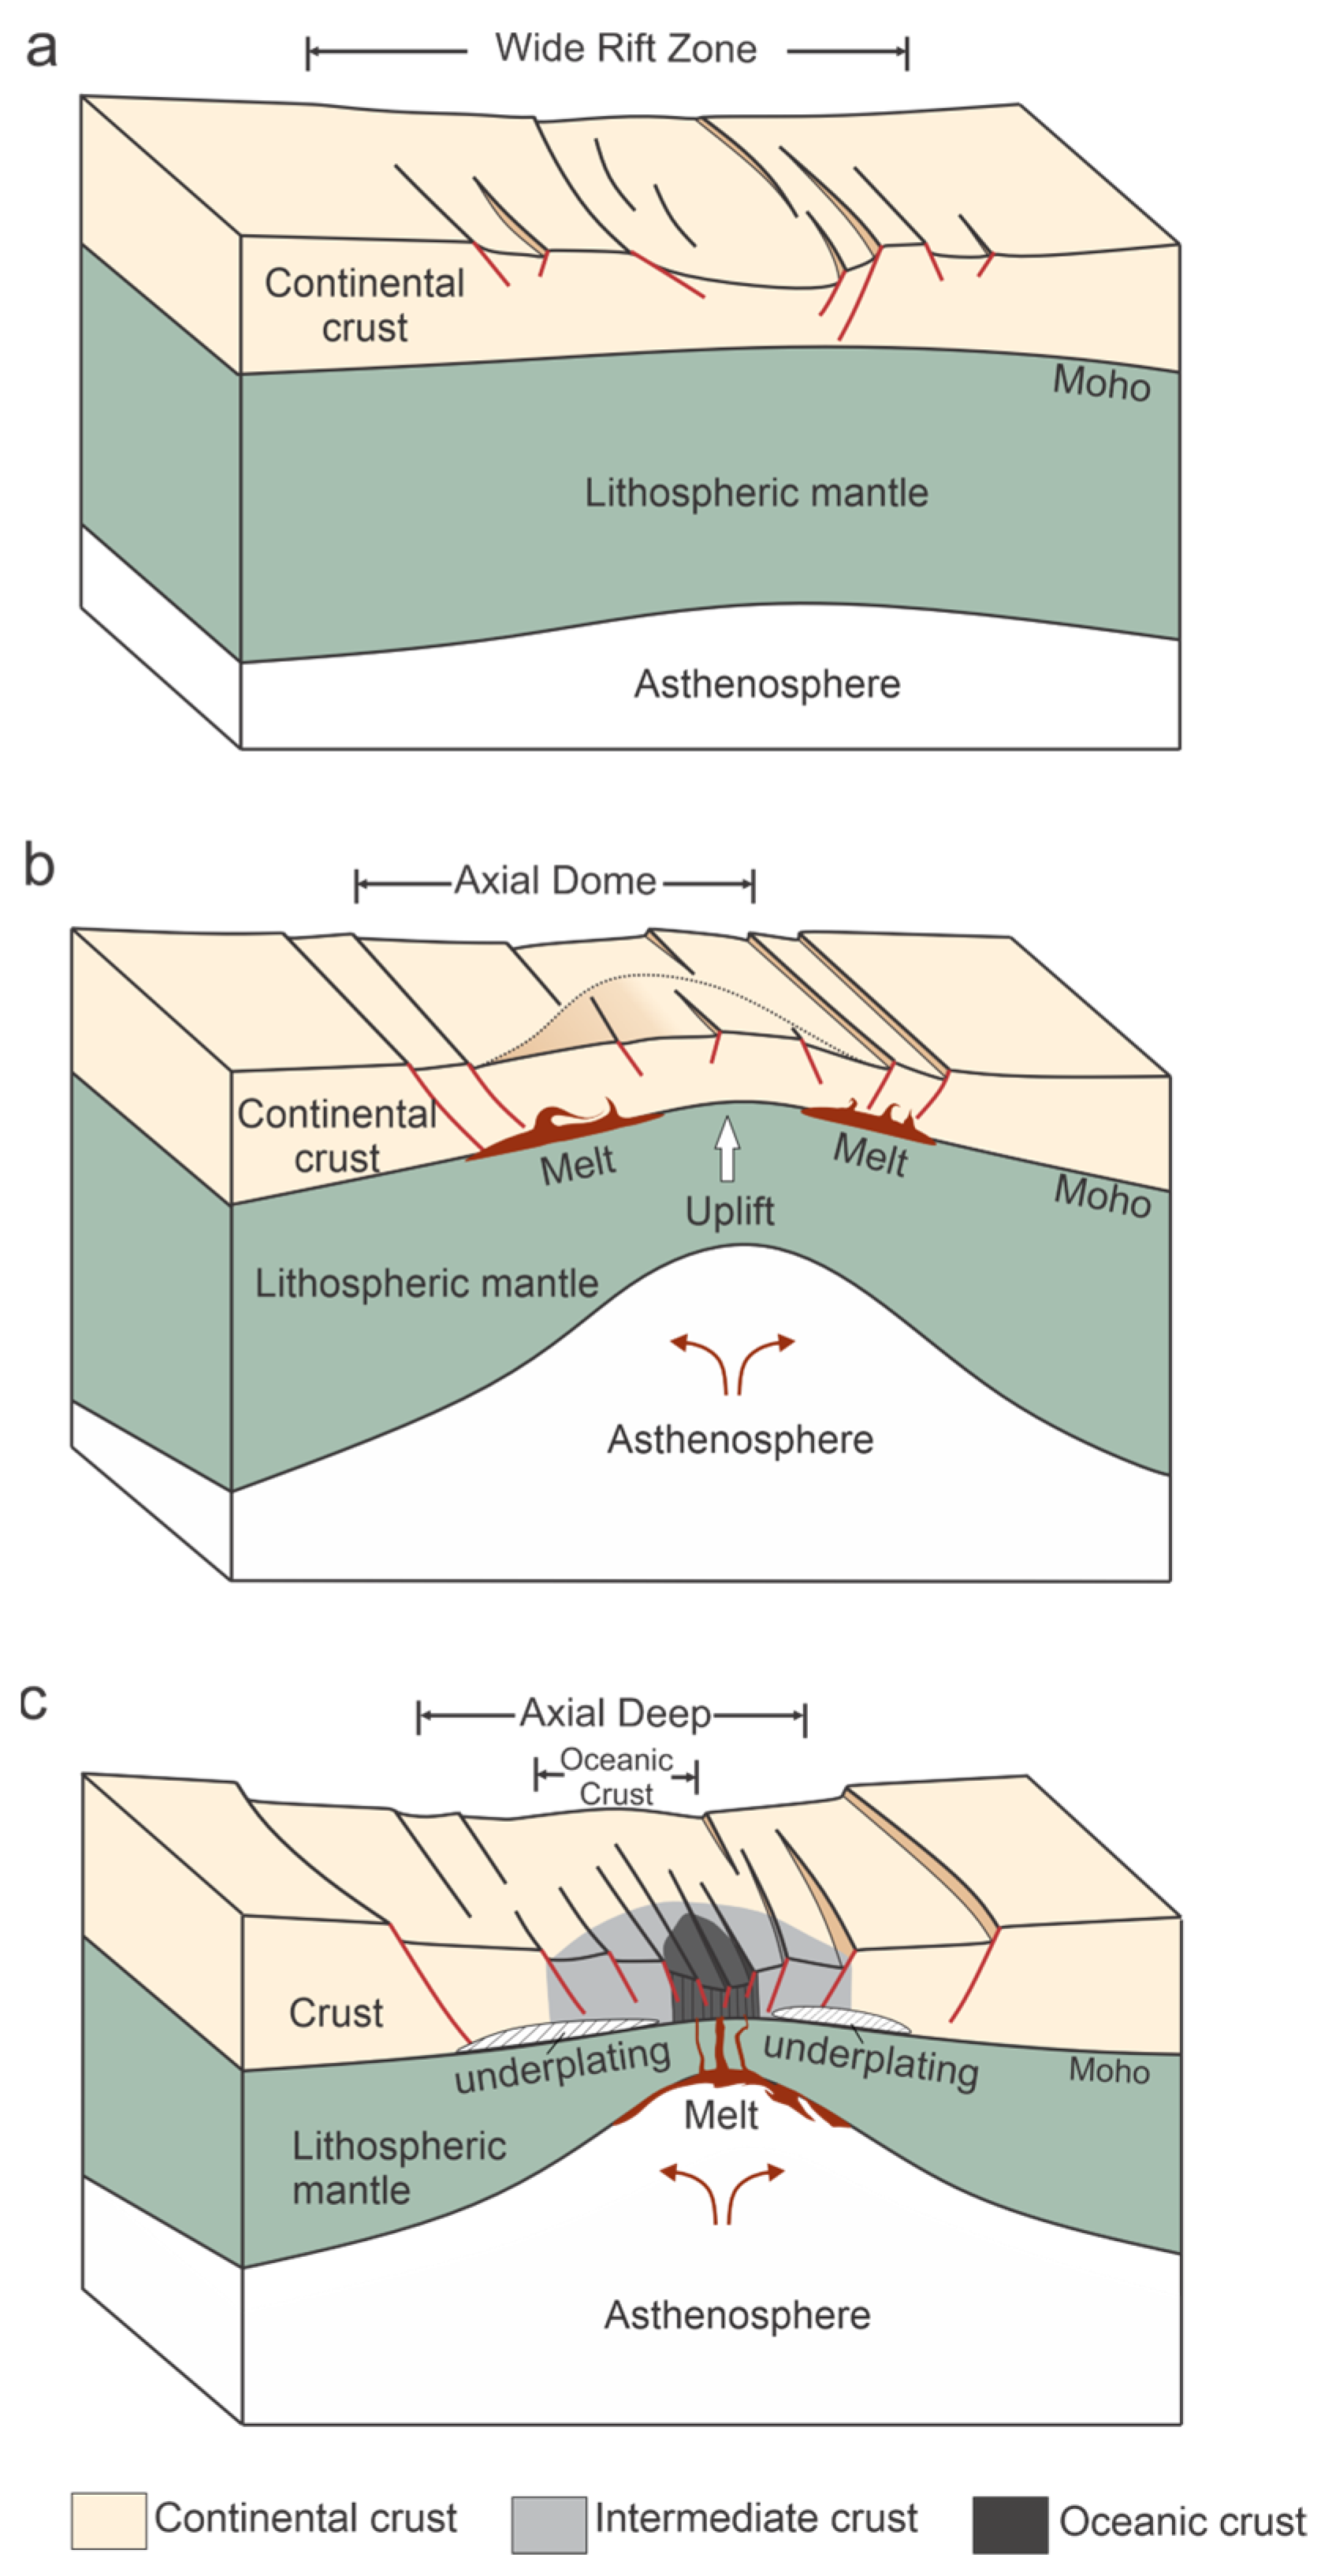
Here we propose an initial oceanization model of the Central Red Sea Rift (Figure 11). Before 5 Ma, the Central Red Sea Rift already experienced two rifting phases, forming horst-graben systems in a wide zone and the main depression in the rift axis (Figure 4, Figure 5, Figure 6 and Figure 11a). Along with the constant continental thinning and rifting under far-field stress, pre-existing weak zones developed during the early Arabian–Nubian shield evolution could reactivate and influence the upper mantle evolution. The inherited basement structure has an impact on the localization and orientation of rifting [89,90,91] and reactivates rheological heterogeneity [92]. The lithosphere mantle in pre-existing weak zones is less viscous and easier to trigger small-scale mantle upwelling and be eroded by convective asthenosphere [92,93]. The passive mantle upwelling can cause topographic uplift and thinning and weakening of the lithosphere [38,93]. In the Central Red Sea Rift, mantle upwelling did not induce massive volcanism and the direct breakup of the continental lithosphere. The rising mantle can weaken the overlying thin lithosphere due to a higher geothermal gradient, and translithospheric faults developed around the boundaries of the rift axis under the long-term extension may induce partial melting of the lithospheric mantle (Figure 11b) [11,94,95]. The underplating of high-density materials derived from melts occurred in the lower continental crust (Figure 11c). After the mantle upwelling, the centers of uplift were prone to concentrating extensional stress in the next stage. The onset of fault nucleation in the third rifting phase was limited in isolated deeps (Figure 11c). The well-developed normal-fault systems at the boundaries of the deeps controlled the extreme tectonic subsidence there (Figure 4), and the continental lithosphere finally broke up and seafloor spreading started (Figure 9a).
5. Future Evolution to a Continuous Spreading Center
Axial deeps first achieved the initial oceanization, and constituted the second-order segments of the Central Red Sea Rift with the axial discontinuities (Figure 10). Once the oceanic crust was generated sparsely along the rift axis, the instability of the lithosphere between the deeps and discontinuities could trigger small-scale mantle convection at the discontinuities. The discontinuities are at present axial domes or highs (Figure 10), with high free-air gravity anomalies (Figure 12a). Geochemistry also suggests relatively hot materials underlying the discontinuities [96,97]. These discontinuities are probably in the earlier stage of the continental breakup experiencing mantle upwelling and consequent topographic uplift (Figure 11b), and will evolve into new deeps after the stress concentration and fault nucleation (Figure 11c). Inside the relatively continuous central trough in the southern part of the Central Red Sea Rift, the free-air anomalies still show alternating highs and lows along the axial trough (Figure 12a), implying that the deeps and discontinuities subsided successively before forming troughs.
The growth of the normal-fault systems, from the nucleation to the growth and linkage, will also play an important role in future evolution. North of 21.5° N, where the deeps are more isolated (Figure 12b), the normal faults are spatially confined around the axial deep and did not propagate to the inter-trough zone (Figure 4, Figure 5 and Figure 6), and the normal-fault systems are in the stage of initial nucleation. The most active and latest tectonism localizes in the propagation tips of isolated fault systems, giving extremely high heat flow in the Atlantis Ⅱ Deep and the northmost deep in the Central Red Sea Rift (Figure 12b). With the continued growth of the normal fault systems, early formed depocenters will enlarge by interacting and linking with adjacent faults segments [102]. South of 20.5° N, the more mature and relatively continuous central trough has been bounded by mature and active normal fault systems according to earthquake focal mechanisms (Figure 12b). The normal fault system will propagate northwards under the developing far-field stress of divergence between the African and the Arabian Plates (Figure 12b).
The propagation mechanism of the Central Red Sea Rift can be applied to other propagation tips of spreading centers that form isolated axial deeps [37,38,39]. When the newly formed segments propagate in their preferred orientation controlled by the pre-existing basement structures, the rheological heterogeneity of the lithosphere will trigger mantle upwelling and activation of the inherited basement structure under far-field stress [38,39,89,90,91,92,93,94]. Isolated deeps form after the fault rupture and bounding fault systems gradually grow and line up [37]. The interaction and linkage between major fault segments may induce the offset between two adjacent major segments and the initiation of the transform faults [31].
6. Conclusions
The ongoing breakup of the continental lithosphere in the Central Red Sea Rift is discontinuous in time and space. At present, the punctiform breakup of the lithosphere and newborn oceanic crust are limited in the center of the axial deeps.
Two factors played important roles in the formation of the axial deeps, that is, mantle upwelling and normal-fault nucleation. Mantle upwelling in the Central Red Sea Rift was punctiform, triggered by rheological heterogeneity of lithosphere caused by pre-existing basement structure and newly formed weak zones. Mantle upwelling caused topographic uplift, high-density material underplating, and stress concentration, rather than direct continental breakup. It was the normal-fault system nucleated in the third rifting stage that shaped the deeps in the rift axis and controlled the final breakup.
Driven by the instability of the lithosphere after the discontinuous breakup, the discontinuities between the deeps are experiencing mantle upwelling and uplift now, and are destined to evolve into the future deeps by fault nucleation. The originally isolated normal-fault systems will gradually grow and interact and link with each other. Finally, the Central Red Sea Rift will evolve into a continuous newborn spreading center.
Author Contributions
Conceptualization, Y.-D.S. and C.-F.L.; methodology, Y.-L.W. and J.-L.Z.; software, L.H.; data curation, B.M.T.A.; writing—original draft preparation, Y.-D.S.; supervision, C.-F.L.; visualization, Y.-T.L. All authors have read and agreed to the published version of the manuscript.
Funding
This research was funded by National Natural Science Foundation of China, grant number 41776057 and 42176055.
Institutional Review Board Statement
Not applicable.
Informed Consent Statement
Not applicable.
Data Availability Statement
The bathymetry data used in this study are available at the GEBCO Compilation Group (2021) GEBCO 2021 Grid (https://www.gebco.net/data_and_products/gridded_bathymetry_data/, accessed on 3 September 2021). The magnetic anomaly data are available at the EMAG2 (https://geomag.colorado.edu/emag2-earth-magnetic-anomaly-grid-2-arc-minute-resolution.html, accessed on 2 March 2020). The earthquake events from 1976 to present used in this study are available in the CMT catalog (https://www.globalcmt.org/CMTfiles.html, accessed on 9 January 2022). The Model MORVEL (http://www.geology.wisc.edu/~chuck/MORVEL/motionframe_mrvl.html, accessed on 6 January 2022) was used for calculating relative motion angular velocities between the Nubia and Arabia. Sandwell et al. (2014) for the free-air gravity anomaly data (https://doi.org/10.1126/science.1258213, accessed on 13 April 2020), Bonvalot et al. (2012) for the WGM2012 global Bouguer gravity model (https://ccgm.org/en/catalogue, accessed on 4 May 2020), Augustin et al. (2016) for the high-resolution bathymetry data (https://doi.org/10.1016/j.geomorph.2016.08.028, accessed on 9 March 2022), and Pollack et al. (1993) for the heat flow data (https://doi.org/10.1029/93RG01249, accessed on 18 December 2020).
Acknowledgments
The authors thank the Sudan Ministry of Energy for providing the reflection seismic data used in this study available for the academic research purpose. The authors thank editors and reviewers for their comments and constructive suggestions.
Conflicts of Interest
The authors declare no conflict of interest.
References
- Guennoc, P.; Pautot, G.; Coutelle, A. Surficial structures of the northern Red Sea axial valley from 23° N to 28°N: Time and space evolution of neo-oceanic structures. Tectonophysics 1988, 153, 1–23. [Google Scholar] [CrossRef]
- Merle, O. A simple continental rift classification. Tectonophysics 2011, 513, 88–95. [Google Scholar] [CrossRef]
- Keir, D.; Bastow, I.D.; Pagli, C.; Chambers, E.L. The development of extension and magmatism in the Red Sea rift of Afar. Tectonophysics 2013, 607, 98–114. [Google Scholar] [CrossRef] [Green Version]
- Buck, W. The Dynamics of Continental Breakup and Extension. In Treatise on Geophysics, 2nd ed.; Elsevier: Amsterdam, The Netherlands, 2015; Volume 6, pp. 325–379. [Google Scholar] [CrossRef]
- Augustin, N.; Devey, C.W.; van der Zwan, F.M.; Feldens, P.; Tominaga, M.; Bantan, R.A.; Kwasnitschka, T. The rifting to spreading transition in the Red Sea. Earth Planet. Sci. Lett. 2014, 395, 217–230. [Google Scholar] [CrossRef]
- Gillard, M.; Autin, J.; Manatschal, G.; Sauter, D.; Munschy, M.; Schaming, M. Tectonomagmatic evolution of the final stages of rifting along the deep conjugate Australian-Antarctic magma-poor rifted margins: Constraints from seismic observations. Tectonics 2015, 34, 753–783. [Google Scholar] [CrossRef]
- Cochran, J.R.; Martinez, F. Evidence from the northern Red Sea on the transition from continental to oceanic rifting. Tectonophysics 1988, 153, 25–53. [Google Scholar] [CrossRef]
- Lowell, G.J.G.J.D. Sea-Floor Spreading and Structural Evolution of Southern Red Sea. AAPG Bull. 1972, 56, 247–259. [Google Scholar] [CrossRef]
- Makris, J.; Franke, M.; Grützner, J. Microearthquake activity in the Suakin Deep, Red Sea and tectonic implications. Tectonophysics 1991, 198, 411–420. [Google Scholar] [CrossRef]
- Ligi, M.; Bonatti, E.; Rasul, N.M.A. Seafloor Spreading Initiation: Geophysical and Geochemical Constraints from the Thetis and Nereus Deeps, Central Red Sea. In The Red Sea. Springer Earth System Sciences; Rasul, N., Stewart, I., Eds.; Springer: Berlin/Heidelberg, Germany, 2015; pp. 79–98. [Google Scholar] [CrossRef]
- Ligi, M.; Bonatti, E.; Bosworth, W.; Cai, Y.; Cipriani, A.; Palmiotto, C.; Ronca, S.; Seyler, M. Birth of an ocean in the Red Sea: Oceanic-type basaltic melt intrusions precede continental rupture. Gondwana Res. 2018, 54, 150–160. [Google Scholar] [CrossRef]
- Bosworth, W.; Stockli, D.F.; Helgeson, D.E. Integrated outcrop, 3D seismic, and geochronologic interpretation of Red Sea dike-related deformation in the Western Desert, Egypt—The role of the 23Ma Cairo “mini-plume”. J. Afr. Earth Sci. 2015, 109, 107–119. [Google Scholar] [CrossRef]
- Mohriak, W.U.; Leroy, S. Architecture of rifted continental margins and break-up evolution: Insights from the South Atlantic, North Atlantic and Red Sea–Gulf of Aden conjugate margins. Geol. Soc. Lond. Spéc. Publ. 2012, 369, 497–535. [Google Scholar] [CrossRef] [Green Version]
- Girdler, R.W. The relationship of the red sea to the East African rift system. Q. J. Geol. Soc. 1958, 114, 79–105. [Google Scholar] [CrossRef]
- Kusky, T.M.; Abdelsalam, M.; Tucker, R.D.; Stern, R.J. Evolution of the East African and related orogens, and the assembly of Gondwana. Precambrian Res. 2003, 123, 81–85. [Google Scholar] [CrossRef]
- Almalki, K.A.; Betts, P.G.; Ailleres, L. The Red Sea—50 years of geological and geophysical research. Earth-Sci. Rev. 2015, 147, 109–140. [Google Scholar] [CrossRef]
- Bosworth, W.; Huchon, P.; McClay, K. The Red Sea and Gulf of Aden Basins. J. Afr. Earth Sci. 2005, 43, 334–378. [Google Scholar] [CrossRef]
- Ligi, M.; Bonatti, E.; Tontini, F.C.; Cipriani, A.; Cocchi, L.; Schettino, A.; Bortoluzzi, G.; Ferrante, V.; Khalil, S.; Mitchell, N.; et al. Initial burst of oceanic crust accretion in the Red Sea due to edge-driven mantle convection. Geology 2011, 39, 1019–1022. [Google Scholar] [CrossRef] [Green Version]
- Girdler, R.W.; Styles, P. Two Stage Red Sea Floor Spreading. Nature 1974, 247, 7–11. [Google Scholar] [CrossRef]
- Ghebreab, W. Tectonics of the Red Sea region reassessed. Earth-Sci. Rev. 1998, 45, 1–44. [Google Scholar] [CrossRef]
- Mohr, P. Structure of Yemeni Miocene dike swarms and emplacement of coeval granite plutons. Tectonophysics 1991, 198, 203–221. [Google Scholar] [CrossRef]
- Tramontini, C.; Davies, D. A Seismic Refraction Survey in The Red Sea. Geophys. J. Int. 1969, 17, 225–241. [Google Scholar] [CrossRef] [Green Version]
- Drake, C.L.; Girdler, R.W. A Geophysical Study of the Red Sea. Geophys. J. Int. 1964, 8, 473–495. [Google Scholar] [CrossRef] [Green Version]
- Whitmarsh, R.B.; Ross, D.A.; Ali, S.; Boudreaux, J.E.; Coleman, R.; Fleisher, R.L.; Girdler, R.W.; Manheim, F.T.; Matter, A.; Nigrini, C.; et al. 16. SITE 226. Deep Sea Drill. Proj. Initial Rep. 1974, 23, 595–600. [Google Scholar]
- Girdle, R.R.W. 28. miocene evaporites in red sea cores, their relevance to the problem of the width and age of oceanic crust beneath the red sea. Deep Sea Drill. Proj. Initial Rep. 1974, 23, 913–921. [Google Scholar]
- le Quentrec, M.; Sichler, B. 3-D inversion of deep tow magnetic data on the Atlantis II Deep (Red Sea): Hydrothermal and geodynamic interpretation. Tectonophysics 1991, 198, 421–439. [Google Scholar] [CrossRef]
- Bonatti, E. Punctiform initiation of seafloor spreading in the Red Sea during transition from a continental to an oceanic rift. Nature 1985, 316, 33–37. [Google Scholar] [CrossRef]
- Ehrhardt, A.; Hübscher, C.; Gajewski, D. Conrad Deep, Northern Red Sea: Development of an early stage ocean deep within the axial depression. Tectonophysics 2005, 411, 19–40. [Google Scholar] [CrossRef]
- El Khrepy, S.; Koulakov, I.; Al-Arifi, N. Crustal and uppermost mantle structure beneath the continental rifting area of the Gulf of Suez from earthquake tomography. Tectonophysics 2016, 668-669, 92–104. [Google Scholar] [CrossRef]
- Searle, R.C.; Ross, D.A. A Geophysical Study of the Red Sea Axial Trough between 20*5 and 22 N. Geophys. J. Int. 1975, 43, 555–572. [Google Scholar] [CrossRef] [Green Version]
- Izzeldin, A.Y. Transverse structures in the central part of the Red Sea and implications on early stages of oceanic accretion. Geophys. J. Int. 1989, 96, 117–129. [Google Scholar] [CrossRef] [Green Version]
- Mitchell, N.C.; Ligi, M.; Ferrante, V.; Bonatti, E.; Rutter, E. Submarine salt flows in the central Red Sea. GSA Bull. 2009, 122, 701–713. [Google Scholar] [CrossRef] [Green Version]
- Mitchell, N.C.; Park, Y. Nature of crust in the central Red Sea. Tectonophysics 2014, 628, 123–139. [Google Scholar] [CrossRef]
- Augustin, N.; van der Zwan, F.M.; Devey, C.W.; Ligi, M.; Kwasnitschka, T.; Feldens, P.; Bantan, R.A.; Basaham, A.S. Geomorphology of the central Red Sea Rift: Determining spreading processes. Geomorphology 2016, 274, 162–179. [Google Scholar] [CrossRef]
- Makris, J.; Henke, C.; Egloff, F.; Akamaluk, T. The gravity field of the Red Sea and East Africa. Tectonophysics 1991, 198, 369–381. [Google Scholar] [CrossRef]
- Shi, W.; Mitchell, N.C.; Kalnins, L.M.; Izzeldin, A. Oceanic-like axial crustal high in the central Red Sea. Tectonophysics 2018, 747-748, 327–342. [Google Scholar] [CrossRef] [Green Version]
- Davis, K.; Burbank, D.W.; Fisher, D.; Wallace, S.; Nobes, D. Thrust-fault growth and segment linkage in the active Ostler fault zone, New Zealand. J. Struct. Geol. 2005, 27, 1528–1546. [Google Scholar] [CrossRef]
- Smith, D.K.; Schouten, H.; Parnell-Turner, R.; Klein, E.M.; Cann, J.; Dunham, C.; Alodia, G.; Blasco, I.; Wernette, B.; Zawadzki, D.; et al. The Evolution of Seafloor Spreading Behind the Tip of the Westward Propagating Cocos-Nazca Spreading Center. Geochem. Geophys. Geosyst. 2020, 21. [Google Scholar] [CrossRef]
- Little, T.A.; Baldwin, S.L.; Fitzgerald, P.G.; Monteleone, B. Continental rifting and metamorphic core complex formation ahead of the Woodlark spreading ridge, D'Entrecasteaux Islands, Papua New Guinea. Tectonics 2007, 26. [Google Scholar] [CrossRef]
- DeMets, C.; Gordon, R.G.; Argus, D.F. Geologically current plate motions. Geophys. J. Int. 2010, 181, 1–80. [Google Scholar] [CrossRef] [Green Version]
- Whitmarsh, R.B.; Ross, D.A.; Ali, S.; Boudreaux, J.E.; Coleman, R.; Fleisher, R.L.; Girdler, R.W.; Manheim, F.T.; Matter, A.; Nigrini, C.; et al. 15. SITE 225. Deep Sea Drill. Proj. Initial Rep. 1974, 23, 539–594. [Google Scholar]
- Whitmarsh, R.B.; Ross, D.A.; Ali, S.; Boudreaux, J.E.; Coleman, R.; Fleisher, R.L.; Girdler, R.W.; Manheim, F.T.; Matter, A.; Nigrini, C.; et al. 17. SITE 227. Deep Sea Drill. Proj. Initial Rep. 1974, 23, 601–676. [Google Scholar]
- Whitmarsh, R.B.; Ross, D.A.; Ali, S.; Boudreaux, J.E.; Coleman, R.; Fleisher, R.L.; Girdler, R.W.; Manheim, F.T.; Matter, A.; Nigrini, C.; et al. 18. SITE 228. Deep Sea Drill. Proj. Initial Rep. 1974, 23, 677–751. [Google Scholar]
- Bonatti, E.; Simmons, E.C.; Breger, D.; Hamlyn, P.; Lawrence, J. Ultramafic rock/seawater interaction in the oceanic crust: Mg-silicate (sepiolite) deposit from the Indian Ocean floor. Earth Planet. Sci. Lett. 1983, 62, 229–238. [Google Scholar] [CrossRef]
- Bonatti, E.; Clocchiatti, R.; Colantoni, P.; Gelmini, R.; Marinelli, G.; Ottonello, G.; Santacroce, R.; Taviani, M.; Abdel-Meguid, A.A.; Assaf, H.S.; et al. Zabargad (St. John’s) Island: An uplifted fragment of sub-Red Sea lithosphere. J. Geol. Soc. 1983, 140, 677–690. [Google Scholar] [CrossRef]
- Bonatti, E.; Ottonello, G.; Hamlyn, P.R. Peridotites from the Island of Zabargad (St. John), Red Sea: Petrology and geochemistry. J. Geophys. Res. Atmos. 1986, 91, 599–631. [Google Scholar] [CrossRef] [Green Version]
- Makris, J.; Rihm, R. Shear-controlled evolution of the Red Sea: Pull apart model. Tectonophysics 1991, 198, 441–466. [Google Scholar] [CrossRef]
- Voggenreiter, W.; Hötzl, H.; Mechie, J. Low-angle detachment origin for the Red Sea Rift System? Tectonophysics 1988, 150, 51–75. [Google Scholar] [CrossRef]
- Coleman, A.J.; Jackson, C.A.-L.; Duffy, O.B. Balancing sub- and supra-salt strain in salt-influenced rifts: Implications for extension estimates. J. Struct. Geol. 2017, 102, 208–225. [Google Scholar] [CrossRef] [Green Version]
- Pilcher, R.S.; Blumstein, R.D. Brine volume and salt dissolution rates in Orca Basin, northeast Gulf of Mexico. AAPG Bull. 2007, 91, 823–833. [Google Scholar] [CrossRef]
- Augustin, N.; van der Zwan, F.M.; Devey, C.W.; Brandsdóttir, B. 13 million years of seafloor spreading throughout the Red Sea Basin. Nat. Commun. 2021, 12, 1–10. [Google Scholar] [CrossRef] [PubMed]
- Levi, S. and Riddihough, R. Why are marine magnetic anomalies suppressed over sedimented spreading centres? Geology 1986, 14, 651–654. [Google Scholar] [CrossRef]
- Bonatti, E.; Hamlyn, P.; Ottonello, G. Upper mantle beneath a young oceanic rift: Peridotites from the island of Zabargad (Red Sea). Geology 1981, 9, 474–479. [Google Scholar] [CrossRef]
- Coleman, R. Geologic Background of the Red Sea; U.S. Geological Survey: Asheville, NC, USA, 1974; Volume 23. [CrossRef]
- Supko, P.; Stoffers, P.; Coplen, T.; Whitmarsh, R.; Weser, O.; Ross, D. Petrography and Geochemistry of Red Sea Dolomite. Deep Sea Drill. Proj. Initial Rep. 1974, 23. [Google Scholar] [CrossRef]
- Stoffers, P.; Kuhn, R.; Whitmarsh, R.; Weser, O.; Ross, D. Red Sea Evaporites: A Petrographic and Geochemical Study. Deep Sea Drill. Proj. Initial Rep. 1974, 23. [Google Scholar] [CrossRef]
- Stoffers, P.; Ross, D.; Whitmarsh, R.; Weser, O. Sedimentary History of the Red Sea. Deep Sea Drill. Proj. Initial Rep. 1974, 23. [Google Scholar] [CrossRef]
- Bunter, M.A.G.; Magid, A.E.M.A. The sudanese red sea: 1. new developments in stratigraphy and petroleum-geological evolution. J. Pet. Geol. 1989, 12, 145–166. [Google Scholar] [CrossRef]
- Segev, A.; Avni, Y.; Shahar, J.; Wald, R. Late Oligocene and Miocene different seaways to the Red Sea–Gulf of Suez rift and the Gulf of Aqaba–Dead Sea basins. Earth-Sci. Rev. 2017, 171, 196–219. [Google Scholar] [CrossRef]
- Almalki, K.A.; Betts, P.G.; Ailleres, L. Episodic sea-floor spreading in the Southern Red Sea. Tectonophysics 2014, 617, 140–149. [Google Scholar] [CrossRef]
- Hughes, G.W.A.G.; Johnson, R.S. Lithostratigraphy of the Red Sea Region. Geoarabia 2005, 10, 49–126. [Google Scholar] [CrossRef]
- Hughes, G.W.; Beydoun, Z.R. The red sea—Gulf of aden: Biostratigraphy, lithostratigraphy and palaeoenvironments. J. Pet. Geol. 1992, 15, 135–156. [Google Scholar] [CrossRef]
- Goldberg, M.; Beyth, M. Tiran island: An internal block at the junction of the Red Sea rift and Dead Sea transform. Tectonophysics 1991, 198, 261–273. [Google Scholar] [CrossRef]
- Amer, R.; Sultan, M.; Ripperdan, R.; Encarnación, J. Structural Architecture for Development of Marginal Extensional Sub-Basins in the Red Sea Active Rift Zone. Int. J. Geosci. 2012, 3, 133–152. [Google Scholar] [CrossRef] [Green Version]
- Beydoun, Z.R. Evolution and development of the Levant (Dead Sea Rift) Transform System: A historical-chronological review of a structural controversy. Geol. Soc. Lond. Spéc. Publ. 1999, 164, 239–255. [Google Scholar] [CrossRef]
- Adam, B.M.T.; Chun-Feng, L.; Wadi, D. Recognition of geological structures in the Red Sea Basin based on potential field data and 2D seismic profiles: Insights from Block 13, Sudan. Arab. J. Geosci. 2022, 15, 1–21. [Google Scholar] [CrossRef]
- Lazar, M.; Ben-Avraham, Z.; Garfunkel, Z. The Red Sea—New insights from recent geophysical studies and the connection to the Dead Sea fault. J. Afr. Earth Sci. 2012, 68, 96–110. [Google Scholar] [CrossRef]
- Blanchette, A.R.; Klemperer, S.L.; Mooney, W.D.; Zahran, H.M. Two-stage Red Sea rifting inferred from mantle earthquakes in Neoproterozoic lithosphere. Earth Planet. Sci. Lett. 2018, 497, 92–101. [Google Scholar] [CrossRef]
- Hutchinson, R.W.; Engels, G.G. Tectonic Evolution in the Southern Red Sea and Its Possible Significance to Older Rifted Continental Margins. GSA Bull. 1972, 83, 2989–3002. [Google Scholar] [CrossRef]
- Parker, R.L. The Rapid Calculation of Potential Anomalies. Geophys. J. Int. 1973, 31, 447–455. [Google Scholar] [CrossRef] [Green Version]
- Oldenburg, D.W. The inversion and interpretation of gravity anomalies. Geophysics 1974, 39, 526–536. [Google Scholar] [CrossRef]
- Bai, Y.; Williams, S.; Müller, D.; Liu, Z.; Hosseinpour, M. Mapping crustal thickness using marine gravity data: Methods and uncertainties. Geophysics 2014, 79, G27–G36. [Google Scholar] [CrossRef] [Green Version]
- Bonvalot, S.; Balmino, G.; Briais, A.; Kuhn, M.; Peyrefitte, A.; Vales, N.; Biancale, R.; Gabalda, G.; Moreaux, G.; Reinquin, F.; et al. World Gravity Map. Commission for the Geological Map of the World; BGI-CGMW-CNES-IRD: Paris, France, 2012; Available online: https://ccgm.org/en/catalogue (accessed on 4 May 2020).
- Laske, G.; Masters, G.; Ma, Z.; Pasyanos, M. Update on CRUST1.0—A 1-degree Global Model of Earth’s Crust. In Proceedings of the EGU General Assembly 2013, Vienna, Austria, 7–12 April 2013. Abstracts, 15, Abstract EGU2013–2658.. [Google Scholar]
- Straume, E.O.; Gaina, C.; Medvedev, S.; Hochmuth, K.; Gohl, K.; Whittaker, J.M.; Fattah, R.A.; Doornenbal, J.C.; Hopper, J.R. GlobSed: Updated Total Sediment Thickness in the World’s Oceans. Geochem. Geophys. Geosyst. 2019, 20, 1756–1772. [Google Scholar] [CrossRef]
- Seton, M.; Müller, R.D.; Zahirovic, S.; Williams, S.; Wright, N.M.; Cannon, J.; Whittaker, J.M.; Matthews, K.J.; McGirr, R. A Global Data Set of Present-Day Oceanic Crustal Age and Seafloor Spreading Parameters. Geochem. Geophys. Geosyst. 2020, 21. [Google Scholar] [CrossRef]
- Müller, R.D.; Zahirovic, S.; Williams, S.E.; Cannon, J.; Seton, M.; Bower, D.J.; Tetley, M.G.; Heine, C.; Le Breton, E.; Liu, S.; et al. A Global Plate Model Including Lithospheric Deformation Along Major Rifts and Orogens Since the Triassic. Tectonics 2019, 38, 1884–1907. [Google Scholar] [CrossRef] [Green Version]
- Izzeldin, A. Seismic, gravity and magnetic surveys in the central part of the Red Sea: Their interpretation and implications for the structure and evolution of the Red Sea. Tectonophysics 1987, 143, 269–306. [Google Scholar] [CrossRef]
- Makris, J.; Tsironidis, J.; Richter, H. Heatflow density distribution in the Red Sea. Tectonophysics 1991, 198, 383–393. [Google Scholar] [CrossRef]
- Press, F. Section 9: Seismic Velocities. In Handbook of Physical Constants; Geological Society of America: Boulder, CO, USA, 1966; Volume 97, pp. 195–218. [Google Scholar] [CrossRef]
- Cochran, J.R. Effects of finite rifting times on the development of sedimentary basins. Earth Planet. Sci. Lett. 1983, 66, 289–302. [Google Scholar] [CrossRef]
- Coutelle, A.; Pautot, G.; Guennoc, P. The structural setting of the Red Sea axial valley and deeps: Implications for crustal thinning processes. Tectonophysics 1991, 198, 395–409. [Google Scholar] [CrossRef]
- Nicolas, A.; Violette, J. Mantle flow at oceanic spreading centers: Models derived from ophiolites. Tectonophysics 1982, 81, 319–339. [Google Scholar] [CrossRef]
- Lizarralde, D.; Axen, G.J.; Brown, H.E.; Fletcher, J.M.; González-Fernández, A.; Harding, A.J.; Holbrook, W.S.; Kent, G.M.; Paramo, P.; Sutherland, F.; et al. Variation in styles of rifting in the Gulf of California. Nature 2007, 448, 466–469. [Google Scholar] [CrossRef] [PubMed] [Green Version]
- Langseth, M.G.; Taylor, P.T. Recent heat flow measurements in the Indian Ocean. J. Geophys. Res. Atmos. 1967, 72, 6249–6260. [Google Scholar] [CrossRef]
- Huismans, R.S.; Podladchikov, Y.; Cloetingh, S. Transition from passive to active rifting: Relative importance of asthenospheric doming and passive extension of the lithosphere. J. Geophys. Res. Solid Earth 2001, 106, 11271–11291. [Google Scholar] [CrossRef] [Green Version]
- Flament, N.; Gurnis, M.; Müller, R.D. A review of observations and models of dynamic topography. Lithosphere 2013, 5, 189–210. [Google Scholar] [CrossRef] [Green Version]
- Ziegler, P.A.; Cloetingh, S. Dynamic processes controlling evolution of rifted basins. Earth-Sci. Rev. 2004, 64, 1–50. [Google Scholar] [CrossRef]
- Phillips, T.B.; Jackson, C.A.-L.; Bell, R.E.; Duffy, O.B.; Fossen, H. Reactivation of intrabasement structures during rifting: A case study from offshore southern Norway. J. Struct. Geol. 2016, 91, 54–73. [Google Scholar] [CrossRef] [Green Version]
- Peng, X.; Li, C.-F.; Shen, C.; Liu, Y.; Shi, H. Intra-basement structures and their implications for rifting of the northeastern South China Sea margin. J. Asian Earth Sci. 2022, 225, 105073. [Google Scholar] [CrossRef]
- Salomon, E.; Koehn, D.; Passchier, C. Brittle reactivation of ductile shear zones in NW Namibia in relation to South Atlantic rifting. Tectonics 2015, 34, 70–85. [Google Scholar] [CrossRef]
- Petersen, K.D.; Schiffer, C. Wilson cycle passive margins: Control of orogenic inheritance on continental breakup. Gondwana Res. 2016, 39, 131–144. [Google Scholar] [CrossRef]
- Sacek, V. Post-rift influence of small-scale convection on the landscape evolution at divergent continental margins. Earth Planet. Sci. Lett. 2017, 459, 48–57. [Google Scholar] [CrossRef]
- Chu, G.; Chen, H.; Falloon, T.; Han, J.; Zhang, S.; Cheng, J.; Zhang, X. Early Cretaceous mantle upwelling and melting of juvenile lower crust in the Middle-Lower Yangtze River Metallogenic Belt: Example from Tongshankou Cu-(Mo W) ore deposit. Gondwana Res. 2020, 83, 183–200. [Google Scholar] [CrossRef]
- Chenin, P.; Jammes, S.; Lavier, L.L.; Manatschal, G.; Picazo, S.; Müntener, O.; Karner, G.D.; Figueredo, P.H.; Johnson, C. Impact of Mafic Underplating and Mantle Depletion on Subsequent Rifting: A Numerical Modeling Study. Tectonics 2019, 38, 2185–2207. [Google Scholar] [CrossRef]
- Vita-Finzi, C.; Spiro, B. Isotopic indicators of deformation in the Red Sea. J. Struct. Geol. 2006, 28, 1114–1122. [Google Scholar] [CrossRef]
- Haase, K.; Mühe, R.; Stoffers, P. Magmatism during extension of the lithosphere: Geochemical constraints from lavas of the Shaban Deep, northern Red Sea. Chem. Geol. 2000, 166, 225–239. [Google Scholar] [CrossRef]
- Sandwell, D.T.; Müller, R.D.; Smith, W.H.F.; Garcia, E.; Francis, R. New global marine gravity model from CryoSat-2 and Jason-1 reveals buried tectonic structure. Science 2014, 346, 65–67. [Google Scholar] [CrossRef] [PubMed]
- Dziewonski, A.M.; Chou, T.-A.; Woodhouse, J.H. Determination of earthquake source parameters from waveform data for studies of global and regional seismicity. J. Geophys. Res. Atmos. 1981, 86, 2825–2852. [Google Scholar] [CrossRef]
- Ekström, G.; Nettles, M.; Dziewoński, A. The global CMT project 2004–2010: Centroid-moment tensors for 13,017 earthquakes. Phys. Earth Planet. Inter. 2012, 200–201, 1–9. [Google Scholar] [CrossRef]
- Pollack, H.N.; Hurter, S.J.; Johnson, J.R. Heat flow from the Earth's interior: Analysis of the global data set. Rev. Geophys. 1993, 31, 267–280. [Google Scholar] [CrossRef]
- Soliva, R.; Benedicto, A. A linkage criterion for segmented normal faults. J. Struct. Geol. 2004, 26, 2251–2267. [Google Scholar] [CrossRef]
Figure 2.
Stratigraphy of the Red Sea. Basement composition and stratigraphy refer to previous geological studies and DSDP drill results [17,45,46,48,54,55,56,57,58,59].

Figure 3.
Calculated Moho depth and comparison with published data. (a) Moho depth from gravity inversion. Black lines show the isobaths of the calculated Moho depth. Grey lines along the rift axis represent the isobaths of −900 m and −1800 m bathymetries. White lines indicate reflection seismic profiles in this study. Black and white lines (AA’ [78], BB’ [47], CC’ [79]) represent locations of the published density and velocity structures. White dots on the line CC’ show the distribution of OBS stations within the Suakin Deep [9]. (b) Published density and velocity structures [47,78,79] and microearthquakes records [9]. Red dashed lines indicate calculated Moho depths along published profiles.

Figure 4.
Reflection seismic profile 060 and interpretations. Dashed box shows the area of Figure 7a.
Figure 4.
Reflection seismic profile 060 and interpretations. Dashed box shows the area of Figure 7a.

Figure 5.
Reflection seismic profile 054 and interpretations. Dashed box shows the area of Figure 7b.
Figure 5.
Reflection seismic profile 054 and interpretations. Dashed box shows the area of Figure 7b.

Figure 6.
Reflection seismic profile 050 and interpretations. Dashed box shows the area of Figure 7c.
Figure 6.
Reflection seismic profile 050 and interpretations. Dashed box shows the area of Figure 7c.

Figure 7.
Deformed zones. Indicators of regional uplift: deformed basement, interrupted Pliocene–Pleistocene sediments, and disturbances within the evaporite deposition. Differential crustal vertical movement between the axial deep and the inter-trough zone. (a) Profile 060. (b) Profile 054. (c) Profile 050.
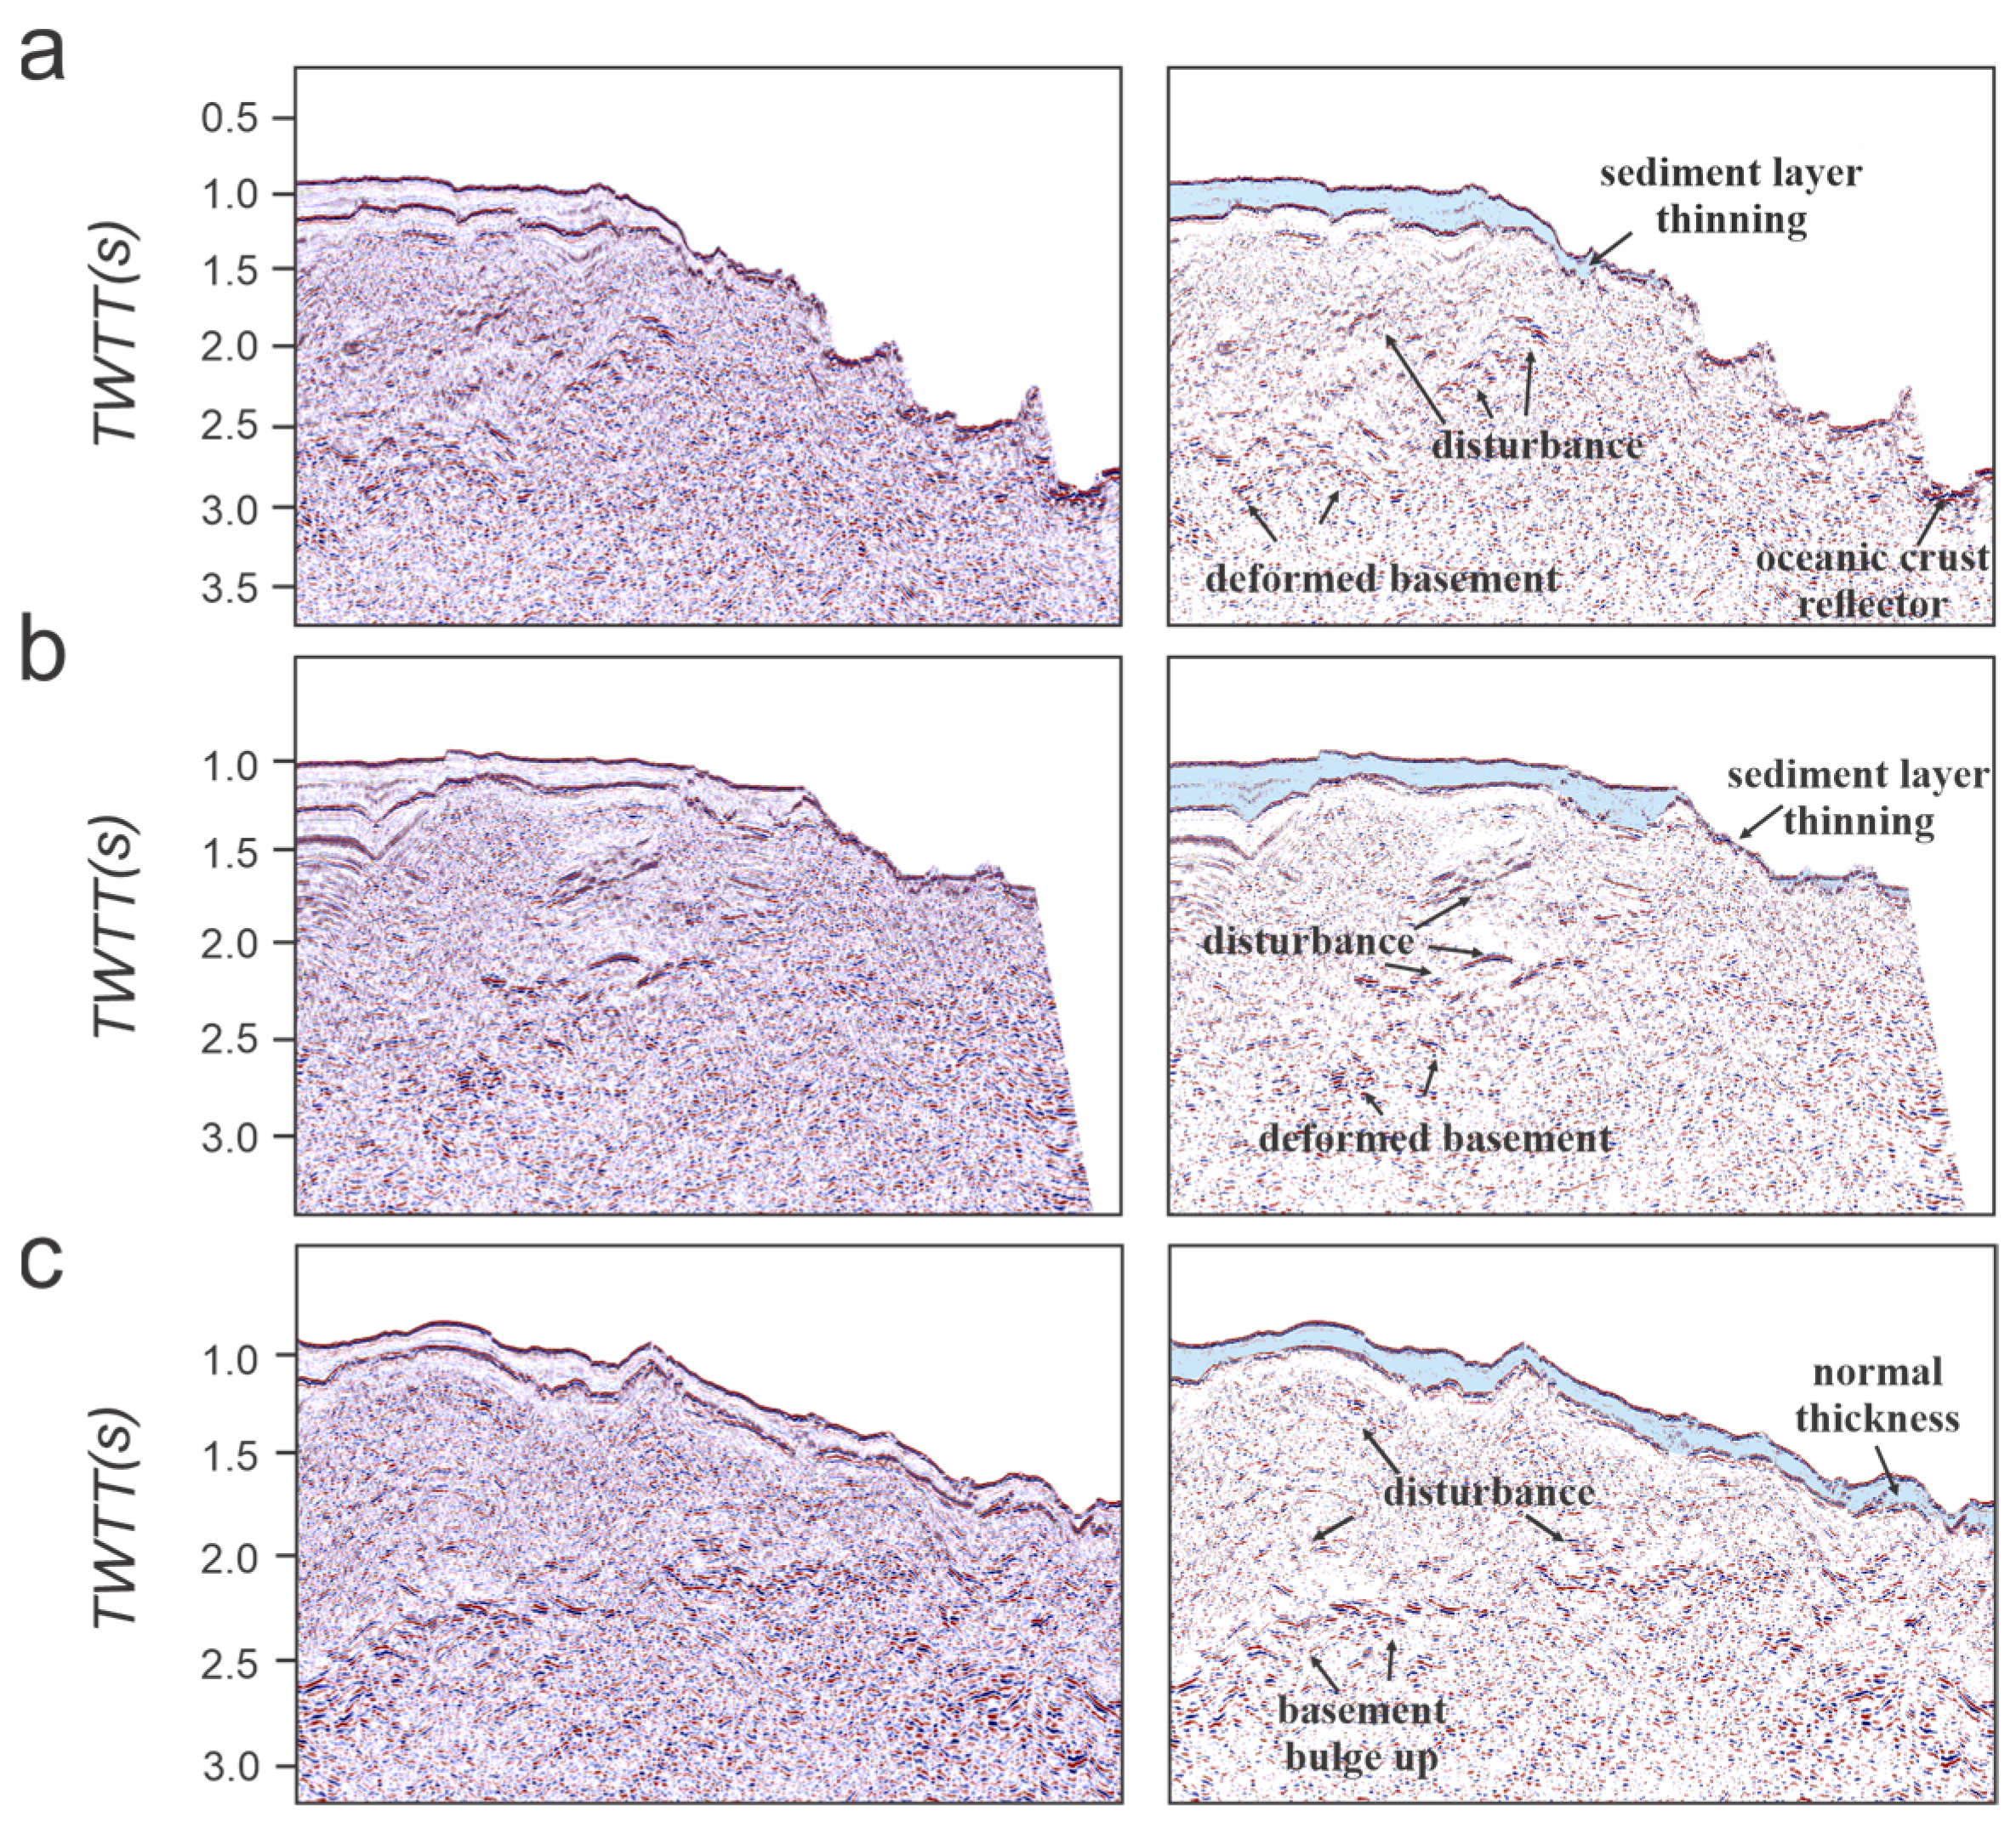
Figure 8.
Sediment and tectonic evolution of the Hatiba Deep based on profile 060. (a) As the center of the Pliocene–Pleistocene uplift. (b) Intense tectonic subsidence controlled the formation of the deep. Lithologic patterns and unconformities refer to Figure 2.
Figure 8.
Sediment and tectonic evolution of the Hatiba Deep based on profile 060. (a) As the center of the Pliocene–Pleistocene uplift. (b) Intense tectonic subsidence controlled the formation of the deep. Lithologic patterns and unconformities refer to Figure 2.

Figure 9.
Free-air gravity models of the profile 060 (a), 054 (b), and 050 (c).

Figure 10.
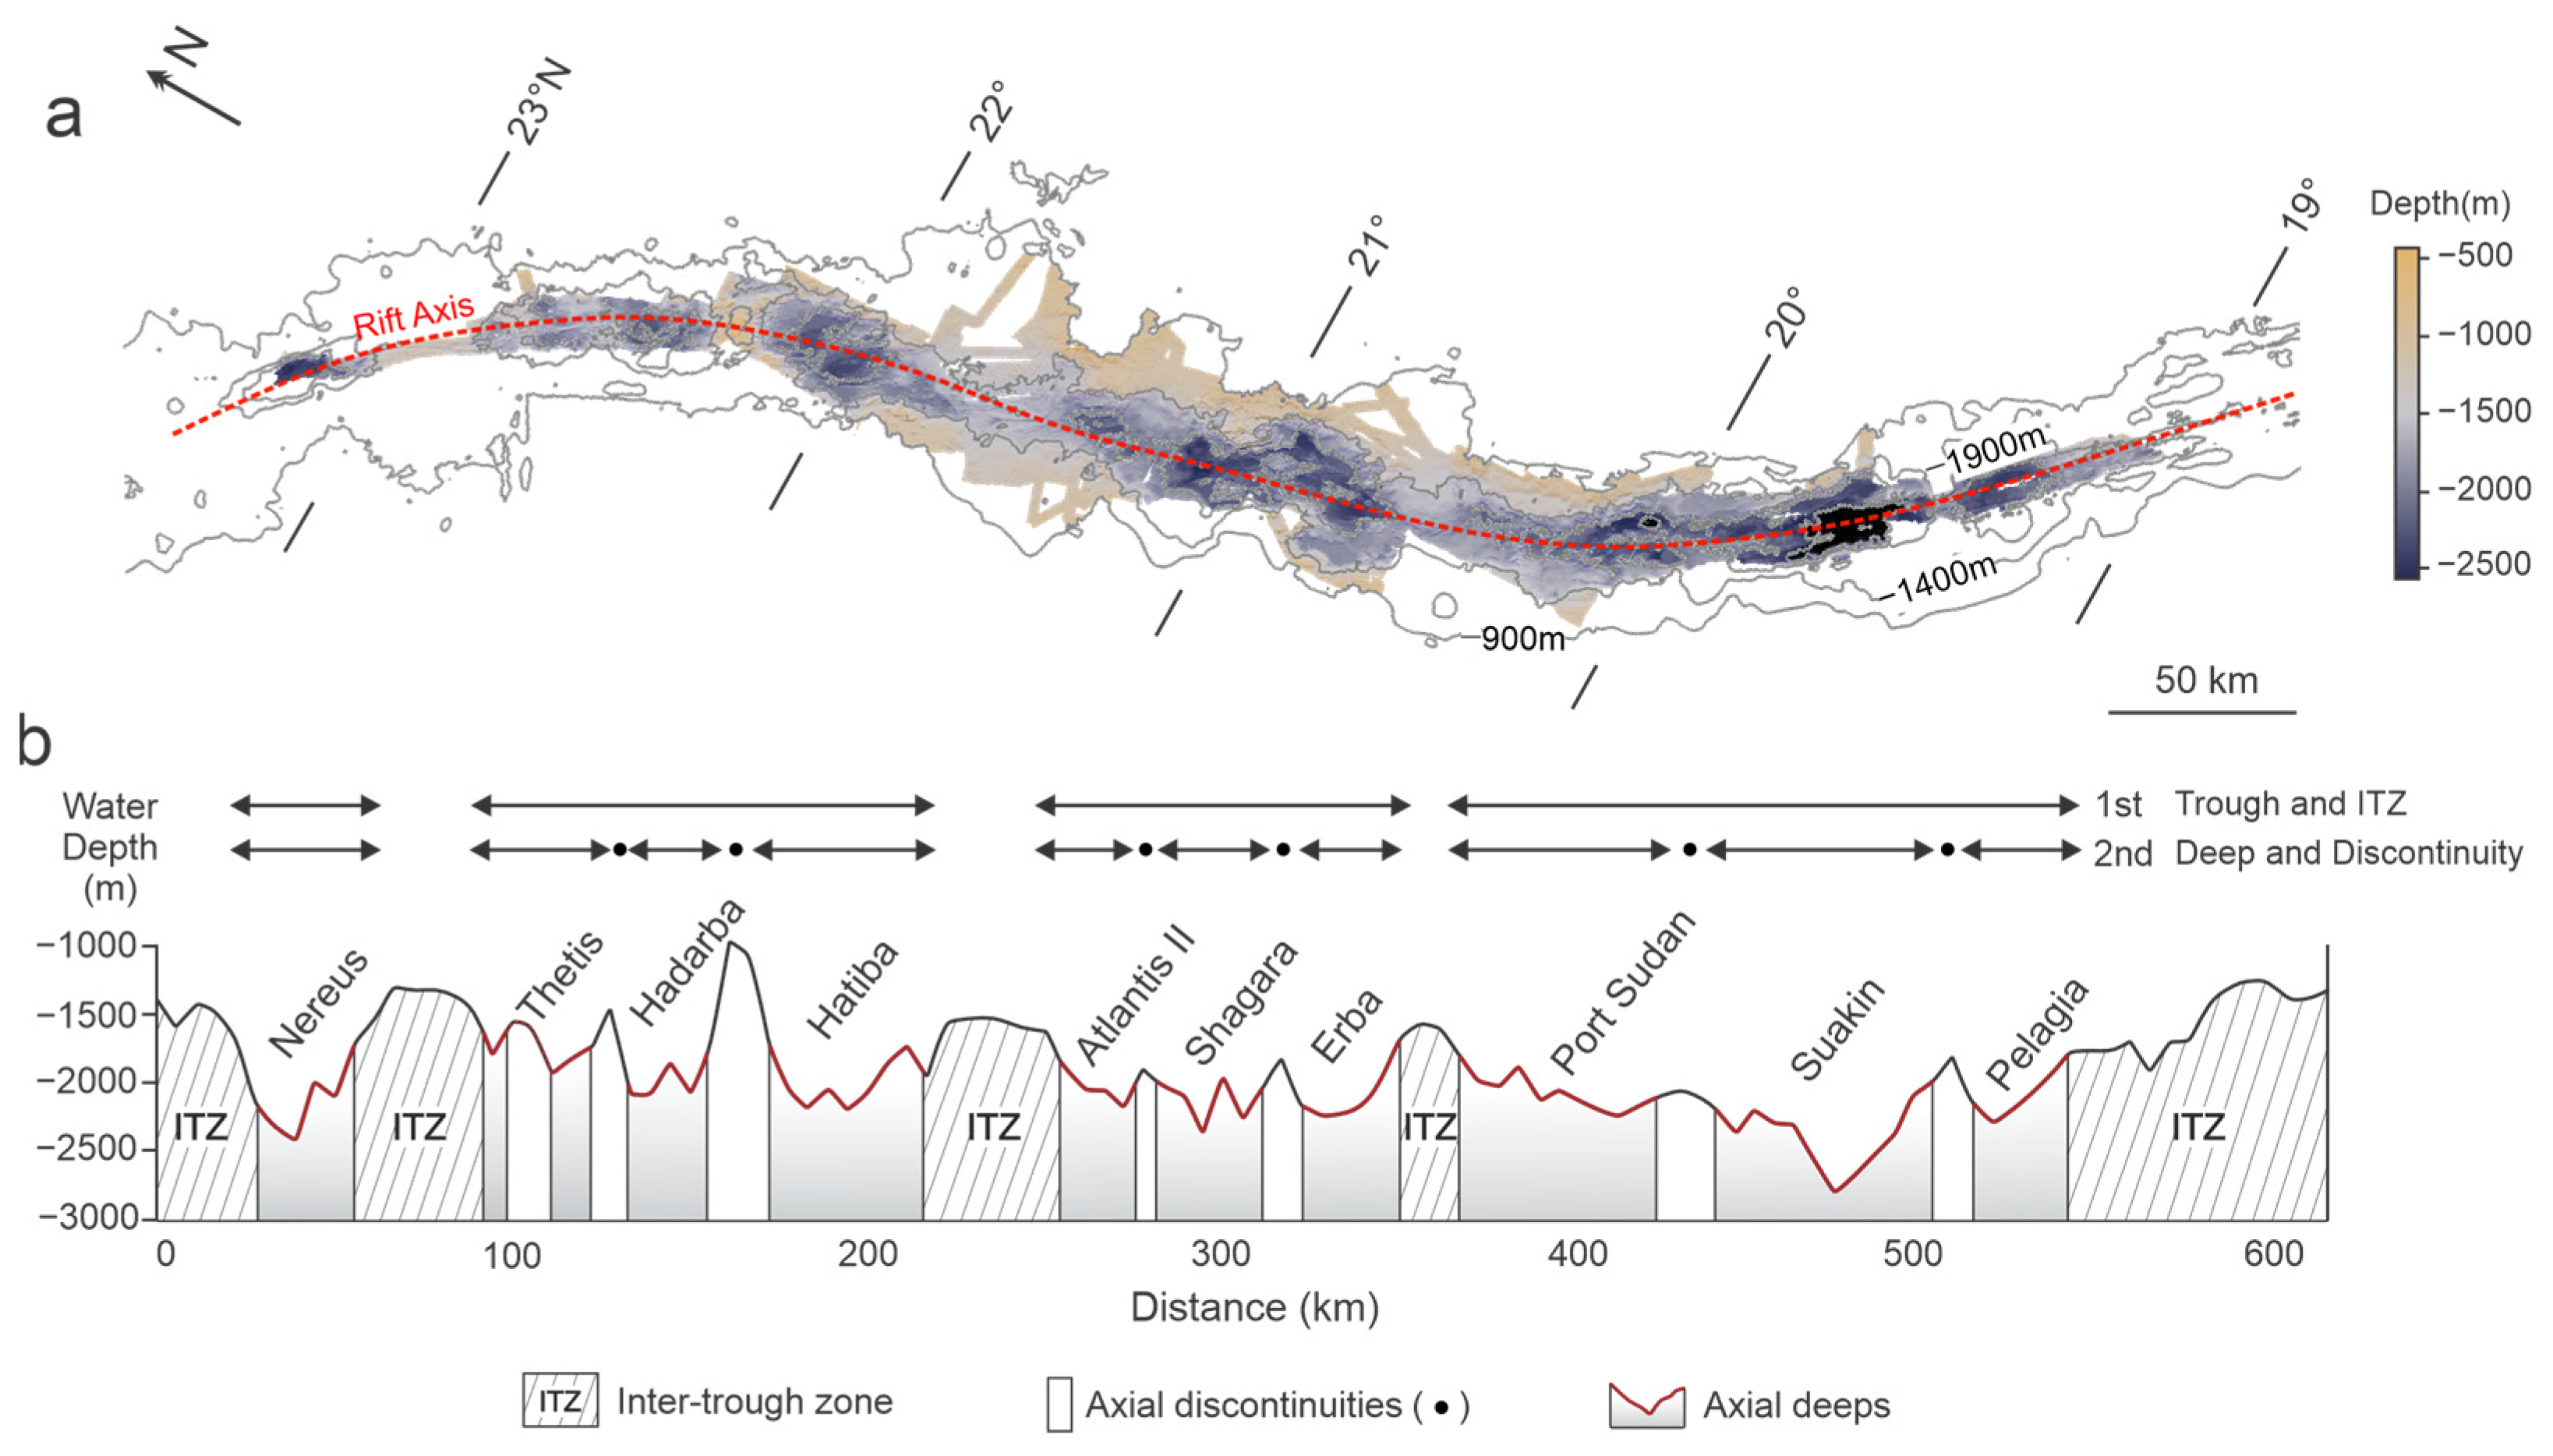
Segmentation of the Central Red Sea Rift axis. (a) Bathymetric map of the rift axis; data from Augustin et al. [34]. Grey lines are isobaths of −900 m, −1400 m, and −1900 m, respectively; data from the GEBCO Compilation Group 2021 (https://www.gebco.net, accessed on 3 September 2021). Red dash line represents the axis of the Central Red Sea Rift. (b) Water depth variation along the red dash line in (a). The red solid lines are indicators of the oceanic crust in axial deeps. Longer arrows represent the first-order segments, central troughs spaced by ITZs; shorter ones represent the second-order segments, axial deeps spaced by the discontinuities (represented by the black dots).
Figure 10.
Segmentation of the Central Red Sea Rift axis. (a) Bathymetric map of the rift axis; data from Augustin et al. [34]. Grey lines are isobaths of −900 m, −1400 m, and −1900 m, respectively; data from the GEBCO Compilation Group 2021 (https://www.gebco.net, accessed on 3 September 2021). Red dash line represents the axis of the Central Red Sea Rift. (b) Water depth variation along the red dash line in (a). The red solid lines are indicators of the oceanic crust in axial deeps. Longer arrows represent the first-order segments, central troughs spaced by ITZs; shorter ones represent the second-order segments, axial deeps spaced by the discontinuities (represented by the black dots).

Figure 11.
Conceptual model of initial oceanization. (a) Early rift initiation, after the first two rifting stages (30–35 Ma). (b) Mantle upwelling and topographic uplift concentrated in the weak zones. (c) Nucleated normal-fault systems controlled the final breakup and formation of the oceanic crust.

Figure 12.
Geophysical and kinematic characteristics of the Central Red Sea Rift. (a) Free-air gravity anomalies of the Central Red Sea Rift [98]. Black lines along the rift axis indicate the isobaths of −900 m and −1800 m. (b) Plate kinematic, heat flow, and earthquakes in the Central Red Sea Rift. Black arrows represent relative motion angular velocities between the Nubia and Arabia, calculated according to the model MORVEL [40]. Grey lines indicate the isobaths of −900 m and −1800 m. Focal mechanism solutions of the earthquakes from 1976 to present are from the CMT catalog [99,100]. Dots are heat flow sites [101].


Table 1.
Reflection seismic data acquisition parameters.
| Parameters | Values | Units | |
|---|---|---|---|
| Recording | Record length | 8 | s |
| Sampling rate | 2 | ms | |
| Shot point interval | 25 | m | |
| Streamer | Number | 1 | - |
| Streamer length | 8100 | m | |
| Operating depth | 7 | m | |
| Channels | 648 | - | |
| Group length | 12.5 | m | |
| Source | Airgun array volume | 2960 | cubic inch |
| Source depth | 7 | m | |
Table 2.
Structural layers and parameters in the gravity model.
| Layers | Density (g/cm3) | Velocity (km/s) | |
|---|---|---|---|
| Water | 1.06 | 1.5 | |
| Sediment | S1 (postsalt sediments) | 2.3 | 2.8 |
| S2 (salt) | 2.2 | 4.0 | |
| S3 (presalt sediments) | 2.4 | 3.5 | |
| Crust | Continental | 2.8 | 6.2 |
| Transitional | 2.85 | 6.1 | |
| Oceanic | 2.9 | 6.0 | |
| Mantle | Mantle | 3.3 | 7.5 |
| Upwelled mantle | 3.1 | 7.6 | |
| Asthenosphere | 3.27 | 7.4 | |
Disclaimer/Publisher’s Note: The statements, opinions and data contained in all publications are solely those of the individual author(s) and contributor(s) and not of MDPI and/or the editor(s). MDPI and/or the editor(s) disclaim responsibility for any injury to people or property resulting from any ideas, methods, instructions or products referred to in the content. |
© 2023 by the authors. Licensee MDPI, Basel, Switzerland. This article is an open access article distributed under the terms and conditions of the Creative Commons Attribution (CC BY) license (https://creativecommons.org/licenses/by/4.0/).
Share and Cite
MDPI and ACS Style
Sang, Y.-D.; Adam, B.M.T.; Li, C.-F.; Huang, L.; Wen, Y.-L.; Zhang, J.-L.; Liu, Y.-T. Punctiform Breakup and Initial Oceanization in the Central Red Sea Rift. J. Mar. Sci. Eng. 2023, 11, 808. https://doi.org/10.3390/jmse11040808
AMA Style
Sang Y-D, Adam BMT, Li C-F, Huang L, Wen Y-L, Zhang J-L, Liu Y-T. Punctiform Breakup and Initial Oceanization in the Central Red Sea Rift. Journal of Marine Science and Engineering. 2023; 11(4):808. https://doi.org/10.3390/jmse11040808
Chicago/Turabian StyleSang, Ya-Di, Bakhit M. T. Adam, Chun-Feng Li, Liang Huang, Yong-Lin Wen, Jia-Ling Zhang, and Yu-Tao Liu. 2023. "Punctiform Breakup and Initial Oceanization in the Central Red Sea Rift" Journal of Marine Science and Engineering 11, no. 4: 808. https://doi.org/10.3390/jmse11040808
Note that from the first issue of 2016, this journal uses article numbers instead of page numbers. See further details here.