
Wind-Assisted Ship Propulsion: Matching Flettner Rotors with Diesel Engines and Controllable Pitch Propellers

Electric, Electronic and Telecommunication Engineering (DITEN), Department of Naval Architecture, Università di Genova, 16145 Genova, Italy
*
Author to whom correspondence should be addressed.
†
These authors contributed equally to this work.
J. Mar. Sci. Eng. 2023, 11(5), 1072; https://doi.org/10.3390/jmse11051072
Submission received: 19 April 2023
/
Revised: 3 May 2023
/
Accepted: 5 May 2023
/
Published: 18 May 2023
(This article belongs to the Section Ocean Engineering)
Abstract
:The harvesting of wind energy and its transformation into a thrust force for ship propulsion are gaining in popularity due to the expected benefit in fuel consumption and emission reductions. To exploit these benefits, a proper matching between the conventional diesel engine-screw propeller propulsion plant and the wind-assisted plant is key. This paper aims to present a method and a code for the preliminary sizing of a ship propulsion plant based on a diesel engine, a controllable pitch propeller, and one or more Flettner rotors. A mathematical model describing the behaviour of the rotor in terms of propulsive thrust and power is proposed. The rotor model has been integrated into an existing diesel propulsion model in order to evaluate the ship’s fuel consumption. The ship’s propulsion model is written in a parametric form with respect to the following design parameters: ship dimensions and resistance-speed curve, propeller diameter, engine power, rotor geometry, and true wind conditions. The methodology helps in evaluating the engine–propeller working points and eventually the total ship propulsive power, including the power required to spin the rotor. It provides a way to compare wind-assisted propulsive solutions in terms of fuel consumption and CO2 emissions. A 3000-ton Ro-Ro/Pax ferry has been selected as a case study. Results on the parametric analysis of rotor dimensions and propeller pitch optimization are presented.
1. Introduction
The Fourth IMO GHG STUDY 2020 evaluated the share of shipping emissions in global anthropogenic emissions to 2.89% in 2018. The same study reported a reduction of the carbon intensity for international shipping between 2012 and 2018; however, the pace of carbon intensity reduction has slowed since 2015, with average annual percentage changes ranging from 1 to 2%. The projection to 2050 indicated a 90–130% of 2008 emissions, far away with respect to United Nations emission reduction goals.
Despite the increasing environmental concern worldwide and some selected proactive initiatives in the shipping sector, generally, the environmental aspect has not been considered a sufficient drive for innovation in emission reduction technologies.
From January 2023, the IMO (International Maritime Organisation) indexes, introduced by the Marine Environment Protection Committee (MEPC 76) in June 2021 as amendments to the International Convention for the Prevention of Pollution from Ships (MARPOL) Annex VI [1], has come into effect. Ships are required to further reduce their carbon intensity and greenhouse gas (GHG) emissions by improving their energy efficiency through the calculation of the Energy Efficiency index for existing ships, EEXI, and threshold values to achieve. Furthermore, the Carbon Intensity Index, CII, has been introduced in order to drive a progressive CO2 emissions reduction of existing ships in the years to come.
The regulatory framework is pushing the marine sector towards the right path of decarbonisation; consequently, greener technologies and solutions, capable of reducing ships’ carbon footprint, become increasingly more important.
Energy efficiency and Carbon Intensity indexes are evaluated in terms of the ratio between the ship CO2 emissions with respect to the performance output (i.e., transport work). Because CO2 is proportional to fuel consumption, a way to improve the ship’s efficiency is to adopt propulsion technologies able to reduce the installed engine power and to lower the fuel consumption for the same transport work. This way of thinking is also economically viable because it reduces the ship’s running costs (fuel bill) with a moderate CAPEX increase.
For a new ship design, multiple technologies can be considered to improve ship energy efficiency: wind-assisted propulsion, air bubble lubrication, hull forms, appendages, and new fuels. On the contrary, for existing ships, the range of possibilities is reduced and fuel consumption reduction has to be achieved by properly integrating the existing plant with new technologies. Among others, one of the best solutions for retrofitting, as well as for new ships, is the installation onboard of some kind of renewable energy source, and in this study, Flettner rotor wind-assisted propulsion has been addressed.
Wind-assisted ship propulsion (WASP) embraces a number of technologies that use wind force to produce thrust for the ship propulsion; this is not a new idea, since sails have been used for thousands of years. The actual interest in wind power is in assistance to a conventional propulsion plant. Multiple WASP technologies are proposed for ships, such as traditional sails, wing sails, kites, and Flettner rotors. The latter is the one chosen in this study because it is a lightweight solution, compact in size, and easy to operate.
Flettner rotors are rotating cylinders (usually spun by an electric motor) that generate aerodynamic lift and drag when immersed in a fluid stream; the working principle belongs to the so-called Magnus effect [2]. In the case of wind-assisted ship propulsion, the fluid considered is air; however, there are also ship applications of the Magnus effect in water; an example is reported in [3], where a rotating cylinder acts as a bow steering system that improves vessel manoeuvrability, turning, and course keeping ability. The experimental setup and the measurements of the hydrodynamic forces generated on the rotating cylinder (rotor) under uniform water flow, including the free surface effect, have been presented in [4]. Another application has been studied in [5], where the Magnus effect is applied to a anti-rolling device; the study addresses the rotor hydrodynamic performance to enhance ship seakeeping strategies at zero and low speeds.
Most of the literature deals with the Flettner rotor physics in air. In [6], the rotor aerodynamics has been analysed by means of numerical simulations to create a tool for the preliminary design. Some parameters, such as spin ratio, aspect ratio, and rotor dimensions, have been systematically varied to evaluate their impact on the lift and drag coefficients, and these data were validated. The simulation results were used for the development of a model of lift and drag coefficients useful for the preliminary design of the Flettner rotor; these formulae are used in this paper, Section 2.2.
In [7], a series of experiments were conducted to better understand the influence of Reynolds number on rotors; the large amount of data collected showed that the Reynolds number does not influence the power consumption of the rotor and that it allowed us to derive an analytical function for its calculation, as reported in this paper, Section 2.4; the authors also suggest to take into proper consideration the rotor mechanical systems when computing the actual power consumption. The rotor’s power consumption is also analysed in [8] alongside power developed.
The integration aspects onboard a ship are addressed from the stability point of view. In [9], the rotor impact on ship stability is addressed, and the outcome of the study shows a moderate or insignificant impact. Ref. [10] addresses the relationship between the rotor and the ship’s roll motion: the rotor thrust force is observed to decrease in roll motion because of the reduction of the rotor projected area with increasing heel angles. Furthermore, it has been observed that the maximum heel angle is increased in the roll motion of the non-rotor ship case.
Several studies exist on the analysis of the system performance onboard. According to [11], there are six kites, two suction wings, three rigid sails, and nine Flettner rotor installations onboard different ship types. Articles and press releases [12] report important benefits. Some of the more recent studies show a significant fuel consumption reduction with the use of the rotor as an auxiliary propulsion device; in particular, ref. [11] reports a list of measured fuel saving values in the range 1–50%, ref. [13] reports up to 22% savings of the annual ship fuel consumption, with a pay-back time of six years. Similar results of up to 20% savings are reported by [14] and by [15], where both a rotor and a kite are investigated.
In [16], different wind-assisted technologies (rotor, wing sail and DynaRig) are compared, and the most significant fuel savings have been provided by the Flettner rotor, with an average value of 9%. On the contrary, Ref. [17] shows quite low benefits of under 1% when using the rotor on a DWT 4000-ton container ship. Ref. [18] presented a ship performance model set up to evaluate the best way of using a pair of Flettner rotors for a small Ro/Lo vessel. The study analysed the performance of this propulsion system in consideration of weather and sea conditions, evaluating the related reduction in fuel consumption. They showed by a techno-economic analysis that, operating in calm and closed seas such as the Mediterranean with a required speed of 14 knots, the return on investment ranges between 7 and 12 years depending on the aspect ratio; however, the method to quantify fuel consumption is not fully reported in the paper.
Despite that the focus of the studies are the same, i.e., the environmental benefits, the metrics used to quantify those benefits are different (i.e., propulsion power, fuel consumption, power, and costs) and are sometimes not easy to compare. In [10,19], the thrust ratio has been used. In [20,21], lift has been used. In [16], fuel consumption has been used.
The aim of this paper is to describe a procedure able to quantify the fuel consumption of a combined propulsion system consisting of a diesel engine and a controllable pitch propeller assisted with one or more Flettner rotors. The procedure is based on a ship’s propulsion model written in parametric form with respect to the following design parameters: ship resistance curve, propeller diameter, engine power, rotor geometry, and true wind conditions. The evaluation of the engine–propeller working points and eventually fuel consumption follow the standard marine engineering matching procedure, given the rotor thrust.
The innovation consists in the possibility to study the performance of the integrated propulsion system in a parametric way, with the aim to find optimal solutions during ship design. One example is downsizing the diesel MCR in relation to the rotor geometry, or the propeller pitch optimization for different wind conditions, to achieve the least possible fuel consumption.
2. Materials and Methods
The aim of this study is to evaluate the ship fuel consumption of a wind-assisted propulsion technology in a comfortable way for naval architects/marine engineers. The proposed methodology integrates the Flettner rotor into the well-known engine–propeller matching procedure. This study is the continuation of the works [22,23], where the rotor forces were addressed.
2.1. Wind Assisted Ship Propulsion Modelling
In analogy with the conventional engine–propeller matching, the following data are supposed available:
- Ship dimensions and hull resistance at different speeds;
- Propeller characteristics, in terms of dimensionless thrust and torque by means of the coefficients KT and KQ;
- Engines load diagram in terms of power—engine speed and specific fuel consumption curves;
- Efficiencies (shaft line, gear box, etc.) and hydrodynamic coefficients;
- Ship electric load balance;
- wind conditions;
- Flettner rotor geometric dimensions.
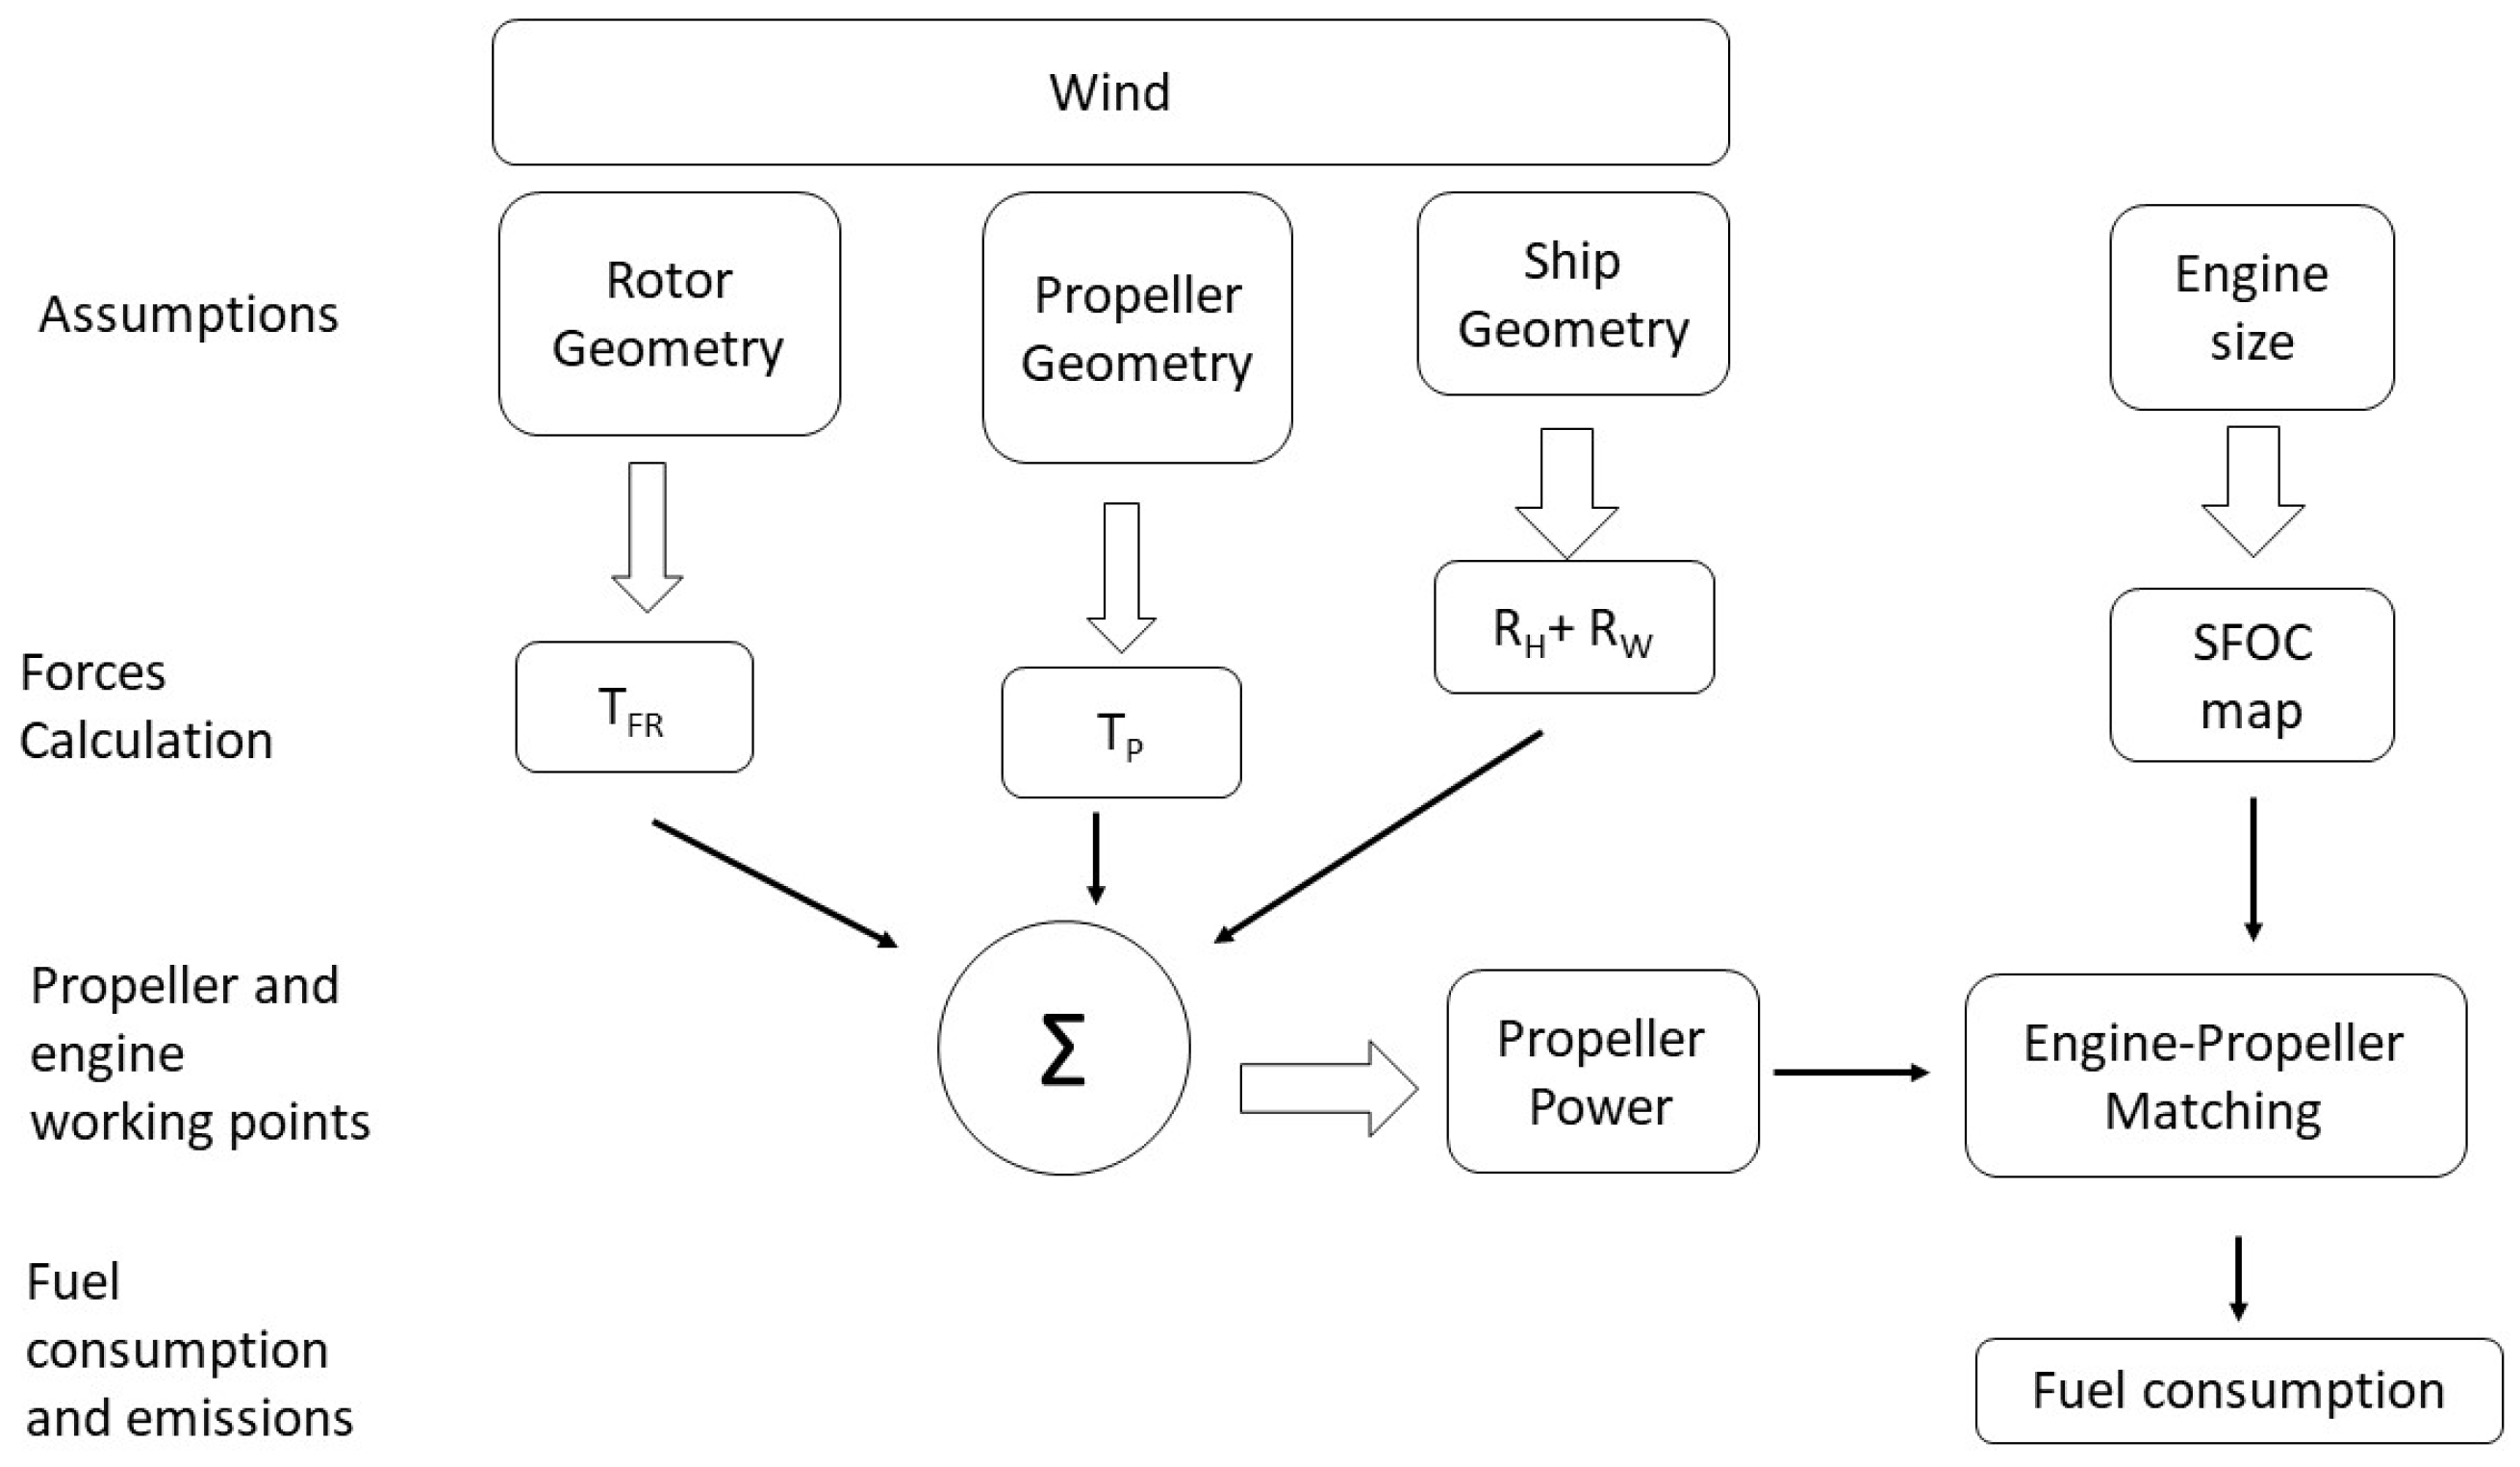
The methodology can be summarised by the following steps:
- Evaluation of the rotor forces.
- Evaluation of the rotor thrust () and effective net resistance () that the propeller has to balance.
- Evaluation of the propeller working point by imposing the equilibrium between the propeller thrust and the ship net resistance () at a specific ship speed (V).
- Matching in terms of power PB between the propeller and the engine working points, by using the engine load diagram.
- Evaluation of the engine fuel consumption by using the Specific Fuel Oil Consumption (SFOC) map.
- Estimate of ship emissions.
Figure 1 shows a flow chart of the method. The rotor forces calculation is presented in Section 2.2, the ship resistance evaluation is presented in Section 2.3, the propeller and engine working points calculation (power and revolutions) are presented in Section 2.4, and fuel consumption and emissions are presented in Section 2.5.
The methodology has been coded, and the developed tool is available for download [24].
2.2. Rotor Forces
The evaluation of the rotor forces is one of the key aspects of the method. Two reference frames are used: the hull-fixed (, , , ) and the apparent wind (, , , ).
In the hull-fixed frame, is pointing forward, towards starboard and downwards, according to [25]; the origin coincides with the centre of the base of the rotor, as shown in Figure 2.
In the apparent wind frame, the axis is parallel to the apparent wind, with the same direction, is perpendicular to the apparent wind, and is pointing downwards. The angle represents the direction of the apparent wind. The apparent wind () is computed by the vector sum between true wind and ship speed. The true wind () represents the wind characteristics over a sea area and is an input of the procedure. Figure 2 shows the forces generated by the rotor in operation.
The rotor lift and drag can be computed using Equation (1):
where and are the lift and drag coefficients of the rotor reported in Equation (2). The coefficients and have been evaluated according to [6], SR is the rotor spin ratio (), AR is the rotor aspect ratio (), d is the rotor diameter, and is the end plate diameter.
The total force developed by the rotor is the composition of the rotor’s aerodynamic lift () and drag (): . The useful propulsive force is the thrust produced by the rotor in the forward direction. The sideways force is the sway force, the projection of on the transverse axis.
Given that can be expressed in both reference frames as follows: , the rotor’s trust ( and sway force () can be calculated as:
is positive when pointing forward and when pointing to starboard.
2.3. Ship Resistance
In this paper, the ship net resistance is defined as the part of the ship resistance that is not overcome by the rotors’ forward forces at speed V. The net resistance has to be counterbalanced solely by the propeller thrust . The net resistance evaluation is an essential step used to determine the propeller working point when the rotors are operating since the propulsion equilibrium condition along the ship longitudinal axis is reached when .
Equation (4) shows the different contributions to net resistance, where is the hull resistance in calm condition (no air, no wind, no waves), is the added resistance due to air friction on the whole ship (ship superstructure and rotors), and is the thrust generated by all the rotors in the forward direction (positive).
The force is known due to the hypotheses in Section 2.1, while each is calculated using Equation (3). The air- and wind-added resistance accounts for the effects of the air friction and of the wind on the ship’s projected area above the waterline [26,27]:
where is the drag factor assumed equal to [26], is the density of air (1.225 kg/m), is the apparent wind velocity, is the transverse ship projected area above waterline, and is the direction of incoming apparent wind. The effect of the Reynolds number is considered negligible [26]. is added because the added wind resistance due to the presence of rotors as appendices must be considered: when one of the rotors installed onboard is switched-off, it is considered as an additional superstructure:
where the drag factor K is a function of the rotor aspect ratio, and it was assumed to be 0.8 [28]. The effect of the Reynolds number was not considered since [27] proved that the rotor aerodynamic coefficients are almost constant for or are greater. The rotor projected area is the product between the height and diameter.
2.4. Power
The propeller working points can be easily calculated by the standard matching procedure by using the net resistance , as described in [29]. The propeller revolution np is calculated by solving the forward equilibrium equation written in terms of the auxiliary variable KT/J2:
where J is the advance coefficient VA/(np·Dp); is the water density; VA = V · (1 − w); V is the ship’s speed, w is the wake coefficient, t is the thrust deduction factor, and Dp is the propeller diameter. The first term in Equation (7) represents the propeller KT/J2 characteristic, while the second term represents the hull demand. From Equation (7), the advance coefficient is computed, and then, the propeller revolution at equilibrium np is found [30].
The required propeller power PO and the required engine power PB, to achieve the ship’s speed, is then evaluated by Equation (8):
where PO is the open-water propeller power, is the relative rotative efficiency, is the shaft line efficiency, is the gear efficiency, and KQ is the non-dimensional propeller torque.
Further details and applications can be found in [31].
In the case of fixed pitch propeller (FPP), by repeating the procedure for several ship speeds, the propeller curve of PB = f(V) is obtained. In the case of a controllable pitch propeller (CPP), the above procedure needs to be repeated also for several P/D, and the result is the propeller surface PB = f(V, P/D).
The total ship propulsive power is given by the sum of the engine’s mechanical power () and the mechanical power to spin the rotors (). The power to spin each rotor is evaluated by Equation (9), where the numerator represents the mechanical power required to spin the Flettner rotor [7], and the denominator represents the transmission efficiency and accounts for the losses in the transmission gears.
The power to spin the rotor () is computed considering the coefficient of friction is equal to 0.007, the flow tangential velocity , and the lateral surface of the rotor .
In ship propulsion, the required power represents a key value to minimise in the design phase. The first key parameter indicator (KPI) used in this study is the power saving using the FR, according to the following formulation:
where is the required power when the rotor is in operation, and is the required power when there is no rotor. This expresses the power saving achieved when the rotors are in use. If the is positive, the effect of the rotors is beneficial for the propulsion; if it is negative, they require more than they can provide.
2.5. Fuel Consumption
The marine diesel engine is modelled starting from very few input data (power and speed at 100% MCR and fuel flow rate at 80% MCR using the semi-empirical formula [32,33]) and has been calibrated using manufacturer data [34]. The model provides the specific fuel oil consumption map (g/kWh) and the hourly fuel consumption map (kg/h) (i.e., for each point inside the engine load diagram). In order to increase the accuracy, the actual engine maps can be used in the code, if provided by the manufacturer.
The engine–propeller working points are evaluated by matching the propeller load diagram PB(n) with the engine load diagram [29]. The matching considers as a variable the gear ratio and a 15% engine margin.
The fuel flow rate is then computed at each working point by Equation (11).
where is the specific fuel consumption at the engine working point identified by , and is the propeller’s required power at the working point. In case an FPP is studied, the (n) relationship is a curve. In case a CPP is studied, the (n,) relationship is a surface, where each ship speed can be achieved with different P/D values that correspond to different engine power and fuel consumption. The P/D value that corresponds to the minimum value is selected, given that the working point lies within the load diagram [35,36].
The total ship fuel consumption is given by the sum of the propulsion consumption and the fuel consumption to spin the rotors. Lastly, the emissions are evaluated following the Guidelines to MARPOL Annex VI [37].
The simulator can compare up to three engines at the same time.
The second KPI chosen in this study is the fuel consumption saving achieved when the rotors are in use, according to Equation (12):
where is the fuel consumption when the rotors are in operation, and is the fuel consumption when there are no rotors onboard.
The KPI2 is helpful in ship design to determine the best engine among available alternatives since different propulsion plants and power generation configurations can be modelled. The KPI2 can also be used in ship operations to estimate fuel consumption with the weather forecast [38,39], using, as , fuel consumption with rotors installed onboard but switched off.
2.6. Modelling Assumptions and Limitations
The main limitations of the proposed approach are discussed with reference to the steps presented in Section 2.1. The rotor forces do not account for the interaction between the rotor and other rotors or ship superstructures; further, no ship motions are considered for the force evaluation.
The ship resistance does not account for the transverse component of the rotor force. Instead, the ship resistance accounts for the effect of waves, however, in a simplified way. The problem is addressed by using the ‘sea margin’ approach, a design method considering an additional value to still water resistance (sea margin). From an operational perspective, this method is less useful, and other wave resistance models should be used. However, this tool requires a resistance curve as input, irrespective of the method used to compute the curve.
As far as fuel consumption is concerned, the SFOC map modelling can be replaced by the actual engine SFOC map, if provided by the engine manufacturer. The gain in accuracy may be significant, however, only in the low power working conditions.
3. Results
3.1. Case Study
To showcase the potential of the methodology, a case study has been selected. The case study does not exactly represent an existing ship; however, it has been inspired by the small ro-ro/pax ferries operating in the Mediterranean connecting islands with the mainland. The propulsion system consists of a diesel engine driving a CPP in a twin-shaft configuration. The main case study’s data are reported in Table 1.
The ship resistance curve has been computed by a semi-empirical method, and the propeller characteristics rely on the Wageningen B-type published data, as commonly performed in the preliminary ship design.
A number of two identical Flettner rotors (FR) were considered suitable for this application. Table 2 shows the initial rotor characteristics.
The rotor’s initial dimensions were selected according to a survey of the market availability for vessels similar to the case study.
Aspects related to the rotors’ position such as structural aspects, visibility from the bridge, cargo operations, etc., were not considered in this study. The complete set of data and the code to compute the case study are available for download in the public repository [24].
3.2. Parametric Study of the Rotor Geometric Dimensions
Starting from the initial guess, the influence of the rotor geometric dimensions, incoming wind direction, and speed on the rotor thrust and on the air resistance, has been investigated. Two different rotor highs and three different diameters were tested at a constant slip ratio (SR) with the aim to identify the best rotor geometry from the point of view of the propulsion performance.
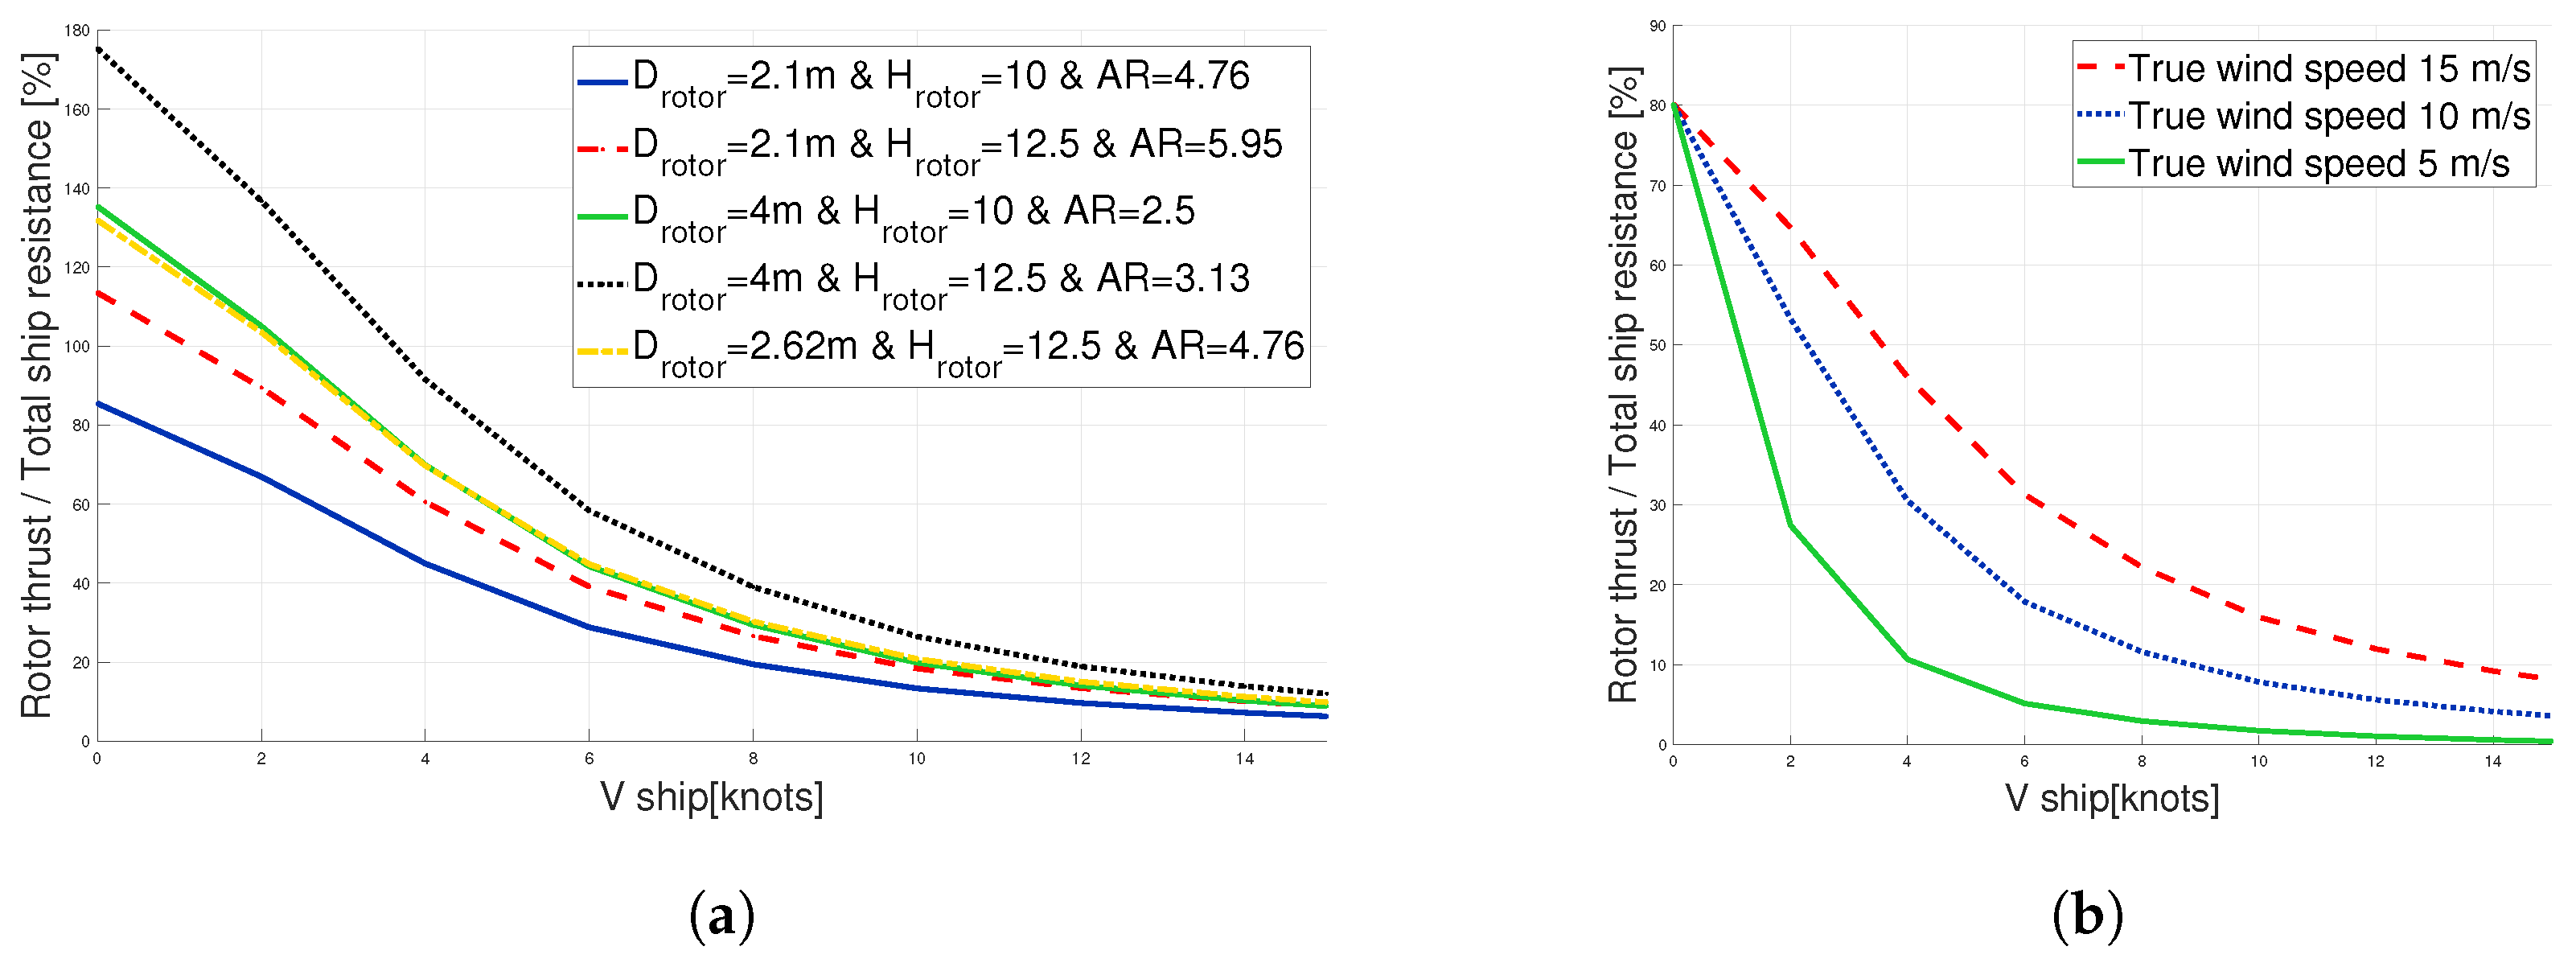
Figure 3a summarises the parametric investigation on rotor geometry. The rotor thrust over total ship resistance ratio () with respect to the ship speed is presented for different rotor geometries. The wind condition is kept constant at 15 m/s and 110° direction (downwind sailing).
The positive effect of the rotor reduces as the ship speed increases, for all rotor sizes. At the ship speed of 10 knots, promising thrust generated by the rotor between 15 to 30% of the total ship resistance is found, while at 14 knots (design speed), the rotor can contribute between 10 and 20% of the ship resistance. The rotor’s diameter significantly increases the thrust.
In Figure 3b, the influence of the true wind speed on the rotor presented in Table 2 is reported. The thrust–resistance ratio decreases very rapidly with the ship’s speed. However, stronger winds are beneficial: a stronger wind increases rotor thrust but also ship resistance; this graph clearly shows that the thrust increase is prevailing. The latter is only referred to a true wind coming from 80° (lateral wind). A more complete analysis of the wind direction influence is discussed in Section 3.3, and other results of the parametric investigation are reported in [22,23], where the analysis of wind and ship speed variation is extensively reported.
On the basis of parametric studies, a first guess of the rotor dimension is achieved. For the selected case study, a 12.5 m rotor with a diameter of 2.62 m is considered a good compromise between performance and installation onboard. The results in the following sections refer to these rotor dimensions.
3.3. Numerical Results for KPI1
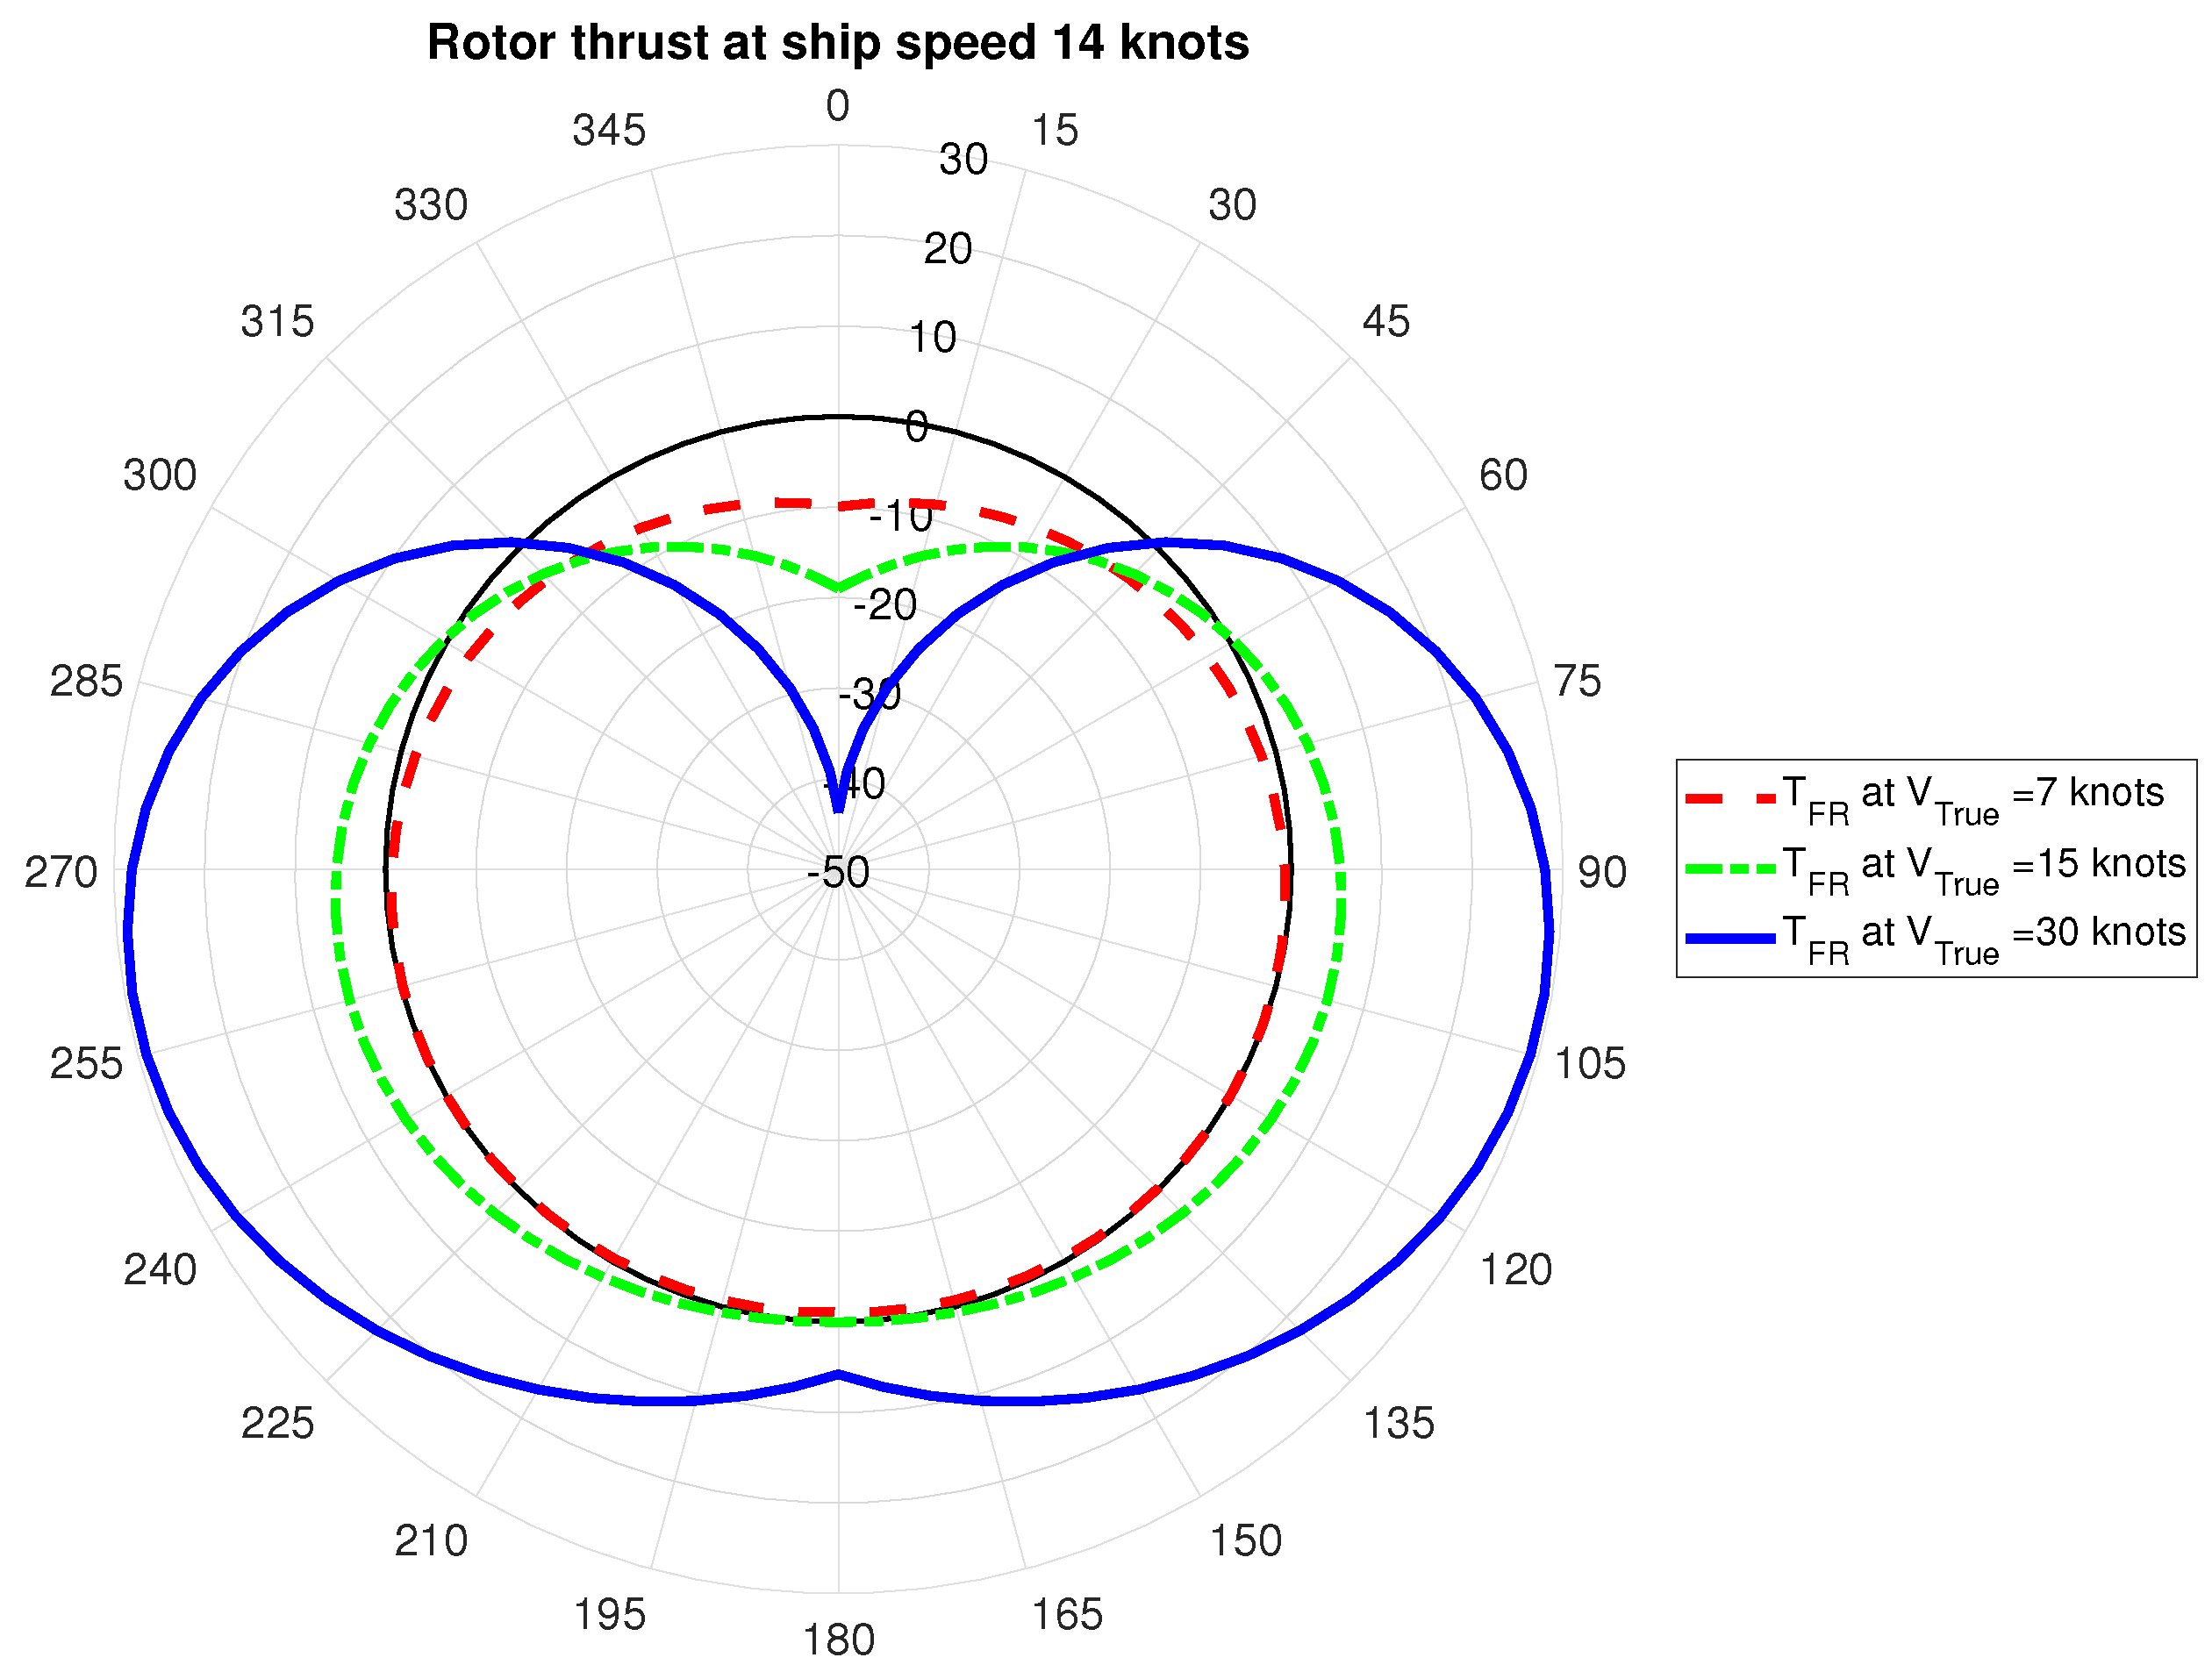
To better evaluate the influence of wind conditions on the rotor thrust and eventually power savings, some polar plots are presented. The rotor dimensions are those selected in the previous section, and the ship speed is kept constant at 14 knots, corresponding to the design speed.
In Figure 4 and Figure 5, the influence of true wind speed and direction is reported. The angle of the polar plot represents the direction of the incoming wind with respect to the bow: 0° is the fore wind, 180° is the aft wind, and 90° is wind from the starboard. The true wind speed is a parameter, where each line on the graphs represent a true wind: 7 knots is red, 15 knots is green, and 30 knots is blue.
Figure 4 shows the rotor thrust (TFR) in kN; as expected, the magnitude increases with wind speed; however, negative values are also possible. The sign is meaningful: according to the definition of the base, negative thrust represents additional resistance. The figure points out that the rotor, at the selected SR = 3, does not contribute positively to the propulsion in headwind conditions; for this ship’s speed (14 knots), a true wind is beneficial when it blows from 50° to 310° and when the intensity is greater than 7 knots. Instead, the FR operation with a true headwind (from 310° to 50°) would result in additional resistance.
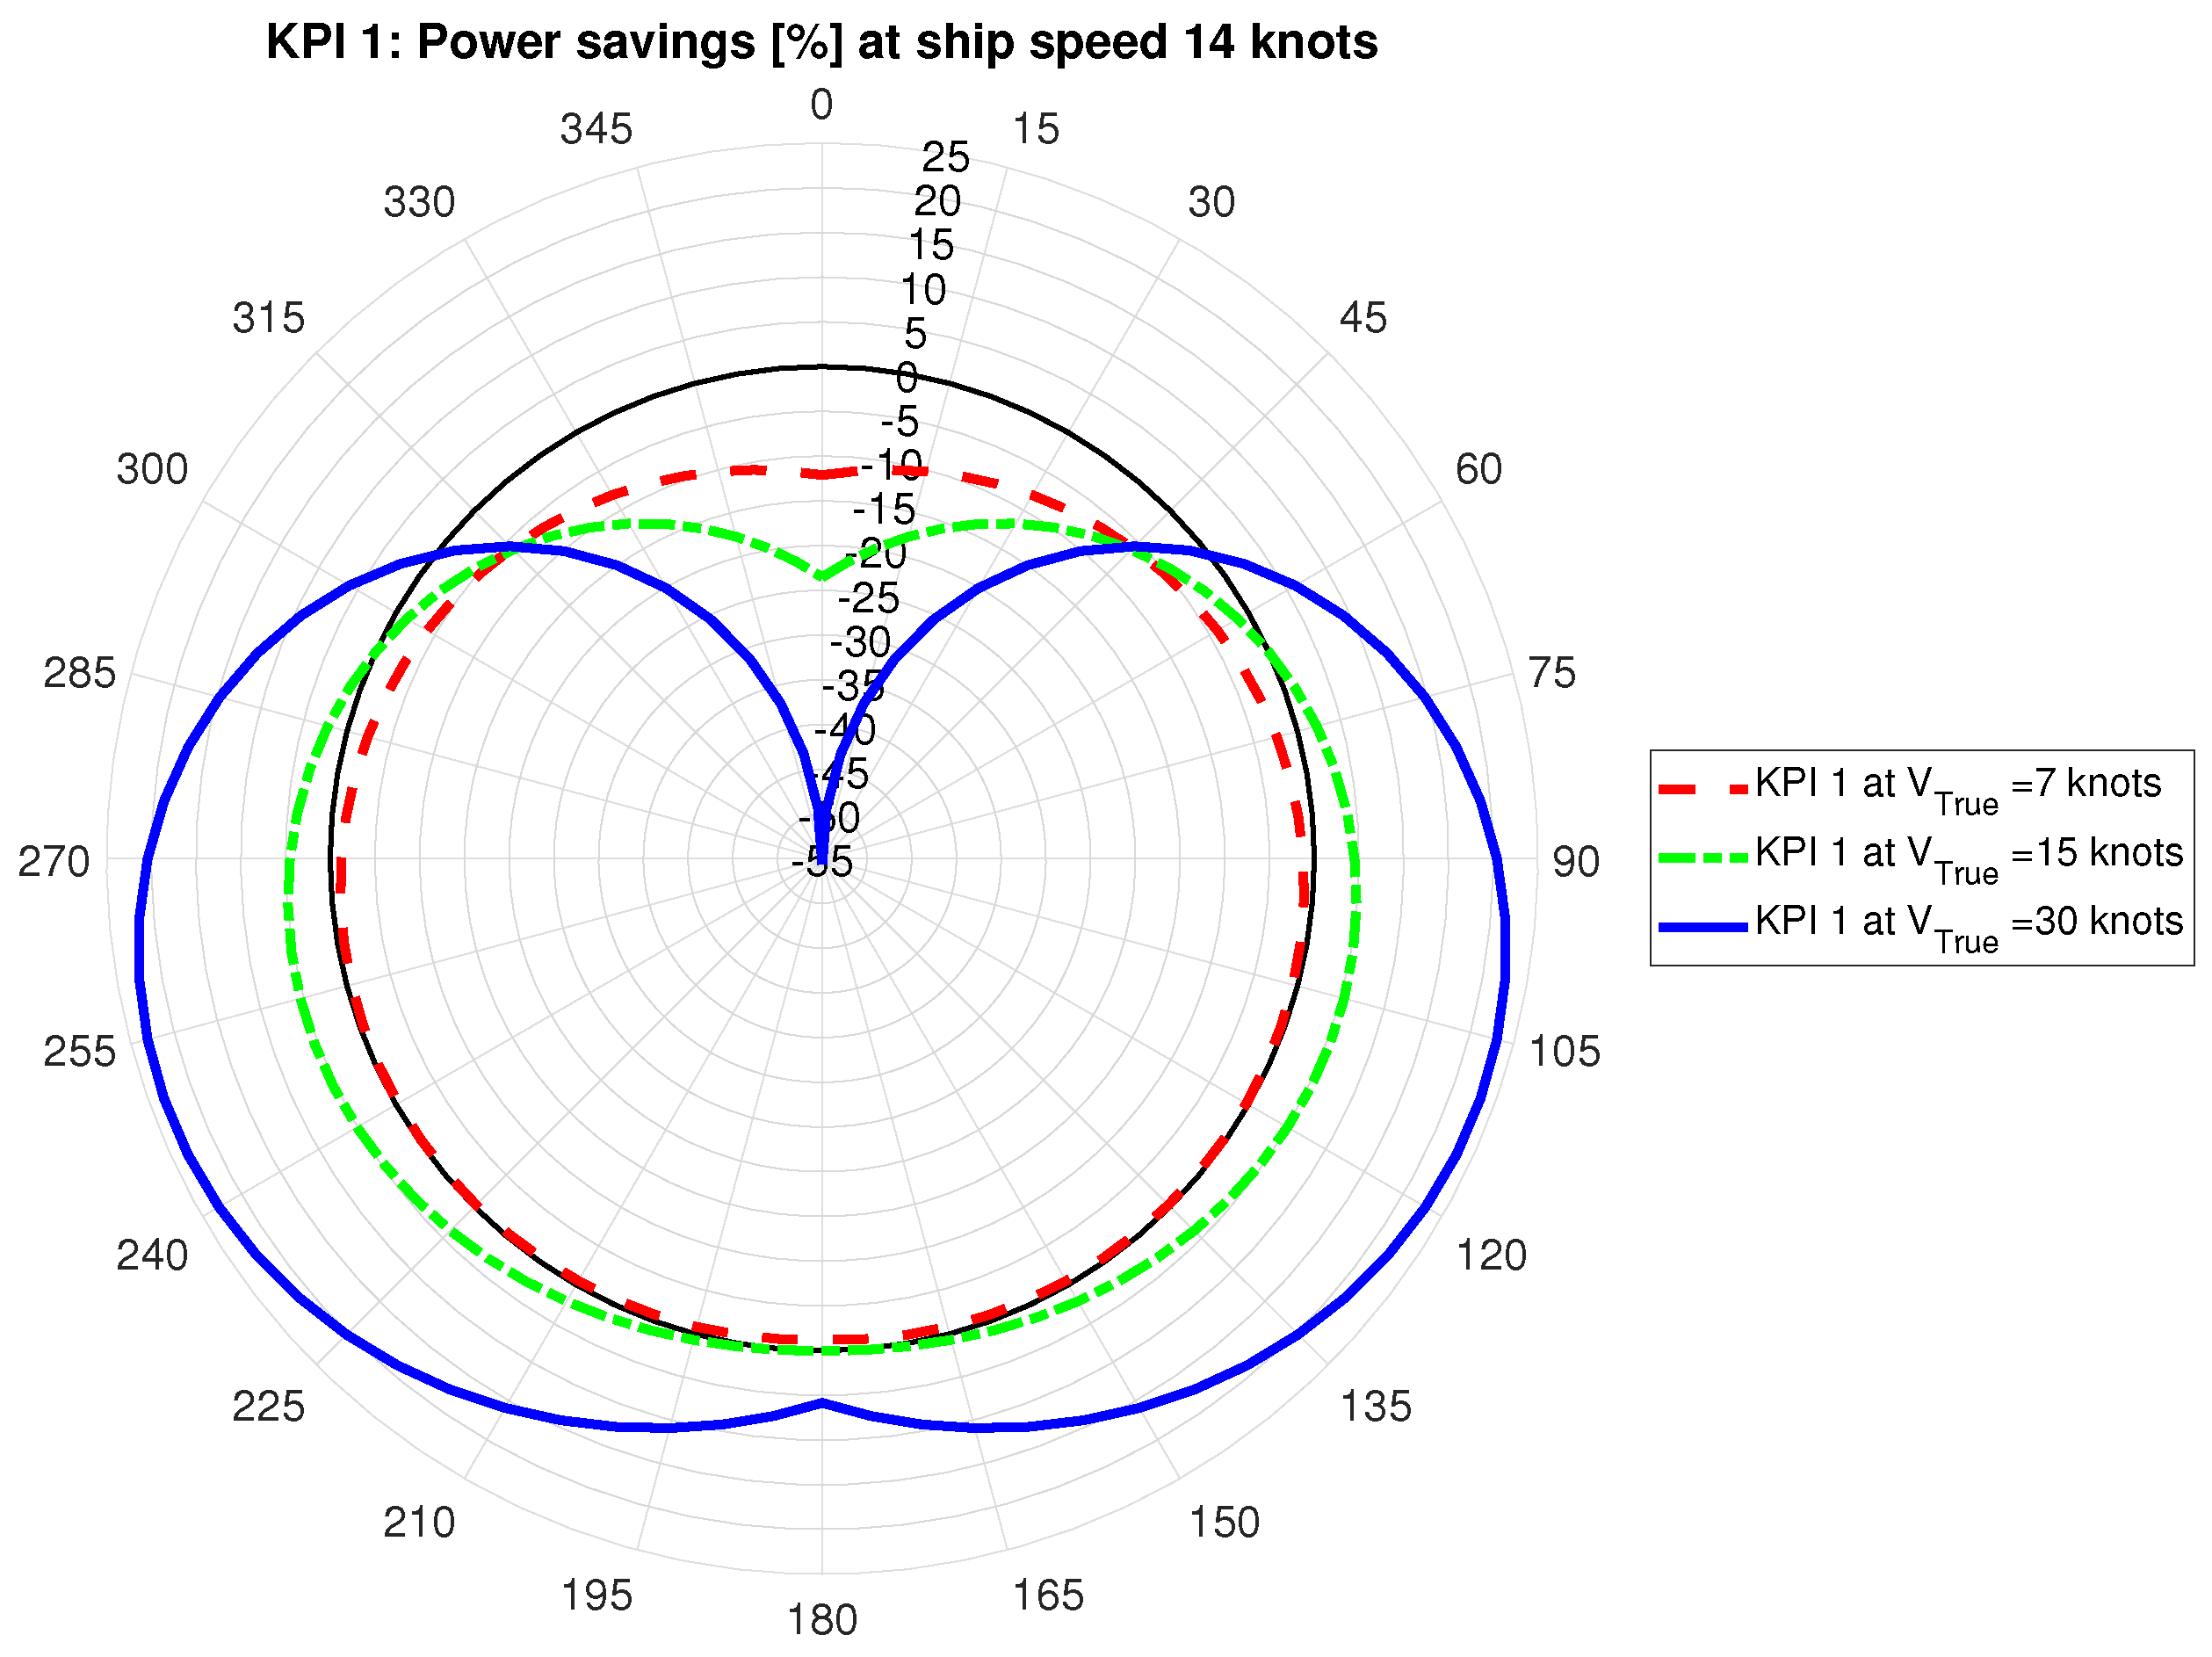
A more intuitive representation of whether the rotor contributes positively or not is made using the KPI1 introduced in Section 2.4 and is represented in Figure 5. The figure shows the percentage of savings in terms of propulsive power as calculated by Equation (10) at a constant speed of 14 knots and SR = 3. Positive values (in the range 0%, +25%) represent a positive contribution to the propulsion; instead, the negative values (in the range 0%, −55%) represent an additional power request. The figure highlights that the range of suitable winds (positive power savings) increases with the wind speed. In terms of power, for a 15-knot wind, the power saving is about 5%, while for a wind of 30 knots, from 110°, the power saving can increase up to 23%.
Mediterranean conditions normally present light or moderate winds with no prevailing direction. From the above presented analysis, it can be argued that gains due to wind, at ship design conditions, would lay in the range of 5% to 10% in the best scenario.
To better exploit wind potential, KPI1 has been analysed with different combinations of design variables and environmental conditions. Results are summarised in the following tables.
Table 3 shows KPI1 versus ship speeds, at constant wind angle (100°) and SR = 3. The values of this table show that KPI1 decreases very rapidly with the increase in ship speed; furthermore, a stronger wind is overall beneficial. This may seem to be an obvious result, but it is not. A stronger wind increases both rotors’ thrust and ship resistance, but this table clearly shows that the effect on the rotors is prevailing.
The results suggest adapting the ship speed to the wind conditions, an operational mode in contrast with the usual ferry operation. The values reported in the second row ( = 15 kn) of Table 3 are shown in Figure 6 as a function of the ship speed.
In Figure 6, the values of KPI1 are always positive and greater than 4%; thus, in this wind condition (15 knots from 100°), the rotors are beneficial for all considered ship speeds. In particular, looking at 14 knots (design speed), the rotors are capable of ensuring more than 5% of power savings.
Table 4 shows KPI1 versus SR and wind speed, at a constant wind angle (100°) and ship speed of 14 knots. The values show that the SR selection is a crucial parameter used to keep a positive rotor contribution, mainly with light winds. The SR can also be considered an operational variable by using variable speed motors to drive the rotors.
A key design aspect focused on in this work is the propeller. The propeller efficiency accounts for a significant part of the overall propulsion efficiency and ship fuel consumption. The propeller design is centred on the delivered thrust, a parameter that is far from easily predictable in wind-assisted propulsion because it is dependent on the true wind. Table 5 compares the CPP and FPP performance using KPI1 as a metric. The propeller performance calculations are based on the MARIN B-type systematic series [40].
In Table 5, the KPI1 values are reported for four different FPP propellers and one CPP, for a ship speed of 14 knots, SR = 3 and a wind coming from 100°. In the case of fixed pitch propeller (FPP), analysing different P/D helps to select the best P/D design value. In the case of a controllable pitch propeller (CPP), the values in Table 5 correspond to the optimum P/D value. The optimum has been selected to minimise the fuel consumption according to [35], in the range from P/D = 0.4 to P/D = 1.4, step 0.05, with and without rotors.
Results show that if the propeller is designed for the full thrust (no WASP) and the rotor SR is fixed at 3, it is possible to save power only with a wind speed greater than 7 knots.
3.4. Numerical Results for KPI2
One of the most important metrics for propulsion selection is related to fuel consumption, and in this paper, it is represented by KPI2. The fuel consumption evaluation requires the selection of the main engine and its characterisation by the specific fuel consumption map. Although the simulator can handle three engines at the same time, only one model is reported in this case study to simplify the discussion.
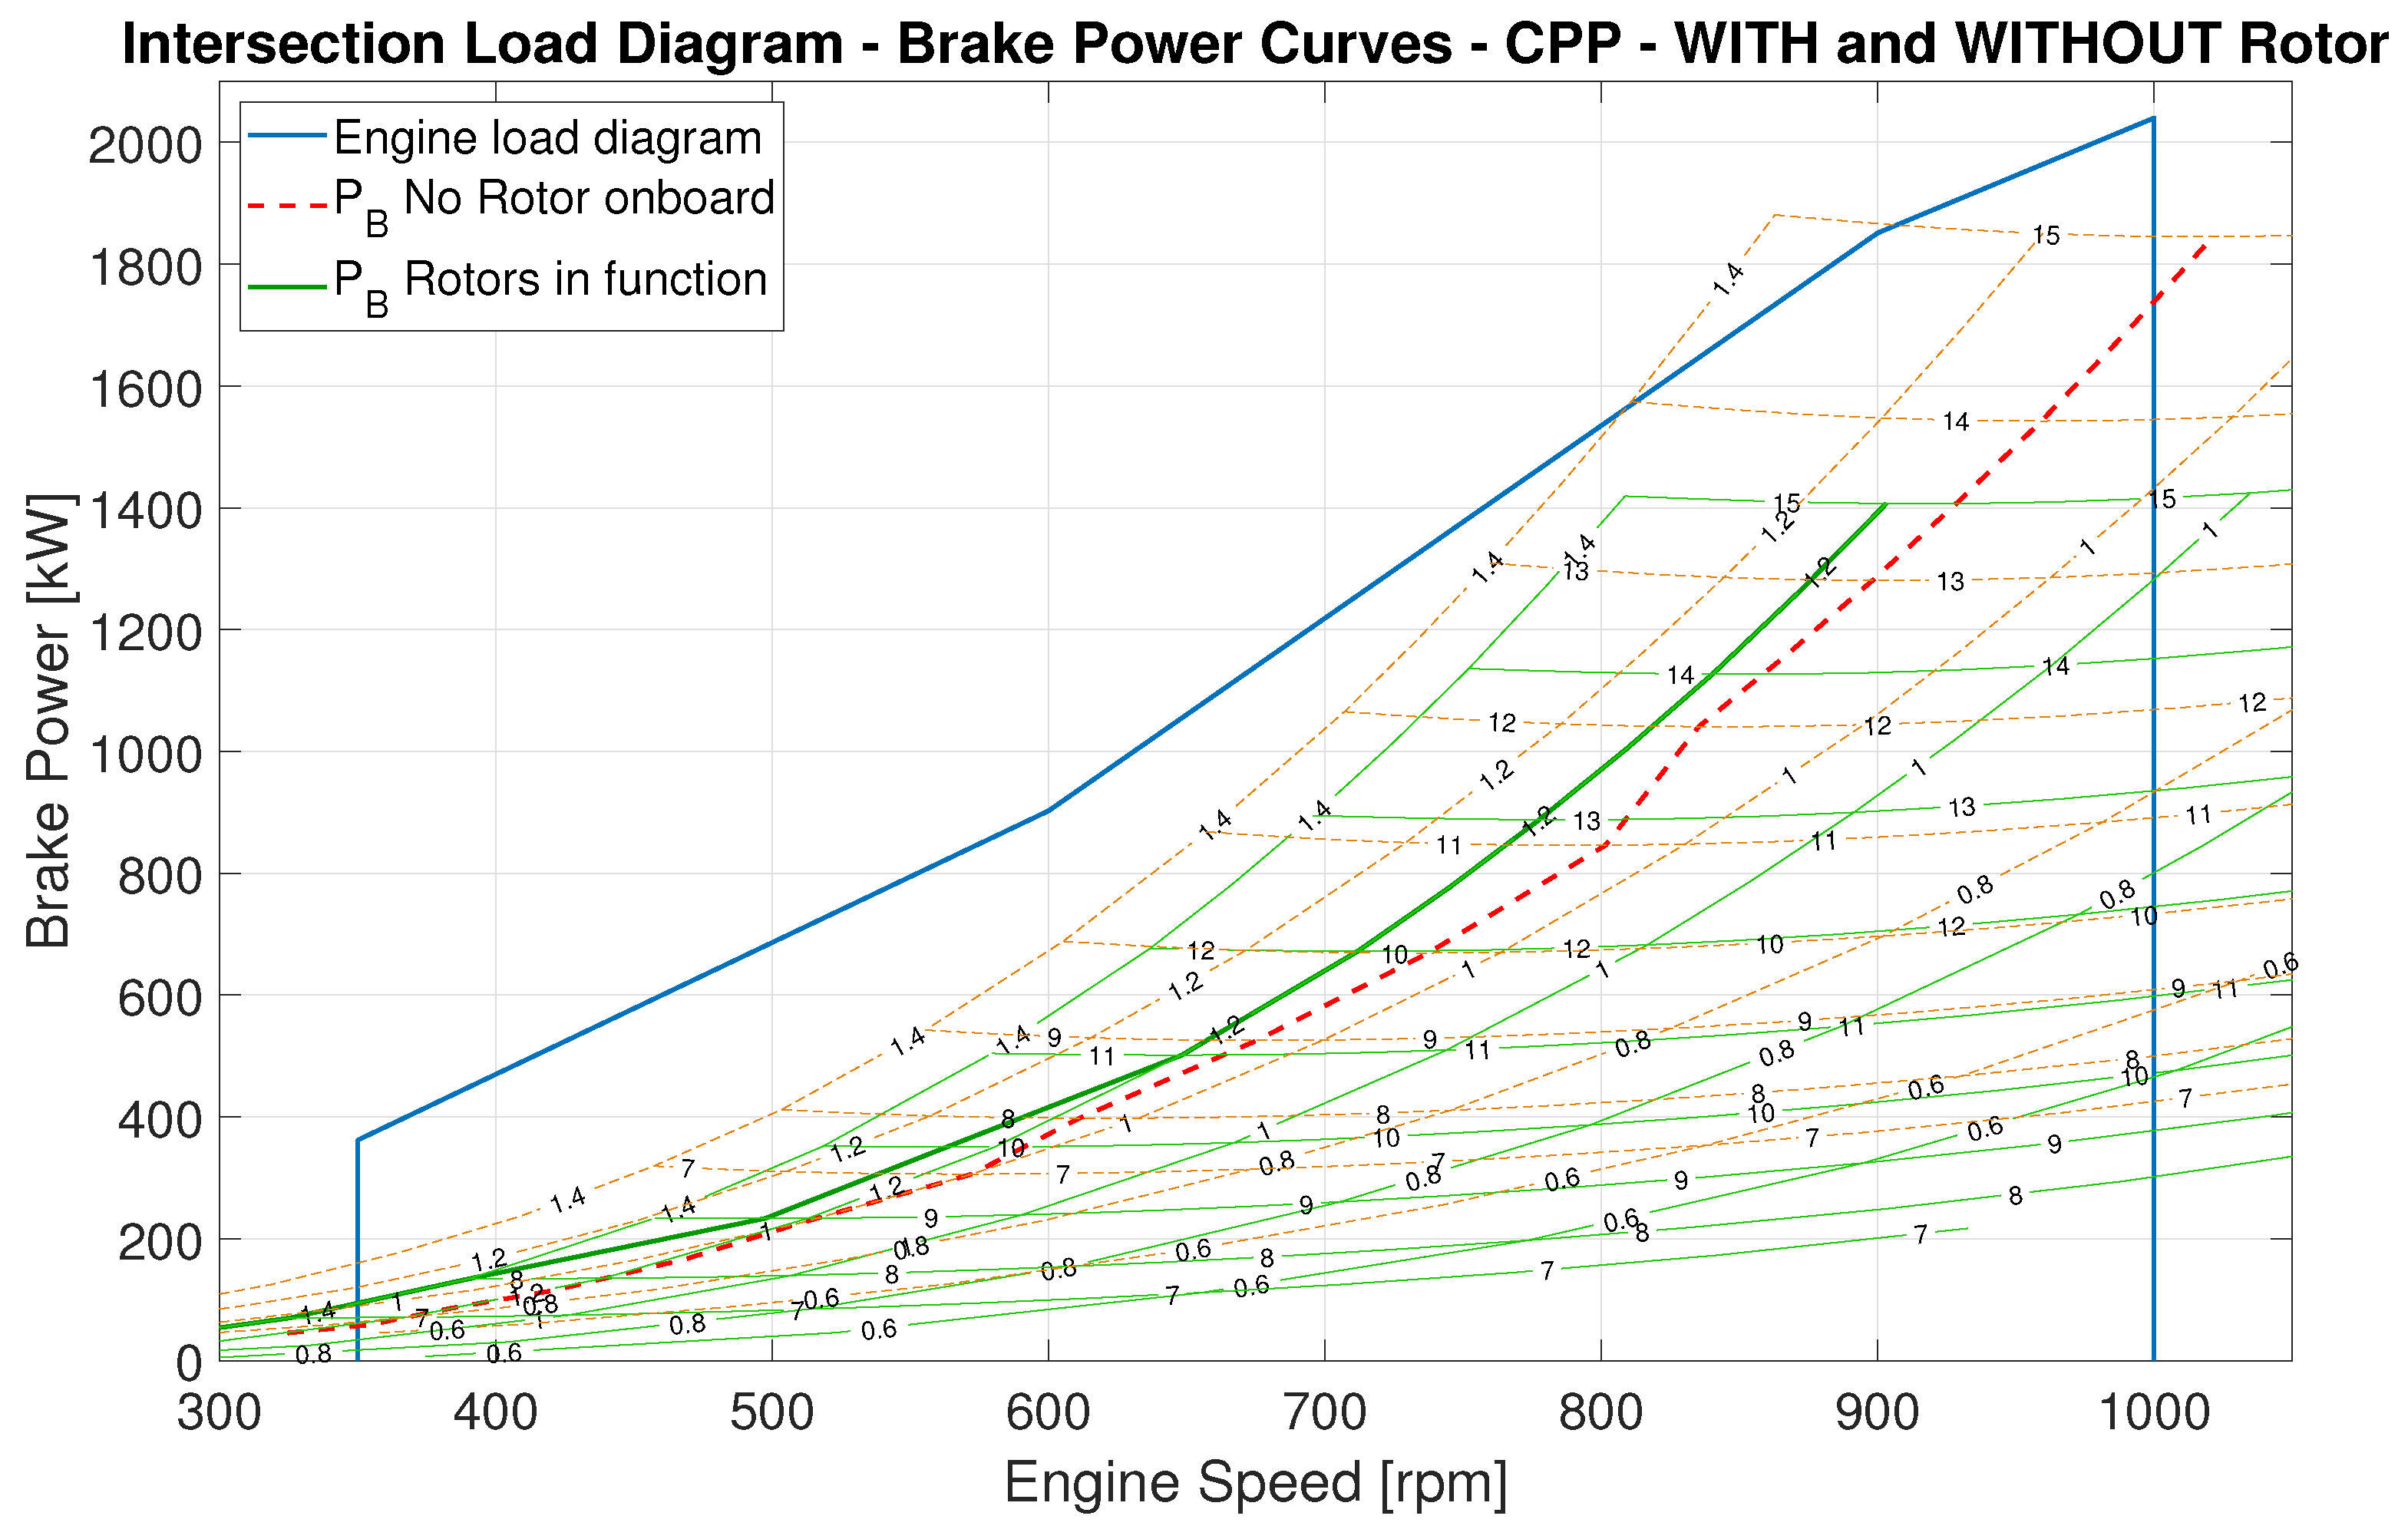
In Figure 7, the superimposition of the selected engine load diagram (blue line) with the brake power required by the CPP propeller in the two main scenarios (rotors in green and without rotors in red) is shown. The true wind is kept constant at 30 knots from 100°, and the rotor spin ratio is 3.
In Figure 7, the engine speed (rpm) is presented on the x-axis and the engine brake power (kW) on the y-axis. This graph is obtained by computing Equations (7) and (8) for all the ship speeds and propeller P/D; it shows the CPP working points in two cases: when the rotors are in use (green solid lines) and when there is no rotor installed onboard (red dashed lines). The quasi-horizontal lines represent the power at constant ship speed; each sub-vertical line represents PB at constant P/D and increasing ship speed.
As shown in the figure, in the presented case, the selected engine is matched to the propeller without rotors (80% MCR Power, 95% MCR revolutions @14 knots); however, a detailed analysis of the expected wind profile could be used to select a derated engine, with positive outcomes in terms of CAPEX.
From all the above information, it is possible to identify the minimum power required for achieving each ship’s speed. Eventually, the fuel consumption for each speed can be computed, and the savings gained by installing rotors, represented by KPI2, can be quantified. The two bolder lines (one solid in green for the rotors in use and one dashed in red for the no rotors condition) represent, for each ship speed, the optimum P/D setting for the CPP (i.e., the P/D corresponding to the minimum fuel consumption).
In Figure 8, the values of KPI2 are represented for a true wind of 15 knots. Each point of the line corresponds to a specific set (, n, , ). The figure highlights the significant gains in fuel consumption that could be achieved by selecting the proper P/D (i.e., ) in the different scenarios.
In Table 6, the KPI2 values for the case study are reported in tabular format, for a wind speed of 30 knots. Due to the stronger wind, the achievable gains are even better than those reported in Figure 8.
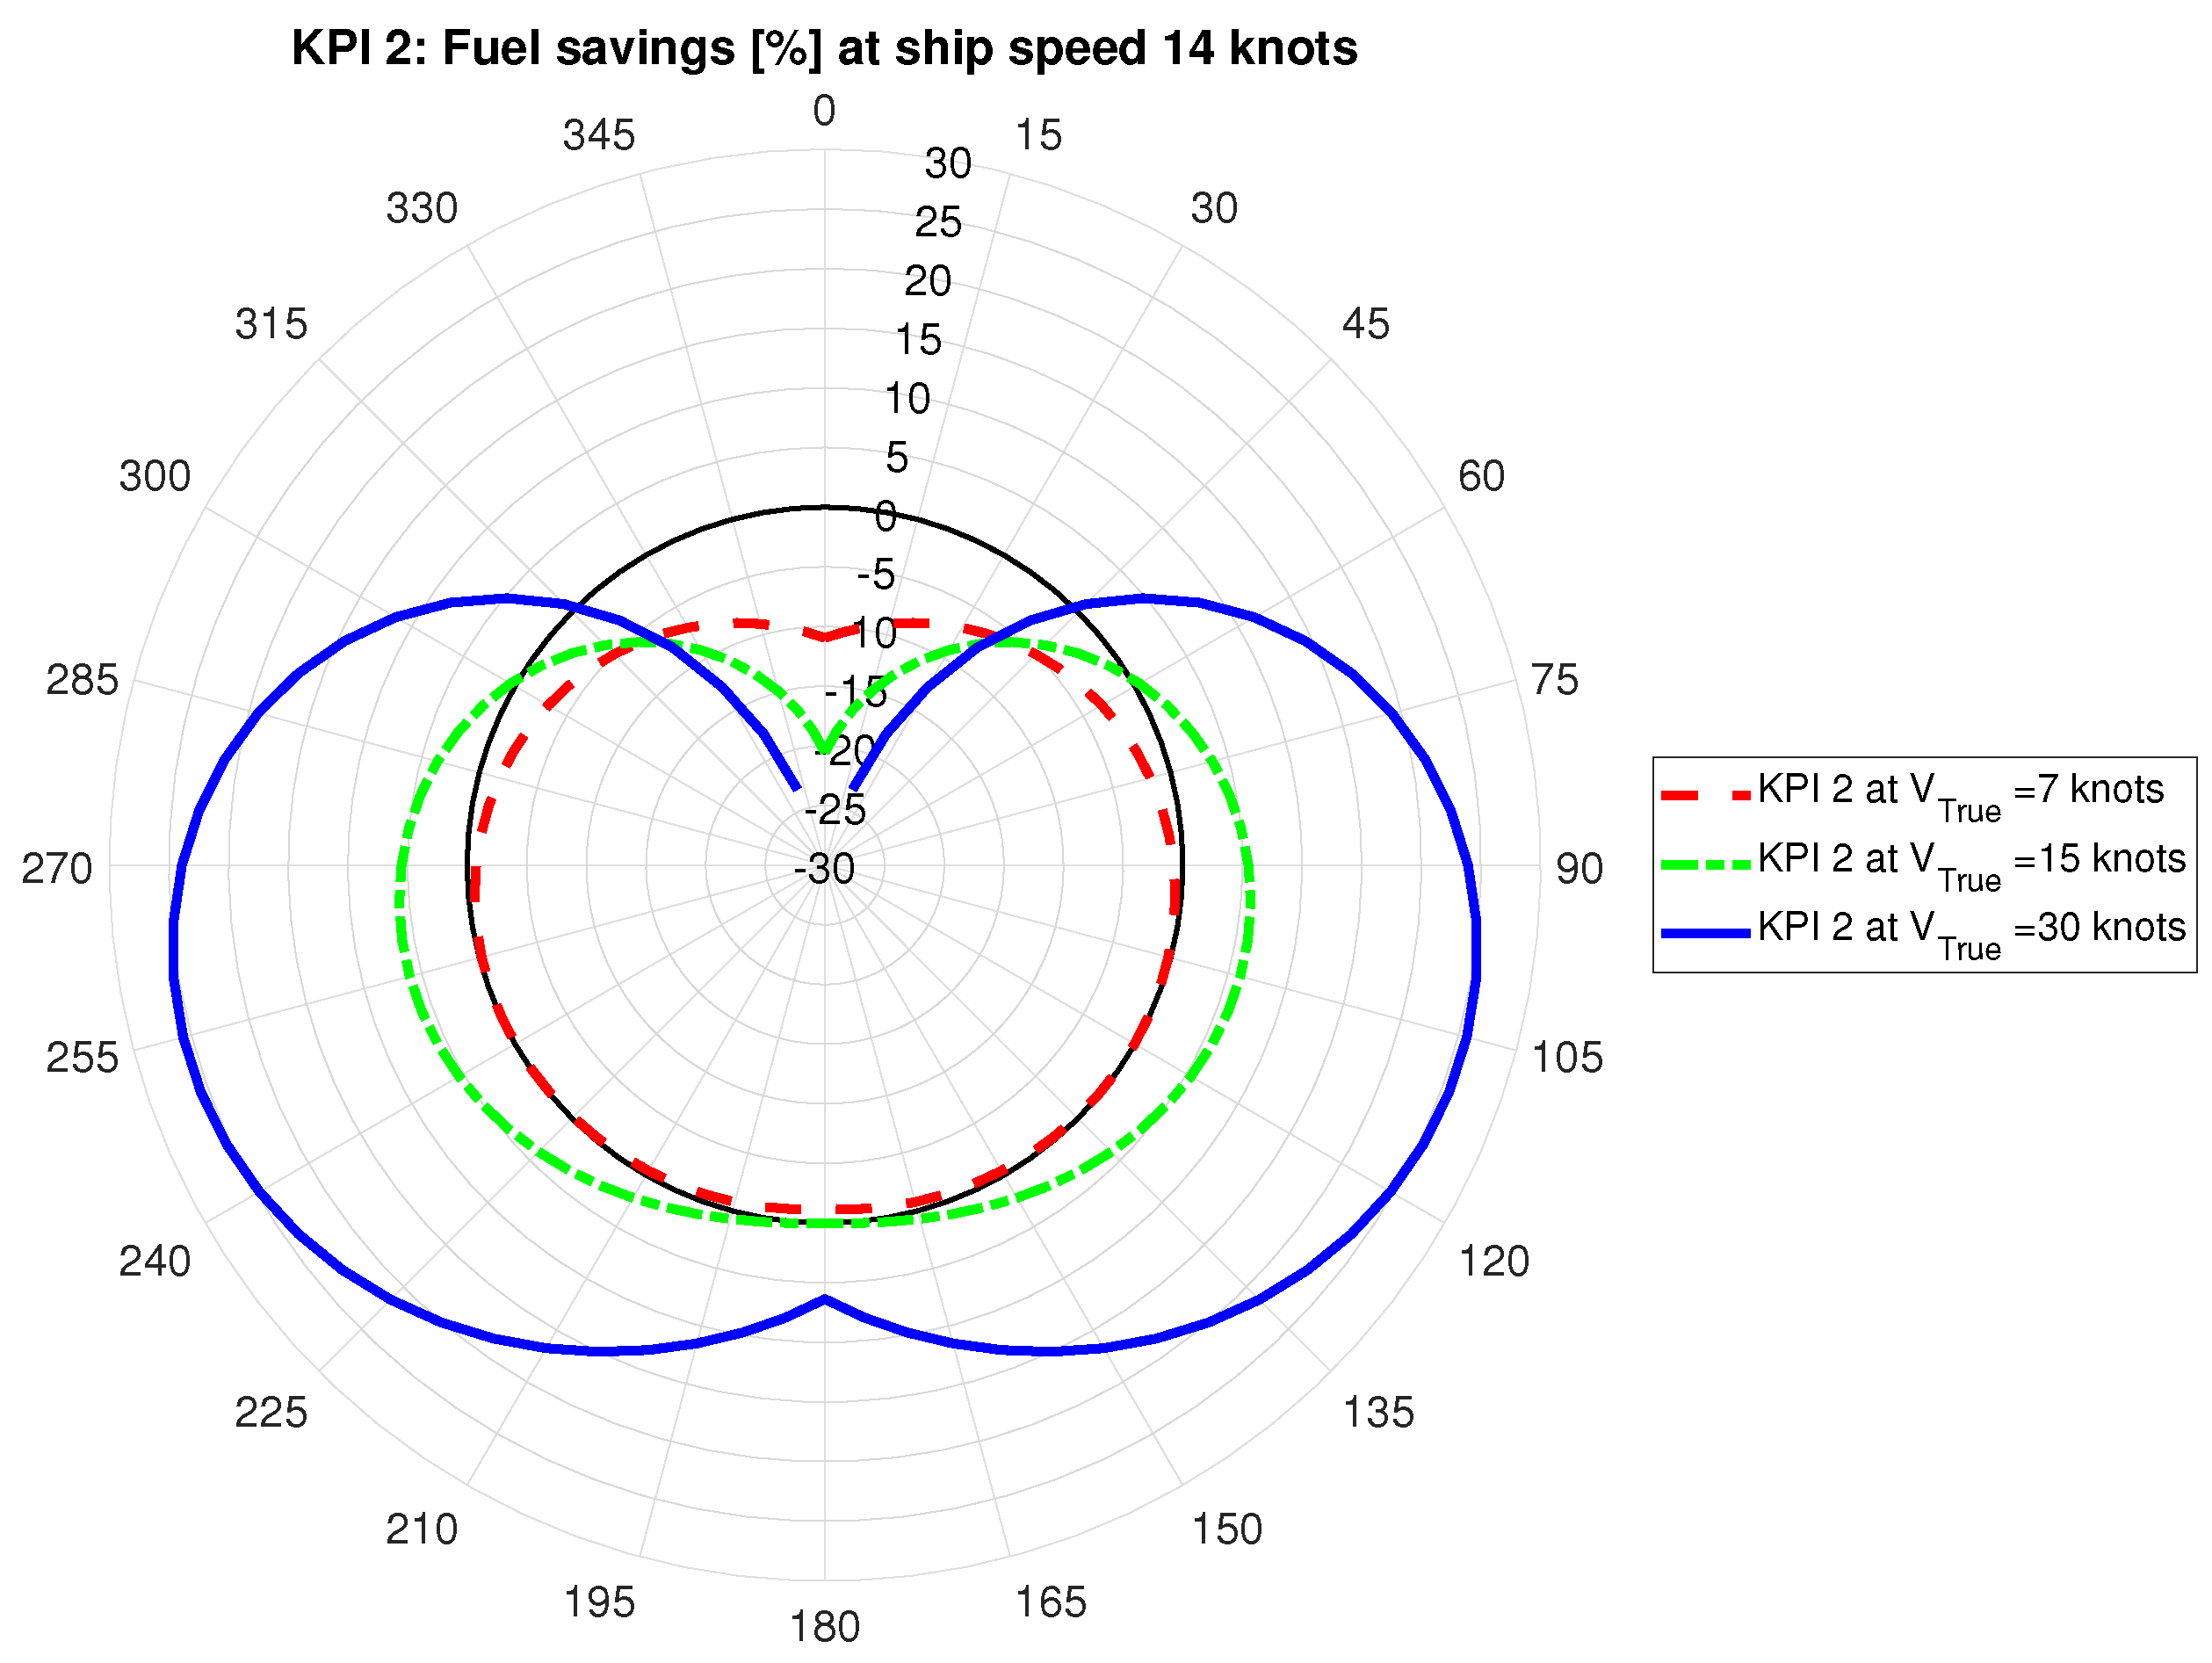
To present the variability of KPI2 with wind speed and direction, Figure 9 is reported. Ship speed is kept constant at 14 knots (design speed), while a number of three true wind speeds (namely: 7, 15, 30 kn) have been considered. Positive KPI2 in the range from 0% to +30% represents a fuel savings, while negative KPI2 in the range from 0% to −30% represents a fuel increase. In analogy with KPI1, stronger winds accentuate the benefits of using rotors, while headwinds are detrimental to fuel consumption. The results showed that positive effects on fuel consumption can be achieved only for wind speeds greater than 7 knots. For side winds, a fuel savings of up to 25% is possible with a wind speed of 30 knots.
Table 7 shows values of optimum P/D for each ship speed and three wind speeds with and without rotors; the optimum value can be different in the two conditions, and it varies with ship speed and wind speed, thus the importance of using a CPP. To highlight this concept, in Table 8, the total values for the ship of power (), fuel consumption () and emissions () at 14 knots are reported for a fixed wind condition of 30 kn from 100° for 5 FPP of various P/D and the CPP with the optimum values that guarantee the minimum fuel consumption. It can be noted that with a P/D = 0.8, the ship speed at 14 knots cannot be achieved both with or without rotors (observable also in Figure 7). The use of rotors allows for a higher value of P/D (i.e., P/D = 1) to be considered due to the reduction in power required.
3.5. Comparison of Fuel Consumption Reduction Results with Other Studies
As said, KPI2 represents achievable fuel consumption reduction due to the use of rotors. All described results highlight that KPI2 is significantly influenced by ship speed, wind speed and wind direction. In this paper, the results are presented for each specific condition, while in previous studies, the estimations were made for a typical voyage or for a specific operational profile. As a consequence, a direct comparison could be meaningful. However, if we assume for the case study a typical speed of 14 knots and the average wind with a median value of 15 knots from 90°, the value of the mean KPI2 is around 6%.
This result can be compared to some values reported in the literature; firstly, ref. [11] reports a list of measured fuel saving values in the range 1–50%, totally comparable to the ones reported in this paper; then, the value of 6% is very similar to the 9% result of [16], and the return on investment ranging between 7 and 12 years stated by [18] for a ship operating at 14 knots in calm and closed seas seems reasonable.
A more pessimistic result is reported by [17] (below 1%), while some better results can be found in studies of ships subjected to stronger oceanic winds, such as in [13], which reports up to 22% savings of annual ship fuel consumption with a pay-back time of six years, and in [14,15], with similar results of 20% savings.
4. Conclusions
A numerical model able to evaluate the ship’s propulsive power and fuel consumption due to the use of a Flettner rotor as an auxiliary wind propulsion device has been proposed and discussed. The model is based on the consolidated engine–propeller matching procedure, modified to accommodate the rotor effects.
In the design stage, this tool can be used to select the proper combination of the rotor, propeller and main engine to be installed onboard, assuming wind conditions. In operation, on the contrary, it can be used to set the propulsion plant parameters (SR and P/D) and eventually to select the best wind scenario using a weather routing optimization process.
The procedure has been applied to the case study representing a small Ro-Ro/Pax ferry similar to those operated in the Mediterranean Sea. The influences of rotor dimensions, ship speed, propeller characteristics, and wind conditions have been investigated. Two KPIs have been introduced to quantify the benefits with respect to power and to fuel consumption.
The sensitivity analysis showed, as expected, the relevant influence of wind conditions in achieving a tangible benefit, a parameter heavily dependent on the vessel’s intended operational area. From the ship design perspective, the paper showed the importance of the proper selection of the propeller and in particular on the controllable pitch propellers. The possibility of computing the best P/D setting for each operational scenario greatly increases the chance of having significant gains from this technology.
The case study in the Mediterranean conditions with moderate winds showed that gains due to WASP, at ship design conditions, would lie in the range from 5% to 10% for the power savings and from 4% to 6% for fuel consumption. If lower operational speeds would be accepted (i.e., 10–12 knots), the combination of rotors and CPP could reduce fuel consumption up to 15%.
Author Contributions
Conceptualisation, V.V. and M.F.; methodology, V.V. and M.F.; software, V.V.; investigation, V.V. and M.F.; writing—original draft preparation, V.V. and M.F.; writing—review and editing, V.V. and M.F.; visualization, V.V. All authors have read and agreed to the published version of the manuscript.
Funding
This research received no external funding.
Data Availability Statement
Case study data and software are available in the public repository of the University of Genoa [24].
Acknowledgments
The authors wish to thank Tonio Sant (the University of Malta, Faculty of Engineering) for his valuable hints.
Conflicts of Interest
The authors declare no conflict of interest.
Abbreviations
The following abbreviations are used in this manuscript.
| B | Ship’s Beam |
| CAPEX | CAPital EXpenditure |
| CII | Carbon Intensity Index |
| CO2 | Carbon Dioxide |
| CPP | Controllable Pitch Propeller |
| d | Flettner Rotor Diameter |
| EEOI | Energy Efficiency Operational Index |
| EEXI | Energy Efficiency Index for Existing Ships |
| DWT | Deadweight Tonnage |
| FPP | Fixed Pitch Propeller |
| GHG | Greenhouse Gases |
| Hrotor | Flettner Rotor High |
| IMO | International Maritime Organisation |
| J | Propeller Advance Coefficient |
| Kn | Knot |
| KPI | Key Performance Indicator |
| KT, KQ | Propeller Thrust and Torque Coefficients |
| LOA | Ship’s Length OverAll |
| MARPOL | International Convention on Marine Pollution |
| MCR | Engine Maximum Continuous Rating |
| MEPC | Marine Environment Protection Committee |
| PB | Brake Power (Engine or Propeller) |
| P/D | Pitch/Diameter Ratio of a Propeller |
| rpm | Revolution per Minute |
| SFOC | Specific Fuel Oil Consumption |
| SR | Flettener rotor spin ratio |
| UN | United Nations |
| Vcruise | Ship cruising speed |
| WASP | Wind Assisted Ship Propulsion |
References
- IMO. Further Shipping GHG Emission Reduction Measures Adopted; Press Release 2021-06-17. Available online: https://www.imo.org/en/MediaCentre/PressBriefings/pages/MEPC76.aspx (accessed on 4 May 2023).
- Seifert, J. A review of the Magnus effect in aeronautics. Prog. Aerosp. Sci. 2012, 55, 17–45. [Google Scholar] [CrossRef]
- Abramowicz-Gerigk, T.; Burciu, Z. Investigations of Hydrodynamic Force Generated on the Rotating Cylinder Implemented as a Bow Rudder on a Large-Scale Ship Model. Sensors 2022, 22, 9137. [Google Scholar] [CrossRef] [PubMed]
- Abramowicz-Gerigk, T.; Burciu, Z.; Jachowski, J.; Kreft, O.; Majewski, D.; Stachurska, B.; Sulisz, W.; Szmytkiewicz, P. Experimental Method for the Measurements and Numerical Investigations of Force Generated on the Rotating Cylinder under Water Flow. Sensors 2021, 21, 2216. [Google Scholar] [CrossRef] [PubMed]
- Lin, J.; Guo, C.; Zhao, D.; Han, Y.; Su, Y. Hydrodynamic simulation for evaluating Magnus anti-rolling devices with varying angles of attack. Ocean Eng. 2022, 260, 111949. [Google Scholar] [CrossRef]
- DeMarco, A.; Mancini, S.; Pensa, C.; Calise, G.; DeLuca, F. Flettner rotor concept for marine applications: A systematic study. Int. J. Rotating Mach. 2016, 2016, 3458750. [Google Scholar] [CrossRef]
- Bordogna, G.; Muggiasca, S.; Giappino, S.; Belloli, M.; Keuning, J.A.; Huijsmans, R.H.; van ‘t Veer, A.P. Experiments on a Flettner rotor at critical and supercritical Reynolds numbers. J. Wind. Eng. Ind. Aerodyn. 2019, 188, 19–29. [Google Scholar] [CrossRef]
- Lele, A.; Rao, K.V. Net power generated by flettner rotor for different values of wind speed and ship speed. In Proceedings of the 2017 International Conference on Circuit, Power and Computing Technologies (ICCPCT), Kollam, India, 20–21 April 2017. [Google Scholar] [CrossRef]
- Vasilescu, M.V.; Voicu, I.; Panait, C.; Ciucur, V.V. Influence of four modern Flettner rotors, used as wind energy capturing system, on container ship stability. E3S Web Conf. 2020, 180, 02003. [Google Scholar] [CrossRef]
- Copuroglu, H.I.; Pesman, E. Analysis of Flettner Rotor ships in beam waves. Ocean Eng. 2018, 150, 352–362. [Google Scholar] [CrossRef]
- Chou, T.; Kosmas, V.; Acciaro, M.; Renken, K. A Comeback of Wind Power in Shipping: An Economic and Operational Review on the Wind-Assisted Ship Propulsion Technology. Sustainability 2021, 13, 1880. [Google Scholar] [CrossRef]
- Hanell, E. Stena Bulk Is Presenting a Prototype of the Next-Generation Product and Chemical Tanker. 2020. Press Release 2020-06-10. Available online: www.stenabulk.com (accessed on 4 May 2023).
- Seddiek, I.S.; Ammar, N.R. Harnessing wind energy on merchant ships: Case study Flettner rotors onboard bulk carriers. Environ. Sci. Pollut. Res. 2021, 28, 32695–32707. [Google Scholar] [CrossRef]
- Talluri, L.; Nalianda, D.K.; Giuliani, E. Techno economic and environmental assessment of Flettner rotors for marine propulsion. Ocean Eng. 2018, 154, 1–15. [Google Scholar] [CrossRef]
- Traut, M.; Gilbert, P.; Walsh, C.; Bows, A.; Filippone, A.; Stansby, P.; Wood, R. Propulsive power contribution of a kite and a Flettner rotor on selected shipping routes. Appl. Energy 2014, 113, 362–372. [Google Scholar] [CrossRef]
- Lu, R.; Ringsberg, J.W. Ship energy performance study of three wind-assisted ship propulsion technologies including a parametric study of the Flettner rotor technology. Ships Offshore Struct. 2020, 15, 249–258. [Google Scholar] [CrossRef]
- Santoso, A.; Zaman, M.B.; Prawira, A.Y. Techno-economic Analysis of Rotor Flettner in Container Ship 4000DWT. Int. J. Mar. Eng. Innov. Res. 2017, 1, 189–195. [Google Scholar] [CrossRef]
- Angelini, G.; Muggiasca, S.; Belloli, M. A Techno-Economic Analysis of a Cargo Ship Using Flettner Rotors. J. Mar. Sci. Eng. 2023, 11, 229. [Google Scholar] [CrossRef]
- Viola, I.; Sacher, M.; Xu, J.; Wang, F. A numerical method for the design of ships with wind-assisted propulsion. Ocean Eng. 2015, 105, 33–42. [Google Scholar] [CrossRef]
- Cairns, J.; Vezza, M.; Green, R.; MacVicar, D. Numerical optimisation of a ship wind-assisted propulsion system using blowing and suction over a range of wind conditions. Ocean Eng. 2021, 240, 109903. [Google Scholar] [CrossRef]
- Formosa, W.; Sant, T.; Muscat-Fenech, C.D.; Figari, M. Wind-Assisted Ship Propulsion of a Series 60 Ship Using a Static Kite Sail. J. Mar. Sci. Eng. 2022, 11, 117. [Google Scholar] [CrossRef]
- Vigna, V.; Coraddu, A.; Figari, M. Parametric study of the influence of the wind-assisted propulsion on ships. In Proceedings of the 3rd International Conference on Modelling and Optimisation of Ship Energy Systems, MOSES2021, Online, 19–21 May 2021; Available online: https://aaltodoc.aalto.fi/handle/123456789/110481 (accessed on 4 May 2023).
- Vigna, V.; Figari, M. Wind-Assisted Ship Propulsion Feasibility Study. In Proceedings of the Technology and Science for the Ship of the Future—NAV2022, Genoa and La Spezia, Italy, 15–17 June 2022. [Google Scholar] [CrossRef]
- Vigna, V.; Figari, M. Matching Flettner Rotors with Diesel Engines and Controllable Pitch Propellers. Case Study Software. IRIS UniGe Repository. 2023. Available online: https://hdl.handle.net/11567/1115136 (accessed on 4 May 2023).
- Fossen, T.I. Handbook of Marine Craft Hydrodynamics and Motion Control; John Wiley & Sons Inc: Hoboken, NJ, USA, 2011. [Google Scholar] [CrossRef]
- Brix, J.E. Manoeuvering Technical Manual; Seehafen Verlag GmbH: Hamburg, Germany, 1993; pp. 147, 243. [Google Scholar]
- Kume, K.; Hamada, T.; Kobayashi, H.; Yamanaka, S. Evaluation of aerodynamic characteristics of a ship with Flettner rotors by wind tunnel tests and RANS-based CFD. Ocean Eng. 2022, 254, 111345. [Google Scholar] [CrossRef]
- Blevins, R.D. Applied Fluid Dynamics Handbook; Van Nostrand Reinhold Company: New York, NY, USA, 1984; p. 334. [Google Scholar]
- Stapersma, D.; Woud, J.K. Matching propulsion engine with propulsor. J. Mar. Eng. Technol. 2005, 4, 25–32. [Google Scholar] [CrossRef]
- Kytariolou, A.; Themelis, N. Ship routing optimisation based on forecasted weather data and considering safety criteria. J. Navig. 2023, 1–22. [Google Scholar] [CrossRef]
- Martelli, M.; Figari, M. Real-Time model-based design for CODLAG propulsion control strategies. Ocean Eng. 2017, 141, 265–276. [Google Scholar] [CrossRef]
- Piaggio, B.; Viviani, M.; Martelli, M.; Figari, M. Z-Drive Escort Tug manoeuvrability model and simulation. Ocean Eng. 2019, 191, 106461. [Google Scholar] [CrossRef]
- Piaggio, B.; Viviani, M.; Martelli, M.; Figari, M. Z-Drive Escort Tug manoeuvrability model and simulation, Part II: A full scale validation. Ocean Eng. 2022, 259, 111881. [Google Scholar] [CrossRef]
- Altosole, M.; Figari, M.; Piastra, F. Numerical modelling of high-speed diesel engines for small craft energy efficiency prediction. In Proceedings of the HSMV 2014—10th Symposium on High Speed Marine Vehicles, Naples, Italy, 15–17 October 2014. [Google Scholar]
- Figari, M.; Soares, C.G. Fuel consumption and exhaust emissions reduction by dynamic propeller pitch control. In Proceedings of the MARSTRUCT 2009, 2nd International Conference on Marine Structures-Analysis and Design of Marine Structures, Lisbon, Portugal, 16–18 March 2009. [Google Scholar]
- Coraddu, A.; Figari, M.; Savio, S.; Villa, D.; Orlandi, A. Integration of seakeeping and powering computational techniques with meteo-marine forecasting data for in-service ship energy assessment. In Developments in Maritime Transportation and Exploitation of Sea Resources: Proceedings of IMAM 2013, 15th International Congress of the International Maritime Association of the Mediterranean, A Coruna, Spain, 14–17 October 2013; Taylor & Francis Group: London, UK, 2014. [Google Scholar]
- IMO. Guidelines and Relevant Information under MARPOL Annex VI; Note: Guideline 2014 MEPC 866, 30/01/17; IMO: London, UK, 2017; pp. 136–137. [Google Scholar]
- Zaccone, R.; Figari, M. Energy efficient ship voyage planning by 3D dynamic programming. J. Ocean. Technol. 2017, 12, 49–71. [Google Scholar]
- Zaccone, R.; Ottaviani, E.; Figari, M.; Altosole, M. Ship voyage optimization for safe and energy-efficient navigation: A dynamic programming approach. Ocean Eng. 2018, 153, 215–224. [Google Scholar] [CrossRef]
- Oosterveld, M.; van Oossanen, P. Further computer-analysed data of the Wageningen B-screw series. Int. Shipbuild. Prog. 1975, 22, 251–262. [Google Scholar] [CrossRef]
Figure 1.
Wind-assisted ship propulsion modelling flow chart.

Figure 2.
Rotor forces.

Figure 3.
Influence on rotor thrust–ship resistance ratio of the rotor’s geometric dimensions and true wind speed. (a) Influence of rotor’s geometric dimensions on for SR = 3 and wind 15 m/s. (b) Influence of true wind speed on .
Figure 3.
Influence on rotor thrust–ship resistance ratio of the rotor’s geometric dimensions and true wind speed. (a) Influence of rotor’s geometric dimensions on for SR = 3 and wind 15 m/s. (b) Influence of true wind speed on .

Figure 4.
Influence of true wind speed and direction on FR thrust.

Figure 5.
KPI1: power savings percentage due to the use of rotors.

Figure 6.
KPI1 for different ship speeds and = 15 kn from 100°, SR = 3.

Figure 7.
Engine–propellers matching.

Figure 8.
KPI2 for different ship speeds and = 15 kn from 100°, SR = 3.

Figure 9.
KPI2: fuel savings percentage due to the use of rotors.


Table 1.
Case study main characteristics.
| Ship | Engine | Propeller | |||
|---|---|---|---|---|---|
| LOA | B | Vcruise | Power | N | DCPP |
| 95 m | 18 m | 14 kn | 2 × 2.04 MW | 1000 rpm | 2.8 m |
Table 2.
Flettner rotor main characteristics.
| Flettner Rotor | |||
|---|---|---|---|
| Hrotor | drotor | Aspect Ratio (AR) | Spin Ratio (SR) |
| 12.5 m | 2.62 m | 4.76 | 3 |
Table 3.
KPI1 (%) at different ship speeds.
| = | 15 kn | 14 kn | 12 kn | 10 kn | 6 kn | 4 kn |
|---|---|---|---|---|---|---|
| = 7 kn | −1.02 | −0.72 | 0.03 | 1.10 | 6.01 | 14.25 |
| = 15 kn | 4.40 | 5.24 | 7.52 | 11.04 | 27.85 | 49.52 |
| = 30 kn | 21.04 | 23.80 | 30.98 | 40.94 | 71.71 | 75.00 |
Table 4.
KPI1 (%) for different values of rotors’ spin ratio (SR).
| SR = 3 | SR = 2 | SR = 1 | |
|---|---|---|---|
| = 7 kn | −0.72 | 0.72 | 0.05 |
| = 15 kn | 5.24 | 4.95 | 1.76 |
| = 30 kn | 22.52 | 17.59 | 7.08 |
Table 5.
KPI1 (%) for CPP or at different values of P/D in case of FPP.
| CPP | FPP P/D = 0.8 | FPP P/D = 1.0 | FPP P/D = 1.1 | FPP P/D = 1.2 | FPP P/D = 1.3 | |
|---|---|---|---|---|---|---|
| = 7 kn | −0.72 | −0.67 | −0.71 | −0.72 | −0.73 | −0.73 |
| = 15 kn | 5.24 | 4.78 | 5.09 | 5.20 | 5.30 | 5.39 |
| = 30 kn | 22.52 | 20.85 | 22.02 | 22.44 | 22.81 | 23.14 |
Table 6.
KPI2 (%) and values of P/D, total consumption () and total power () for the ship at different ship speeds and constant = 30 kn from 100°.
Table 6.
KPI2 (%) and values of P/D, total consumption () and total power () for the ship at different ship speeds and constant = 30 kn from 100°.
| = | 15 kn | 14 kn | 12 kn | 10 kn | 8 kn | 6 kn | |
|---|---|---|---|---|---|---|---|
| KPI2 = | 24% | 27% | 35% | 48% | 66% | 88% | |
| Rotors in use | (kg/h) | 912 | 730 | 436 | 228 | 86 | 18 |
| P/D | 1.15 | 1.20 | 1.20 | 1.25 | 1.40 | 0.90 | |
| (kW) | 2820 | 2254 | 1340 | 700 | 260 | 60 | |
| No rotors | (kg/h) | 1196 | 1000 | 674 | 434 | 258 | 146 |
| P/D | 1.15 | 1.10 | 1.10 | 1.05 | 1.05 | 1.00 | |
| (kW) | 3700 | 3080 | 2080 | 1340 | 800 | 460 | |
Table 7.
Values of optimum P/D for each ship speed at constant from 100°.
| = | 15 kn | 14 kn | 12 kn | 10 kn | 8 kn | 6 kn | |
|---|---|---|---|---|---|---|---|
| Rotors in use | = 7 kn | 1.15 | 1.15 | 1.15 | 1.10 | 1.10 | 1.10 |
| = 15 kn | 1.15 | 1.15 | 1.15 | 1.15 | 1.15 | 1.15 | |
| = 30 kn | 1.15 | 1.20 | 1.20 | 1.25 | 1.40 | 0.90 | |
| No rotors | = 7 kn | 1.15 | 1.15 | 1.15 | 1.15 | 1.10 | 1.10 |
| = 15 kn | 1.15 | 1.15 | 1.10 | 1.10 | 1.10 | 1.05 | |
| = 30 kn | 1.15 | 1.10 | 1.10 | 1.05 | 1.05 | 1.00 | |
Table 8.
Values of total emissions, fuel consumption () and power () for CPP or FPP at different P/D and constant = 14 kn and = 30 kn from 100°.
Table 8.
Values of total emissions, fuel consumption () and power () for CPP or FPP at different P/D and constant = 14 kn and = 30 kn from 100°.
| CPP | FPP | FPP | FPP | FPP | FPP | ||
|---|---|---|---|---|---|---|---|
| = 1.2, = 1.1 | P/D = 0.8 | P/D = 1 | P/D = 1.1 | P/D = 1.2 | P/D = 1.3 | ||
| Rotors in use | (Kw) | 2254 | - | 2280 | 2260 | 2254 | 2260 |
| (kg/h) | 730 | - | 740 | 732 | 730 | 732 | |
| (kg/h) | 2270 | - | 2300 | 2276 | 2270 | 2276 | |
| No rotors | (Kw) | 3080 | - | - | 3080 | 3100 | 3120 |
| (kg/h) | 1000 | - | - | 1000 | 1002 | 1010 | |
| (kg/h) | 3110 | - | - | 3110 | 3116 | 3140 |
Disclaimer/Publisher’s Note: The statements, opinions and data contained in all publications are solely those of the individual author(s) and contributor(s) and not of MDPI and/or the editor(s). MDPI and/or the editor(s) disclaim responsibility for any injury to people or property resulting from any ideas, methods, instructions or products referred to in the content. |
© 2023 by the authors. Licensee MDPI, Basel, Switzerland. This article is an open access article distributed under the terms and conditions of the Creative Commons Attribution (CC BY) license (https://creativecommons.org/licenses/by/4.0/).
Share and Cite
MDPI and ACS Style
Vigna, V.; Figari, M. Wind-Assisted Ship Propulsion: Matching Flettner Rotors with Diesel Engines and Controllable Pitch Propellers. J. Mar. Sci. Eng. 2023, 11, 1072. https://doi.org/10.3390/jmse11051072
AMA Style
Vigna V, Figari M. Wind-Assisted Ship Propulsion: Matching Flettner Rotors with Diesel Engines and Controllable Pitch Propellers. Journal of Marine Science and Engineering. 2023; 11(5):1072. https://doi.org/10.3390/jmse11051072
Chicago/Turabian StyleVigna, Veronica, and Massimo Figari. 2023. "Wind-Assisted Ship Propulsion: Matching Flettner Rotors with Diesel Engines and Controllable Pitch Propellers" Journal of Marine Science and Engineering 11, no. 5: 1072. https://doi.org/10.3390/jmse11051072
Note that from the first issue of 2016, this journal uses article numbers instead of page numbers. See further details here.