
Study of the Formation of Hydrates with NaCl, Methanol Additive, and Quartz Sand Particles


1
School of Petroleum Engineering, China University of Petroleum (East China), Qingdao 266580, China
2
Key Laboratory of Unconventional Oil & Gas Development, Ministry of Education, Qingdao 266580, China
3
National Engineering Research Center for Oil & Gas Drilling and Completion Technology, Qingdao 266580, China
4
Ulsan Ship and Ocean College, Ludong University, Yantai 264000, China
*
Author to whom correspondence should be addressed.
J. Mar. Sci. Eng. 2024, 12(3), 364; https://doi.org/10.3390/jmse12030364
Submission received: 14 January 2024
/
Revised: 18 February 2024
/
Accepted: 19 February 2024
/
Published: 21 February 2024
(This article belongs to the Special Issue Marine Gas Hydrates: Formation, Storage, Exploration and Exploitation)
Abstract
:During deepwater drilling, testing, production, or hydrate mining, the circulating medium in the wellbore may contain solid particles, such as rock chips and sand, in addition to drilling fluids, gas, and water. In the high-pressure, low-temperature conditions of deep water, gas intrusion can easily combine with free water in the drilling fluid to form hydrates, increasing the drilling risk. Therefore, understanding the formation patterns of hydrates in drilling fluids is of significant importance for the prevention and control of hydrates. This study utilized a small-scale high-pressure reactor to investigate the impact of the stirring rate, NaCl, and methanol additives, as well as the sand content on the hydrate formation process and gas consumption. The results indicate that the hydrate formation process can be divided into an induction stage, a rapid formation stage, and a slow formation stage. The induction stage and rapid formation stage durations are significantly reduced under stirring conditions. In NaCl and methanol solutions, hydrate formation is inhibited, with the induction stage duration increasing with higher concentrations of NaCl and methanol. There was no apparent rapid formation stage observed. The final gas consumption decreases substantially with increasing concentrations of NaCl and methanol, reaching no significant hydrate formation at a 20% concentration. The sand content has a significant impact on the slow formation stage, with the final gas consumption increasing within a certain range (in this work, at a sand content of 20%), and being notably higher than in the pure water system under the same conditions.
1. Introduction
In the past few years, as the exploration and development of onshore oil and gas re-sources have gradually reached saturation, countries worldwide have significantly accelerated the pace of offshore oil and gas development. The oceans have become a strategic successor zone for global oil and gas resources [1,2]. Marine oil and gas resources are also abundant, particularly within the South China Sea. The estimated geological reserves of natural gas in the South China Sea region are approximately 1.6 × 10¹³ m3, constituting one-third of China’s total oil and gas resources [3,4,5]. Unlike traditional onshore drilling, offshore drilling, especially in deep water, involves additional technical considerations [6]. These include factors such as the characteristics of the seabed rocks, the flow properties of the deepwater drilling fluids, and the quantity of the drilling fluids used. Moreover, in deepwater drilling, the seabed pressure is high, and the seawater temperature is low [7]. If shallow gas or hydrate-bearing layers are encountered during drilling, the decomposed gases from the formation or hydrate layers may enter the wellbore or annulus, easily forming hydrates in combination with free water in the drilling fluid. The presence and formation of hydrates can lead to various issues at the wellhead, including the cooling and freezing of connectors, the blockage of well control and choke lines, the disruption of the normal operation of preventers, or the blockage of the casing, preventers, or annular casing, causing drill string sticking. The rapid decomposition of hydrates can also generate a significant amount of chemical gases, and the pressure generated may lead to casing failure. Hydrate generation and deposition may occur during gas well testing or commissioning, or hydrate test mining, resulting in a significant risk of hydrate flow barriers for deepwater gas well development or hydrate test mining [8,9,10].
Many scholars have conducted extensive research on hydrate formation under quiescent and agitated conditions. Ouar et al. [11] conducted tests at 8.83 MPa of pressure on 17 types of drilling fluids. The main components of the tested fluids included montmorillonite, diluent, salt, and others. The study found that salt and montmorillonite are the predominant factors influencing the phase equilibrium and formation of natural gas hydrates. Building upon this, Lai et al. [12] increased the pressure to 28.96 MPa and conducted experiments on 16 simulated drilling fluids. The results indicated that both salt and isopropanol could inhibit the formation of hydrates. Waite et al. [13] used a petrophysical model to distinguish the distribution of hydrates in sediment pores, and the modelling results showed that methane hydrates consolidate unconsolidated sediments when they form in systems dominated by the gas phase. Zhang et al. [14] used the slope of the gas flow rate over time to represent the driving force for hydrate formation. The results indicate that the driving force for each stage of hydrate formation is inversely proportional to the temperature, and the consumed gas volume is directly proportional to the temperature. Zhou et al. [15] investigated the impact of sand particles with a particle size of 100–500 nm on hydrate formation. The results indicate that hydrates initially form at the top of the reaction vessel and subsequently form in the lower part of the sediment. Filarsky et al. [16] investigated the influence of different types of stirrers, rotational speeds, and agitator geometries on hydrate formation. The results obtained contribute to the understanding of hydrate formation mechanisms and applications in gas hydrate production. Wang et al. [17] studied the influence of pressure, hydrate saturation (Sh), and residual water saturation (Sw) on hydrate formation. They found that when the Sw0 (initial residual water saturation) is higher than 0.4, capillary forces have a greater impact on water migration compared to when the Sw0 is lower than 0.4. Therefore, when the Sw0 is lower than 0.4, the Sh-max shows a positive correlation with the Sw0. Huang et al. [18] used a novel hydrate drilling experimental apparatus to investigate drilling experiments in consolidated sediments containing a Tetra-n-butyl ammonium bromide (TBAB) hydrate. The results indicate that drilling with a relatively high-temperature drilling fluid circulation in hydrate-bearing sediments can induce hydrate dissociation, and the rate of hydrate dissociation is significantly influenced by the circulation rate of the drilling fluid. Dong et al. [19] investigated the influence of pressure and the gas flow rate on hydrate decomposition. The results indicate that an increase in the gas flow rate has a positive effect on both the depressurization and hydrate decomposition rates. Under different flow rates, the hydrate decomposition rate shows a linear relationship with the corresponding depressurization rate. Yu et al. [20] investigated the process of methane (CH4) hydrate formation in the presence of cyclopentane (CP). The results suggest that in the presence of CP, the formation of CH4 hydrate occurs in two steps: the first step involves the formation of pure CP hydrate, and in the second step, gas enters the empty cages of pure CP hydrate, forming CP/CH4 mixed hydrate. Dubey et al. [21] investigated the impact of thermodynamic inhibitors (THIs) and kinetic inhibitors (KHIs) on the kinetics of complex hydrates of natural gas mixtures (CH4/C2H6/C3H8) and cyclopentane under high water content and high subcooling conditions (~21 °C). The results indicate that the hydrate plugging risk is higher with a low MEG (Monoethylene glycol) content (0.1 to 10 wt%), while gas absorption is significantly reduced in high MEG content experiments (20 to 25 wt%). Under the influence of KHIs, 0.1 wt% BGE (Butylglycol ether) and hexamethyleneimine promote the nucleation temperature and the rate of hydrate formation/gas absorption. Jiang et al. [22] investigated the effect of different additives on hydrate inhibition using an integrated gas-hydrate simulation system developed by Jiang et al. The experimental results showed that artificial seawater, 3% bentonite, 0.3% Na2CO3, 10% polyethylene glycol, 20% NaCl, and 0.5% NaOH performed well in shale swelling and gas hydrate inhibition. Taking a deepwater natural gas exploration well located in the Qiongdongnan Basin of the South China Sea as an example, Zhang et al. [23] proposed that in order to avoid hydrate risk during drilling and completion, the formulation of 17% NaCl + 2% MEG is recommended to be used as the drilling fluid during normal drilling, and during stopping drilling, the formulation of 20% NaCl + 10.71%–18.00% MEG is recommended to be used as the drilling fluid. The CaCl2/ KFo + MEG formulation is used in tests; the CaCl2/KFo (Potassium Formate) + MEG formulation is used in throttling open flow. In terms of the energy and environment, hydrates are usually endowed in permafrost or seafloor sediments in the form of sediments; therefore, the generation and decomposition process of hydrates in hydrate-bearing sediments have been investigated. Farahani et al. [24,25] investigated the evolution process of permafrost sediments in response to the ambient temperature, and proposed a conceptual pore-scale model to characterize the pore-scale distributions of phases in typical permafrost-bearing natural gas hydrates. The pore-scale distribution of the phases in the sediments and the kinetics and spatial characteristics of the thermally induced generation of methane hydrate in synthetic and natural sediments were investigated using nuclear magnetic resonance imaging (NMRI), and an innovative image analysis method was applied to infer the spatial distributions of methane hydrate, gas, and water in the pore space. Okwananke et al. [26] investigated the natural gas in natural gas hydrate-containing sediments under different differential pressure conditions by utilizing core grips and permeation characteristics. The experimental results showed that the capillary penetration, forced expansion or coalescence of hydrates, and the Klinenberg effect play important roles in controlling gas permeation in different pore sediments.
The hydrate prevention method commonly used in deepwater drilling is to add a large amount of a thermodynamic inhibitor to the drilling fluid so that the temperature and pressure conditions in the hydrate generation risk area in the wellbore avoid the temperature and pressure window for hydrate generation. However, adding excessive amounts of a hydrate inhibitor to the drilling fluid can lead to higher costs and affect the performance of the drilling fluid, so reducing the amount of the inhibitor used while ensuring safe drilling can reduce costs and achieve greater economic benefits. Hydrate generation in drilling fluids will block the flow channels and cause solid-phase precipitation or stuck drilling, and the study of the effect of sand particles on hydrate generation will help to analyze the rheological morphology and rock-carrying capacity of drilling fluids in the drilling process. While there have been many experimental studies on hydrate formation and decomposition under quiescent and agitated conditions, during the normal drilling or gathering process, the drilling fluid in the wellbore and the fluid in the mixing pipeline are in a state of flow. Therefore, further research is needed to investigate the hydrate formation and slurry flow characteristics under mobility conditions. In particular, the influence of sand and other solid particles on hydrate formation in the flowing state. The study of the effects of different perturbation intensities and different additives on hydrate generation is conducive to the selection of appropriate additive dosages in the hydrate control process. In this work, hydrate formation was analyzed under static and agitated conditions using a visualized small high-pressure reactor. The effects of the stirring rate, NaCl and methanol additive concentration on hydrate generation were studied in the sand-free system. The effect of the quartz sand content on the hydrate generation process was investigated in the sand-containing system.
2. Experimental and Data Processing
2.1. Apparatus and Materials
Figure 1 shows the small-scale visualized high-pressure reactor used for hydrate formation experiments. The main instruments and equipment used in the experiment, such as the reaction kettle and circulating water bath, were obtained from Jiangsu Nantong Xinhua Cheng Scientific Research Instrument Co. (Nantong, China). The apparatus comprises four parts: a gas supply unit, a reaction unit, a temperature–pressure control unit, and a data acquisition unit. The high-pressure visual reactor is constructed from stainless steel and has a maximum working pressure of 16 MPa. It has a volume of 500 mL and an upward stirring structure, with an adjustable rotational speed of 0–1500 r/min. This reactor can be used to simulate the static and flow of drilling fluids during shut-in and drilling, as well as the flow of hydrate-containing slurries in multiphase mixing pipelines and other various working conditions. Additionally, there are elliptical transparent toughened glass windows on the front and back of the reactor, each with dimensions of 65 mm × 15 mm. The water circulation device can operate at temperatures ranging from −20 °C to 50 °C. The temperature inside the reactor is usually 1–2 °C higher than the water bath temperature due to the heat generation from stirring, heat conduction, and environmental temperature influences. In order to confirm that the error is due to the temperature sensor, a number of tests were carried out, and the results show that the temperature in the reactor is always 1–2 °C higher than the setting temperature of the circulating water bath, and this temperature difference will make the supercooling degree of the hydrate generation process decrease, i.e., the driving force of hydrate generation will be smaller, and thus will slow down the generation of the hydrate to a certain extent, but the temperature in the reactor in all experimental conditions in this paper is 1–2 °C higher than the setting temperature of the circulating water bath, and thus the effect of such a temperature difference can be ignored. The real-time measurement data for the temperature and pressure in the high-pressure transparent reactor are recorded and saved to a computer with a temperature control accuracy of ±0.01 °C and pressure accuracy of ±0.01 MPa.
Experiments were conducted to form hydrates using methane gas and deionized water as raw materials. Inorganic salt NaCl, methanol, and quartz sand were added as additives. The specific parameters of the experimental materials can be found in Table 1. In this paper, quartz sand grains are used to simulate solid-phase particles such as rock chips in the wellbore during drilling, and their physical properties are shown in Table 2. The grain size of the quartz sand used was 0.71–1.18 mm, from the Minghai Quartz Sand Factory.
2.2. Procedures and Conditions
For each experimental group, the initial pressure and experimental temperature were kept consistent. The impact of factors such as the stirring motor speed, concentrations of NaCl and methanol, and quartz sand content on the hydrate formation process and gas consumption were discussed by varying these parameters. The operational steps for the methane hydrate formation experiments were as follows: First, the top end cap of the reactor was opened and a configured solution totaling 200 g was added in three additions. For the sand-containing experiment, the desired mass of the sand was first determined, 50 g of deionized water was added, stirred until saturated, and then the mixed medium was introduced into the reactor. The remaining deionized water was added in three additions to ensure the complete rinsing of the sand. Next, methane gas was charged into the reactor three times and released to remove air from the reactor and piping. Each time, the gas was inflated to a pressure of 1 MPa and held for 10 min after the third inflation and the unit was checked for tightness. We filled the reactor with methane gas until the predetermined experimental pressure was reached. If required, the gas pressure could be increased gradually using a gas buffer tank. We kept the water bath temperature constant at 20 °C throughout the process to ensure that it was above the methane hydrate formation temperature. We turned on the stirring device to promote the complete dissolution of methane gas in the experimental solution and to avoid the subsequent pressure drops caused by methane gas dissolution. Again, we maintained the water bath temperature at 20 °C. Once the pressure was stabilized, we adjusted the water bath temperature to the predefined experimental temperature, adjusted the speed of the stirring device accordingly, and started the data collection and recording function. We ensured that the data measurement and collection software was functioning properly. We observed and recorded any experimental phenomena through the windows. At the end of the experiment, we saved the data, closed the data measurement and collection software, and cleaned the experimental setup thoroughly.
The specific experimental conditions are provided in Table 3.
2.3. Calculation Methods
The gas consumption represents the molar quantity of methane gas consumed during the gas hydrate formation process. It is obtained by calculating the difference in gas volume between the beginning and end of the reaction. The reduction in gas volume is attributed to the generation of hydrates, which can be considered as the amount of hydrate formation during the hydrate generation process. According to the gas state Equation (1), the gas volume before and after the reaction can be calculated, and the gas consumption during the reaction is determined. This allows the calculation of the quantity of methane hydrate formation.
In the equation, where P is pressure in Pascals (Pa), V is volume in cubic meters, m3, Z is the gas compressibility factor (dimensionless constant), n is the amount of substance in mole, mol, R is the gas constant, taken as 8.314 J/(mol·K), and T is the temperature, K.
The formula for calculating the gas consumption during the reaction is given by Equation (2). Take the hydration number β to be a function of PT conditions, affected by temperature and pressure as shown by studies conducted by Handa [27] and Uchida [28]. These studies indicate that whether synthesized artificially in a laboratory or naturally occurring in sedimentary deposits, the observed hydrate number for methane hydrates is consistently around 6.0. Therefore, in this study, the hydrate number β for methane hydrates is assumed to be 6.0. The equation for methane hydrate formation is determined as shown in Equation (3):
In the equation, where Δn is the gas consumption, mol; n0 is the initial amount of substance, mol; n1 is the remaining amount of substance, mol; P0, P1 are the initial pressure and final pressure, Pa; V0, V1 are the initial volume and final volume, m3; Z0, Z1 are the initial compressibility factor and final compressibility factor, constant; R is constant, 8.314 J/(mol·K); and T0, T1 are the initial temperature and final temperature, °C.
The compressibility factor is calculated using the Hall–Yarborough correlation equation:
In the equation, where pr is the reference pressure, Pa; t is the reciprocal of the reference temperature 1/Tr, K−1; and Y is the reference density.
3. Results and Discussion
3.1. The Effect of the Stirring Rate
At an initial pressure of 8.5 MPa and an experimental temperature of 275.15 K, the influence of the stirring rate on the hydrate formation process was investigated under stirring rates of 300 r/min, 600 r/min, and 1200 r/min in a pure water system. The pressure variation curve and the temperature–gas consumption curve inside the vessel during the experiment are shown in Figure 2 and Figure 3.
From Figure 2, it can be observed that the formation of hydrates in the pure water system can be divided into three stages. In Stage I, the pressure gradually decreases with the decrease in temperature until a turning point, defined in this paper as the induction stage. In Stage II, the pressure curve rapidly decreases, indicating the rapid formation of hydrates. In Stage III, the pressure curve shows a slower decrease, representing the slow formation of hydrates. Under static conditions, the induction stage for hydrates lasts approximately 65 min, with no sharp decline in the pressure curve. During this stage, hydrates form slowly, and the gas consumption, as shown in Figure 3, increases gradually.
Under stirring conditions, the induction stage for hydrates is significantly shortened, lasting about 40 min. Furthermore, the induction times are similar for stirring rates of 300 r/min, 600 r/min, and 1200 r/min. During the induction stage, hydrates gradually nucleate, and the solution inside the vessel becomes gradually turbid, as shown in Figure 4b. In the rapid generation stage, with an increase in the stirring rate, the rate of the pressure decrease in the pressure curve in Figure 2 gradually increases. Accompanied by a rapid increase in gas consumption, the rapid generation of hydrates releases heat, causing a slight increase in the temperature inside the vessel, as shown in Figure 3. Moreover, with an increase in the stirring rate, the duration of the rapid generation stage gradually shortens: approximately 130 min at 300 r/min, 100 min at 600 r/min, and 90 min at 1200 r/min. During the rapid generation stage, hydrate crystals quickly aggregate, and the transparency of the solution gradually decreases, as shown in Figure 4c,d. Subsequently, with further temperature decreases, the pressure curve in Figure 2 slowly decreases, entering the slow generation stage of hydrates. Gas consumption increases slowly, and the generated hydrates begin to deposit. The transparency of the solution further decreases, as shown in Figure 4e. At the end of the experiment, hydrates are fully deposited, and the solution is almost opaque, as shown in Figure 4f.
An analysis of the causes suggests that under static conditions, the gas–liquid contact area is limited, the dissolution of methane in water is very small, and the mass transfer of methane is limited, so under static conditions, the process of hydrate generation is very slow, and no obvious hydrate generation was observed in the experiments in this paper. After increasing the stirring rate, the gas–liquid contact area is greatly increased, the mass transfer of methane is greatly enhanced, and the rate of hydrate generation is greatly accelerated, so the stirring will promote hydrate generation.
3.2. The Effect of NaCl Additive
The inorganic salt additive used in the experiment was NaCl, with mass concentrations of 5%, 10%, and 20%. A stirring speed of 300 r/min was set to discuss the influence of different concentrations of NaCl on the hydrate formation process. The pressure variation curve and temperature–gas consumption curve inside the reactor during the experiment are shown in Figure 5 and Figure 6, respectively.
From Figure 5, it can be observed that, compared to the pure water system under the same experimental conditions, in NaCl systems with different concentrations, both the induction stage time and the rapid generation stage time are extended. In the 5% NaCl system, the induction stage time is 68 min, and the rapid generation stage time is 496 min. Compared to the pure water system at 300 r/min, these times are extended by 28 min and 366 min, respectively. This indicates that the addition of NaCl has a certain inhibitory effect on hydrate formation. In the 10% NaCl system, the induction stage time is 72 min, extended by 32 min compared to the pure water system at 300 r/min. The hydrate formation is slow, and there is no clear indication of a rapid generation stage, suggesting that hydrate formation is significantly inhibited in the 10% NaCl system. In the 20% NaCl system, the induction stage time is 84 min, extended by 44 min compared to the pure water system at 300 r/min. Hydrate formation is extremely slow, and no obvious hydrate particles are observed at the end of the experiment, indicating that hydrate formation is almost completely inhibited in the 20% NaCl system.
The temperature curve in Figure 6 shows that in the NaCl system, the temperature remains stable after reaching the experimental temperature, and there is no phenomenon of a temperature rise due to the exothermic generation of hydrates. This further proves that the addition of NaCl inhibits hydrate formation. Figure 6 also indicates that with the increase in NaCl mass concentration, the gas consumption gradually decreases. At the end of the experiment, the gas consumptions in the 5% NaCl, 10% NaCl, and 20% NaCl systems are 0.64 mol, 0.36 mol, and 0.02 mol. Analyzing the experimental phenomena in conjunction with the 20% NaCl system, the production of the hydrate was completely inhibited and the gas consumed was thought to be the dissolution of methane in water caused by the temperature drop.
Analysis suggests that NaCl undergoes ionization in water to form Na+ and Cl−, and due to electrostatic forces, these ions adsorb onto different clusters of water molecules, leading to a decrease in the activity of water molecules and an increase in disorder. This ionic bonding is stronger than the hydrogen bonding in hydrate cages and the van der Waals forces between the methane molecules and the hydrate cage. Therefore, NaCl not only affects the formation of hydrate cages but also competes with methane molecules to bind with water molecules, making it difficult for hydrates to form. At the same time, the activity of water molecules in the solution decreases with an increase in the number of ion charges [29,30,31,32]. When the concentration of NaCl increases, the concentrations of Na+ and Cl− in the solution also increase, leading to a gradual decrease in the activity of water. This makes the formation of hydrates more difficult. Therefore, the addition of NaCl has a significant inhibitory effect on the formation of methane hydrates, and this inhibitory effect increases with the higher concentration of NaCl.
3.3. The Effect of Methanol L Additive
A methanol water solution, due to its lower freezing point, lower viscosity, fast action, renewability, low corrosion, and low cost, is widely used in the natural gas field [31]. The experiment selected methanol as the alcohol additive, with mass concentrations of 5%, 10%, and 20%, and a stirring speed of 300 r/min was set to discuss the effects of different concentrations of methanol on the hydrate formation process. The pressure change curve and temperature–gas consumption curve in the reactor during the experiment are shown in Figure 7 and Figure 8.
The induction stage durations in methanol solutions with mass concentrations of 5%, 10%, and 20% are 60 min, 70 min, and 84 min, respectively, which are extended by 20 min, 30 min, and 44 min compared to the pure water system at 300 r/min. Similar to the NaCl system, in the methanol solutions with different concentrations, the pressure curves exhibit a gradual decrease after hydrate formation without a distinct inflection point, indicating the absence of a rapid generation stage, suggesting the inhibition of hydrate formation in methanol solutions. As shown in Figure 8, the experimental temperature in methanol solutions remains stable, indicating a steady hydrate formation. Additionally, there is a consistent increase in gas consumption. At the end of the experiments, the gas consumption in the three concentrations of methanol systems is 0.67 mol, 0.48 mol, and 0.01 mol. Similar to the 20% NaCl system, the gas consumption in the 20% methanol system is likewise thought to be due to the dissolution of methane gas in water as a result of the temperature drop. This suggests that with an increase in methanol concentration, the inhibitory effect of methanol strengthens, resulting in a decrease in hydrate formation, and almost no hydrate formation is observed in the 20% methanol system.
When methanol is introduced, on one hand, the groups of methanol interact with water molecules, disrupting the hydrogen bond network of water. This requires additional energy for water molecules to form the network, making hydrate formation more challenging. This additional energy can be supplied by increasing the pressure or decreasing the temperature, altering the original equilibrium system and breaking the phase equilibrium of hydrates [33]. On the other hand, the methyl groups of methanol are hydrophobic and, similar to hydrate guest molecules, exhibit a clustering effect on water molecules, leading to the rearrangement of water molecules [34]. As a result, the formation of hydrate cages is significantly slowed down, indicating a substantial reduction in the rate of hydrate formation. In summary, methanol inhibits the formation of hydrates by affecting the hydrogen bond network of water and causing a slowdown in the rearrangement of water molecules within hydrate cages.
The comparison of the gas consumption during hydrate formation in NaCl and methanol solution systems reveals that at 5% and 10% mass concentrations, the gas consumption in the methanol system is higher than in the NaCl system for the same duration, as shown in Figure 9. This indicates that, at equivalent mass concentrations, methanol has a weaker inhibitory effect on hydrate formation compared to NaCl. At a 20% mass concentration, both the NaCl and methanol systems almost completely inhibit hydrate formation, with little difference in the gas consumption between them.
3.4. The Effect of Sand Contents
The experiment used quartz sand particles with a diameter of 0.5–1 mm and mass fractions of 10%, 20%, and 30%. It was observed that at a stirring speed of 300 r/min, the sand particles could not achieve good suspension. Therefore, the stirring speed of the motor was set to 600 r/min in this section of the experiment. The impact of the sand content on the hydrate formation process in the pure water system was discussed. The pressure change curve and temperature–gas consumption curve inside the reactor during the experiment are shown in Figure 10 and Figure 11, respectively.
The pressure change curves during the hydrate formation process with different sand contents are shown in Figure 10. It can be observed that in systems with varying sand contents, the induction stage duration is slightly longer than that of the pure water system under the same experimental conditions, being 49 min, 43.5 min, and 49 min, respectively. This is consistent with the experimental results of Lan et al. [35]. During the rapid generation stage, the pressure curve descent rate is similar to that of the pure water system with 600 r/min, and there is no phenomenon of a shortened rapid generation stage, which is different from the results of Lan et al. The analysis suggests that the quartz sand used in this study has a larger particle size (0.5–1 mm) and a smaller specific surface area, providing fewer nucleation sites for hydrate formation compared to a smaller-sized quartz sand [36]. Therefore, in the early stages of the reaction, the hydrate formation rate is relatively low. As the system enters the slow generation stage, the presence of sand particles provides more nucleation sites for hydrate formation and shells for hydrates to attach to, resulting in a continuous generation of hydrates.
The temperature–pressure curves during the hydrate formation process with sand contents are shown in Figure 11. It can be observed that the temperature curve fluctuates in the sand-containing system during the hydrate formation process, indicating that the hydrate formation process in the sand-containing system is not as stable as in the pure water system. The analysis suggests that the rotation of the stirring paddle and the collision of sand particles cause the generated hydrates to become loose and fall off. Some hydrates decompose and then reform, leading to fluctuations in the temperature curve, corresponding to the sudden increase and subsequent decrease in the pressure curve in Figure 10. It is worth noting that around 300 min into the experiment, the stirring motor speed starts to decrease, and after 20 min, stirring comes to a complete stop. This indicates that the cohesive strength of the deposited hydrates in the sand-containing system is higher than that in the pure water system, resulting in the cessation of stirring. The gas consumption curve shows that within a certain range, the methane gas consumption, i.e., the hydrate formation amount, increases with an increase in sand content, and it is significantly higher than that in the pure water system under the same conditions. When the sand content is 10%, the final gas consumption is 0.78 mol; for 20% sand content, it is 0.8 mol; however, at 30% sand content, the final gas consumption is 0.81 mol. The analysis suggests that, on one hand, as the sand content increases, the collision between sand particles greatly intensifies. When hydrate particles form, the collision between sand particles causes the formed hydrate particles to break, hindering the formation of hydrates, as shown in Figure 12. On the other hand, the stirring speed of 600 r/min cannot suspend all sand particles. Some sand particles settle at the bottom of the reaction vessel, possibly not participating in hydrate formation. Therefore, the final hydrate formation amount is not significantly different from that at 20% sand content.
4. Conclusions
This article conducted hydrate formation experiments using a set of miniaturized high-pressure reaction vessels and discussed the effects of different stirring rates and additive concentrations on the hydrate formation process. The results indicate that under stirring conditions:
- (1)
- The hydrate formation process can be divided into three stages: the induction stage, the rapid formation stage, and the slow formation stage. During the induction stage, the pressure decreases with a decrease in temperature until a turning point is reached, and hydrate nucleation gradually occurs. In the rapid formation stage, the pressure rapidly decreases, and gas consumption significantly increases. The slow formation stage is characterized by a steady decrease in pressure, and the rate of gas consumption gradually diminishes.
- (2)
- The stirring effect has a significant impact on both the induction stage and the rapid formation stage times. Comparing the static system to systems with stirring at 300 r/min, 600 r/min, and 1200 r/min, the induction stage times are around 40 min for all cases, and the rapid formation stage times are approximately 130 min, 100 min, and 90 min, respectively.
- (3)
- NaCl and methanol have a significant impact on the induction stage and the final gas consumption. In NaCl and methanol solutions, the formation of hydrates is inhibited, and the induction stage time increases with the concentration of NaCl and methanol. The hydrate formation rate remains stable, showing no clear rapid formation stage. The final gas consumption decreases significantly with the increasing concentration of NaCl and methanol, and in the case of a 20% mass concentration, hydrate formation is almost completely inhibited in both NaCl and methanol solutions.
- (4)
- In the quartz sand system, the induction stage time and the rapid generation stage time are relatively close to those in the pure water system under the same conditions. However, in the slow generation stage, the gas consumption is significantly higher than in the pure water system. Within a certain range (in this study, with a sand content of 20%), the final gas consumption increases with the increase in sand content.
Author Contributions
Y.G. (Yonghai Gao): conceptualization, methodology, writing—original draft; Y.Q.: investigation, analysis; L.Z.: analysis; X.S.: writing—review and editing; Y.G. (Yanli Guo): conceptualization, methodology. All authors have read and agreed to the published version of the manuscript.
Funding
The authors gratefully acknowledge the financial support of the National Natural Science Foundation of China (52288101, No. U21B2065 and No. 52274022), the Key R&D Plan of Shandong Province (2022CXGC020407), and the Natural Science Foundation of Shandong Province (Grant No. ZR2020QE114).
Institutional Review Board Statement
Not applicable.
Informed Consent Statement
Not applicable.
Data Availability Statement
Data are contained within the article.
Conflicts of Interest
The authors declare no competing financial interests.
References
- Seyyedattar, M.; Zendehboudi, S.; Butt, S. Technical and non-technical challenges of development of offshore petroleum reservoirs: Characterization and production. Nat. Resour. Res. 2020, 29, 2147–2189. [Google Scholar] [CrossRef]
- Fraser, G.S. Impacts of offshore oil and gas development on marine wildlife resources. In Peak Oil, Economic Growth, and Wildlife Conservation; Springer: New York, NY, USA, 2014; pp. 191–217. [Google Scholar]
- Osborne, J.J.; Yetginer, A.G.; Halliday, T.; Tjelta, T.I. The future of deepwater site investigation: Seabed drilling technology? In Frontiers in Offshore Geotechnics II; CRC Press: Boca Raton, FL, USA, 2010; pp. 317–322. [Google Scholar]
- Shicun, W.; Nong, H. The energy security of China and oil and gas exploitation in the disputed South China Sea Area. In Recent Developments in the Law of the Sea and China; Brill Nijhoff: Leiden, The Netherlands, 2005; pp. 145–154. [Google Scholar]
- Metelitsa, A.; Kupfer, J. Oil and Gas Resources and Transit Issues in the South China Sea; Asia Society: New York, NY, USA, 2022. [Google Scholar]
- Aird, P. Deepwater Drilling; Gulf Professional Publishing: Houston, TX, USA; Elsevier: Amsterdam, The Netherlands, 2019; Volume 441, 475p. [Google Scholar]
- Abimbola, M.; Khan, F.; Khakzad, N. Dynamic safety risk analysis of offshore drilling. J. Loss Prev. Process Ind. 2014, 30, 74–85. [Google Scholar] [CrossRef]
- Millett, J.; Wilkins, A.; Campbell, E.; Hole, M.; Taylor, R.; Healy, D.; Jerram, D.; Jolley, D.; Planke, S.; Archer, S.; et al. The geology of offshore drilling through basalt sequences: Understanding operational complications to improve efficiency. Mar. Pet. Geol. 2016, 77, 1177–1192. [Google Scholar] [CrossRef]
- Hannegan, D. Offshore Drilling Hazard Mitigation: Controlled Pressure Drilling Redefines What Is Drillable. Drilling Contractor. 2009, pp. 84–89. Available online: https://drillingcontractor.org/offshore-drilling-hazard-mitigation-controlled-pressure-drilling-redefines-what-is-drillable-3178 (accessed on 1 January 2024).
- Zhiyuan, W.; Jianbo, Z.; Wenbo, M.; Baojiang, S.; Jinsheng, S.; Jintang, W.; Dahui, L.; Jinbo, W. Formation, deposition characteristics and prevention methods of gas hydrates in deepwater gas wells. Acta Pet. Sin. 2021, 42, 776. [Google Scholar]
- Cha, S.B.; Ouar, H.; Wildeman, T.R.; Sloan, E.D. A third-surface effect on hydrate formation. J. Phys. Chem. 1988, 92, 6492–6494. [Google Scholar] [CrossRef]
- Lai, D.T.; Dzialowski, A.K. Investigation of natural gas hydrates in various drilling fluids. In Proceedings of the SPE/IADC Drilling Conference, Miami, FL, USA, 21–23 February 1989. [Google Scholar]
- Waite, W.F.; Winters, W.J.; Mason, D.H. Methane hydrate formation in partially water-saturated Ottawa sand. Am. Mineral. 2004, 89, 1202–1207. [Google Scholar] [CrossRef]
- Zhang, P.; Wu, Q.; Mu, C. Influence of temperature on methane hydrate formation. Sci. Rep. 2017, 7, 7904. [Google Scholar] [CrossRef]
- Zhou, Y.; Castaldi, M.J.; Yegulalp, T.M. Experimental investigation of methane gas production from methane hydrate. Ind. Eng. Chem. Res. 2009, 48, 3142–3149. [Google Scholar] [CrossRef]
- Filarsky, F.; Hagelstein, M.; Schultz, H.J. Influence of different stirring setups on mass transport, gas hydrate formation, and scale transfer concepts for technical gas hydrate applications. Appl. Res. 2023, 2, e202200050. [Google Scholar] [CrossRef]
- Wang, P.; Wang, S.; Song, Y.; Yang, M. Dynamic measurements of methane hydrate formation/dissociation in different gas flow direction. Appl. Energy 2018, 227, 703–709. [Google Scholar] [CrossRef]
- Huang, T.; Li, X.; Zhang, Y.; Wang, Y.; Chen, Z. Experimental study of the drilling process in hydrate-bearing sediments under different circulation rates of drilling fluid. J. Pet. Sci. Eng. 2020, 189, 107001. [Google Scholar] [CrossRef]
- Dong, S.; Song, Y.; Pang, W.; Zhao, J.; Zheng, J.-N.; Yang, M. Experimental Study on the Decomposition Characteristics of Methane Hydrate for the Pressure Regulation of Production Processes. Energy Fuels 2023, 37, 2019–2029. [Google Scholar] [CrossRef]
- Yu, Y.S.; Sun, W.Z.; Chen, C.; Li, X.S.; Chen, Z.Y. Kinetics studies of methane hydrate formation and dissociation in the presence of cyclopentane. Fuel 2024, 356, 129651. [Google Scholar] [CrossRef]
- Dubey, S.; Gurjar, P.; Kumar, U.; Sahai, M.; Kumar, S.; Kumar, A. Elucidating the Impact of Thermodynamic Hydrate Inhibitors and Kinetic Hydrate Inhibitors on a Complex System of Natural Gas Hydrates: Application in Flow Assurance. Energy Fuels 2023, 37, 6533–6544. [Google Scholar] [CrossRef]
- Jiang, G.; Liu, T.; Ning, F.; Tu, Y.; Zhang, L.; Yu, Y.; Kuang, L. Polyethylene glycol drilling fluid for drilling in marine gas hydrates-bearing sediments: An experimental study. Energies 2011, 4, 140–150. [Google Scholar] [CrossRef]
- Zhang, L.; Zhang, C.; Huang, H.; Qi, D.; Zhang, Y.; Ren, S.; Wu, Z.; Fang, M. Gas hydrate risks and prevention for deep water drilling and completion: A case study of well QDN-X in Qiongdongnan Basin, South China Sea. Pet. Explor. Dev. 2014, 41, 824–832. [Google Scholar] [CrossRef]
- Farahani, M.V.; Hassanpouryouzband, A.; Yang, J.; Tohidi, B. Insights into the climate-driven evolution of gas hydrate-bearing permafrost sediments: Implications for prediction of environmental impacts and security of energy in cold regions. RSC Adv. 2021, 11, 14334–14346. [Google Scholar] [CrossRef] [PubMed]
- Farahani, M.V.; Guo, X.; Zhang, L.; Yang, M.; Hassanpouryouzband, A.; Zhao, J.; Yang, J.; Song, Y.; Tohidi, B. Effect of thermal formation/dissociation cycles on the kinetics of formation and pore-scale distribution of methane hydrates in porous media: A magnetic resonance imaging study. Sustain. Energy Fuels 2021, 5, 1567–1583. [Google Scholar] [CrossRef]
- Okwananke, A.; Hassanpouryouzband, A.; Farahani, M.V.; Yang, J.; Tohidi, B.; Chuvilin, E.; Istomin, V.; Bukhanov, B. Methane recovery from gas hydrate-bearing sediments: An experimental study on the gas permeation characteristics under varying pressure. J. Pet. Sci. Eng. 2019, 180, 435–444. [Google Scholar] [CrossRef]
- Handa, Y.P. A calorimetric study of naturally occurring gas hydrates. Ind. Eng. Chem. Res. 1988, 27, 872–874. [Google Scholar] [CrossRef]
- Uchida, T.; Hirano, T.; Ebinuma, T.; Narita, H.; Gohara, K.; Mae, S.; Matsumoto, R. Raman spectroscopic determination of hydration number of methane hydrates. AIChE J. 1999, 45, 2641–2645. [Google Scholar] [CrossRef]
- Qi, Y.; Wu, W.; Liu, Y.; Xie, Y.; Chen, X. The influence of NaCl ions on hydrate structure and thermodynamic equilibrium conditions of gas hydrates. Fluid Phase Equilibria 2012, 325, 6–10. [Google Scholar] [CrossRef]
- Mimachi, H.; Takeya, S.; Gotoh, Y.; Yoneyama, A.; Hyodo, K.; Takeda, T.; Murayama, T. Dissociation behaviors of methane hydrate formed from NaCl solutions. Fluid Phase Equilibria 2016, 413, 22–27. [Google Scholar] [CrossRef]
- Madygulov, M.S.; Vlasov, V.A. Kinetics of methane hydrate formation from stirred aqueous NaCl solutions. Chem. Eng. Res. Des. 2024, 202, 267–271. [Google Scholar] [CrossRef]
- Anderson, F.E.; Prausnitz, J.M. Inhibition of gas hydrates by methanol. AIChE J. 1986, 32, 1321–1333. [Google Scholar] [CrossRef]
- Vysniauskas, A.; Bishnoi, P.R. A kinetic study of methane hydrate formation. Chem. Eng. Sci. 1983, 38, 1061–1072. [Google Scholar] [CrossRef]
- You, K.; Flemings, P.; Malinverno, A.; Collett, T.; Darnell, K. Mechanisms of methane hydrate formation in geological systems. Rev. Geophys. 2019, 57, 1146–1196. [Google Scholar] [CrossRef]
- Lan, W.-P.; Lin, D.-C.; Huang, F.-F.; Shi, B.-H.; Chen, Y.-C.; Wu, H.-H.; Gong, J. Experimental Study on Formation and Decomposition of Methane Hydrate in the Presence of Sand. Contemp. Chem. Ind. 2020, 49, 1839–1846. [Google Scholar]
- Hu, G.W.; Bu, Q.T. Research progress on the effects of particle size and pore size distribution on natural gas hydrate formation. Geol. Sci. Technol. Inf. 2019, 38, 41–52. [Google Scholar]
- Taylor, C.J.; Miller, K.T.; Koh, C.A.; Sloan, E.D. Macroscopic investigation of hydrate film growth at the hydrocarbon/water interface. Chem. Eng. Sci. 2007, 62, 6524–6533. [Google Scholar] [CrossRef]
- Turner, D.J.; Miller, K.T.; Sloan, E.D. Direct conversion of water droplets to methane hydrate in crude oil. Chem. Eng. Sci. 2009, 64, 5066–5072. [Google Scholar] [CrossRef]
Figure 1.
Hydrate formation experimental apparatus diagram.

Figure 2.
The pressure variation curves during hydrate formation at different stirring rates.
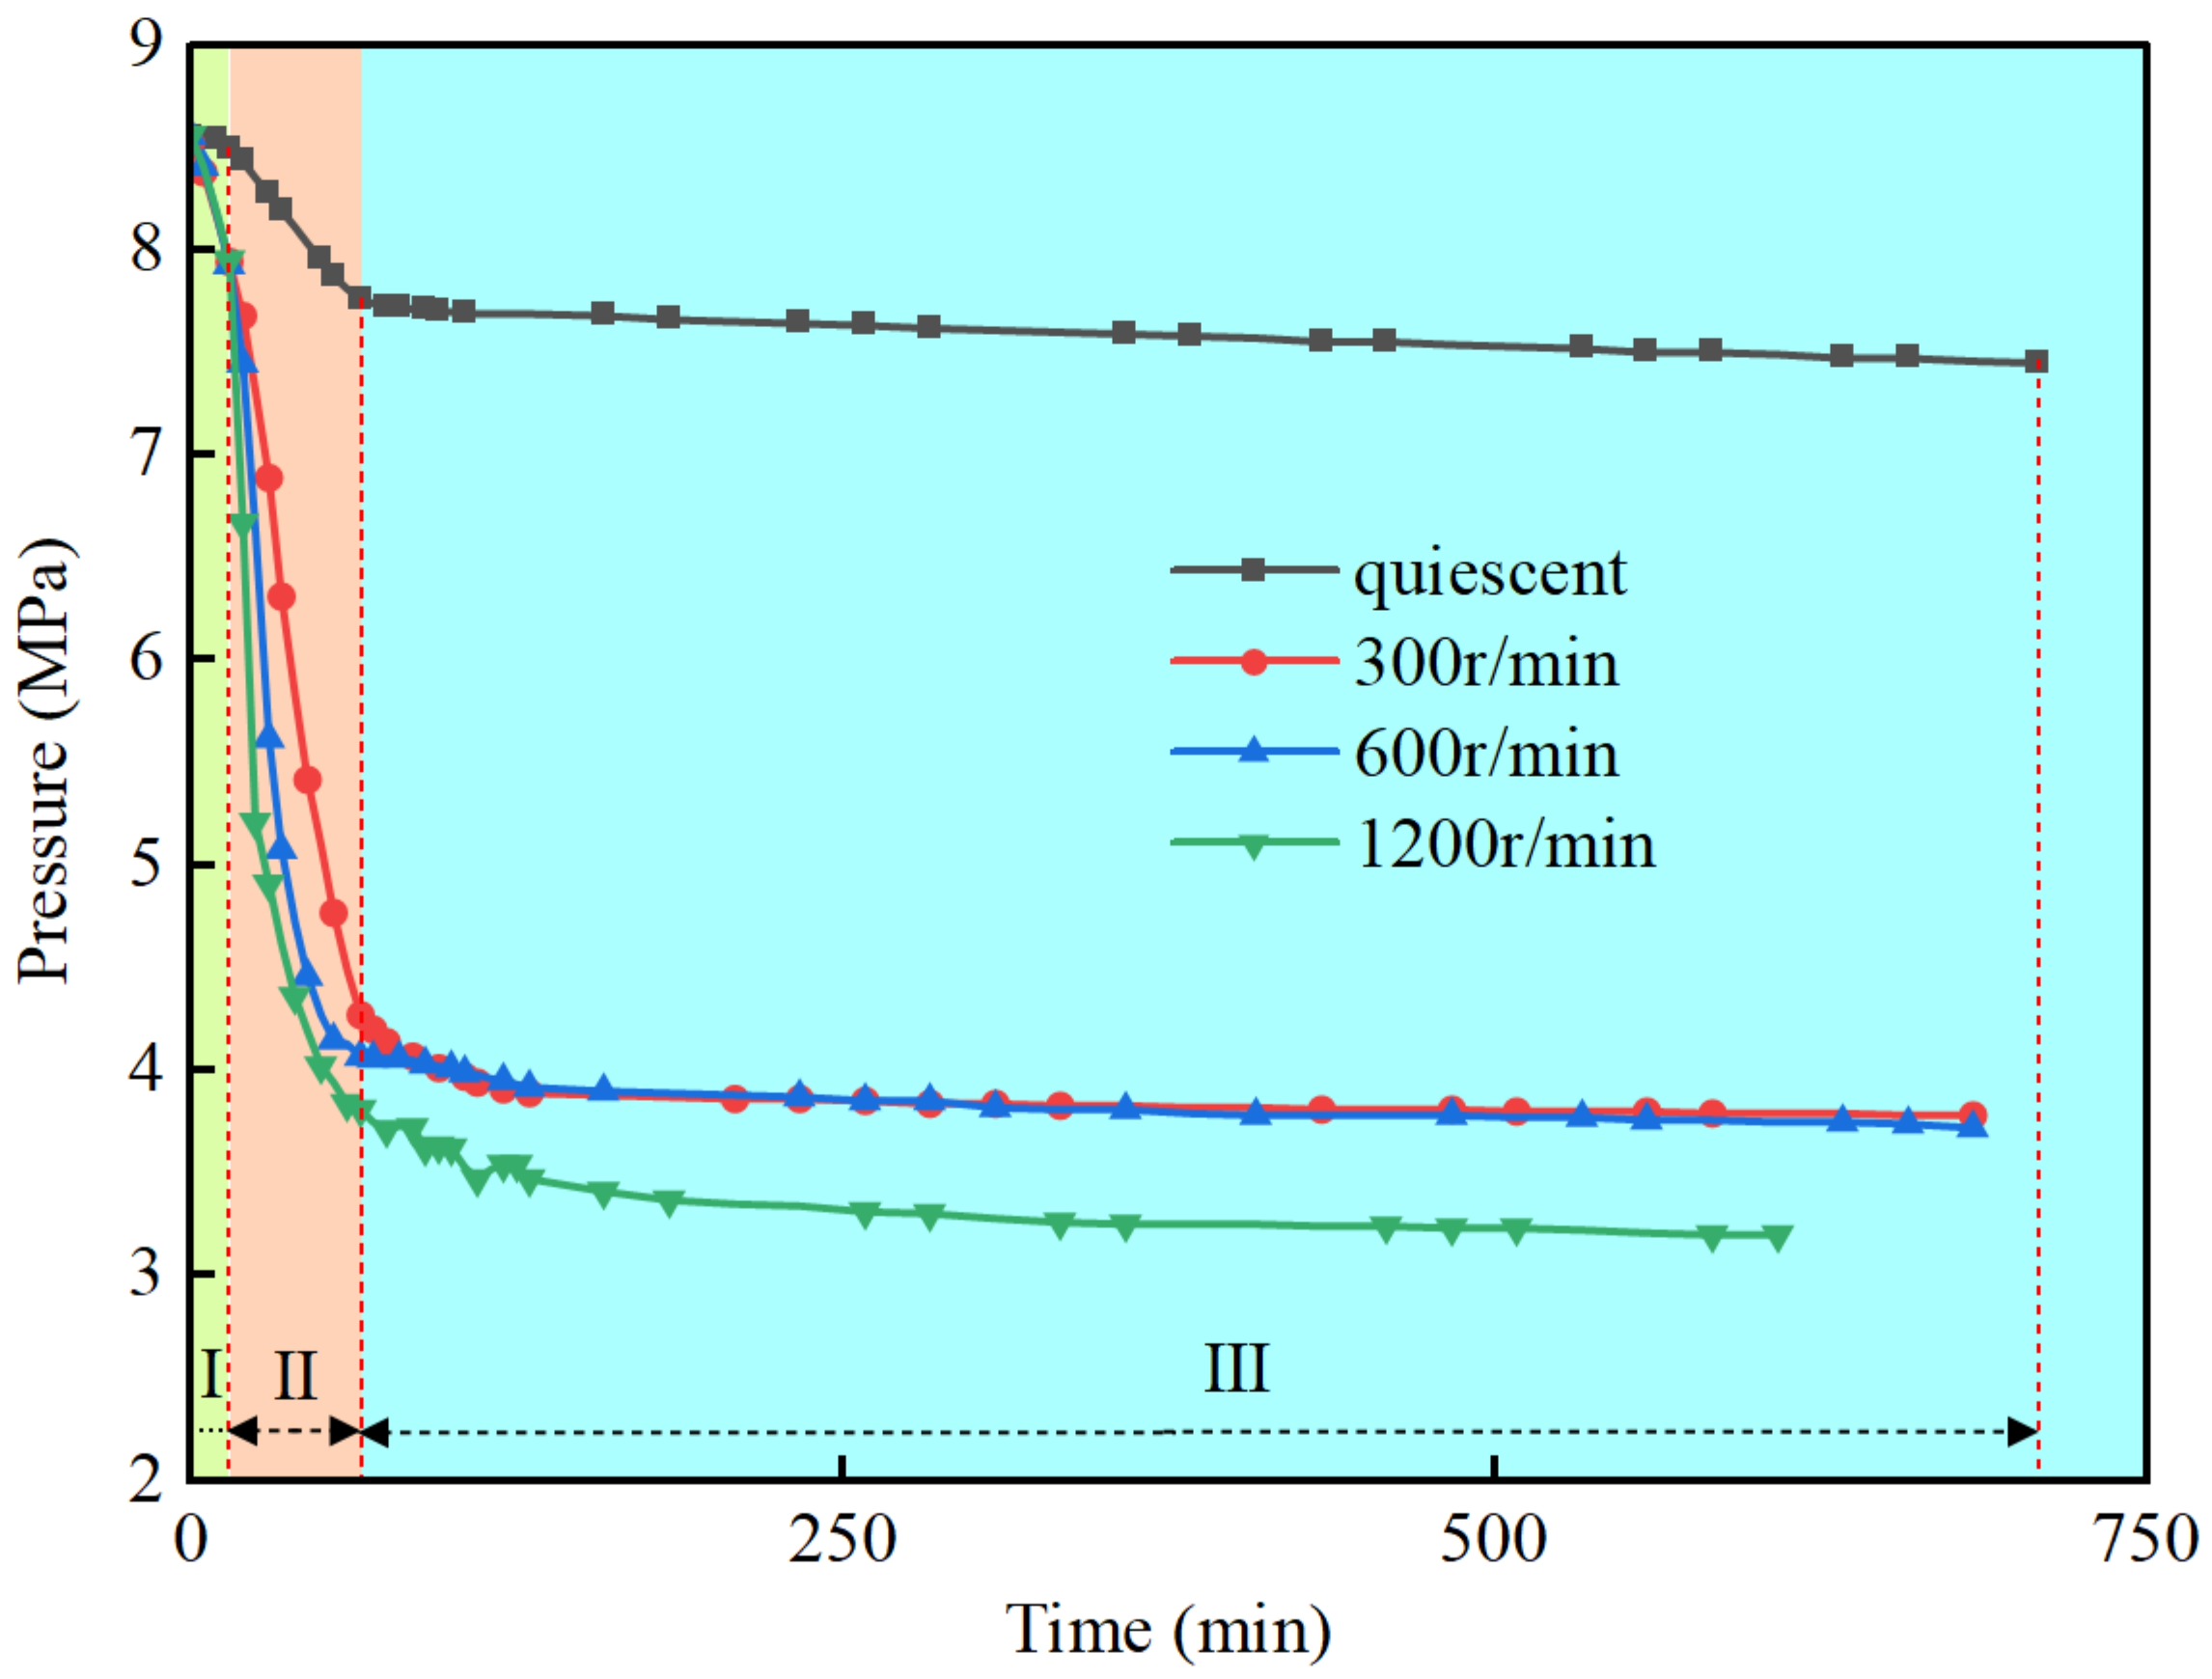
Figure 3.
The temperature–gas consumption variation curves during hydrate formation at different stirring rates.
Figure 3.
The temperature–gas consumption variation curves during hydrate formation at different stirring rates.
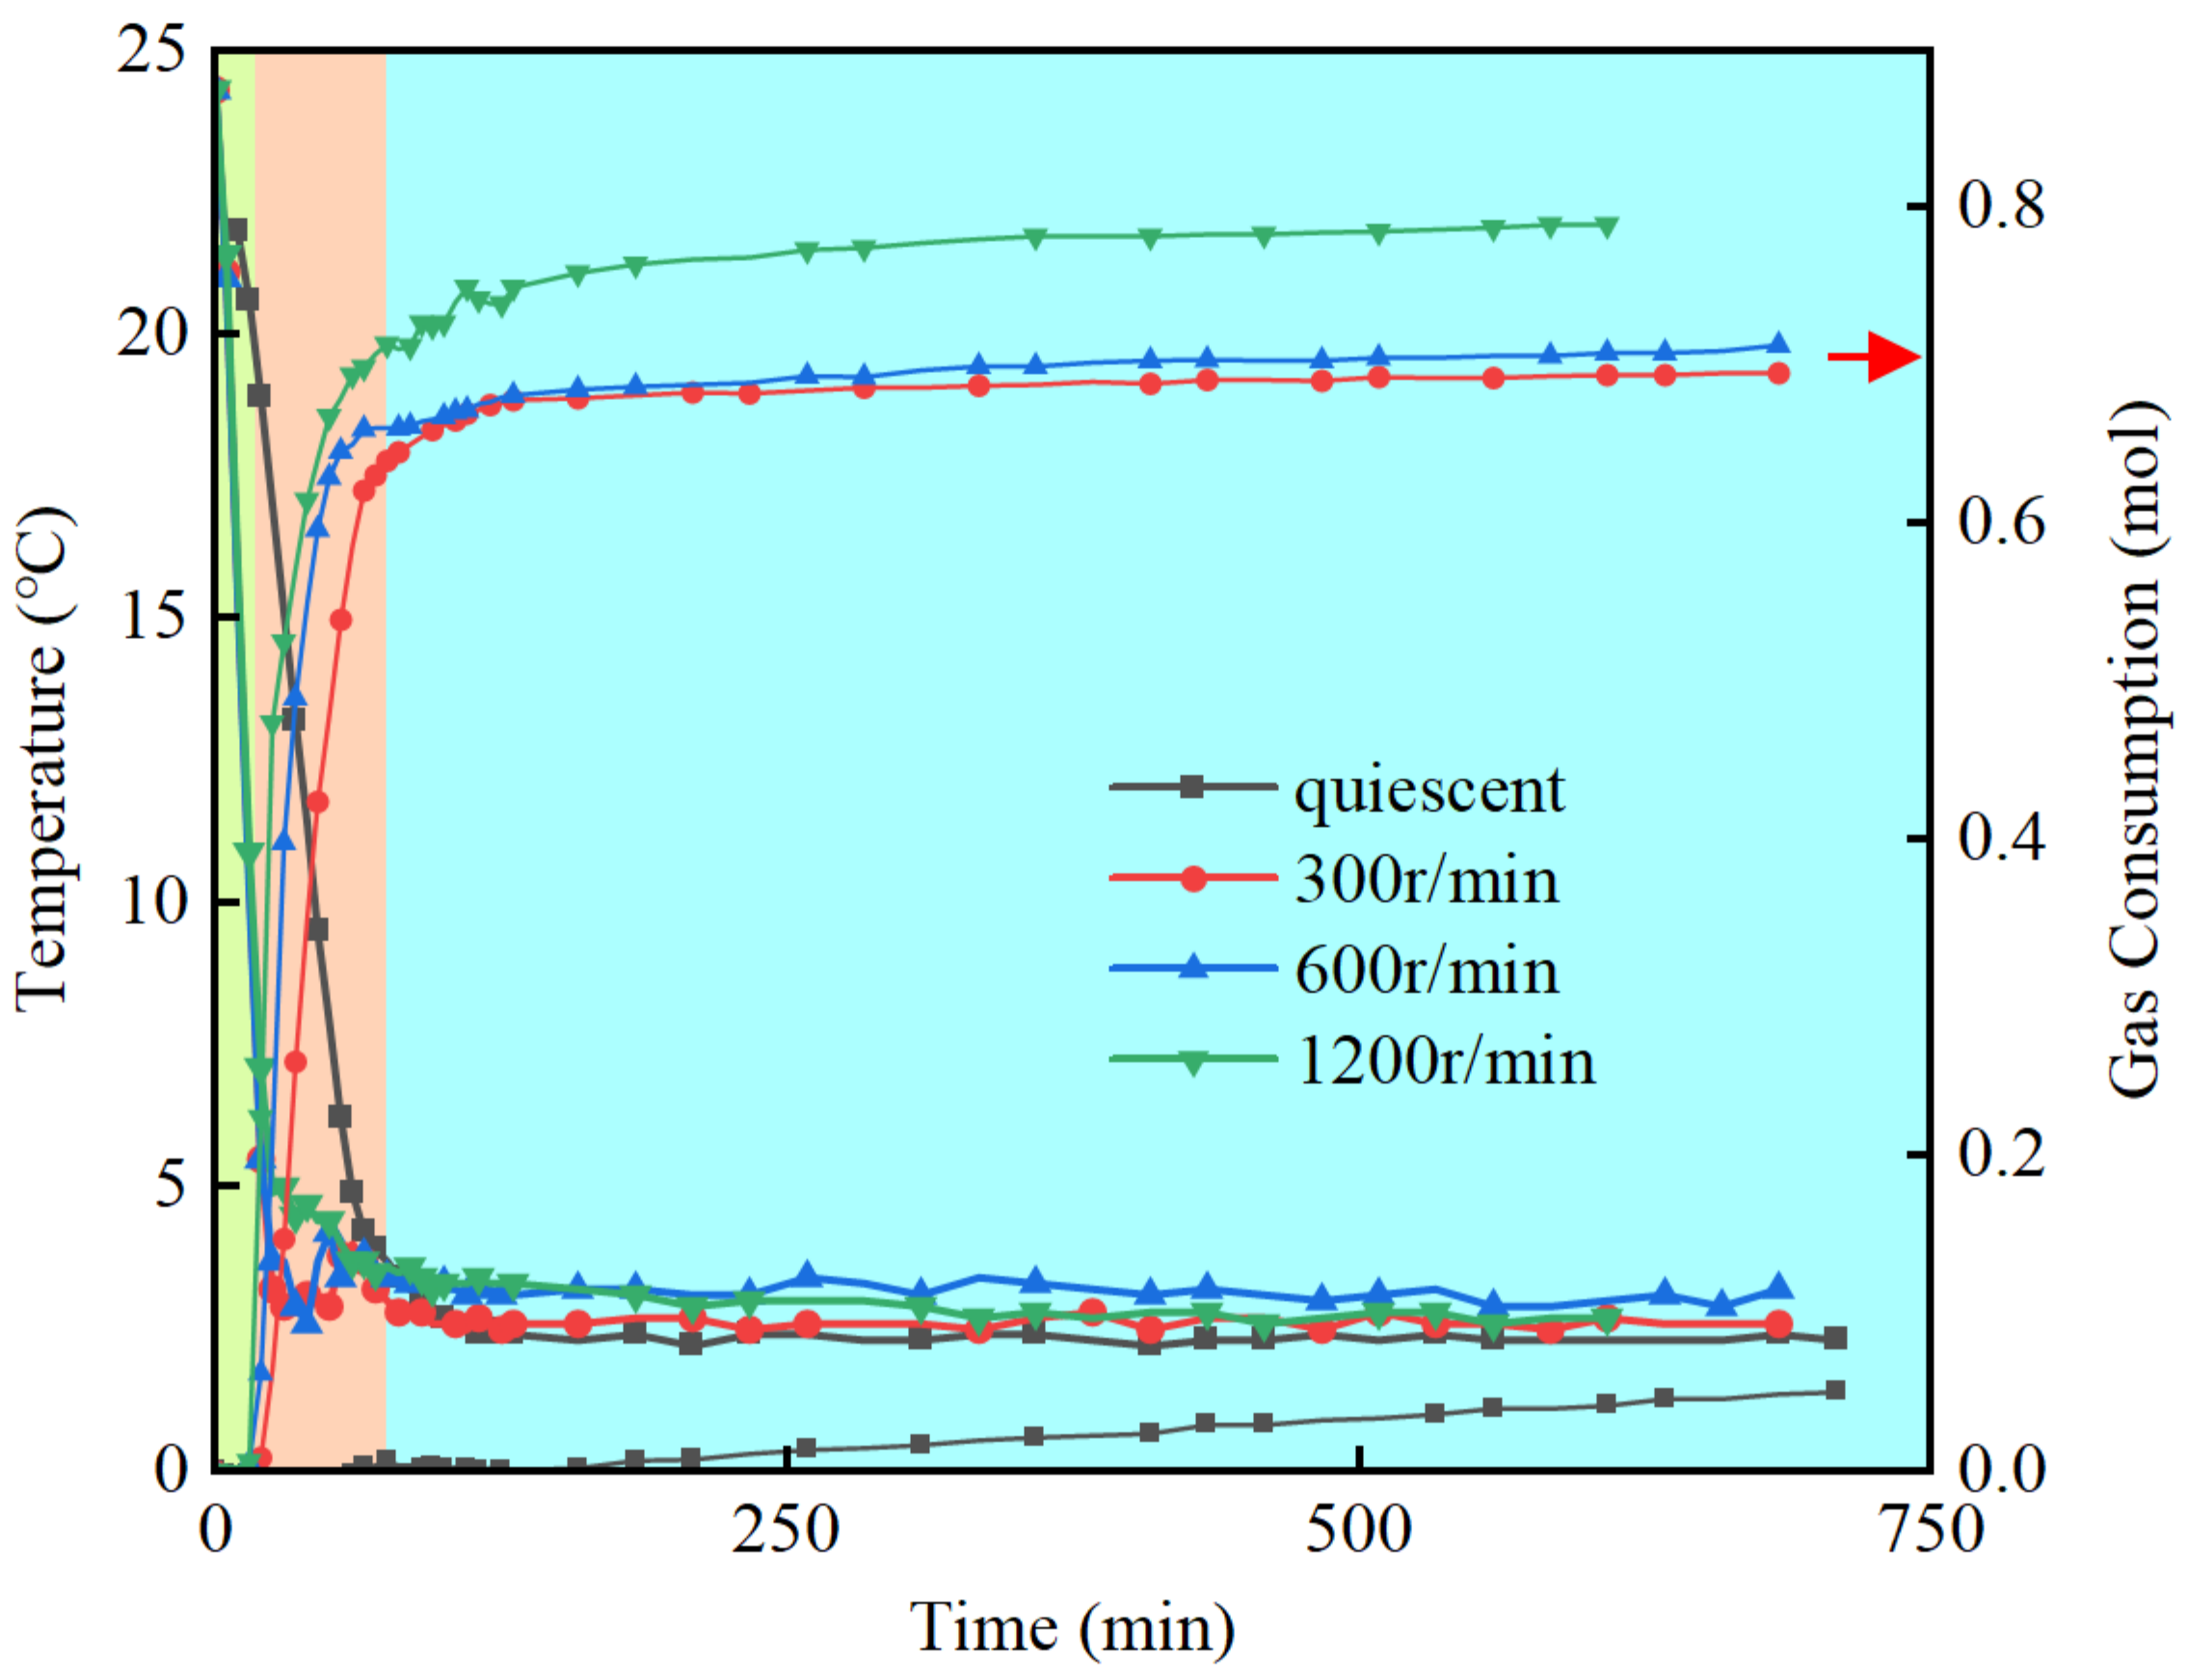
Figure 4.
Hydrate formation process under a stirring rate of 300 r/min.

Figure 5.
The pressure change curves during hydrate formation in NaCl systems of different concentrations.
Figure 5.
The pressure change curves during hydrate formation in NaCl systems of different concentrations.
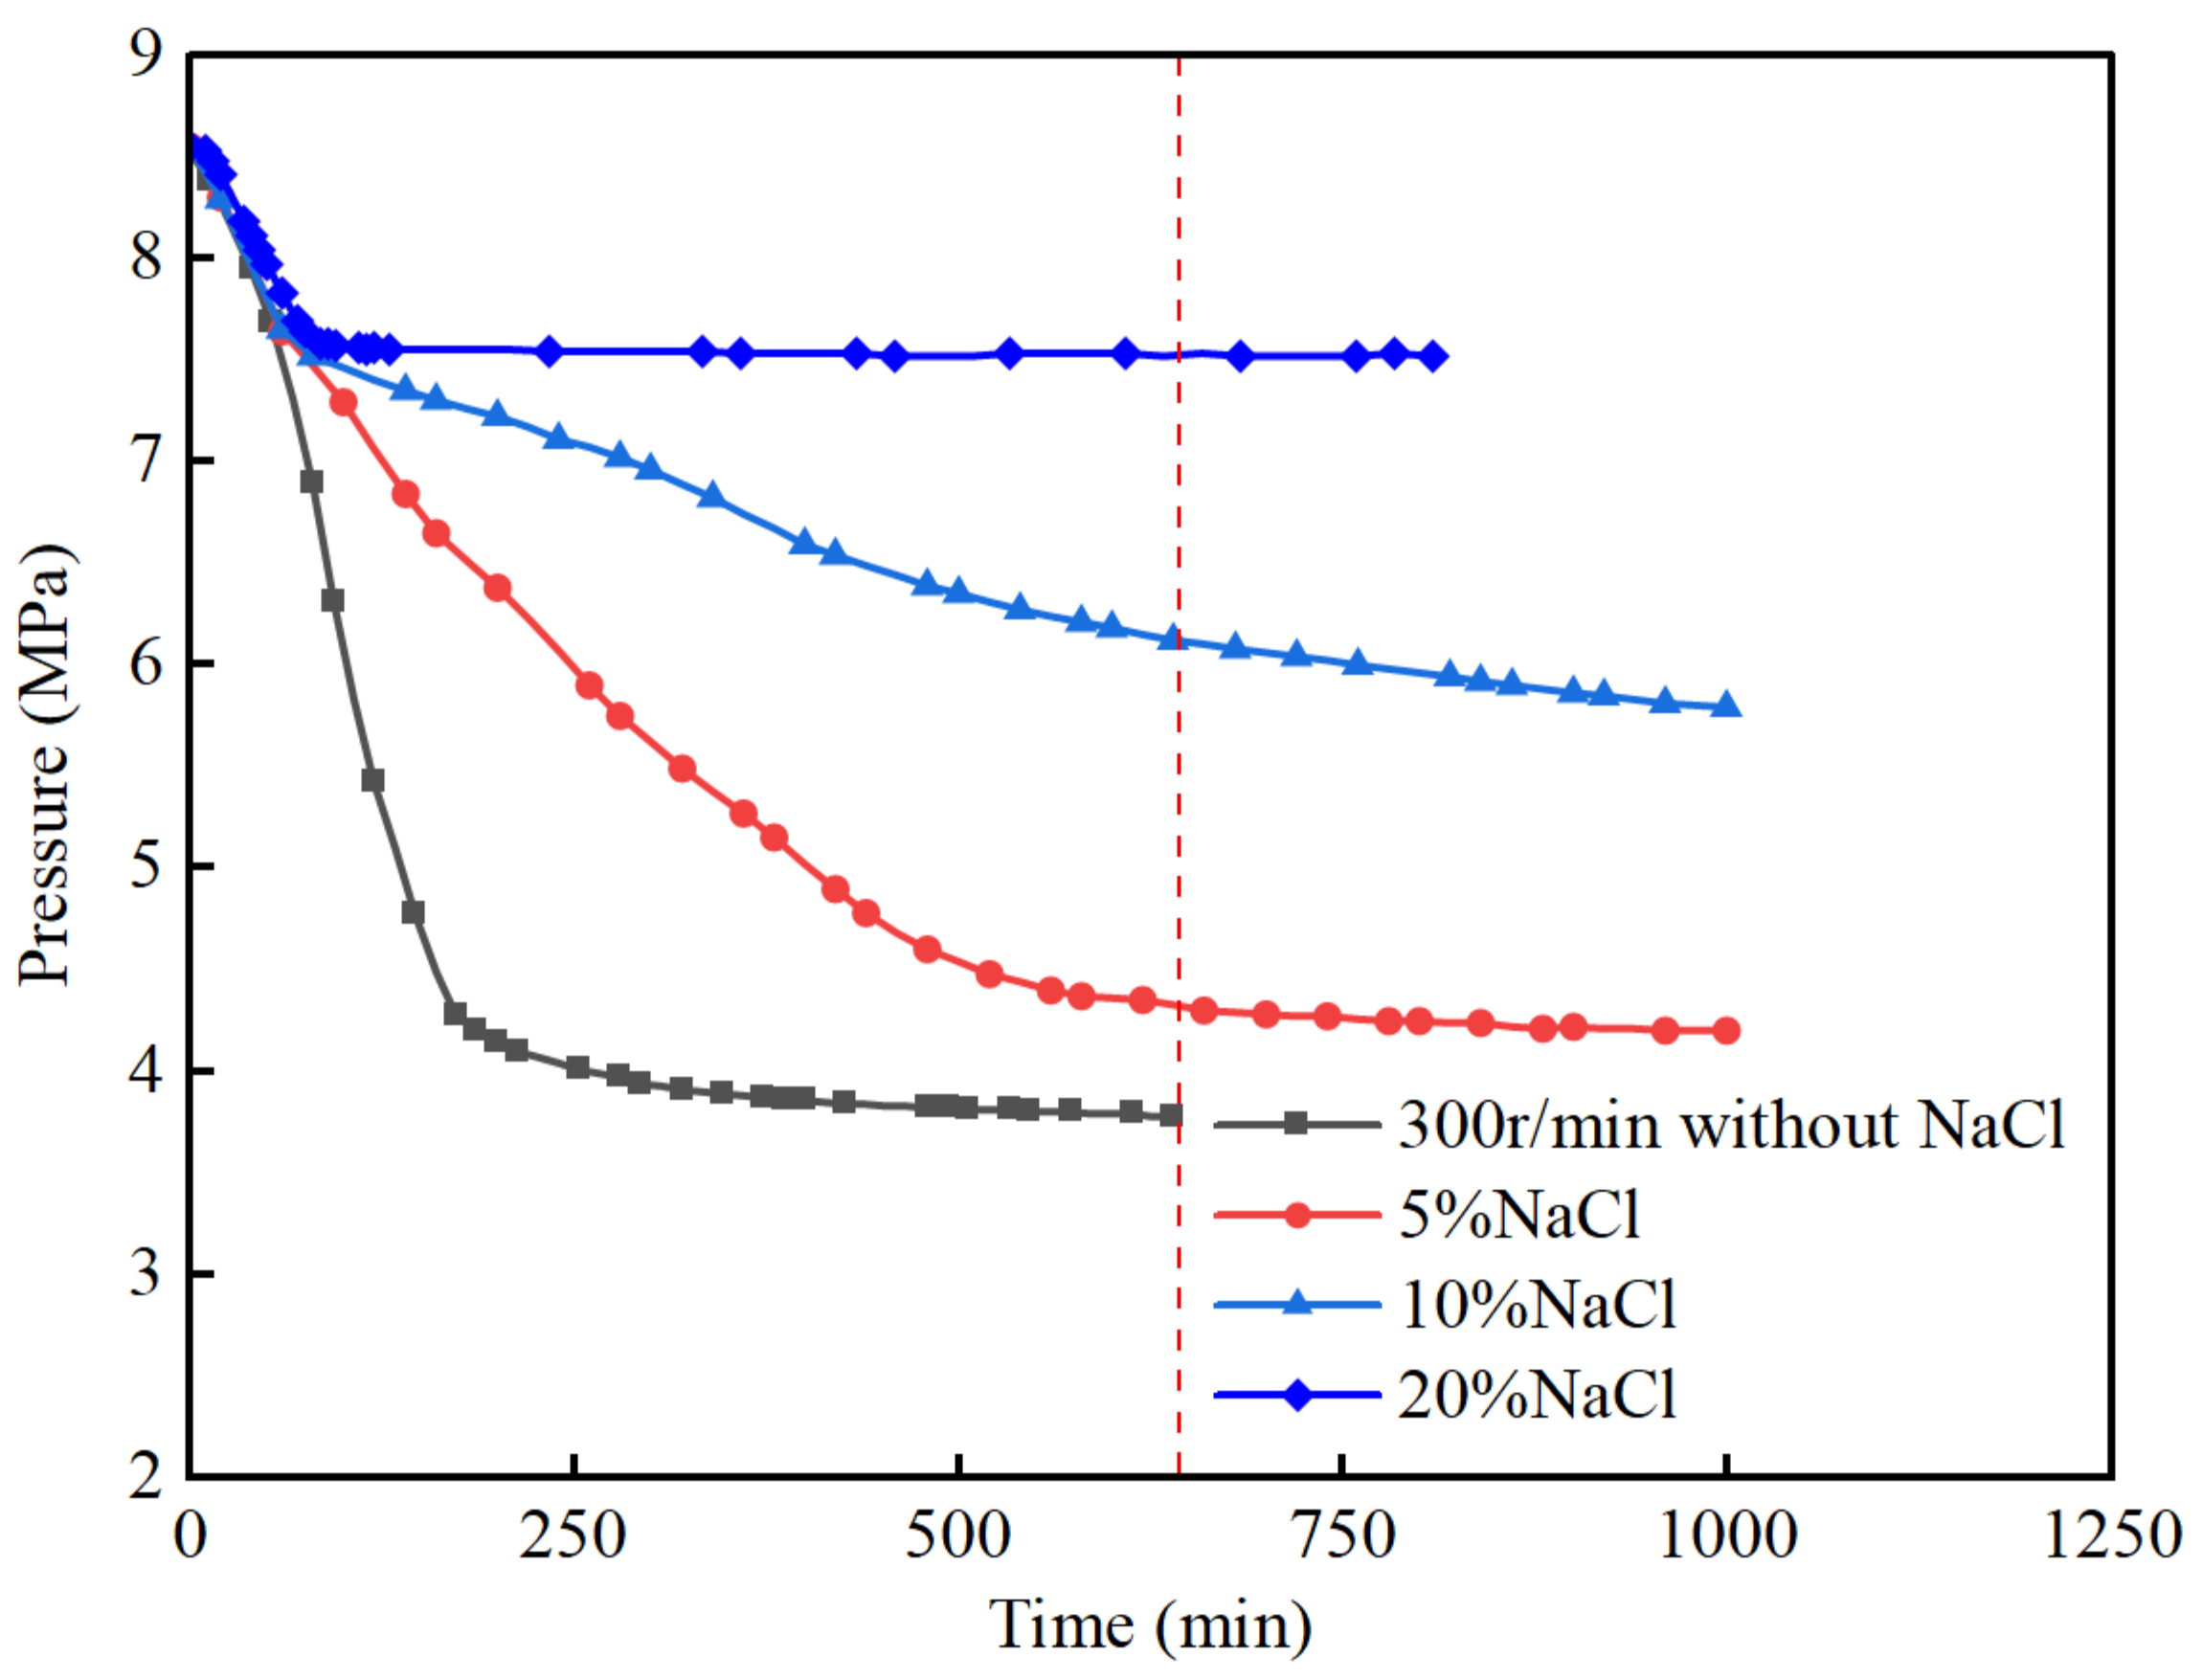
Figure 6.
The temperature–gas consumption curves during hydrate formation in NaCl systems of different concentrations.
Figure 6.
The temperature–gas consumption curves during hydrate formation in NaCl systems of different concentrations.
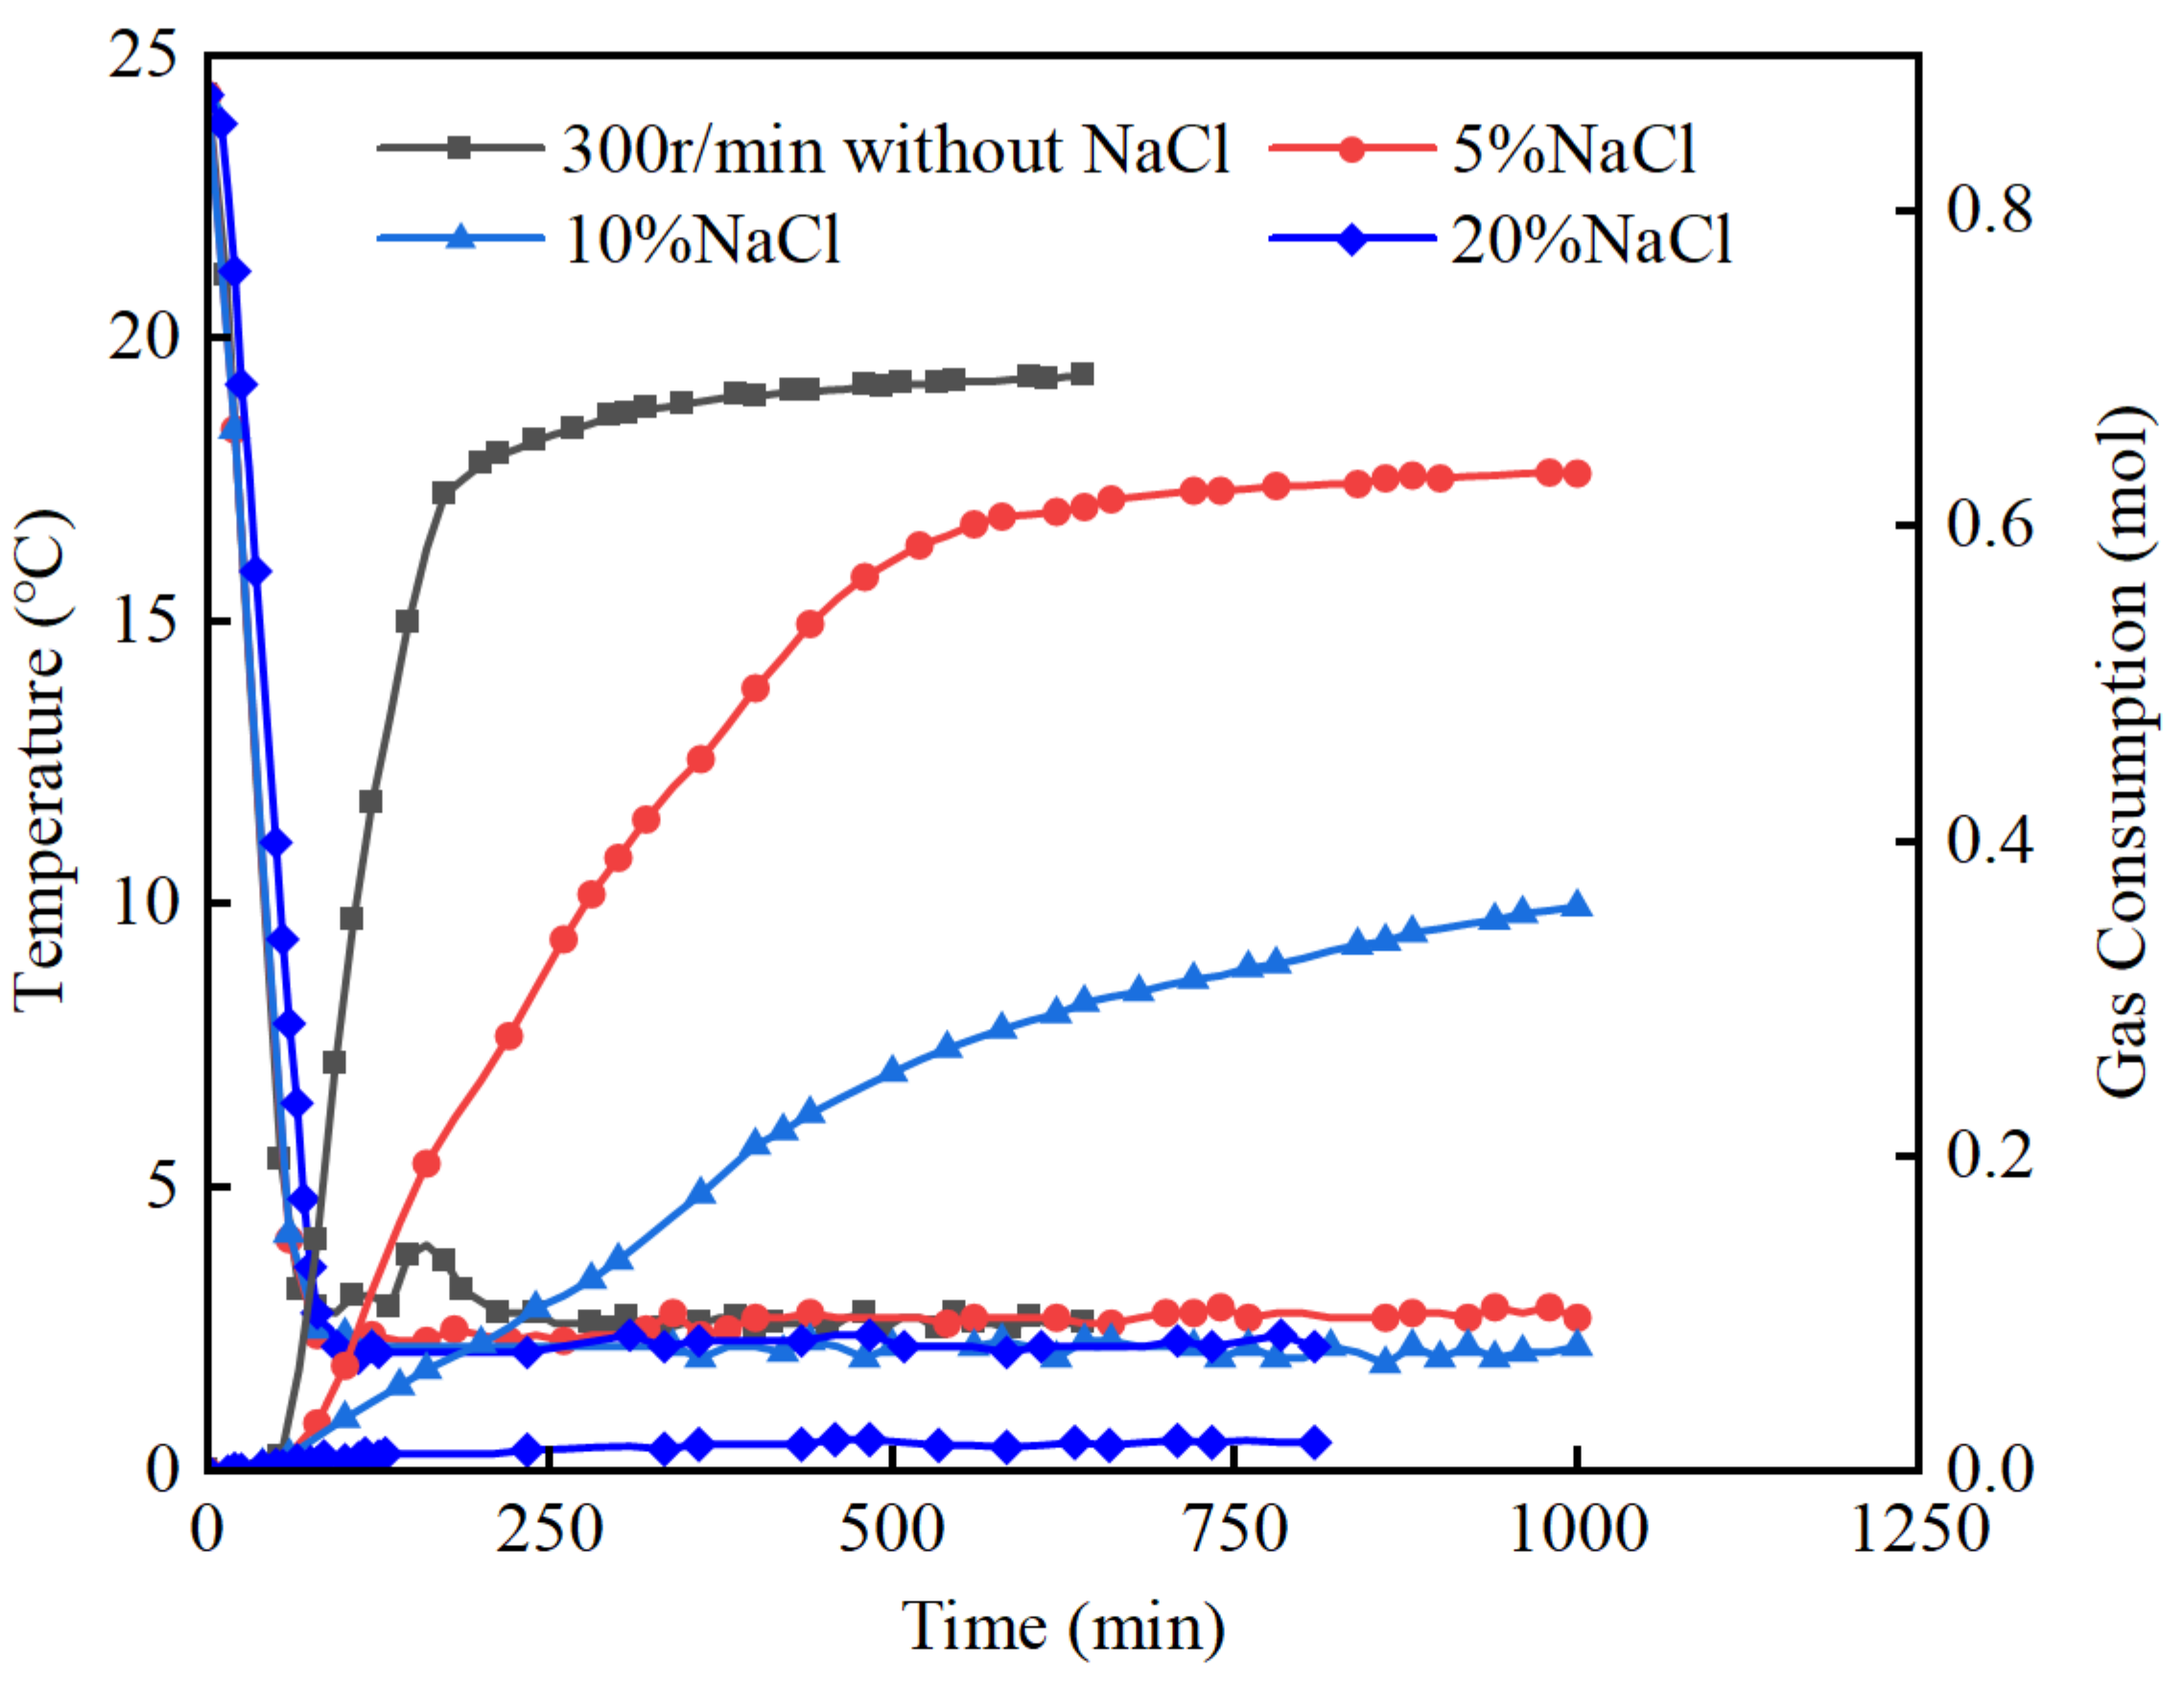
Figure 7.
The pressure change curves during the hydrate formation process in methanol systems with different concentrations.
Figure 7.
The pressure change curves during the hydrate formation process in methanol systems with different concentrations.

Figure 8.
The temperature–gas consumption curves during the hydrate formation process in methanol systems with different concentrations.
Figure 8.
The temperature–gas consumption curves during the hydrate formation process in methanol systems with different concentrations.

Figure 9.
The gas consumption variation curves during the hydrate formation process in systems with NaCl and methanol.
Figure 9.
The gas consumption variation curves during the hydrate formation process in systems with NaCl and methanol.

Figure 10.
The pressure change curves during the hydrate formation process with different quartz sand contents.
Figure 10.
The pressure change curves during the hydrate formation process with different quartz sand contents.
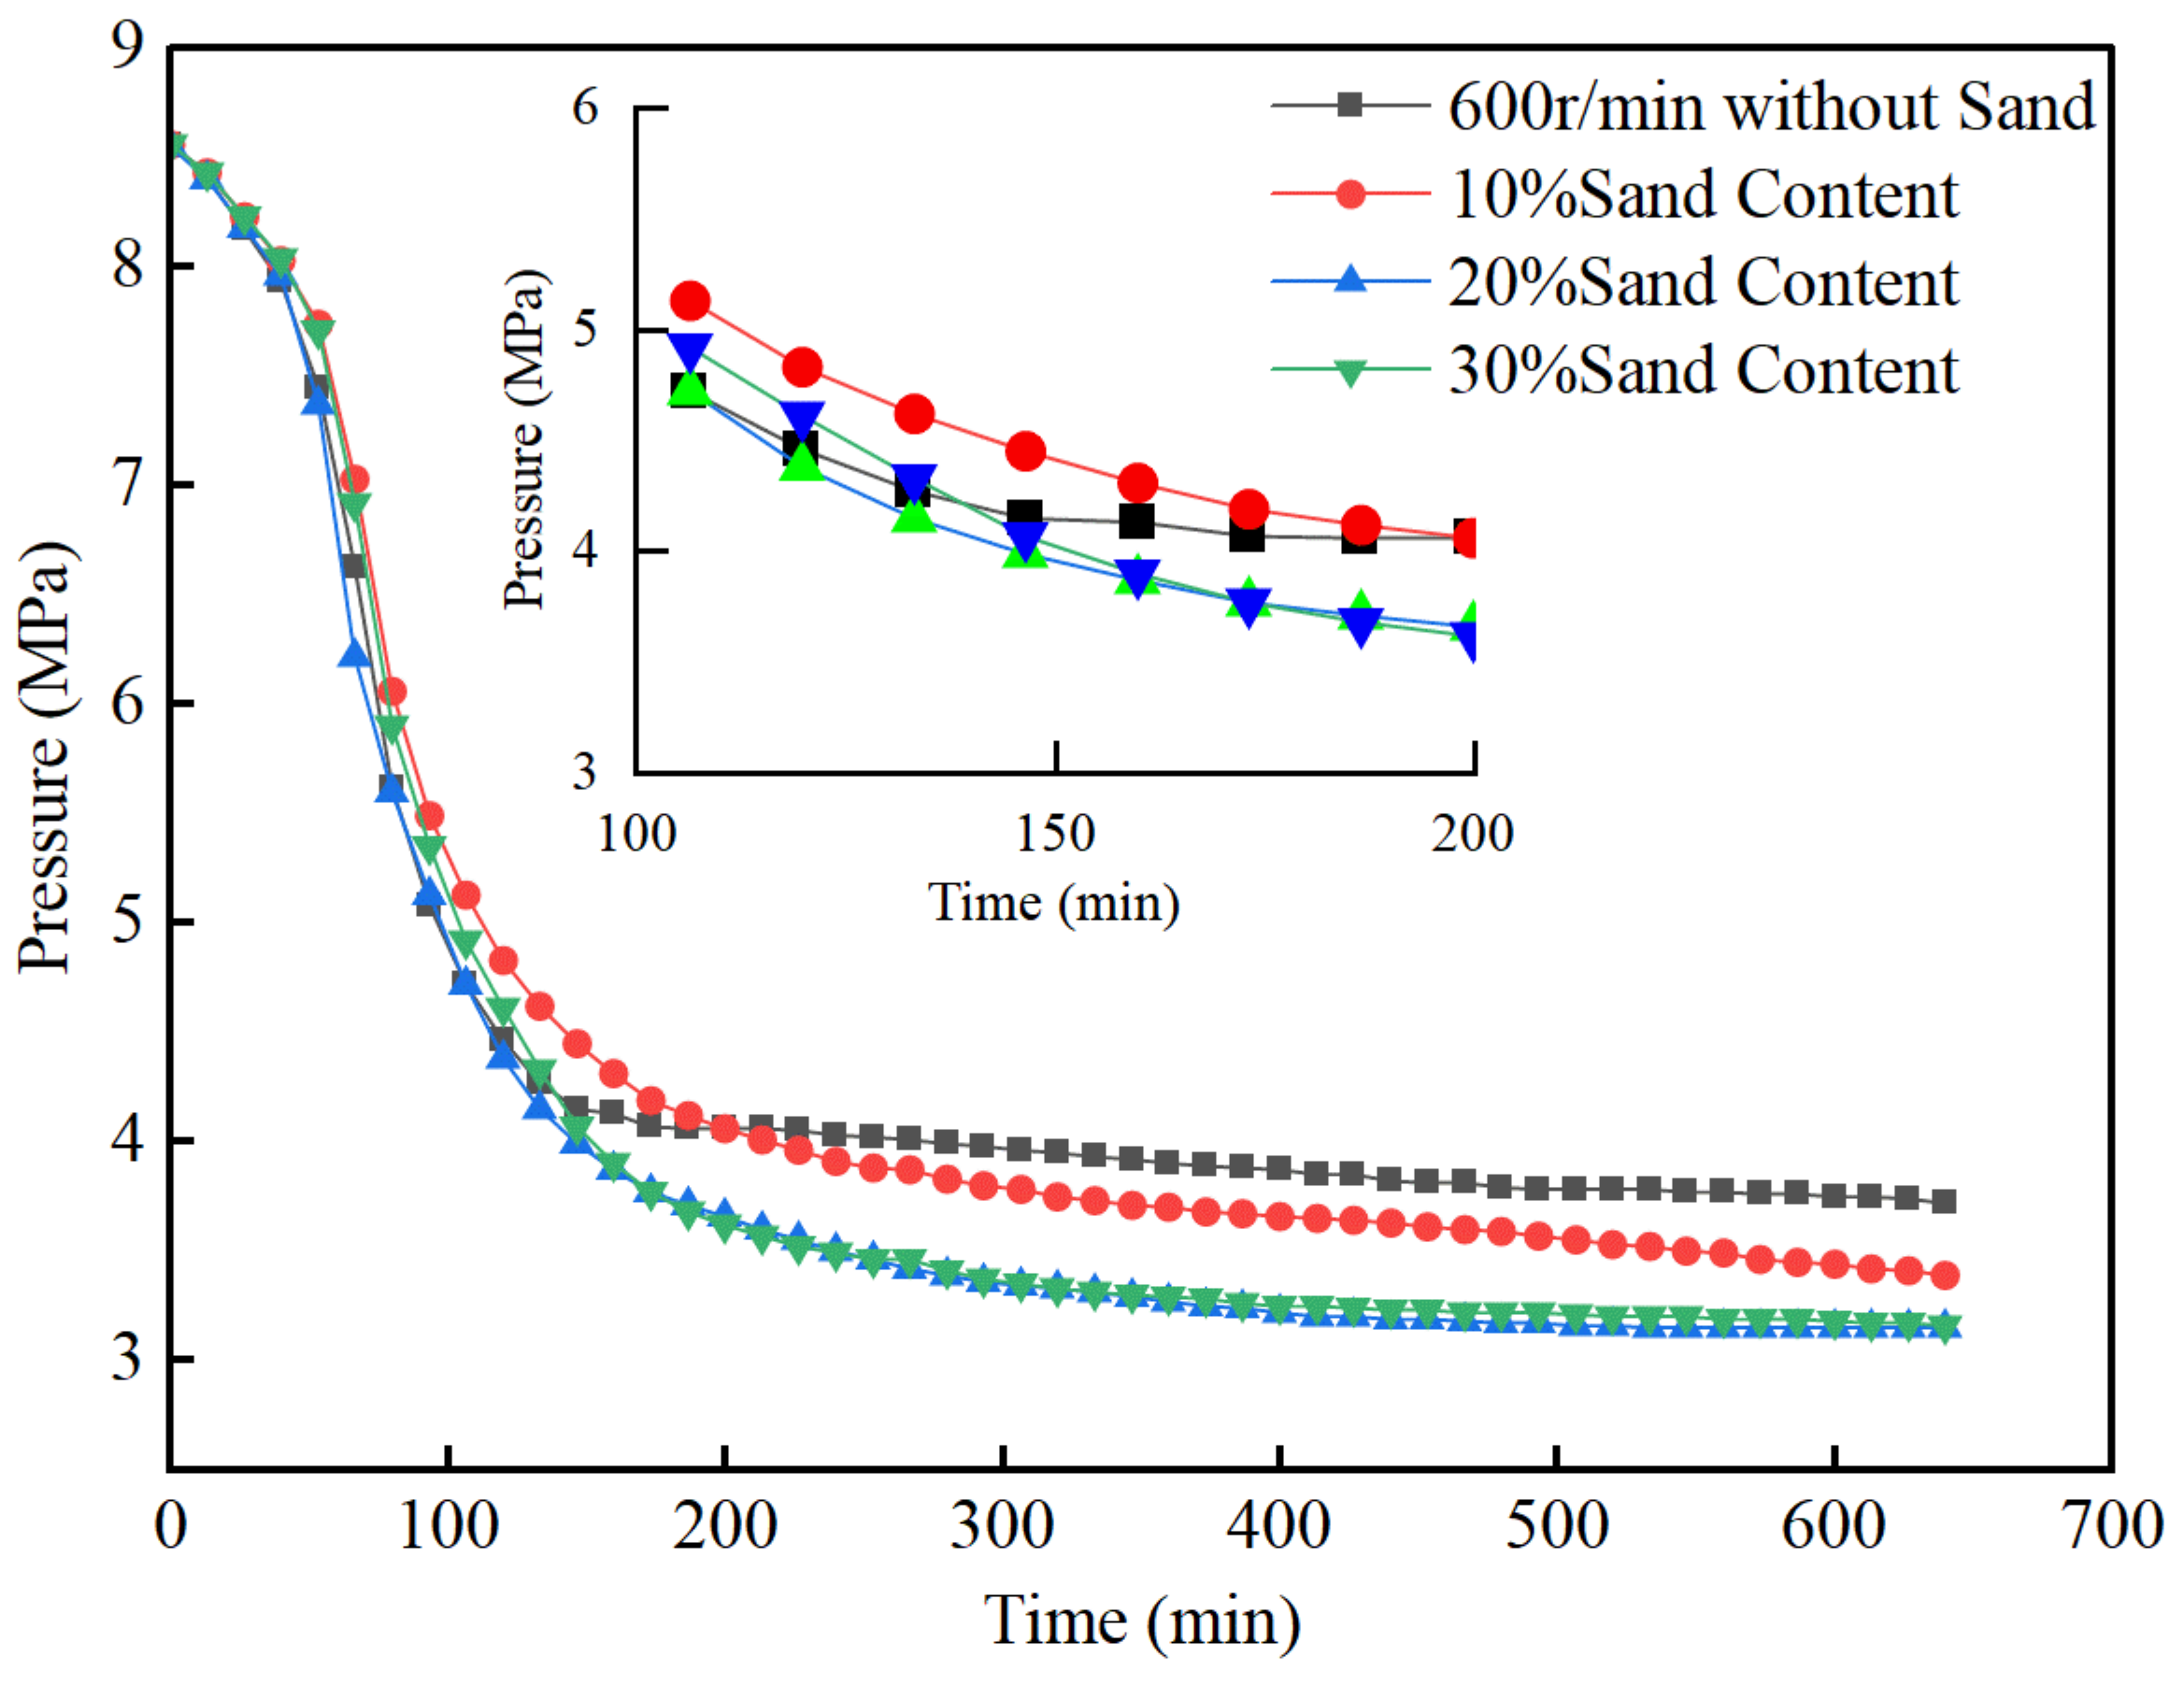
Figure 11.
The temperature–gas consumption curves during the hydrate formation process with different quartz sand contents.
Figure 11.
The temperature–gas consumption curves during the hydrate formation process with different quartz sand contents.


Table 1.
Hydrate formation experimental materials.
| Name | Standard | Source |
|---|---|---|
| deionized water | 18.2 MΩ.cm (25 °C) | Laboratory |
| methane | Purity ≥ 99.999% | Qingdao Xinkeyuan Technology Co., Ltd. (Qingdao, China) |
| NaCl | AR | Sinopharm Chemical Reagent Co., Ltd. (Shanghai, China) |
| methanol | AR | Sinopharm Chemical Reagent Co., Ltd. |
| quartz sand | - | Laboratory |
Table 2.
Quartz sand grains’ physical properties.
| Project | Unit | Data |
|---|---|---|
| specific gravity | g·cm−3 | 2.66 |
| Weight | g·cm−3 | 1.75 |
| Porosity | % | 43 |
| Mohs hardness | / | 7.5 |
Table 3.
Hydrate formation experimental conditions.
| Serial Number | Constituencies | Content |
|---|---|---|
| 1 | Control group (quiescent) | Deionized water |
| 2 | Stirring Rate | 300 r/min |
| 3 | 600 r/min | |
| 4 | 1200 r/min | |
| 5 | Inorganic salts | 5% NaCl |
| 6 | 10% NaCl | |
| 7 | 20% NaCl | |
| 8 | Alcohol | 5% methanol |
| 9 | 10% methanol | |
| 10 | 20% methanol | |
| 11 | Quartz sand | 10% Sand content |
| 12 | 20% Sand content | |
| 13 | 30% Sand content |
Disclaimer/Publisher’s Note: The statements, opinions and data contained in all publications are solely those of the individual author(s) and contributor(s) and not of MDPI and/or the editor(s). MDPI and/or the editor(s) disclaim responsibility for any injury to people or property resulting from any ideas, methods, instructions or products referred to in the content. |
© 2024 by the authors. Licensee MDPI, Basel, Switzerland. This article is an open access article distributed under the terms and conditions of the Creative Commons Attribution (CC BY) license (https://creativecommons.org/licenses/by/4.0/).
Share and Cite
MDPI and ACS Style
Qi, Y.; Gao, Y.; Zhang, L.; Su, X.; Guo, Y. Study of the Formation of Hydrates with NaCl, Methanol Additive, and Quartz Sand Particles. J. Mar. Sci. Eng. 2024, 12, 364. https://doi.org/10.3390/jmse12030364
AMA Style
Qi Y, Gao Y, Zhang L, Su X, Guo Y. Study of the Formation of Hydrates with NaCl, Methanol Additive, and Quartz Sand Particles. Journal of Marine Science and Engineering. 2024; 12(3):364. https://doi.org/10.3390/jmse12030364
Chicago/Turabian StyleQi, Yaqiang, Yonghai Gao, Lei Zhang, Xinyao Su, and Yanli Guo. 2024. "Study of the Formation of Hydrates with NaCl, Methanol Additive, and Quartz Sand Particles" Journal of Marine Science and Engineering 12, no. 3: 364. https://doi.org/10.3390/jmse12030364
Note that from the first issue of 2016, this journal uses article numbers instead of page numbers. See further details here.