Article

Application of Shore Sediments Accumulated in Navigation Channel for Restoration of Sandy Beaches around Pärnu City, SW Estonia, Baltic Sea

1
Institute of Ecology, Tallinn University, 10120 Tallinn, Estonia
2
Department of Cybernetics, Tallinn University of Technology, 19086 Tallinn, Estonia
3
Department of Marine Systems, Tallinn University of Technology, 19086 Tallinn, Estonia
4
Geological Survey of Estonia, 44314 Rakvere, Estonia
*
Author to whom correspondence should be addressed.
J. Mar. Sci. Eng. 2024, 12(3), 394; https://doi.org/10.3390/jmse12030394
Submission received: 14 January 2024 / Revised: 10 February 2024 / Accepted: 20 February 2024 / Published: 24 February 2024
(This article belongs to the Special Issue Natural and Human Impacts in Coastal Areas)

Abstract

:
Sandy beaches high in recreation value make up 16% of the over 4000 km long shoreline of Estonia. The shore processes associated with climate change have remarkably accelerated over recent decades. Many sandy shores have suffered from strong erosion, including an excellent former beach at Valgeranna. The jetties, which were built in the 1860s to protect the navigation channel of Port Pärnu from clogging, have prevented natural sediment transport along the coast from south to north. At the same time, the sandy beach in Pärnu is expanding, and part of the sand accumulates with strong storms also in between the jetties, reducing the width of the shipping channel. The channel needs regular dredging, but, so far, the dredged sediment has been taken far away to the open sea and accumulated on the seabed. The current paper addresses the possibilities of using that sand for beach restoration in destructed and eroded areas. An overview of the applied methods and measurements during field studies is given. The results of modelling the processes of wave activity and sediment transport are discussed. The recycling of shore sediments is an important measure in sustainable coastal zone management. Different options and scenarios are analysed in order to find the most reasonable ways to bring sand back onto beaches and stabilize natural processes. Support from the state by working out respective laws and regulations would be motivating as well.

1. Introduction

Sandy beaches high in recreation value make up 16% of the over 4000 km long shoreline of Estonia. The shore processes associated with climate change (ice-free sea in the cold half-year, unfrozen sediments, and frequent high sea levels) have remarkably accelerated over recent decades. Increased erosion, sediment transport, and accumulation show the adaptation of natural coastal systems to the new climatic conditions. Many valuable sandy beaches (Valgeranna in Pärnu County, Tõrvanina on Hiiumaa Island, and Narva-Jõesuu in NE Estonia) are retreating or have been partly eroded, while the navigation channels of the ports in Pärnu, Lehtma, and Narva-Jõesuu are suffering from intensive clogging with moving shore sediments [1]. So far, the dredging of the shipping channels has been carried out in a way where the dredged material is disposed onto the seabed, far away from the shoreline. Thus, valuable shore sediment is being taken out of the system and will be lost forever.
According to the recommendation of the HELCOM [2], we should, first of all, make sure whether the dredged sediment can be used for preventing beach erosion, the restoration of destroyed beaches, and reducing the threat of inundation, etc. The recycling of these deposits in new infrastructure, for instance, as filling material in railway embankments, is also possible, enabling not to open new sand quarries and preserve the environment There are many places in Estonia where the high-quality sand accumulated in the ports and shipping channels can be used for stabilising the adjacent beaches instead of drowning it onto the seabed. This would avoid the disappearance of recreation areas, the vanishing of valuable habitats, and changing the seashores homogeneous. We can find a lot of good examples worldwide where the sand dredged from navigation channels has been used for beach nourishment and restoration of the seashores, which have suffered from severe erosion. Our closest examples are from the Baltic Sea region [3,4,5,6,7]. Sand nourishments are also a common engineering solution in the Netherlands, England, France, Italy, and Portugal to maintain the coastline position (coastal protection) or for recreation purposes [8,9,10,11,12].
We are focusing on Pänu Bay, which is situated in the NE corner of the Gulf of Livonia, where the main direction of sediment transport is from the south to the north, which is characteristic of the whole eastern coast of the Baltic Sea. Pärnu Bay is exposed to the southwest—towards westerly winds, frequent cyclones, and concurrent storms. The outlet of River Pärnu, one of the largest rivers in Estonia, is within the limits of the city. The sediments in Pärnu Bay move along either side of the bay and accumulate in the bay head at the river mouth (Figure 1). Here, Pärnu is located, the largest city (ca. 40,000 inhabitants) and important port in SW Estonia. Pärnu is known as the “summer capital” of Estonia due to its excellent sandy shore, which is attractive for tourists in summer season, multiplying the temporary number of inhabitants in the city [13].
To protect the entrance channel against frequent clogging, two 2.2 km long jetties were built into the bay on both sides of the river outlet in the middle of the 1860s. Since then, the jetties have performed as sediment traps favouring the accumulation of sand in the bay head, south of the river outlet. A certain amount of longshore sediment transport could reach the northern coast of Pärnu Bay, including Valgeranna west of Pärnu, before the jetties were built. The movement of sand went in both western and eastern directions, keeping the whole system in dynamic balance. A considerable part of that sand is trapped behind the jetties today (Figure 1), resulting in a sediment deficit in Valgeranna.
Nearly 150,000 m3 of high-quality beach sand appropriate for the restoration of the surrounding sandy beaches or use as filling material in new infrastructure (Rail Baltic and Via Baltica, etc.) has accumulated in the Port of Pärnu. The amount of deposits in the port is so large that, after complete beach nourishment in the neighbourhood, over 100,000 m3 of sand would remain in the port, and this amount is increasing by about 5000 m3 every year.
The place name Valgeranna is derived from a white beach consisting of fine-grained sand rich in quartz. Before constructing the Pärnu jetties, there were excellent conditions in Valgeranna for sand accumulation and the formation of a broad sandy beach as a result of longshore sediment transport. The village became a very popular recreation area with relevant infrastructure—summer resorts, accommodation, and cafés, etc. The area could be a multifunctional recreation complex, dispersing the overload of tourists during the peak season in Pärnu. The persistence of the good recreational potential of Valgeranna would be beneficial also for the public.
The current paper focuses on the possibilities of applying the dredged sand from the navigation channel of Port Pärnu to restoring and preserving the surrounding sandy beaches amidst climate change, increasing human impact conditions. An overview of the cost efficiency of different ways for dredging and disposing the sediment to the beaches and the possible impact on the environment is given. Detailed modelling is performed with the aim of working out the most appropriate ways for beach nourishment, in order to give the optimal results for the persisting and functioning of the new beaches. The possibilities of applying semi-natural measures for stabilizing the sand and making the beach more resistant against further erosion in longer perspective are also addressed.
The existing legislation related to beach restoration and the gaps in regulations that need improvement to support the recycling of mineral resources for such kinds of activities are analysed. A brief overview is given of the methods that should be followed to ensure a smooth process in solving the addressed problem.
The paper draws attention to the issue that we should not drown valuable sand like waste in the open sea anymore. The port owners must understand that the sand dredged out from the shipping channels can be used in a much better and more sustainable way, improving the coastal environment in general. In the case of reasonable management, the disposal of sand from the ports can be even profitable. Support from the state by working out respective laws and regulations would be motivating as well.

2. Materials and Methods

2.1. Information about Study Site and Earlier Works

Earlier, more general assessments showed that about 3000 m3 of sand accumulates around the jetties every year and about 100,000 m3 of sediment has accumulated in between the jetties at Pärnu [14]. The accumulated body of sand between the jetties is 115 m wide (Figure 2) and it has grown broader by 85 m since 1999. The remaining width of the seaway is a 110 m wide dredged channel. A major part of the body of sand remains under the water (in the case of the mean sea level), and only its western part emerges above sea level. The area of that sand accretion is from about 3.5 to 4 hectares.
Unfortunately, the hydrodynamically inactive seashore with insufficient sand capacity has been retreating already for a long time due to the predominant erosion. For instance, around the Doberan café in the western part of Valgeranna, the mean velocity of the shoreline withdrawal is 1 m a year. The main factor influencing this process is the wave activity associated with strong storms. The impact of erosion is particularly strong in high-sea-level conditions in the cold half-year, when the sea is ice-free and the sediments are unfrozen.
The study area lies on the eastern coast of the Baltic Sea, where the last glaciation moulded the main features of the topography, which were later smoothed by the waters of the Baltic Sea. Geologically, Pärnu city and the Valgeranna study area are located on varved clays, which are covered with a relatively thin layer of marine sediments (mostly 1–3 m of sand). The varved clays are often exposed on the sea bottom, especially near Valgeranna, where they can be found at a 1.3–1.5 m depth. The lacustrine–marine terrain, with flat, slightly undulating topography and altitudes between 2 and 15 m, surrounds Pärnu Bay. The highest altitudes (up to 30 m) are related to coastal dunes and glacial marginal landforms [15]. The rate of land uplift in Pärnu Bay is approximately 1.7 mm/y [16], which was more or less equal with the global sea level rise at the end of the previous century, but is less than the global sea level rise today. Even more important is the increasing trend of maximum sea levels, which has elevated the highest water level by about 20 cm in this area [17]. At the end of the 1980s and the beginning of the 1990s, the winters turned much warmer with a shorter duration of ice cover, more frequent storms, and higher storm surges [18,19]. This, in turn, activated the shore processes. In many coastal study sites of Estonia, we have faced increasing activity of both erosion and accretion processes [20]. Over the last decade, we can see a certain reduction in the activity of shore processes in most study sites of Estonia, except for Valgeranna. The changes in shoreline position in Valgeranna are even faster than those 30 years ago. This is the result of a combined effect of natural processes and human impact.
A decisive role in the disappearance of sand and destruction of the beach is being played by the Doberan café and its defensive wall of stones. The café was initially built a bit more inland from the zone of wave run up, but, due to the progressive erosion in recent decades, has moved into the area of immediate wave activity. The January storm Gudrun in 2005 destroyed the café entirely. But a new and much larger one was erected instead. The hard defence facility (a combination of vertical concrete walls and rock revetment) is actually performing as a reflection wall for waves, and the backwash has taken a lot of sand into the sea, making the coastal waters deeper and accelerating the shore processes even more. In order to protect the café, the defensive wall has been made longer and the area of intensive erosion has become much broader as a result of this human intervention. Due to the decreasing sand capacity (which is near zero in front of the beach protection today) on the beach and the beach slope, the waves have washed out a lot of sharp-edged stones and the varved clays, which were formerly underlying the sand, cropping out on the nearshore seabed. All these phenomena have made the beach at Valgeranna less attractive for visitors [21].
There are basically two options to preserve the infrastructure at Valgeranna: (a) the expansion of the defensive facilities (e.g., rock revetments) in the eastern direction; and (b) the restoration of the beach by beach nourishment and the detention of sand on the beach. The first option would destroy the beach completely but preserve the infrastructure. For the second option, finding a sufficient amount of sand with a suitable grain size and mineral composition characteristics would be crucial. There is a high probability that the sand with appropriate characteristics for beach restoration in Valgeranna can be found in between the jetties of Port Pärnu [14].

2.2. Methods

Geomorphic studies of seashores are usually primarily based on the comparison of maps from different times. We used the one-verst map from 1904, aerial photographs from 1963, 1973, and 1993, and also orthophotos from the period 1999–2022. Based on the comparison of maps, aerial, and orthophotos, we determined the earlier changes in shoreline positions and contours, as well as the location and dimensions of the submarine body of sand between the jetties in Pärnu. The Mapinfo Professional 11 programme was used in a cartographic analysis and the ArcGis application ArcMap 10.8 was employed in certain procedures. In parallel with the cartographic data, the earlier beach profiles created in the frames of the coastal monitoring programme were also used. This helped us to digitize the shoreline positions more precisely. BK77—the Baltic height system, which was recently used in Estonia—was the base in the analysis of the data obtained from both the maps and the field measurements. This system described the mean water level in Pärnu Bay and the shoreline position better than the currently used EH2000 (the Amsterdam height system).
In total, 19 cross-shore beach profiles were created in the Valgeranna study site. The profiles begin inland out of the wave activity zone, and end on the beach slope at depths of 1.6 to 1.7 m below sea level (Figure 3). A major part of the underwater sections of the profiles covers the area with dynamic sands and reaches depths where stable varved clays are exposed on the seabed. The Leica CS09 RTK-GPS, with accuracy of ±2 cm (both vertical and horizontal scales), was used for this. The survey was carried out in April 2020 and 2022. Some of the profiles were also compared with the cross-shore profiles of the National Coastal Monitoring Programme, which were measured earlier in the same locations. The volume changes along the profiles were calculated for different time periods and the types of shore sediments were determined. To describe the body of sand in between the Pärnu jetties, 8 cross-profiles were created and the elevations were measured at nearly 500 points. The profiles and the measured elevation points helped to describe the body of sand, and additionally, sediment coring results, geophysical surveys, side-scan sonar data, and the knowledge that the initial ship channel was dredged up to a 5 m depth helped to determine the volume of accumulated deposits. LiDAR data were used to estimate the sand volume in the dunes, which were accumulated east of the jetties. This region was basically at sea level before the dune formation.
An auger hand drill with an engine was used to measure the thickness of the body of sand in between the jetties. Georadar profiling was also performed there using Impulse radar C0730 with a dual-frequency antenna (80/300 MHz).
Two sediment samples were taken from each profile in Valgeranna. One sample was taken from the middle of the beach and the other from the beach slope with a grab bucket from depths of about 0.5 to 0.7 m. Samples for a grain size analysis were also taken from the body of sand in Pärnu—4 samples from its underwater part and 1 sample from above the water level. The grain size of mineral deposits was determined using the dry screening method. Fritsch Vibratory Sieve-ShakerAnalysette 3 PRO screening complex was used with sieve dimensions of 2000, 1000, 500, 250, 125, 63, and 36 μm. The selection of sieves was based on the commonly used methodology for coastal studies in this region [22].
The organic compounds and pollutants were analysed from the body of sand with the aim of ensuring the suitability of the sand for the Valgeranna beach nourishment, but also for other purposes. In the laboratory of the Estonian Centre for Environmental Studies, the following elements and compounds were analysed: Cd, Cr, Ni, Pb, Sr, Zn, Cu, and Hg. The contents of heavy metals and petroleum products, as the most frequent pollutants in ports and harbours, were determined. The contents of organic and mineral matter were determined by heating in a thermogravimetric analyser Precisa prepASH 340 Series. The organic matter was extracted by heating the samples at 550 °C [23] until constant mass was achieved. The results are expressed in both volume percentage, as well as weight per volume (kg/m3).
Geophysical studies of the seabed were carried out in cooperation with the Estonian Geological Survey. The plane coordinate system L-EST97 was used to determine the locations of the profiles. The European Vertical Reference System (EVRS) EH2000 (Amsterdam Ordnance Datum) was used as the height system. A geodetic network-based measuring device, RTK-GPS GNSS Trimble R8, was used to fix the exact locations for geophysical profiling. The survey contained continuous profiling of the transects by a seismo-acoustic low-frequency Boomer (SIG France Pulse S1/Meridata), medium-frequency Chirp (Airmar MD DSS/Meridata), and high-frequency Pinger (Echotrack/Meridata) sediment profiler and a side-scan sonar. A dual-frequency (400/900 kHz) side-scan sonar (SonarBeam S-150/Meridata) was used for mapping the seabed sediments. The data were saved in Meridata file format.
For calculating the volume of beach nourishment, we used a cartographic analysis (shoreline changes over time intervals) and beach profiles. The profile No. 5 is a good example of a near-equilibrium state of a beach profile (instead of using theoretical values). The total sand volume needed for nourishment was calculated based on the need to reach the equilibrium state also on the profiles with predominant erosion. As the need for sand decreases in the eastern direction, the need for beach nourishment also linearly reduces in this direction.
The waves in Pärnu Bay were measured using wave buoys LainePoiss (www.lainepoiss.eu accessed on 1 January 2023). The devices recorded acceleration data with a 50 Hz sampling frequency, from which wave heights, mean wave period, and mean wave direction were derived in every 22 min. The exact procedures for converting the acceleration signal into surface waves are given by Alari et al. [24]. The measurements were performed in autumn of 2021 and 2022. This relatively short period was due to the duration of the project. However, we managed to measure the waves during the stormiest seasons of the year. The locations of the measurement points are shown on the map (Figure 1). There has not been any public wave measurement campaign in the area before.
The waves were modelled using the SWAN (version 40.11) wave model [25] in Delft3D suite (WAVE module). SWAN is a third-generation phase-averaged spectral wave model developed at Delft University of Technology. We used the default model settings in a three-level nested scheme of regular rectangular model grids. A coarse model was run for the Gulf of Riga on a grid with a step of 1000 m (covering the area of 170 × 180 km). The second-level grid covered the Bay of Pärnu with a step of 200 m (20 × 14 km). The third-level grid concentrated on Valgeranna with a step of 50 m (9.0 × 5.5 km). The resolution of the third-level grid was evidently fine enough to replicate detailed properties of the waves in the vicinity of Valgeranna. The bathymetry was taken from the local measurements and databases of the Estonian Transport Administration, the Baltic Sea Bathymetry Database by the Baltic Sea Hydrographic Commission (http://data.bshc.pro/legal/ accessed on 5 September 2023). The wave model was forced with locally measured winds at Kihnu, Pärnu, Mõntu, Ruhnu, and Vilsandi. These stations are operated by the Estonian Environment Agency. Automatic systems were installed in all stations in 2003. The Kihnu station is sheltered by the forest in the north and east, but is open to the west and south. It has been operating since 1931. Digitised records are available since 1958, when the wind speed and direction were measured four times a day. Water levels were taken from Pärnu (source: Estonian Environment Agency), where water levels have been measured hourly for more than 60 years.
After the validation of the wave model (selecting the most suitable wind source), we proceeded with the modelling of sediment transport in 8 different layouts of coastal structures (groynes and detached breakwaters) and nourishment schemes. The morphological response of selected conditions was explored by using the modules WAVE and FLOW of the Delft3D. The results of the WAVE module (three-level nested grids) were used to force the FLOW model, covering an area of 7.7 × 1.8 km with a varying resolution from 44 m to 14 m, being densest near the shoreline. We used the default settings in the hydrodynamical FLOW module, with the water level as the boundary condition in the south and the Neumann boundary condition in the west and east. Groynes and detached breakwaters were modelled as thin dams (impermeable and infinitely high walls) in the FLOW model.
In order to assess the performance of coastal structures, we modelled the movements of nourished sediments in different scenarios (layouts of structures) and wave conditions. For specifying these conditions, we examined the joint distribution of winds and water levels. The selection of the nourished sand’s median sediment diameter (D50), 0.2 mm, was based on field measurements. The sand was nourished in three different locations: (i) in the east from Doberan café, (ii) in the west from Doberan café, and (iii) in the sea. In all these cases, the volume of sediments was between 10,000 and 20,000 m3 and the thickness was constantly 1 m. For every simulation, the percentage of loss of sand was calculated and compared with the others.

3. Results and Discussion

3.1. Sediment Budget

The cartographic analysis of the maps over the period of 1904–2022 shows a certain change in the orientation of the shoreline in Valgeranna. Over 120 years, the shoreline has shifted by about 5 degrees—from NE–SW to E-W. The shoreline retreat in different parts over the mentioned time interval is shown in Figure 4. In the western part of the study site, we can see extensive withdrawal of the shoreline (Figure 4A), while in the eastern part, the development direction is the opposite (Figure 4B). Table 1 gives an overview of the shoreline retreat dynamics. The area of changes in different beach sections is summed up, and based on the lengths of the beach sections, the average changes over different periods are calculated.
If the comparison and analysis of maps from different times makes it possible to see, first of all, changes in area, the profiles also reflect changes in volume, showing the amount of moving sediments, which is a very important characteristic, for instance, in planning beach protection (Figure 5). In all profiles, the beach width above mean sea level is about 20 m, and intensive retreat of the beach escarpment since the beginning of the past decade, when there were a number of strong storms in high-sea-level conditions, is visible almost everywhere [26,27]. The foot of the scarp on the retreating beach is located only from 1.3 to 1.5 m above sea level, making it highly vulnerable in the case of strong storms. The café with a protecting seawall, which is built too close to the shoreline, strongly influences the changes on the beach, both in area as well in volume. Directly east of the café, we cannot find any dry beach today. Only moving underwater sandbars on the beach slope can be observed (Figure 4). The profiles in the easternmost part of Valgeranna show a pretty wide (over 40 m) beach, indicating that the shore closer to the jetties is in a rather good state. The underwater sandbars there are larger, showing a much better sand supply on the beach slope. The dune ridges bordering the beach from the land side are also higher and are covered with vegetation. A considerable part of the sand coming there by longshore sediment transport is blown by wind to the dunes, especially on the seaward section of the dunes, which are mostly without vegetation cover (Figure 4B). The jetties prohibiting the sediment supply from Pärnu direction may cause a sand deficit over a longer time period in the easternmost part of Valgeranna beach. The negative impact of the Doberan café is particularly visible in its vicinity (about 450 m to the west and 600 m to the east), and the rate of the annual erosion of sand is about 1000 m3. The loss of sand is calculated based on shoreline changes and profiles, also confirming the results of the previous work [21].
The grain size analysis of Valgeranna sand shows that the seabed deposits are finer-grained (median values mostly 0.12–0.2 mm) than the deposits on the beach (median values mostly 0.2–0.24 mm). This is usually caused by a combined effect of wind and wave activity on the beach. The waves and wind take finer particles either to the beach slope or blow to the dunes, and the coarser material remains on the beach. In the vicinity of the café, the grain size is particularly high, reaching 0.7 mm on average (Figure 6A). This can be explained as a result of very strong erosion around the café, where almost all finer particles have been washed out, and only stones, pebble, gravel, and coarse-grained sand has remained, most of the time being below sea level.
It is often emphasized that, in case of beach nourishment, the refilling sand should be based on a grain size as similar to the former one as possible. Comparing the granulometric composition of the sand from the accumulation area between the jetties (with median value 0.2–0.3 mm in the underwater and 0.37 mm in above the water level parts (Figure 6B)), we can conclude that these deposits are quite similar to the initial sand in Valgeranna. This is obvious, because before the jetties were built, the whole area was a uniform litho-hydrodynamic system.
The body of sand accumulated between the jetties at Port Pärnu has expanded by about 100 m (2 m/yr), and the area with dunes east of the jetties has grown by about 26,000 m2. At least 50,000 m3 of sand has been accumulated in the dunes over about 50 years, making the mean velocity of accretion ca. 1000 m3 a year. Strong storm winds and waves take the sand over the jetties and deposit the material near the navigation channel in the form of a body of sand, which is slowly expanding towards the port. The drilling results show a nearly homogeneous beach sand in the accumulated body of sand that does not contain a notable amount of river sediments. The configuration and dynamics of that body of sand are also influenced by the river flow. The effective capacity of sand in this formation is about 146,000 m3, and it is annually increasing by nearly 5000 m3.
In addition to the appropriate physical characteristics of the sand for beach nourishment, the other important factor is its purity. The sand should be safe in terms of chemical properties and should not contain too many organics. The chemical analysis showed that the amount of such adverse elements in most of the sand samples was below the determination limit. Consequently, the sediments are clean enough in this area. Even if certain traces of adverse elements were found, in most cases, their content was dozens of times below the target number. The content of organic compounds on the surface of the sand-body is very low (0.11–0.32%). A typical natural sandy beach contains some organics almost everywhere, due to the sea or some other organic material accumulating on the beach and slowly decomposing there.
The combination of data from the beach profiles and the profiles of the geophysical survey in Valgeranna (Figure 7) show the existence of sand on the sea bottom to a 1.3–2 m depth. Varved clays crop out in deeper waters. As varved clay is more resistant against erosion than sand, the seaward parts of the beach profiles are rather stable and reduce beach erosion over a longer time period. Based on all the previous analyses, the eroded section of the beach at Valgeranna would need approximately 30,000 m3 of sand to achieve a new equilibrium state. It is also important to know that the geological conditions at Valgeranna are favourable for building wooden groynes in order to keep the sand on the beach for longer.
There is much more sand and the grain particles are coarser in the eastern part of the study site. The geophysical profile shows the existence of glacifluvial deposits on the nearshore sea bottom, the surface of which is eroded, and the sediments are partly taken onto the beach by waves. The signals of geophysical devices were disturbed in the Pärnu shipping channel. This may be caused by the results of dredging the channel or if the muddy bottom sediments contain some gas. But an important fact is that the sands there are also underlain by varved clays. The side-scan sonar showed the absence of an abrupt slope, which is characteristic of a typical navigation channel, but a slight slope instead, indicating the accumulation of sand coming over the jetties during strong storms. The bottom of the navigation channel needs more studies before a final dredging project in order to ensure the properties and quality of the deposits with the aim of their utilization either for beach nourishment or as filling material in road construction.

3.2. Assessing Scenarios for Beach Nourishment at Pärnu–Valgeranna Site

To prevent erosion and compensate the eroded sediment by filling the beach, the procedure is often repeated after certain time interval. It depends on the magnitude of erosion (m3/per m of shoreline) and the cost of the work. A 5-year interval is considered as the most appropriate time span today [6,28,29,30]. If the sand must be transported from afar or new quarries must be opened, the sand use may not be environmentally friendly.
For our study, the sand for beach restoration can be taken from the sea. If the sand is taken from the open sea, the mining area should be far enough from the shoreline in order not to negatively influence the shore processes or coastal ecosystems [26]. In the case of Estonia, where the waves are short and tiny, the sand could be taken a couple of km from the shoreline and from at least a 5 m depth. Combining the dredging of a navigation channel with beach nourishment could be a particularly reasonable solution, being one of the most cost-effective options with no risk of a negative influence on shore processes.
If the sand is accumulated in a shallow nearshore water, about 20–30% of the amount may move onto the dry beach in about 5 years [30]. If the sand is put onto the dry beach, it will spread out along the beach profile over a time interval. A balanced beach profile depends on the wave climate and grain size of the sediment on the beach. A considerable amount of deposits move from the beach into the sea. Such a redistribution of deposits along a cross-shore beach profile makes the shore less sensitive to future erosion.
Based on our previous theoretical knowledge, three principal scenarios of taking the sand from between the Pärnu jetties to Valgeranna were analysed (Table 2).
The first scenario was focused on using a Watermaster-type pump dredger to pump the deposits first to a draining area, and after that, to take them to the beach by road transport. Initially, a simple and cheap solution proved to be one of the most complicated and expensive ones after a detailed analysis. As a free storage area in the territory of Port Pärnu does not exist and nature conservation restrictions are imposed around the port, the sand should be pumped onto the beach nearly 1 km from the port. Pumping over such a long distance reduces the efficiency of the activity and makes the procedure very slow and expensive. For example, to take about 30,000 m3 of sand to Valgeranna, the procedure would take about three months (24 h a day) and would cost EUR 270,000.
The second scenario analysed the possibility of using a dredger. The sand would be pumped directly onto the dredger, then it would sail to Valgeranna as close to the beach as possible, and the sand would be pumped either onto the beach or beach slope through a pipeline or as a “rainbow flow” under great pressure. As the nearshore at Valgeranna is very shallow (the 2 m isobath is 250 m off the shoreline), a dredger with very little draft can be used. A rainbow flow pumping method would have a great negative impact on local fisheries and it would be complicated to obtain permission for this. Consequently, the remaining option is using a pipeline method, which is more expensive and dependent on weather. At the same time, this method is the quickest (work can be completed in a week) but less flexible, for instance, in the case of a stormy period when the procedure must be stopped for many days. This method would be problematic for both beach restoration as well as constructing some objects of infrastructure. It needs an intermediate storage area, which is actually missing. The cost of the restoration of the beach at Valgeranna using a dredger may remain a bit below EUR 200,000 in the case where everything is functioning perfectly.
The third scenario is the most classical one. An excavator would dredge the seaway and the sand would be accumulated in an intermediate storage area by the road. After draining, the sand would be carried to the destination (either for beach nourishment or for infrastructure) by road transport. An analysis of this method gave a surprising outcome. The amount of sand needed for the restoration of the beach at Valgeranna can be transported during about two weeks and the cost would be the lowest (a little over EUR 150,000). The method is flexible enough, making it possible to stop the work in the case of a strong storm or a rapid sea level rise. At the same time, the dredging could be scheduled much better in order to carry it out according to particular needs.
One must keep in mind that, based on the cartographic analysis and the measurement data, the accumulation of the sand on the beach must be coordinated with the measures hindering or preventing sand movement both along and across the shore. Planting the dunes with vegetation would help to reduce cross-shore sediment movement, but groynes would be the most efficient measure against longshore sediment transport.
Building groynes, which are barriers shorter than jetties, helps to efficiently prevent longshore sediment transport. This measure is usually applied simultaneously with beach nourishment [31,32,33]. Groynes made of wooden dowels, fitting the coastal landscape much better than other protective facilities [34], could be used in Valgeranna. The length of the groynes and the distance between them must be determined very precisely. This is a very complicated task needing comprehensive technical preparation to avoid undesirable results. Breakwaters or other similar kinds of barriers would not fit the landscape in Valgeranna.
In parallel to a building process, monitoring should be carried out. Monitoring is an important component in studying the dynamics of sandy beaches. The laser-scanned elevation data, obtained from the Estonian Land Board, can be used for that purpose. The data need pre-treatment for the assessment of changes in the volume of the deposits. The other option for following the changes on the beach is classical regular monitoring along the measured beach profiles. The latter should be performed twice a year—in spring after the snow and ice have melted and in autumn before the stormy period. Actually, the combination of these two methods might give the best results—laser scanning on the beach and the profile method on the shore slope. Based on this information, we can see when there is a need for re-nourishment (also the possible volume of re-nourishment) and if the number of groynes must be changed. The most important aim of monitoring is to avoid a situation where scarp recession returns.

3.3. Waves and Sediment Transport in Valgeranna

The wave measurements during the first period in 2021 showed mean significant wave height values of 0.25 m at the point nearer to the shore and 0.34 m at a more distant point (Figure 8). The maximum wave height reached 2.1 m at both measurement points. During the longer measuring period in 2022, the obtained nearshore mean significant wave height value was 0.26 m and the maximum one was 1.8 m. The respective values at the more distant point were 0.31 m and 1.9 m. Short waves with periods of 2–3 s prevailed, which is characteristic of semi-enclosed bays. The mean wind velocities at the Pärnu and Kihnu observation stations during the largest measured waves were 14 m/s and 15 m/s, respectively, and the southerly wind gusts reached 20 m/s. This is a moderate autumn storm in this study area.
As the measurement period was short, although the stormiest seasons were covered, we compared the measurements with previously modelled results. Najafzadeh et al. [35] modelled the wave climate in the Gulf of Riga and in Pärnu Bay in 1990–2021 in ice-free conditions with a constant water level. The grid resolution in Pärnu Bay was ~300 m. They concluded that the 99th percentile and maxima of significant wave heights were about 0.75 m and 1.5 m, respectively, in the study area. This corresponds well with the measurements, although direct comparison is not possible due to the different time frames and influence of water levels on wave heights (measurement points were in 3–4 m water depth).
The modelled significant wave height Hs and mean period corresponding to the first spectral moment, Tm01, forced with recorded winds from Kihnu, showed the best match with the field measurements at both points (Figure 9). Considering the whole measurement period, bias between the measured and modelled Hs was −0.02 m, with a root mean square difference (Drms) less than 0.12 m and a correlation more than 0.88 (Figure 8). The modelled Tm01 for a Hs higher than 0.25 m overestimated the measured values (bias at Kihnu was less than −0.32 s, Drms < 0.83 s). The correlation was weak over the whole period, but stronger (more than 0.40) for higher waves. Based on this analysis, we used the SWAN wave model with homogenous wind forcing from Kihnu to model the sediment transport and evaluate the wave parameters for coastal facilities in Valgeranna.
For narrowing weather cases for sediment transport modelling, we applied the well-known feature that southwestern winds pile up the water masses in Pärnu Bay [17,36]. In this situation, high waves caused by southern and western winds can approach the shoreline of Valgeranna. Thus, there is a strong correlation between high waves and water levels. According to the measured southwestern winds (directions 180°–270°) and simultaneous water levels, the correlation factor is 0.63. Other directions cause lower waves and are accompanied by lower water levels. Hence, they are not relevant for morphological changes. We simultaneously applied different percentiles (70%, 90%, 95%, 99%, 99.75%, and 99.9%) of Pärnu water levels and southwestern winds measured at Kihnu. These percentiles represent conditions which take place at certain hours in a year (Table 3). By multiplying those values with the simulation length (1 day) and morphological factor 10, it is possible to evaluate the probability of such events and assess their patterns. Of course, it is highly unlikely that, in those scenarios applied, a constant wind speed and water level are maintained during 240 h. In reality, the conditions are intermittent and varying, but this makes their modelling complicated, as the number of sequences of simultaneous water levels and winds is infinite. However, as the sediment transport modelling shows, it is possible to compare different scenarios qualitatively.
Table 4 gives a description of the applied scenarios and Figure 10, Figure 11 and Figure 12 show examples of the outcomes of the morphological simulations with Delft3D. Table 5 shows the loss of sand in the simulations. It appears that, without any structures, the nourished sand in the east is lost fairly fast (loss is higher for all percentiles in scenario 03x). Essentially, in 1.5 years, 51% of nourished sand is lost. However, if groynes (scenarios 11x, 13x, and 14x) or detached breakwaters (15x) are built, the loss is reduced to, in this case, as low as 24%. With increasing storminess (higher percentiles), the sand will be carried away to the east from the study area and will not accumulate behind the groynes.
Naturally, the spacing to length ratio plays an important role in the effectiveness of groynes. A higher ratio (longer gaps between groynes; scenario 14x) increases the speed of erosion with an increase in storminess (higher loss with stronger storms).
The Doberan café is currently functioning as a semi-natural groyne, keeping the beach west of the café in a good balance. This example is a good indication that even short groynes with a relatively high spacing distance might be quite efficient in Valgeranna. Therefore, we suggest building less groynes in the first phase (three groynes; Figure 13) and reducing the spacing of them in a later stage (add two more groynes) if the monitoring results suggest that the spacing is too large and significant erosion continues.

4. Conclusions and Suggestions

The shoreline of Valgeranna has shifted by 5° from the NE to the east over the last 120 years. This may be caused by the Port Pärnu jetties, which were erected over 150 years ago, prohibiting longshore sediment transport. The sediments moving from Valgeranna in the eastern direction are also partly trapped behind the western jetty. The increase in maximum sea levels has exceeded the rate of land uplift by about 20 cm over the past century. In addition, the Doberan café and its nearly 150 m long stone wall to the east, protecting its infrastructure, have accelerated the erosion process even more. As a result, the shoreline east of the café is retreating by 1.3 m a year, and a considerable part of the beach has lost its sand entirely, making the beach unattractive for tourists.
At the same time, the sand moving from south to north by longshore sediment transport is accumulating on Pärnu beach, but also in between the jetties. About 146,000 m3 deposits have accumulated already and ca. 5000 m3 are attached every year. As a result, the navigation channel is becoming narrower by 2.5–3 m annually. The waterway needs regular dredging, but so far, the dredged sand has been poured into the sea. Instead of this, the sand of high quality can be used for the restoration of the destroyed beaches around Pärnu.
Ca. 30,000 m3 of sand would be needed to restore and stabilize the Valgeranna beach. The sand from between the jetties would be suitable for this purpose in terms of its granulometric and mineral composition, low content of organic components, and colour. Three different possibilities of sand transport were considered: (1) combining pumping the sand by a pump dredger to an intermediate storage area and carrying it to the destination by road transport; (2) using a smaller dredger for dredging and pumping the sediment onto the beach; and (3) using an excavator and road transport. The cost of the listed options would not differ very much, but due to the low efficiency of the pump dredger, its use would not be temporally realistic. Using a dredger would not be environmentally friendly (particularly during the pumping period near the shore), is not very flexible, and depends a lot on weather conditions, making the whole procedure more expensive. The most realistic solution would be to carry the sand through an intermediate storage area (for drainage) by road transport to Valgeranna. This would make the sand easier to use also for constructing some other objects of infrastructure. The permit for dredging might be valid for at least 10 years to ensure the sufficient capacity of the sand and a good state of the navigation channel.
To prevent the sand accumulated on the beach from moving back towards the port, groynes should be erected on the beach and beach slope, but also consolidation of the sand on the backshore should be applied by artificially growing the dunes and using the branch braids or plant roots to protect the backing scarps against erosion. These measures can be used also in some other ports and harbours in Estonia like in Lehtma, Nasva, Andineeme, and Narva-Jõesuu. The method would substantially expand the geography of sand supply and reduce adverse impacts on the environment.
A number of legal problems arose during the study. One critical question is associated with the property of the dredged sand. It was particularly important if the dredged sand would give profit to the local authorities. The existing laws need some elaboration, with the aim of giving to the local authorities the right to initiate and plan activities on the seashores at least 1–2 nautical miles from the mean shoreline and to 2 m depths. Currently, the power of the local authorities is limited in terms of the shoreline. Drowning the dredged sand, which can be used in beach nourishment, into the sea should be prohibited by law. The priority should be focused on the persistence of natural shore processes, and after that, on the possibilities of using the excessively accumulated sediments for other purposes.

Author Contributions

Conceptualization, H.T. and R.M.; methodology and fieldworks, H.T., R.M., S.S., V.P., A.K., T.V., K.V. and V.A.; software, H.T. and R.M.; validation, H.T., R.M., V.P., S.S. and V.A.; formal analysis, H.T., R.M., A.K., T.V. and V.A.; writing—original draft preparation, H.T., K.V., T.V. and A.K.; writing—review and editing, A.K., H.T., R.M. and K.V.; visualization, H.T., T.V. and R.M.; supervision, H.T.; project administration, H.T.; funding acquisition, H.T. All authors have read and agreed to the published version of the manuscript.

Funding

This research was funded by the Estonian Research Council (grant PRG1471) and Environmental Investment Centre (project No. 18541).

Institutional Review Board Statement

Not applicable.

Informed Consent Statement

Not applicable.

Data Availability Statement

Majority of the data is available from project report. It can be found from here: https://kliimaministeerium.ee/media/9570/download it is also reference [31].

Acknowledgments

We are grateful to the Estonian Environment Agency (EEA) for meteorological, sea ice, and sea level data, and to the Estonian Land Board (ELB) for the aerial photographs.

Conflicts of Interest

The authors declare no conflicts of interest. The funders had no role in the design of the study; in the collection, analyses, or interpretation of data; in the writing of the manuscript; or in the decision to publish the results.

References

  1. Orviku, K. Rannad ja Rannikud; TLÜ kirjastus: Tallinn, Estonia, 2018; p. 349, (In Estonian with English summary). [Google Scholar]
  2. HELCOM. Guidelines for Management of Dredged Material at Sea; Adopted by HELCOM 36-2015 on 4 March 2015 and Amended by HELCOM 41-2020 on 4 March 2020; 2020; pp. 1–39. Available online: https://helcom.fi/wp-content/uploads/2019/08/HELCOM-Reporting-Format-for-Management-of-Dredged-Material-at-Sea_2016.xlsx (accessed on 1 September 2023).
  3. Tiede, J.; Jordan, C.; Moghimi, A.; Schlurmann, T. Long-term shoreline changes at large spatial scales at the Baltic Sea: Remote-sensing based assessment and potential drivers. Front. Mar. Sci. 2023, 10, 1207524. [Google Scholar] [CrossRef]
  4. Różyński, G.; Bielecka, M. Sediment quality in the Polish part of the trans-boundary Vistula Lagoon: Implications for deposition management. Mar. Policy 2022, 146, 105288. [Google Scholar] [CrossRef]
  5. Karaliūnas, V.; Jarmalavičius, D.; Pupienis, D.; Janušaitė, R.; Žilinskas, G.; Karlonienė, D. Shore Nourishment Impact on Coastal Landscape Transformation: An Example of the Lithuanian Baltic Sea Coast. J. Coast. Res. 2020, 95, 840–844. [Google Scholar] [CrossRef]
  6. Hojan, M.; Rurek, M.; Krupa, A. The Impact of Sea Shore Protection on Aeolian Processes Using the Example of the Beach in Rowy, N Poland. Geosciences 2019, 9, 179. [Google Scholar] [CrossRef]
  7. Schernewski, G.; Knotz, S. Beach Nourishment as a Successful Measure against Erosion, Rostock—DE; Sistermans, P., Nieuwenhuis, O., Eds.; Eurosion Case Study; DHV Group: Rostock, Germany, 2015; pp. 1–4. [Google Scholar]
  8. Pupienis, D.; Jonuškaite, S.; Jarmalavičius, D.; Žilinskas, G. Klaipeda port jetties impact on the Baltic Sea shoreline dynamics, Lithuania. J. Coast. Res. 2013, 65, 2167–2172. [Google Scholar] [CrossRef]
  9. Pinto, C.A.; Mendes Silveira, T.; Teixeira, S.B. Beach nourishment practice in mainland Portugal (1950–2017): Overview and retrospective. Ocean Coast. Manag. 2020, 192, 105211. [Google Scholar] [CrossRef]
  10. Hanley, M.E.; Hoggart, S.P.G.; Simmonds, D.J.; Bichot, A.; Colangelo, M.A.; Bozzeda, F.; Heurtefeux, H.; Ondiviela, B.; Ostrowski, R.; Recio, M.; et al. Shifting sands? Coastal protection by sand banks, beaches and dunes. Coast. Eng. 2014, 87, 136–146. [Google Scholar] [CrossRef]
  11. Hamm, L.; Capobianco, M.; Dette, H.H.; Lechuga, A.; Spanhoff, R.; Stive, M.J.F. A summary of European experience with shore nourishment. Coast. Eng. 2002, 47, 237–264. [Google Scholar] [CrossRef]
  12. Hanson, H.; Brampton, A.; Capobianco, M.; Dette, H.H.; Hamm, L.; Laustrup, C.; Lechuga, A.; Spanhoff, R. Beach nourishment projects, practices, and objectives—A European overview. Coast. Eng. 2002, 47, 81–111. [Google Scholar] [CrossRef]
  13. Palginõmm, V.; Orviku, K.; Suursaar, Ü.; Kont, A.; Tõnisson, H.; Rivis, R. Lessons Learned from Record-High Storm Surges and Associated Inundations in Pärnu, SW Estonia. J. Coast. Res. 2018, 85, 1391–1395. [Google Scholar] [CrossRef]
  14. Tõnisson, H.; Kont, A.; Orviku, K.; Suursaar, Ü.; Rivis, R.; Palginõmm, V. Application of system approach framework for coastal zone management in Parnu, SW Estonia. J. Coast. Conserv. 2019, 23, 931–942. [Google Scholar] [CrossRef]
  15. Hang, T.; Kohv, M. Glacial varves at Pärnu, southwestern Estonia: A local varve chronology and proglacial sedimentary environment. GFF 2013, 135, 273–281. [Google Scholar] [CrossRef]
  16. Suursaar, Ü.; Kall, T. Decomposition of Relative Sea Level Variations at Tide Gauges Using Results from Four Estonian Precise Levelings and Uplift Models. IEEE J. Sel. Top. Appl. Earth Obs. Remote Sens. 2018, 11, 1966–1974. [Google Scholar] [CrossRef]
  17. Suursaar, Ü.; Sooäär, J. Decadal variations in mean and extreme sea level values along the Estonian coast of the Baltic Sea. Tellus Ser. A-Dyn. Meteorol. Oceanogr. 2007, 59, 249–260. [Google Scholar] [CrossRef]
  18. Jaagus, J.; Suursaar, Ü. Long-term storminess and sea level variations on the Estonian coast of the Baltic Sea in relation to large\scale atmospheric circulation. Est. J. Earth Sci. 2013, 62, 73–92. [Google Scholar] [CrossRef]
  19. BACC. Second Assessment of Climate Change for the Baltic Sea Basin; Springer: Heidelberg, Germany; New York, NY, USA; Dordrecht, The Netherlands; London, UK, 2015. [Google Scholar]
  20. Kont, A.; Tõnisson, H.; Jaagus, J.; Suursaar, Ü.; Rivis, R. Eesti randade areng viimastel aastakümnetel kliima ja rannikumere hüdrodünaamiliste muutuste tagajärjel. In 30 aastat keskkonnaökoloogiat. Ökoloogia keskus 1992–2022; Terasmaa, J., Truus, L., Kont, A., Eds.; Tallinna Ülikooli ökoloogia instituudi/keskuse publikatsioonid: Tallinn, Estonia, 2022; Volume 13, pp. 9–58. (In Estonian) [Google Scholar]
  21. Kartau, K. Valgeranna ja Pärnu vahelise randla areng. Master’s Thesis, Tallinn University of Technology, Tallinn, Estonia, 2011. (In Estonian). [Google Scholar]
  22. Last, W.M. Mineralogical analysis of lake sediments. Track. Environ. Change Using Lake Sediments 2001, 2, 143–187. [Google Scholar] [CrossRef]
  23. Heiri, O.; Lotter, A.F.; Lemcke, M.-J. Loss on ignition as a method for estimating organic and carbonate content in sediments: Reproducibility and comparability of results. J. Paleolimnol. 2001, 25, 101–110. [Google Scholar] [CrossRef]
  24. Alari, V.; Björkqvist, J.V.; Kaldvee, V.; Mölder, K.; Rikka, S.; Kask-Korb, A.; Vahter, K.; Pärt, S.; Vidjajev, N.; Tõnisson, H. LainePoiss®—A Lightweight and Ice-Resistant Wave Buoy. J. Atmos. Ocean. Technol. 2022, 39, 573–594. [Google Scholar] [CrossRef]
  25. Booij, N.; Ris, R.C.; Holthuijsen, L.H. A third-generation wave model for coastal regions: 1. Model description and validation. J. Geophys. Res. 1999, 104, 7649–7666. [Google Scholar] [CrossRef]
  26. Tõnisson, H.; Suursaar, Ü.; Rivis, R.; Kont, A.; Orviku, K. Observation and analysis of coastal changes in the West Estonian Archipelago caused by storm Ulli (Emil) in January 2012. J. Coast. Res. 2013, 65, 832–837. [Google Scholar] [CrossRef]
  27. Tõnisson, H.; Suursaar, Ü.; Alari, V.; Muru, M.; Rivis, R.; Kont, A.; Viitak, M. Measurement and Model Simulations of Hydrodynamic Parameters, Observations of Coastal Changes and Experiments with Indicator Sediments to Analyse the Impact of Storm St. Jude in October, 2013. J. Coast. Res. 2016, 75, 1257–1261. [Google Scholar] [CrossRef]
  28. Van der Wal, D. Aeolian Transport of Nourishment Sand in Beach-Dune Environments; University of Amsterdam: Amsterdam, The Netherlands, 1999; pp. 1–157. [Google Scholar]
  29. Pupienis, D.; Jarmalavičius, D.; Žilinskas, G.; Fedorovič, J. Beach nourishment experiment in Palanga, Lithuania. J. Coast. Res. 2014, 70, 490–495. [Google Scholar] [CrossRef]
  30. Jarmalavičius, D.; Žilinskas, G.; Pupienis, D.; Karaliūnas, V.; Janušaitė, R. Natural and human control of the coastal development, Baltic Sea, Lithuania. Geogr. Metraštis 2020, 5, 3–12, (In Lithuanian with English summary). [Google Scholar] [CrossRef]
  31. Tõnisson, H.; Männikus, R.; Vaasma, T.; Vandel, E.; Kont, A.; Alari, V.; Suuroja, S.; Eelsalu, M.; Vilumaa, K.; Palginõmm, V.; et al. Metoodika Väljatöötamine Laevateedele Kuhjuvate Rannasetete Mahu ja Kvaliteedi Määramiseks Ning Kasutamiseks Randade taastamisel Pärnu Sadama ja Seda Ümbritsevate Randade Näitel; Report; Institute of Ecology, Tallinn University: Tallinn, Estonia, 2023; p. 174. (In Estonian) [Google Scholar]
  32. USACE. Coastal Engineering Manual; Manual No. 1110-2-1100; Department of the Army, U.S. Army Corps of Engineers: Washington, DC, USA, 2008. [Google Scholar]
  33. Brand, E.; Ramaekers, G.; Lodder, Q. Dutch experience with sand nourishments for dynamic coastline conservation—An operational overview. Ocean Coast. Manag. 2022, 217, 106008. [Google Scholar] [CrossRef]
  34. Bosboom, J.; Stive, M.J.F. Coastal Dynamics I; Delft Academic Press: Delft, The Netherlands, 2015. [Google Scholar]
  35. Najafzadeh, F.; Jankowski, M.; Giudici, A.; Männikus, R.; Suursaar, Ü.; Soomere, T.; Viška, M. Spatiotemporal variability of wave climate in the Gulf of Riga. Oceanologia 2023, in press. [CrossRef]
  36. Männikus, R.; Soomere, T.; Kudryavtseva, N. Identification of mechanisms that drive water level extremes from in situ measurements in the Gulf of Riga during 1961–2017. Cont. Shelf Res. 2019, 182, 22–36. [Google Scholar] [CrossRef]
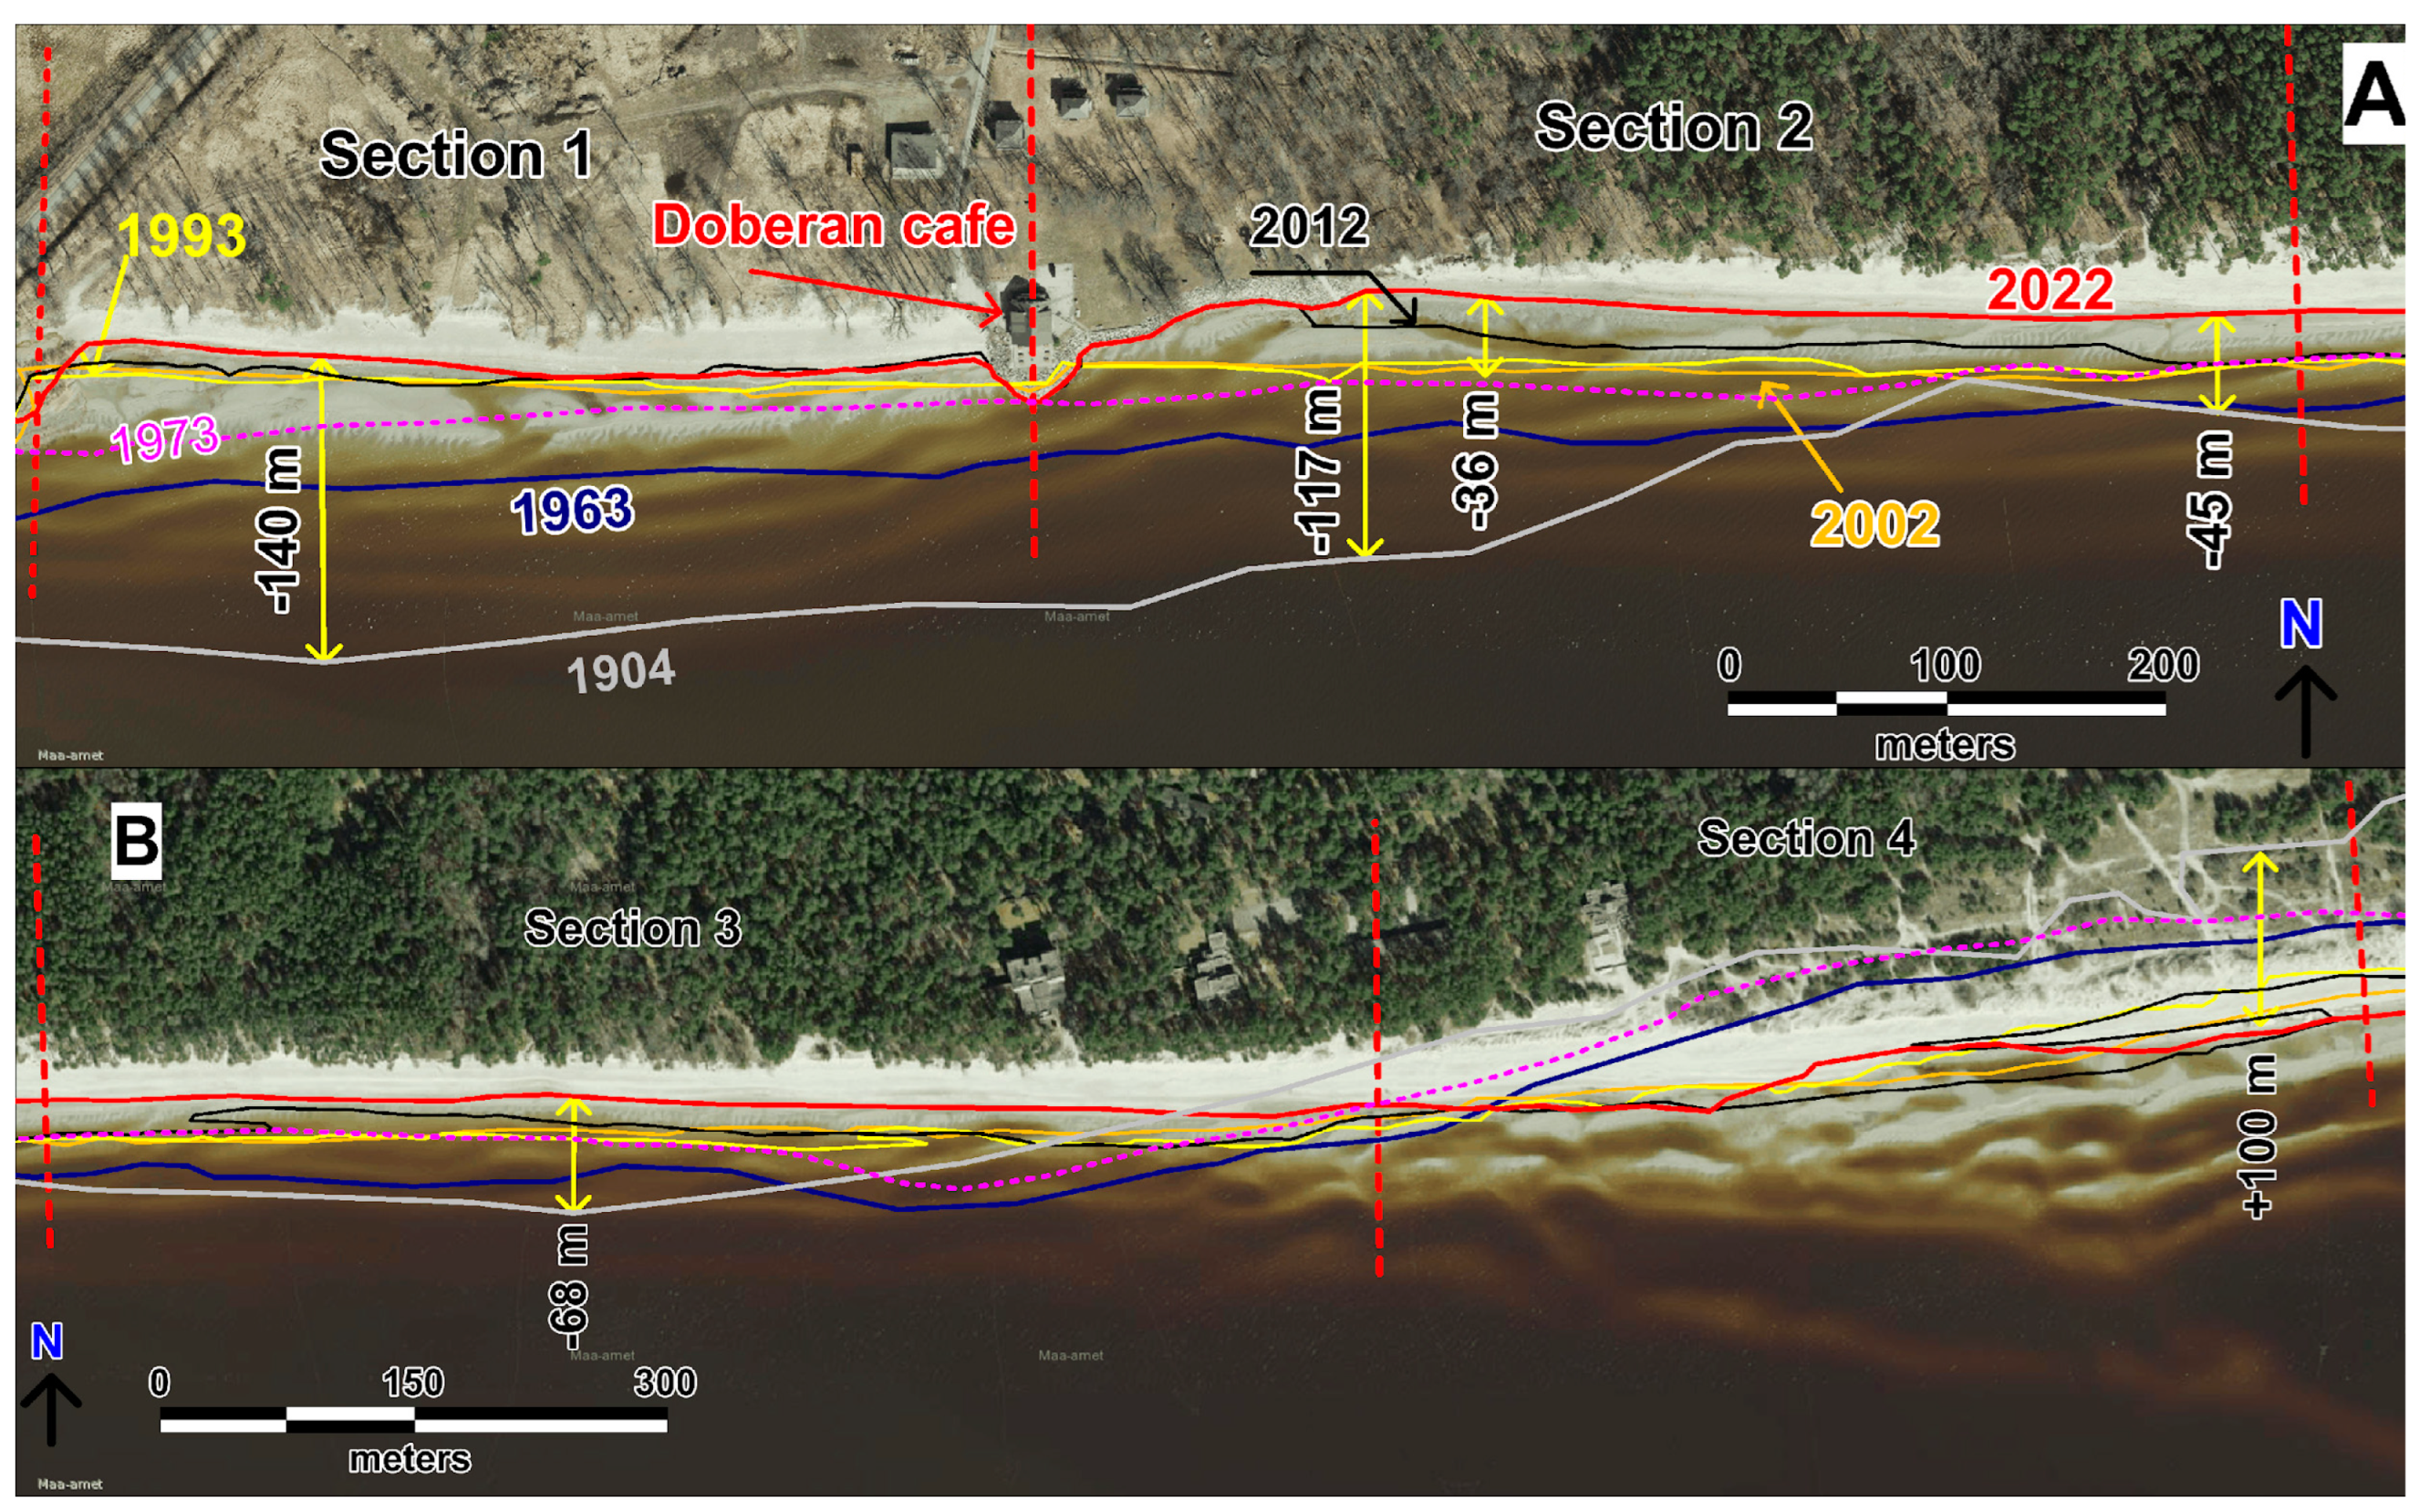
Figure 1. (A) Location of Estonia and the study area (Pärnu Bay is indicated with red arrow); (B) a principal scheme of sediment transport (red arrows showing prevailing erosion, orange arrows showing prevailing accumulation) in Pärnu Bay (based on the orthophotos of the Estonian Land Board and the fieldwork results). Location of the anchorage sites of wave buoys (the numbers of the measurement sites from 2021 and 2022 are shown in the map) are marked in yellow.
Jmse 12 00394 g001
Figure 2. Contours of the accumulated body of sand in April 1999 (red line) and in April 2022 (white line). Border of the dunes in 1973 and locations of sediment cores are indicated. Based on the Estonian Land Board orthophoto from 2022.
Jmse 12 00394 g002
Figure 3. In total, 19 cross-shore beach profiles were measured in 2020 and 18 in 2022 at Valgeranna (based on the orthophoto of the Estonian Land Board from 2022).
Jmse 12 00394 g003
Figure 4. (A) Shoreline changes in detail in the western part of Valgeranna; (B) shoreline changes in detail in the eastern part of Valgeranna. The shoreline retreat in different parts of the study site over different time interval is shown on the map (based on the orthophoto of the Estonian Land Board from 2022).
Jmse 12 00394 g004
Figure 5. Cross-shore beach profiles west of Doberan café. Locations of the profiles in Figure 3.
Jmse 12 00394 g005
Figure 6. (A) Median grain size in Valgeranna beach (upper figure) and (B) median grain size in Pärnu river mouth (lower figure).
Jmse 12 00394 g006
Figure 7. The lines in the sea (the upper part of the figure) show the locations of geophysical profiles on the map. A 3D view of the profiles is below; two arrows show which profiles correspond to the lines above and their intersections.
Jmse 12 00394 g007
Figure 8. Significant and maximum measured wave heights in autumn 2021 and 2022 in Pärnu Bay.
Jmse 12 00394 g008
Figure 9. Measured Hs at LP4 (black bold line) and modelled Hs forced with winds at Kihnu (pink) and Mõntu (blue).
Jmse 12 00394 g009
Figure 10. Scenario 033. Sediment thickness after 240 h of southwestern wind with a speed of 12.6 m/s. Water level is 0.88 m. The initial sand volume has reduced by 51%. Grey arrows denote the direction and intensity of sand movement, their quantity is not relevant here. White arrow shows the location of Doberan café.
Jmse 12 00394 g010
Figure 11. Scenario 133. Sediment thickness after 240 h of southwestern wind with a speed of 12.6 m/s. Water level is 0.88 m. Initial sand volume has reduced by 27%. Arrows are explained in Figure 10.
Jmse 12 00394 g011
Figure 12. Scenario 143. Sediment thickness after 240 h of southwestern wind with a speed of 12.6 m/s. Water level is 0.88 m. Initial sand volume has reduced by 35%. Arrows are explained in Figure 10.
Jmse 12 00394 g012
Figure 13. Proposed layout of groynes, to be built in two stages, in Valgeranna.
Jmse 12 00394 g013
Table 1. Shoreline shift per 1 m of shoreline per year (m/yr) in different beach sections of the study site (distance from Doberan cafe) over different time interval. Orange marks the recession of the shoreline.
PeriodSection 1
455–0 (m)
Section 2
0–565 (m)
Section 3
565–1345 (m)
Section 4
1345–1935 (m)
Section 5
1935–2565 (m)
1903–2022−1.02−0.65−0.310.571.37
1963–2022−0.89−0.89−0.740.670.54
1973–2022−0.51−0.66−0.501.070.80
1993–2022−0.28−0.86−0.660.161.07
2002–2022−0.43−1.35−0.76−0.061.24
2012–2022−0.34−1.33−1.30−0.481.55
Table 2. Comparison of three different scenarios of dredging and nourishing [30].
Method for 30,000 m3Time (24 h Days)Cost (EUR)EUR/m3
Watermaster, pumping (500 m) + road transport52–80191,6086.89
Dredging vessel5–7175,0005.83
Road transport10152,6125.09
Table 3. Percentiles of wind speeds and water levels for southwestern direction.
No.PercentileHours in a YearWind Speed at Kihnu, m/sWater Level at Pärnu, mHours in a Year Divided by 240 hOccurrence of Simulation Results in Years
170%958.38.90.493.990.25
290%319.411.40.751.330.75
395159.712.60.880.671.50
499%31.915.01.210.137.51
599.75%8.017.01.460.0330.05
699.9%3.218.41.600.0175.13
Table 4. Description of layout scenarios. Suffix x refers to different percentiles (Table 3) applied in separate simulations.
No.Description of Layout Scenarios
03xSouthwestern wind. Nourishment in the east, thickness 1 m. No coastal protection structures.
11xSouthwestern wind. Nourishment in the east, thickness 1 m. Groyne length 200 m, the longest and the easternmost 500 m.
13xSouthwestern wind. Nourishment in the east, thickness 1 m. 8 groynes, length 110 m, spacing 230 m.
14xSouthwestern wind. Nourishment in the east, thickness 1 m. 4 groynes in the shallow water, length 100 m, distance 500 m.
15xSouthwestern wind. Nourishment in the west, thickness 1 m. 4 detached breakwaters with length of 200 m, spacing 200 m, 100 m south from the coastline.
23xSouthwestern wind. Nourishment in the west, thickness 1 m. 5 groynes, length 110 m, spacing 230 m.
30xSouthwestern wind. Nourishment in the shallow sea, in the south, thickness 1 m. No coastal structures.
33xSouthwestern wind. Nourishment in the shallow sea, in the south, thickness 1 m. 8 groynes, length 110 m, spacing 230 m.
Table 5. Decrease (%) of nourished sediments in Valgeranna.
No.Percentiles, SW WindsLayoutsOccurrence of Simulation Results in Years
03x11x13x14x15x23x30x33x
170−4%−1%−1%−4%−2%0%0%0%0.25
290−31%−14%−19%−24%−21%−8%−7%−8%0.75
395−51%−24%−27%−35%−29%−17%−15%−17%1.50
499−80%−42%−42%−50%−44%−44%−47%−51%7.51
599.75−99%−65%−60%−68%−61%−77%−85%−90%30.05
699.9−100%−75%−63%−90%−64%−85%−100%−100%75.13
Disclaimer/Publisher’s Note: The statements, opinions and data contained in all publications are solely those of the individual author(s) and contributor(s) and not of MDPI and/or the editor(s). MDPI and/or the editor(s) disclaim responsibility for any injury to people or property resulting from any ideas, methods, instructions or products referred to in the content.

