
Research on Dynamic Quaternion Ship Domain Model in Open Water Based on AIS Data and Navigator State


Navigation College, Dalian Maritime University, Dalian 116026, China
*
Author to whom correspondence should be addressed.
J. Mar. Sci. Eng. 2024, 12(3), 516; https://doi.org/10.3390/jmse12030516
Submission received: 7 December 2023
/
Revised: 18 December 2023
/
Accepted: 22 December 2023
/
Published: 21 March 2024
(This article belongs to the Special Issue Marine Navigation and Safety at Sea)
Abstract
:During the process of establishing the analytical quaternion ship domain model, the impact of ship traffic conditions and navigator state was not taken into consideration. However, the significance of these factors in the ship domain cannot be ignored. To create a more realistic representation of changes in the ship domain in real navigation environments, this study further considers the influence of ship encounter course, waterway traffic intensity, relative ship velocity, and the navigator state based on the quaternion ship domain model. As a result, a new dynamic quaternion ship domain model is proposed. To assess the changes in the size and shape of the ship domain under various navigation environments, ship domain scaling and shape transformation functions are introduced. Specifically, this study focuses on analyzing the ship traffic near the Lao Tie Shan Waterway, simulating the size and shape changes of the ship domain during the navigation process in this area. The findings indicate that the size of the ship domain dynamically adjusts to the traffic conditions. Additionally, when the navigator state is excellent, the ship domain takes on an irregular diamond shape with the smallest area, whereas when the navigator state is poor, the shape approximates a rectangle with the largest area. Furthermore, the dynamic quaternion ship domain model proposed in this study is compared to the ship domain models put forth by Goodwin, Davis, and co-authors. The results demonstrate that the dynamic quaternion ship domain model is more compatible and suitable for open waters compared to the static quaternion ship domain model.
1. Introduction
The ship domain is an important part of research on maritime traffic safety. In Maritime Traffic Engineering, the ship domain is defined as the area around a preceding ship that the majority of subsequent ship navigators endeavor to avoid [1]. In order to determine the boundaries of the ship domain, Fujii et al. [2] conducted maritime traffic observations and deduced that the geometry of the ship domain is approximately elliptical in shape. Through further analysis, they found that the major axis of the ship domain is typically eight times the ship’s length, and the minor axis is 3.2 times the ship’s length. Goodwin [3] conducted statistical analysis on the maritime traffic observation data in the southern waters of the North Sea. Taking into account the influence of International Regulations for Preventing Collisions at Sea (COLREGS), a ship domain model for open waters was established by combining three sectors of different sizes and areas. British scholars Davis et al. [4] added up the areas of the three sectors in the Goodwin model and replaced the original domain model with a circle of equal area. The center of the circle was placed in the lower left corner to maintain the proportional sizes of the three sectors before the smooth boundary. The primary methods of early research in the ship domain were traffic observation and mathematical statistics. Szlapczynski et al. [5] categorized this type of domain as an empirical ship domain. With the advancement of information technology, the Automatic Identification System (AIS) can acquire richer data sources than radar. However, this empirical method is still being utilized. Zhang [6] conducted a grid division of the waters surrounding the ship and then used AIS data to calculate the grid density of ships at different time periods, determining the shape and size of ship domains for different types of ships. Hörteborn [7] determined through statistical analysis of AIS data that the shape of the ship domain is an ellipse, with semi-axis radii of 0.9 nm and 0.45 nm. Zheng et al. [8] dynamically generate ship models based on real-time AIS data and accumulated short data. They use an online recognition method to calculate ship encounter parameters and obtain collision risk as a source of identification data, ensuring accuracy and real-time requirements for ship domain recognition.
Szlapczynska [5] highlights that ship domain can be determined through expert knowledge or safety analysis. While empirical ship domain research has been conducted, many scholars have also focused on analytical ship domains. One example of an analytical ship domain is the quaternion ship domain (QSD), proposed by Wang et al. [9]. The QSD is defined by four radii (front, aft, starboard, and port side) and incorporates factors such as ship speed, maneuvers, and length. Unlike empirical ship domains, the QSD does not rely on extensive data and is not influenced by specific water types or areas. In recent research, Silveira et al. [10] fitted the QSD model using actual AIS data and corrected the QSD parameters proposed by Wang et al. [9]. Currently, the QSD model is also applied to ship trajectory prediction and collision risk assessment in the maritime domain. For example, Liu et al. [11] utilize long short-term memory with a QSD for ship trajectory prediction. The authors compare the prediction results with several state-of-the-art prediction methods, demonstrating the superior performance of this method in both quantitative and qualitative evaluations. Liu and his colleagues [12] proposed a framework involving modeling, visualization, and prediction to analyze ship collision risk, incorporating the QSD into this model. They validated the model’s effectiveness using AIS data.
However, a limitation of the QSD is its incomplete consideration of other influential factors in ship domains, such as the navigational environment and human factors, which makes it challenging to accurately reflect the actual size of the ship domain during real navigation processes. The size of a ship domain is influenced by various factors, as summarized by foreign scholars Pietrzykowski et al. [13] in relation to open waters, including human factors, size and type of own ship, ship motion parameters (relative velocity and traffic intensity), hydro-meteorological conditions, encounter types, bearing of approaching ships, and size of other ships. In order to enhance the effectiveness of the QSD in serving the field of maritime traffic safety, this study aims to establish a new dynamic quaternion ship domain (DQSD) by fully considering the influencing factors on the ship domain.
The rest of the paper is organized as follows. Section 2 introduces the QSD and discusses its limitations. Section 3 establishes the DQSD model, while Section 4 focuses on the algorithm implementation. Section 5 involves the simulation and validation of the DQSD, and Section 6 and Section 7, respectively, present the discussion and summary of the results.
2. The Analytical Quaternion Ship Domain (QSD)
The QSD was introduced by Wang et al. [9]. It is based on the notion that the size of a ship domain is determined by quaternions, specifically, the fore-and-aft radius and the starboard-and-port radius, which are determined by quaternions. This model takes into consideration various factors, including ship maneuverability, ship speed, and ship length. The QSD can be described as Equations (1)–(3).
In the model, the variables are defined as follows:
: Represents the radius of the fore-axis of the ship domain.
: Represents the radius of the aft-axis of the ship domain.
: Represents the radius of the starboard side of the ship domain.
: Represents the radius of the port side of the ship domain.
: Represents a variable or .
: Represents a shape factor.
: Represents the ship length.
can be determined by , , and , which represent gains of the advance and the tactical diameter . The analytical expression is Equation (4).
and can be estimated using an empirical formula based on the ship’s length and speed. The analytical expression is Equation (5) [9].
As shown in Figure 1, the model of the QSD is depicted. Unlike other ship domains, the sizes of the four radii in this model can be calculated using fixed mathematical expressions.
The size of the QSD model, based on an analytical approach, can be obtained using fixed analytical expressions. Consequently, it is commonly used in collision risk studies. However, the model itself has several unresolved limitations. Due to the lack of comprehensive consideration for other influencing factors in the ship domain, the model is often regarded as a fixed-size domain in open waters. However, Pietrzykowski et al. [13] argue that the boundaries of the ship domain should not be fixed but rather varying or fuzzy. This implies that the QSD faces significant limitations in its practical application. During actual navigation, the ship domain is influenced by the interaction between humans, ships, and the environment. The navigational environment is complex and constantly changing, leading to variations in the size of the ship domain. The QSD model struggles to accurately reflect these size changes in real navigational environments. As a result, it is challenging to precisely utilize the model for collision avoidance decision making and collision risk analysis in ship navigation.
3. Dynamic Quaternion Ship Domain (DQSD)
3.1. The Establishment of the DQSD
This article builds upon the previously proposed QSD by incorporating considerations for factors such as the actual navigational environment, resulting in the establishment of a new DQSD. Due to the mathematical approach used by Zhou Dan et al. [14] to quantify the importance of factors, it was determined that in open waters with suitable visibility, the importance of wind, current, and waves in the ship domain is zero. Therefore, in mutually visible open waters, the model proposed in this article takes into account factors such as encounter course, traffic intensity, relative ship velocity, and navigator state while disregarding the influence of wind, current, and waves. The established model for the DQSD, based on the original model, is described by Equations (6) and (7)
In this article, represents the parameter for the changes in the size of the ship domain under the combined influence of encounter course, traffic intensity, and relative ship velocity. It is a function that controls the variation in the model size. The variable represents the shape coefficient, which is a function determined by the navigator state. By determining the expressions for and , this study aims to obtain the size variation of the DQSD.
3.2. Determining the Changes in the Size of the Ship Domain
Fuzzy systems are commonly regarded as effective tools for handling uncertain information. By utilizing fuzzy set theory, the comprehensive impact of various factors during the actual navigation process on the ship domain can be better determined. This algorithm essentially applies fuzzy control methods in conjunction with encounter course, traffic intensity, relative ship velocity, and the inherent rules governing ship domain changes to establish a dynamic ship domain model.
First, establish the variable set for the influencing factors, where represents encounter course, traffic intensity, and relative ship velocity, respectively. Set up the factor weight set , , where represents the influence weights of encounter course, traffic intensity, and relative ship velocity on the ship domain. Then, determine the membership functions for each influencing factor in the variable set . The determination of the membership functions is crucial for the calculation results of the model. Finally, calculate the influence coefficient for the size of the ship domain using a generalized weighted average fuzzy operator, which combines the membership degrees of all ship domain influencing factor indicators with their corresponding weights. The equation for is given by Equation (8), where represents the mean of .
Therefore, the DQSD model established in this paper is Equation (9).
3.3. The Shape Variation of the Ship Domain Is Determined Based on the Navigator State
3.3.1. Probability Analysis of Personnel Error
The probability of personnel errors is generally used to quantitatively describe the difficulty level of human errors occurring when personnel engage in a certain activity. The probability of personnel errors can be broadly expressed in the form of Equation (8) [15].
In this context, denotes the rate of human errors, which can be either a constant or a function. For the purpose of this study, we assume to be a negative exponential probability density function. The negative exponential distribution is a widely used approach in reliability analysis and plays a crucial role in the analysis of personnel error [16]. The analytical expression for the negative exponential probability density function is presented below (11):
Here, is a parameter of the model commonly referred to as the rate parameter, and represents time.
The analytical expression of can be derived by combining Equation (10) and Equation (11), as shown in Equation (12).
The shape function in the domain of the ship primarily depends on the navigator state. The navigator state is represented by a set , where represents the variables of knowledge and skills, psychological qualities, and physiological qualities of the navigator, . The weight vector , , denotes the weights of the navigator state.
Drawing on the research methods of personnel error probabilities, this study posits that the situational environment and other factors (such as system design) for navigators are consistent. Under identical situational conditions, different navigators may manifest varying driving states. Under these conditions, the algorithm can capture the relationship between the reliability of the navigator state and the variations in the navigator state. Therefore, in this study, the parameter is regarded as the state variable for the navigator. The expression of is shown in Equation (13).
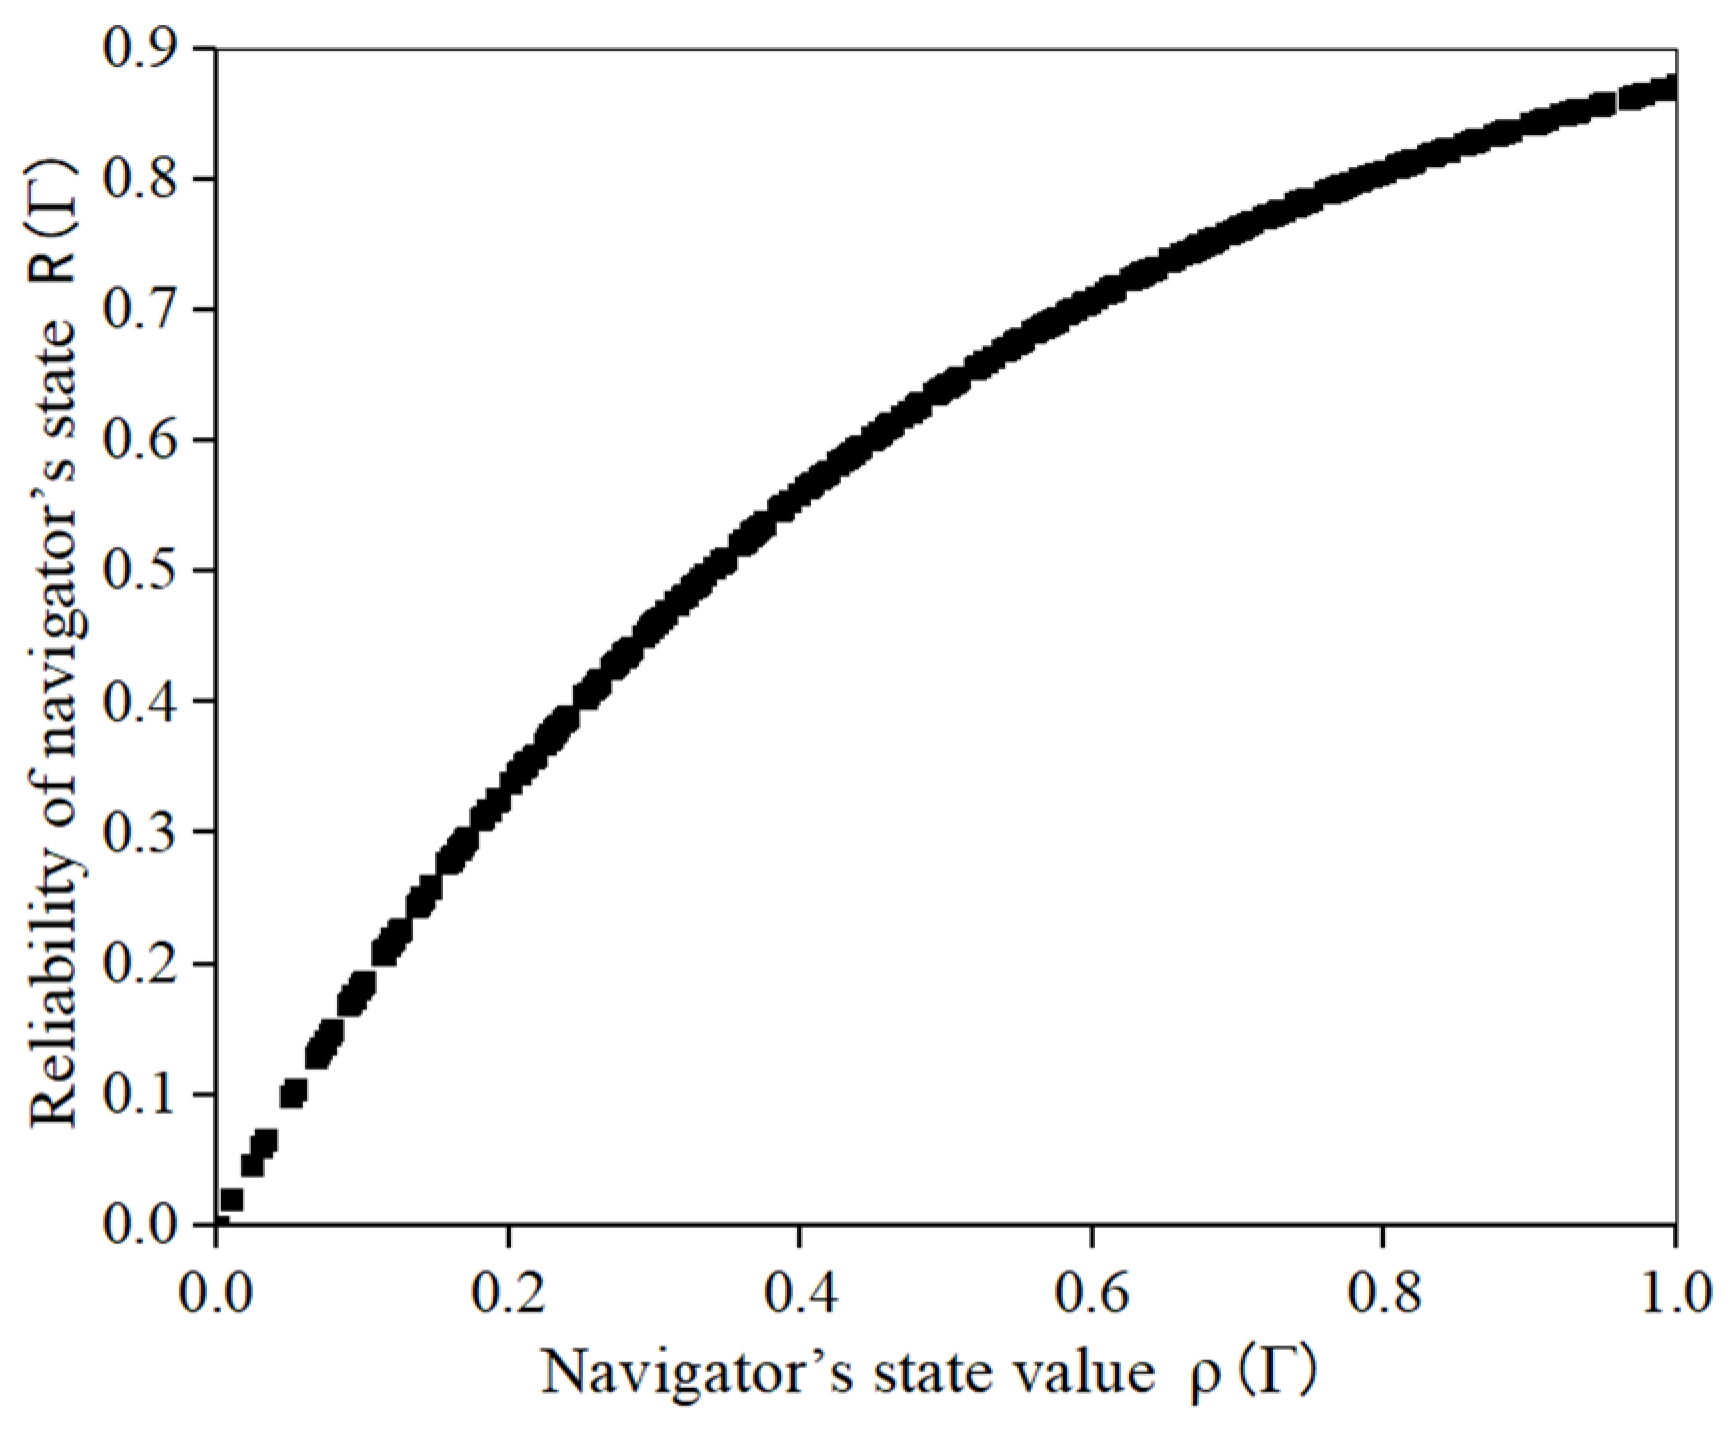
Therefore, the reliability corresponding to different navigator states can be represented by Equation (14).
3.3.2. Parameter Estimation
- (1)
- Navigator state distribution
The reliability model for the navigator state is determined using a negative exponential probability density function, with parameter controlling the shape of the model curve. In the actual driving process, the navigator’s knowledge and skills , psychological qualities , and physiological qualities influence the navigator state. It is generally believed that there is an abundance of navigators with moderate-level states. Therefore, this paper assumes that the navigator state follows a Gaussian distribution, as shown in Figure 2. The reliability of the navigator state, as established in this article, varies with the changes in the navigator state. The reliability is negatively exponentially distributed, with higher reliability associated with a better navigator state. The distribution model for the reliability of the navigator state is illustrated in Figure 3.
- (2)
- Maximum likelihood estimation method
The likelihood function for the given i.i.d. sample data , is Equation (15).
where is the sample mean.
The expression for taking the derivative of the log-likelihood function is Equation (16).
The maximum likelihood estimation value for the parameter is obtained using Equation (17).
3.3.3. The Shape Function
The ship domain is associated with navigator collision avoidance maneuvers, and therefore, the shape of the DQSD is primarily influenced by the navigator state. It is generally believed that the better the navigator state, the smaller the range included in the domain, and the worse the navigator state, the larger the range of the domain. Based on the reliability of the navigator state, the shape function of the dynamic ship domain can be expressed as Equation (18).
The value of is determined by the highest reliability of the navigator state, , and the fuzzy QSD limit boundary coefficient, . The expression of is Equation (19).
In summary, the DQSD model established in this paper is described by Equations (20) and (21).
4. Algorithm Implementation
4.1. Data Source
The AIS data utilized in this study were sourced from a portion of the Lao Tie Shan Waterway, specifically an open-water area beyond the separated navigation system. By selecting a region where ship encounters occur frequently, this research provides ample sample data to examine the dynamic ship domain. The AIS data were selected from 2018/6/1 to 2018/6/10, covering a duration of 10 days. The waterway area falls within the latitude range of 38.523° to 38.690° north and the longitude range of 120.772° to 120.983° east. During this period, the waterway was in a fishing moratorium, ensuring minimal interference from fishing ships. Table 1 displays the decoded and processed AIS data in the vicinity of the Lao Tie Shan Waterway.
Based on the information from the AIS data, the traffic conditions and distribution of ship navigation tracks can be obtained. According to the statistics, a total of 1671 ships passed through the maritime area between 2018/6/1 and 2018/6/10. The navigation tracks of the ships within the waterway are shown in Figure 4.
4.2. Encounter Sample Extraction
The changes in three influencing factors can be determined based on AIS data. Sufficient ship avoidance sample data can be obtained by filtering AIS data, which include information on ship encounter course, traffic intensity, and relative ship velocities in actual waterways. The flowchart for sample selection is shown in Figure 5.
Due to the discrete nature of ship dynamic information in AIS data over time, interpolation is necessary to calculate the motion relationship between ships. The statistical analysis of maritime collision avoidance behaviors in maritime traffic engineering suggests that the actual distance (d) between two ships during passage and the evasive maneuvers can effectively characterize ship collision avoidance behaviors [1]. Based on the analysis of the distance distribution between two ships during maneuvering actions for collision avoidance, as documented by Wu Zhaolin et al. [1] from Dalian Maritime University, it was found that the average distance between the stand-on ship and the giving-way ship is 3.5 nm [1]. Hence, in order to effectively identify ship encounters with a chosen reference distance of d = 3.5 nm, it becomes essential to additionally ascertain whether any course alterations have occurred.
Through Python processing of AIS data, 529 encounter sample data points were filtered for the water area between 2018/6/1 and 2018/6/10. The statistical results for encounter courses, traffic intensity, and relative ship velocities are shown in Table 2.
4.3. Sample Distribution
4.3.1. Distribution of Ship Encounter Courses
According to the collision avoidance rules, the encounter situations between own ships and target ships can be classified as head-on, crossing, and overtaking. The bearing sectors for the target ships relative to own ships are illustrated in Figure 6. If the target ship bearing falls within the bearing range of sector F, own ships and the target ships are in a head-on situation. If the target ship bearing falls within the bearing range of sectors A, B, D, or E, own ships and the target ships are in a crossing situation. When the target ship bearing falls within the bearing range of sector C, own ships and the target ships are in an overtaking situation. Additionally, if the target ship course falls within sectors F, A, or B, own ships should give way, whereas if the target ship course falls within sectors C, D, or E, the target ships should give way to own ships. The encounter courses in the statistical analysis of ship traffic in the water area are considered as the bearing courses between the give-way ships (target ships) and the stand-on ships (own ships) within the symmetric range , as depicted in Figure 7. It can be observed from the graph that there is a relatively higher occurrence of head-on and overtaking situations in ship encounters within the water area.
4.3.2. Ship Traffic Intensity Distribution
The arrival of ships is a random process. This article presents the distribution of ship traffic intensity for each hour, as shown in Figure 8. After kernel density estimation, the results indicate that the traffic intensity in this area follows a normal distribution per hour. The mean, = 20.455, and the variance, = 32.266.
4.3.3. Distribution of Relative Ship Velocities
As shown in Figure 9, a Cartesian coordinate system is established with this ship as the origin. The positive direction of the x-axis is north, and the positive direction of the y-axis is east. It is known that the angle between the other ship heading and this ship heading is (measured clockwise, with this ship heading as the starting side). If this ship’s true heading is and its ground speed is , and the other ship’s true heading is and its ground speed is , the relative velocity of the other ship with respect to this ship, denoted as , can be calculated using vector calculations.
The relative velocity distribution between the own ship and the target ship is shown in Figure 10. It is evident from the graph that the relative velocity distribution exhibits two main peaks, corresponding to kn and kn, respectively.
4.4. Determining the Membership Degree Based on Statistical Patterns
4.4.1. Membership Degree Function for Encounter Course
The research conducted by Pietrzykowski et al. [9] found that the encounter course of a ship will influence the size of its ship domain. As shown in Figure 11, the relationship between the encounter course and the minimum passing distance of ships can roughly represent the relationship between the encounter course and the ship domain. Through statistical analysis of actual ship traffic data, it can be further analyzed that when the encounter chord angle between the head-on ship and the give-way ship is less than , the ship domain increases linearly with an increase in the encounter course. However, when the encounter chord angle exceeds , the size of the ship domain remains at its maximum.
Therefore, based on the statistical patterns of the encounter course and the minimum passing distance, the membership degree function for the encounter course is given by Equation (22).
4.4.2. The Membership Degree Function of Ship Traffic Intensity
The traffic intensity of ships is defined as the number of ships per unit area at a particular moment [1]. Goodwin [3] suggests that the traffic intensity and ship’s length in different maritime areas have an impact on the size of ship domains. In subsequent studies, Zhao et al. [17] further proved that ship domains are influenced by the traffic intensity of the navigational area, whereby higher traffic intensity results in smaller ship domains.
In this study, it has been found that the traffic intensity of ships in this waterway roughly follows a normal distribution. The intensity levels can be categorized based on the cumulative frequency of traffic intensity. This method of classifying based on cumulative frequency is also applied in road traffic to determine speed limit ranges for vehicle movement. In Figure 12, it is shown that the traffic intensity value corresponding to a cumulative frequency of 85% represents that 85% of the ships are navigating within the range of this intensity (25.5 ships/100 km2). When the cumulative frequency value of traffic intensity exceeds 85%, the intensity corresponding to that frequency is considered to significantly affect the traffic conditions in the waterway, as only 15% of the ships can navigate above this intensity value. Similarly, when the cumulative intensity frequency is less than 15%, the corresponding traffic intensity (14 ships/100 km2) can be regarded as having no significant impact on ship traffic.
Based on the impact of traffic intensity on the ship domain, the membership function of traffic intensity can be determined, as shown in Equation (23).
4.4.3. Membership Function for Relative Velocity
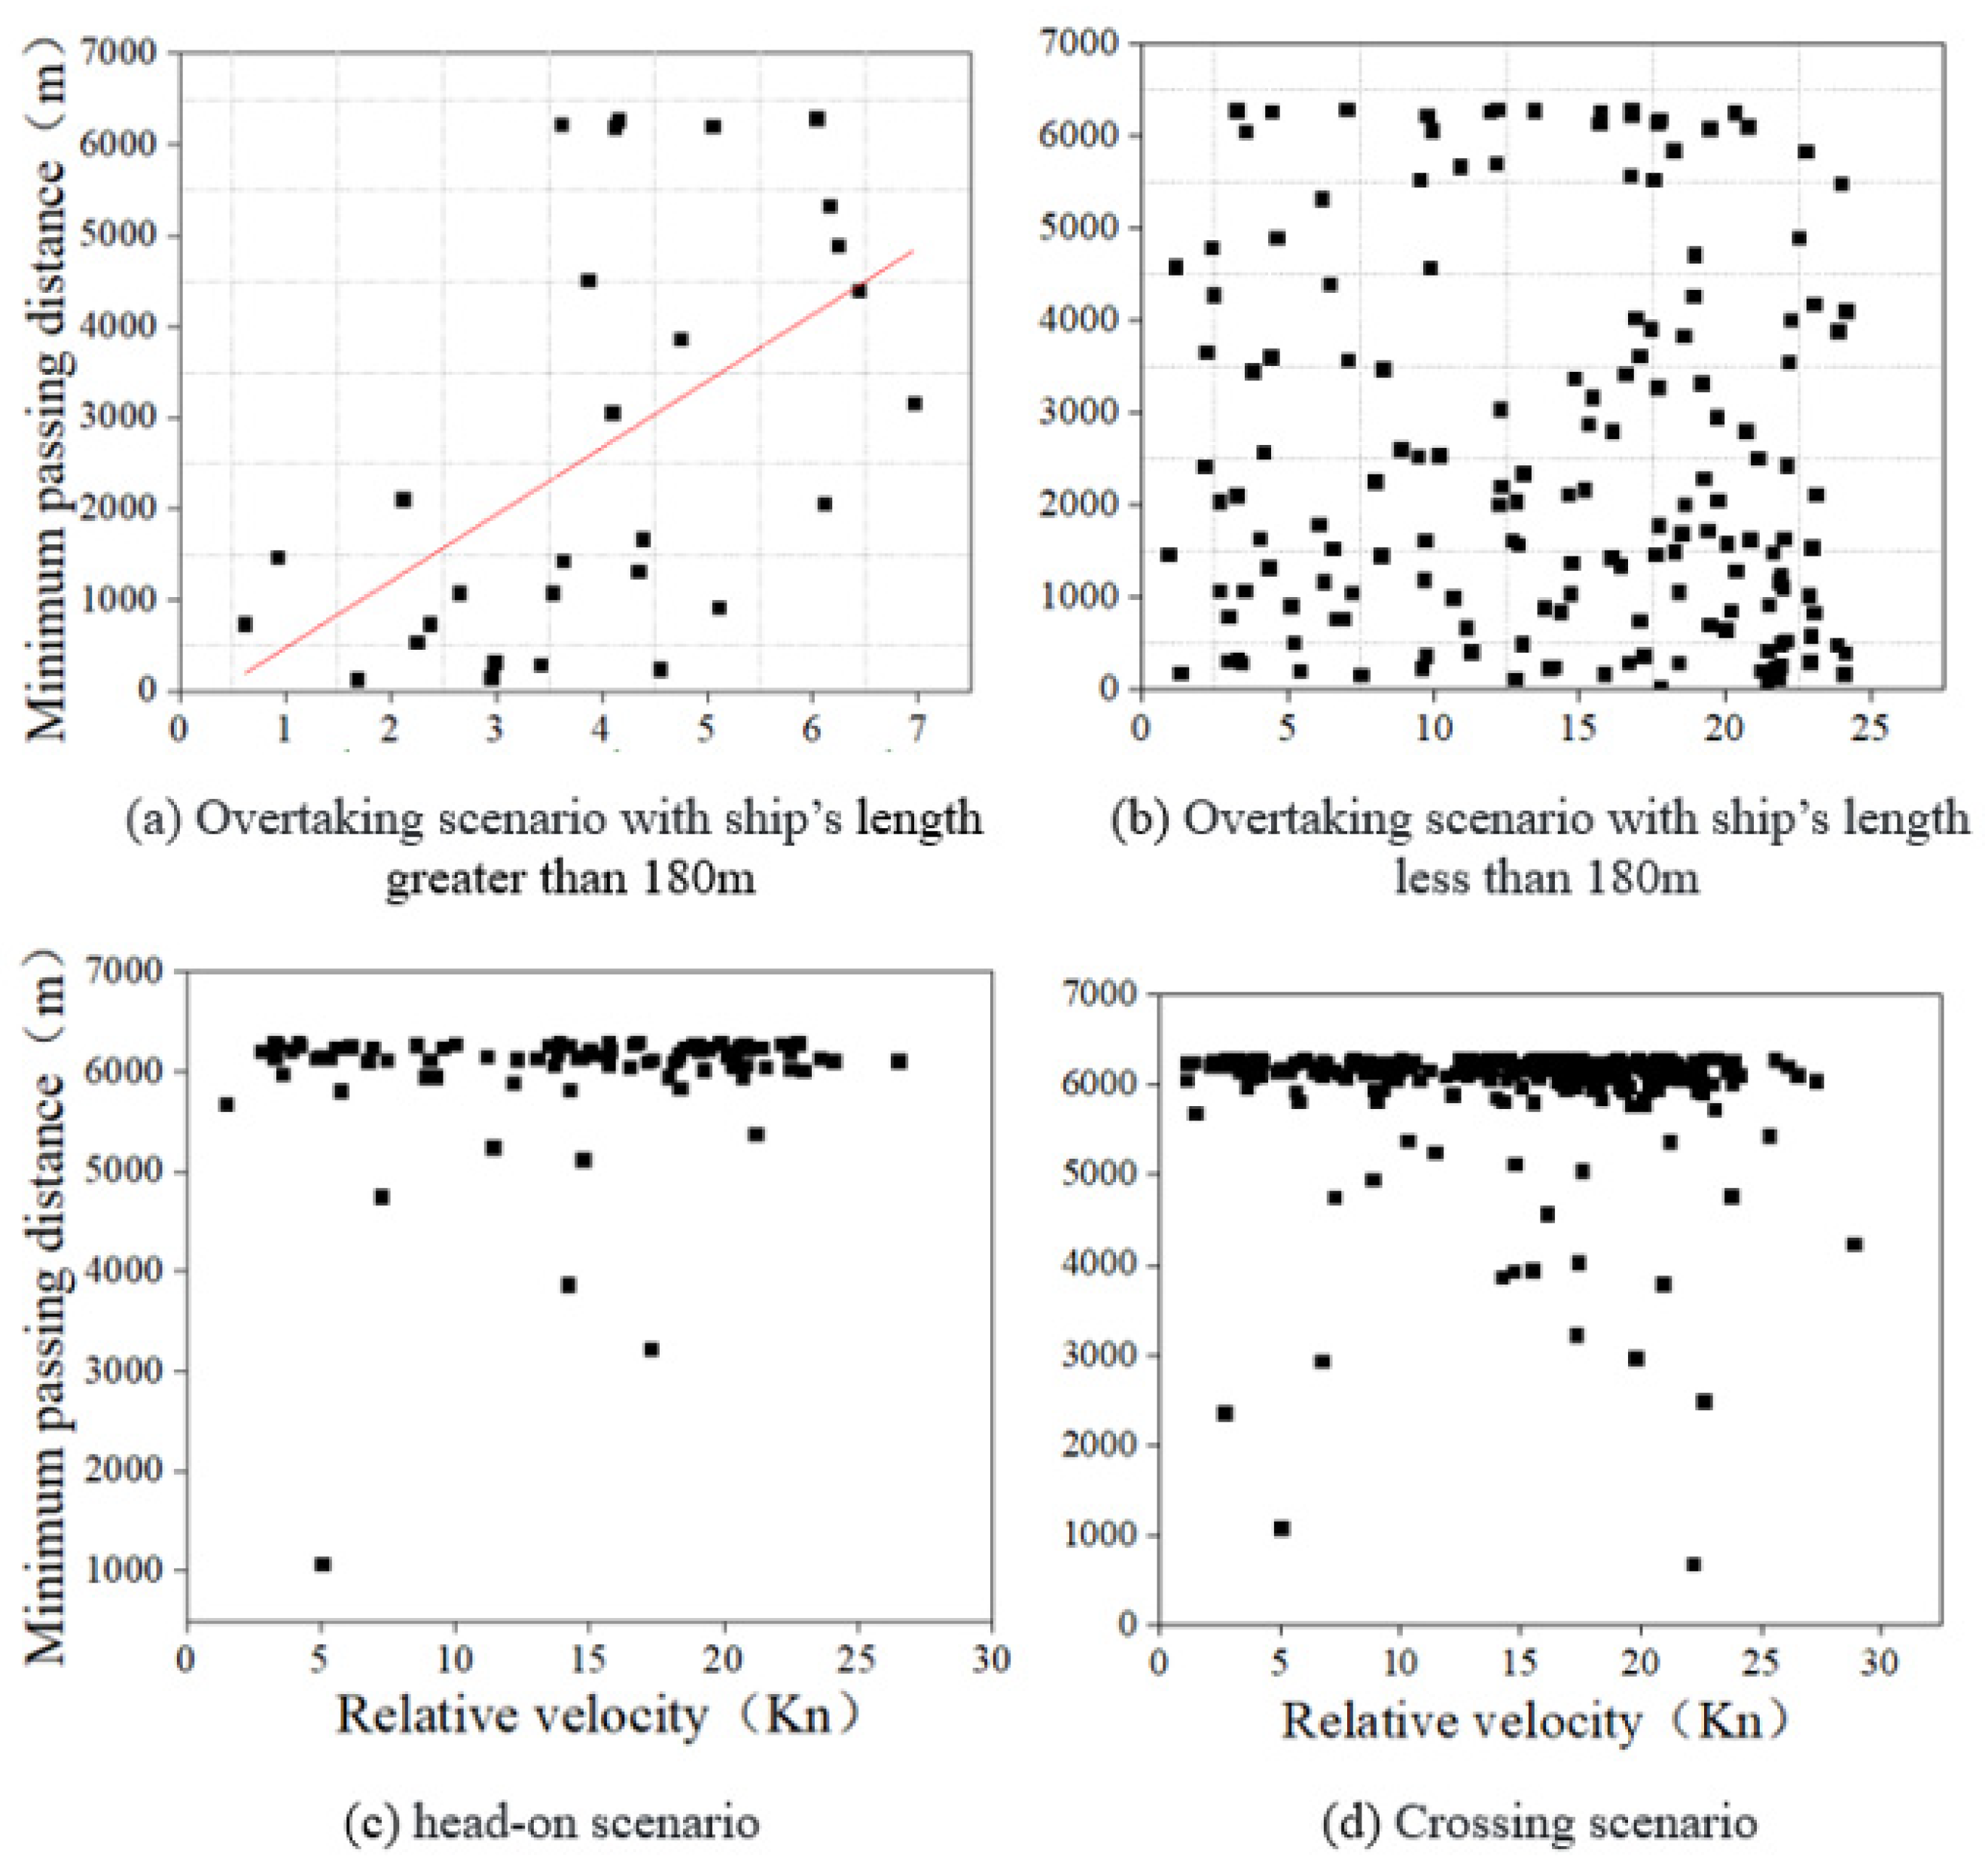
The size of the ship domain is influenced by the relative velocity of ships [18]. This article characterizes the relationship between relative velocity and ship domain by analyzing the relationship between the relative velocity of encountering ships and the minimum passing distance.
As shown in Figure 13a, the statistical results indicate that under overtaking conditions, when the length of the ship is large (ship length L > 180 m), there is a linear increasing trend between the minimum passing distance between ships and the relative velocity. This directly implies that for larger ships during overtaking, a higher relative velocity has a greater impact on the ship domain. As shown in Figure 13b, it is worth noting that for ships with a length less than 180 m, there is no relationship between the minimum passing distance and the relative velocity during overtaking, indicating no relationship between the ship domain and the relative velocity. Furthermore, most smaller ships with shorter lengths have smaller domains during encounters. As shown in Figure 13c,d, when ships are in a head-on or crossing situation, regardless of the ship size or the magnitude of relative velocity, the minimum passing distance generally remains at its maximum value. This indicates that the relative velocity between ships significantly impacts the ship domain during head-on and crossing situations, regardless of ship size.
By establishing the inherent connection between the relative velocity of ships and the ship domain, the membership function for relative velocity has been statistically derived, as shown in Equation (24).
4.5. Determining the Weights of Influencing Factors
In the literature [14], Chinese researchers explored the influencing factors in the ship domain of open waters. They conducted their study using AIS data from the Bohai Sea and the northern Yellow Sea. Employing the rough set algorithm, the authors determined the dependency and importance of the influencing factors in the ship domain. The study confirmed that, in open water with suitable visibility, the impact of wind, currents, and waves on the ship domain was deemed insignificant (importance set to zero). Hence, the study excludes the influence of wind, currents, and waves. The authors concluded that the importance weights of encounter course, ship traffic intensity, and relative velocity were determined to be 0.2791, 0.2359, and 0.2008, respectively.
The factors examined in this study are encounter course, ship traffic intensity, and relative ship velocity. These factors are found to be independent of each other, with no existing dependency relationship. As a result, their importance is relatively consistent, allowing for the normalization of their weights. Consequently, the weight matrix for indicators in open water is as follows:
4.6. Determining the Weight of the Navigator State
To calculate the shape parameters, it is necessary to determine the weights of the navigator state factors, which include knowledge and skills, psychological qualities, and physiological qualities. The weight vector for the navigator state is denoted as , .
As human personality traits tend to be relatively stable, the weights of the navigator’s knowledge and skills, psychological qualities, and physiological qualities on the shape function are also relatively stable. Therefore, this paper refers to the definition and classification of human factors by the International Maritime Organization (IMO) and extracts indicators related to the navigator state (knowledge and skills, psychological qualities, and physiological qualities) [19]. Combined with the statistics provided by Chinese scholars like Fan Shiqi et al. [20,21], which collected accident reports involving 208 ships from the Marine Accident Investigation Branch (MAIB) and the Traffic Safety Board (TSB) between January 2012 and December 2017, a total of 161 accidents were analyzed. From this analysis, 32 types of human error risk factors and their corresponding frequencies were obtained, which were then used to determine the weights of these human factors.
The final analysis calculated the weights of the navigator state, including knowledge and skills, psychological qualities, and physiological qualities, based on the frequencies of accidents caused by risk factors related to these factors. The normalized accident frequency was used as the weight for each indicator, as shown in Table 3. After computation, the weights for the navigator state are as follows:
5. Model Validation and Simulation
5.1. Experimental Scenario Setup
This article selects a container for simulation to study the impact of changes in the traffic environment on the ship domain in the Lao Tie Shan Waterway. The main parameters of the ship are shown in Table 4. Depending on the different encounter situations the container faces in the water area, the size of the ship domain in this waterway dynamically changes with modifications in ship traffic conditions.
This article categorizes the navigation states of the driver during the navigation process, and the criteria for classification are shown in Table 5. The navigation states of the driver (knowledge and skills, psychological qualities, and physiological qualities) can be classified into the following six categories. The simulated process in this article includes all the states, from poor to excellent, during the navigation process.
5.2. Reliability of Navigator States and Shape Coefficients in the Ship Domain
Through simulation, the reliability of navigator states and their relationship with the variations of navigator states can be obtained. As shown in Figure 14, the comprehensive state of the navigator is determined by their knowledge and skills, psychological qualities, and physiological qualities. The better the navigator state, the higher their reliability. When the navigational state is excellent, the reliability approaches 1. The relationship between the shape function in the ship domain and the state of the driver is shown in Figure 15. As the navigator state improves, decreases. This indicates that as the navigator state improves, the boundaries of the ship domain become smoother.
5.3. Model Validation
5.3.1. Validation of Changes in Ship Domain Size
This study aims to validate the effectiveness of the proposed model by utilizing real AIS data to accurately depict the traffic conditions in a water area. Through computer simulations, the relationship between the size of the ship domain, encounter courses, traffic intensity, and relative velocity in the real water area is thoroughly examined. These validation results serve as further evidence of the validity and reliability of the model put forth in this paper.
Figure 16a shows the impact of encounter course and traffic intensity on the coefficient of ship domain size. The statistical data are fitted using the least squares method to present the relationship more intuitively. From the graph, it is evident that as traffic intensity decreases, the encounter course of ships also decreases, resulting in smaller variations in ship domain size. On the other hand, when both traffic intensity and encounter course are large, the ship domain size significantly increases.
In Figure 16b, the influence of the encounter course and relative velocity on the size of the ship domain can be observed. It can be seen from the graph that the size of the ship domain decreases as the encounter course and relative velocity decrease. When the traffic intensity is low or high, the rate of decrease in the ship domain is generally the same. However, under the same encounter course and relative velocity, the ship domain undergoes greater changes when the traffic intensity is high.
In Figure 16c, the relationship between traffic intensity, relative velocity, and the size of ship domain changes is shown. The graph illustrates that, under the same relative velocity, smaller traffic intensities have a smaller impact on the size of the ship domain. The study conducted by WU et al. [12] suggests that as the traffic intensity decreases during encounters, the ship domain is less affected, resulting in smaller changes in the ship domain area. The graph confirms and aligns with the previous findings in this regard.
5.3.2. Verification of Changes in Ship Domain Shape
This paper validates the effectiveness of the dynamic ship domain model by evaluating the relationship between the ship domain shape function and the knowledge, skills, psychological factors, and physiological qualities of the ship operator through computer simulations.
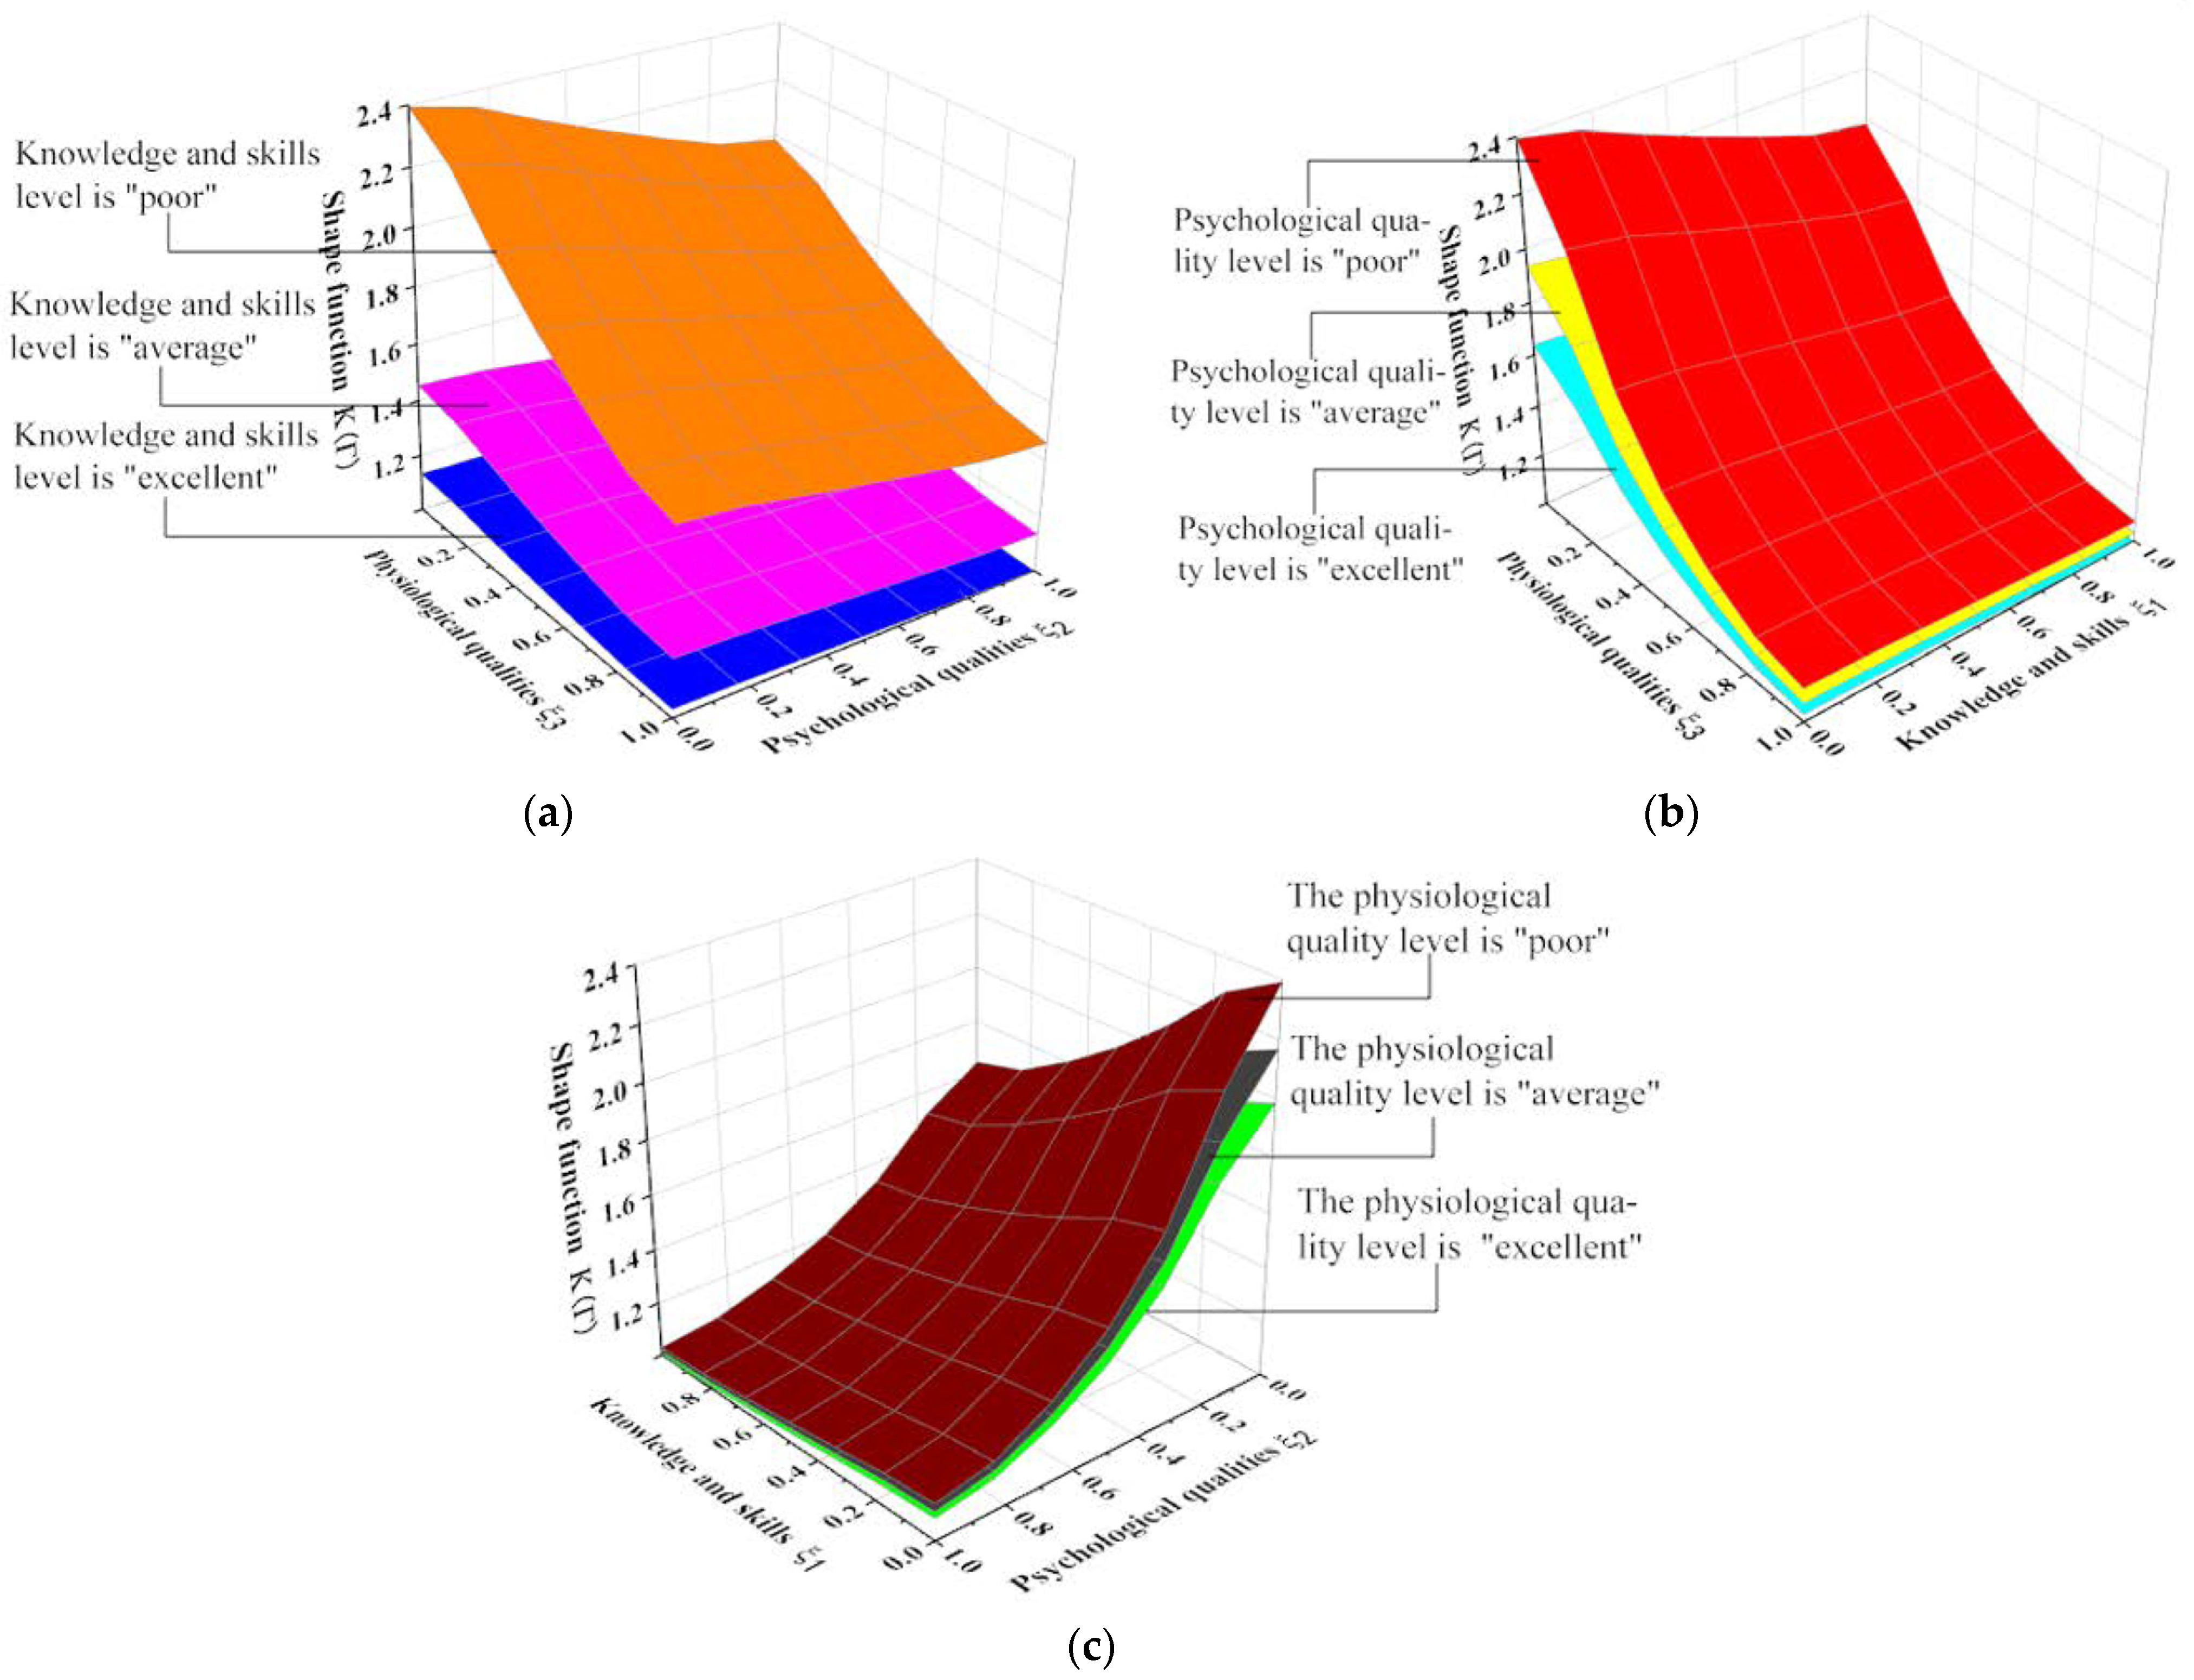
According to research, it has been found that the smaller the shape function, the smoother the boundaries of the ship domain, and the smaller the area of the domain. As shown in Figure 17a, for drivers with three different knowledge and skill backgrounds, the shape function of the ship domain decreases as their psychological and physiological qualities increase. This indicates that drivers with higher psychological and physiological qualities correspond to smaller areas in the ship domain. The variation in the shape function in the ship domain is notably significant as navigator knowledge and skill levels fluctuate between poor, average, and excellent. This clearly indicates that drivers with different knowledge and skill backgrounds have a remarkable impact on the shape of the ship domain. Moreover, as navigator knowledge and skill proficiency improve, the shape coefficient of the ship domain changes gradually and with less magnitude as their physiological and psychological qualities evolve. Conversely, when drivers have limited knowledge and skill, the change in the shape function is most pronounced, which aligns perfectly with the objective reality of ship navigation.
Figure 17b illustrates the variation in the shape function in the ship domain as navigator knowledge and skill levels, as well as their physiological qualities, change. The higher the navigator’s knowledge and skill proficiency and physiological qualities, the smaller the shape function becomes. When the physiological qualities are between average and poor, the shape function decreases most rapidly. However, as the physiological qualities reach above average, the change in the shape parameter becomes more gradual, aligning with the objective navigation scenario. When a navigator’s psychological qualities are categorized as poor, average, and excellent, the magnitude of change in the shape parameter varies. The poorer the psychological qualities, the greater the magnitude of change and the faster the rate of change, which aligns with the objective reality of navigation.
Figure 17c demonstrates the variation in the shape function in the ship domain according to navigator knowledge and skill levels as well as their psychological qualities. The shape function decreases rapidly as the navigator’s psychological qualities and knowledge and skill levels increase. When the navigator’s physiological qualities are categorized as poor, average, and excellent, the magnitude of change in the shape function differs. The poorer the physiological qualities, the greater the extent of change in the shape and area of the domain and the faster the rate of change, which completely aligns with the objective reality of navigation.
By integrating the simulation results and analysis of navigator knowledge and skill levels, psychological qualities, physiological qualities, and the shape function in the ship domain, it is evident that the model algorithm aligns well with the objective navigation scenario. This demonstrates the strong feasibility and applicability of the model.
5.4. Model Simulation
5.4.1. Simulation of Ship Domain Size Variation
The traffic conditions and basic characteristics of containers in the open waters of the Lao Tie Shan Waterway are taken as the fundamental data. Based on the different encounter situations faced by a container in this waterway, the traffic intensity, encounter course, and relative velocity of the container are calculated, taking into consideration the ship’s length and speed. An algorithm model is constructed using Python to ultimately determine the variations in the container ship domain, as shown in Figure 18. In this water area, the size of the ship domain dynamically changes with the alteration of ship traffic conditions. The ship domain of a container is not a fixed value; rather, it has different corresponding domain radii under different traffic conditions. From 2018/6/1 to 2018/6/10, the variation in the four radii of the ship domain under different time periods and navigation conditions is illustrated in Figure 19.
5.4.2. Simulation of Ship Domain Shape Variation
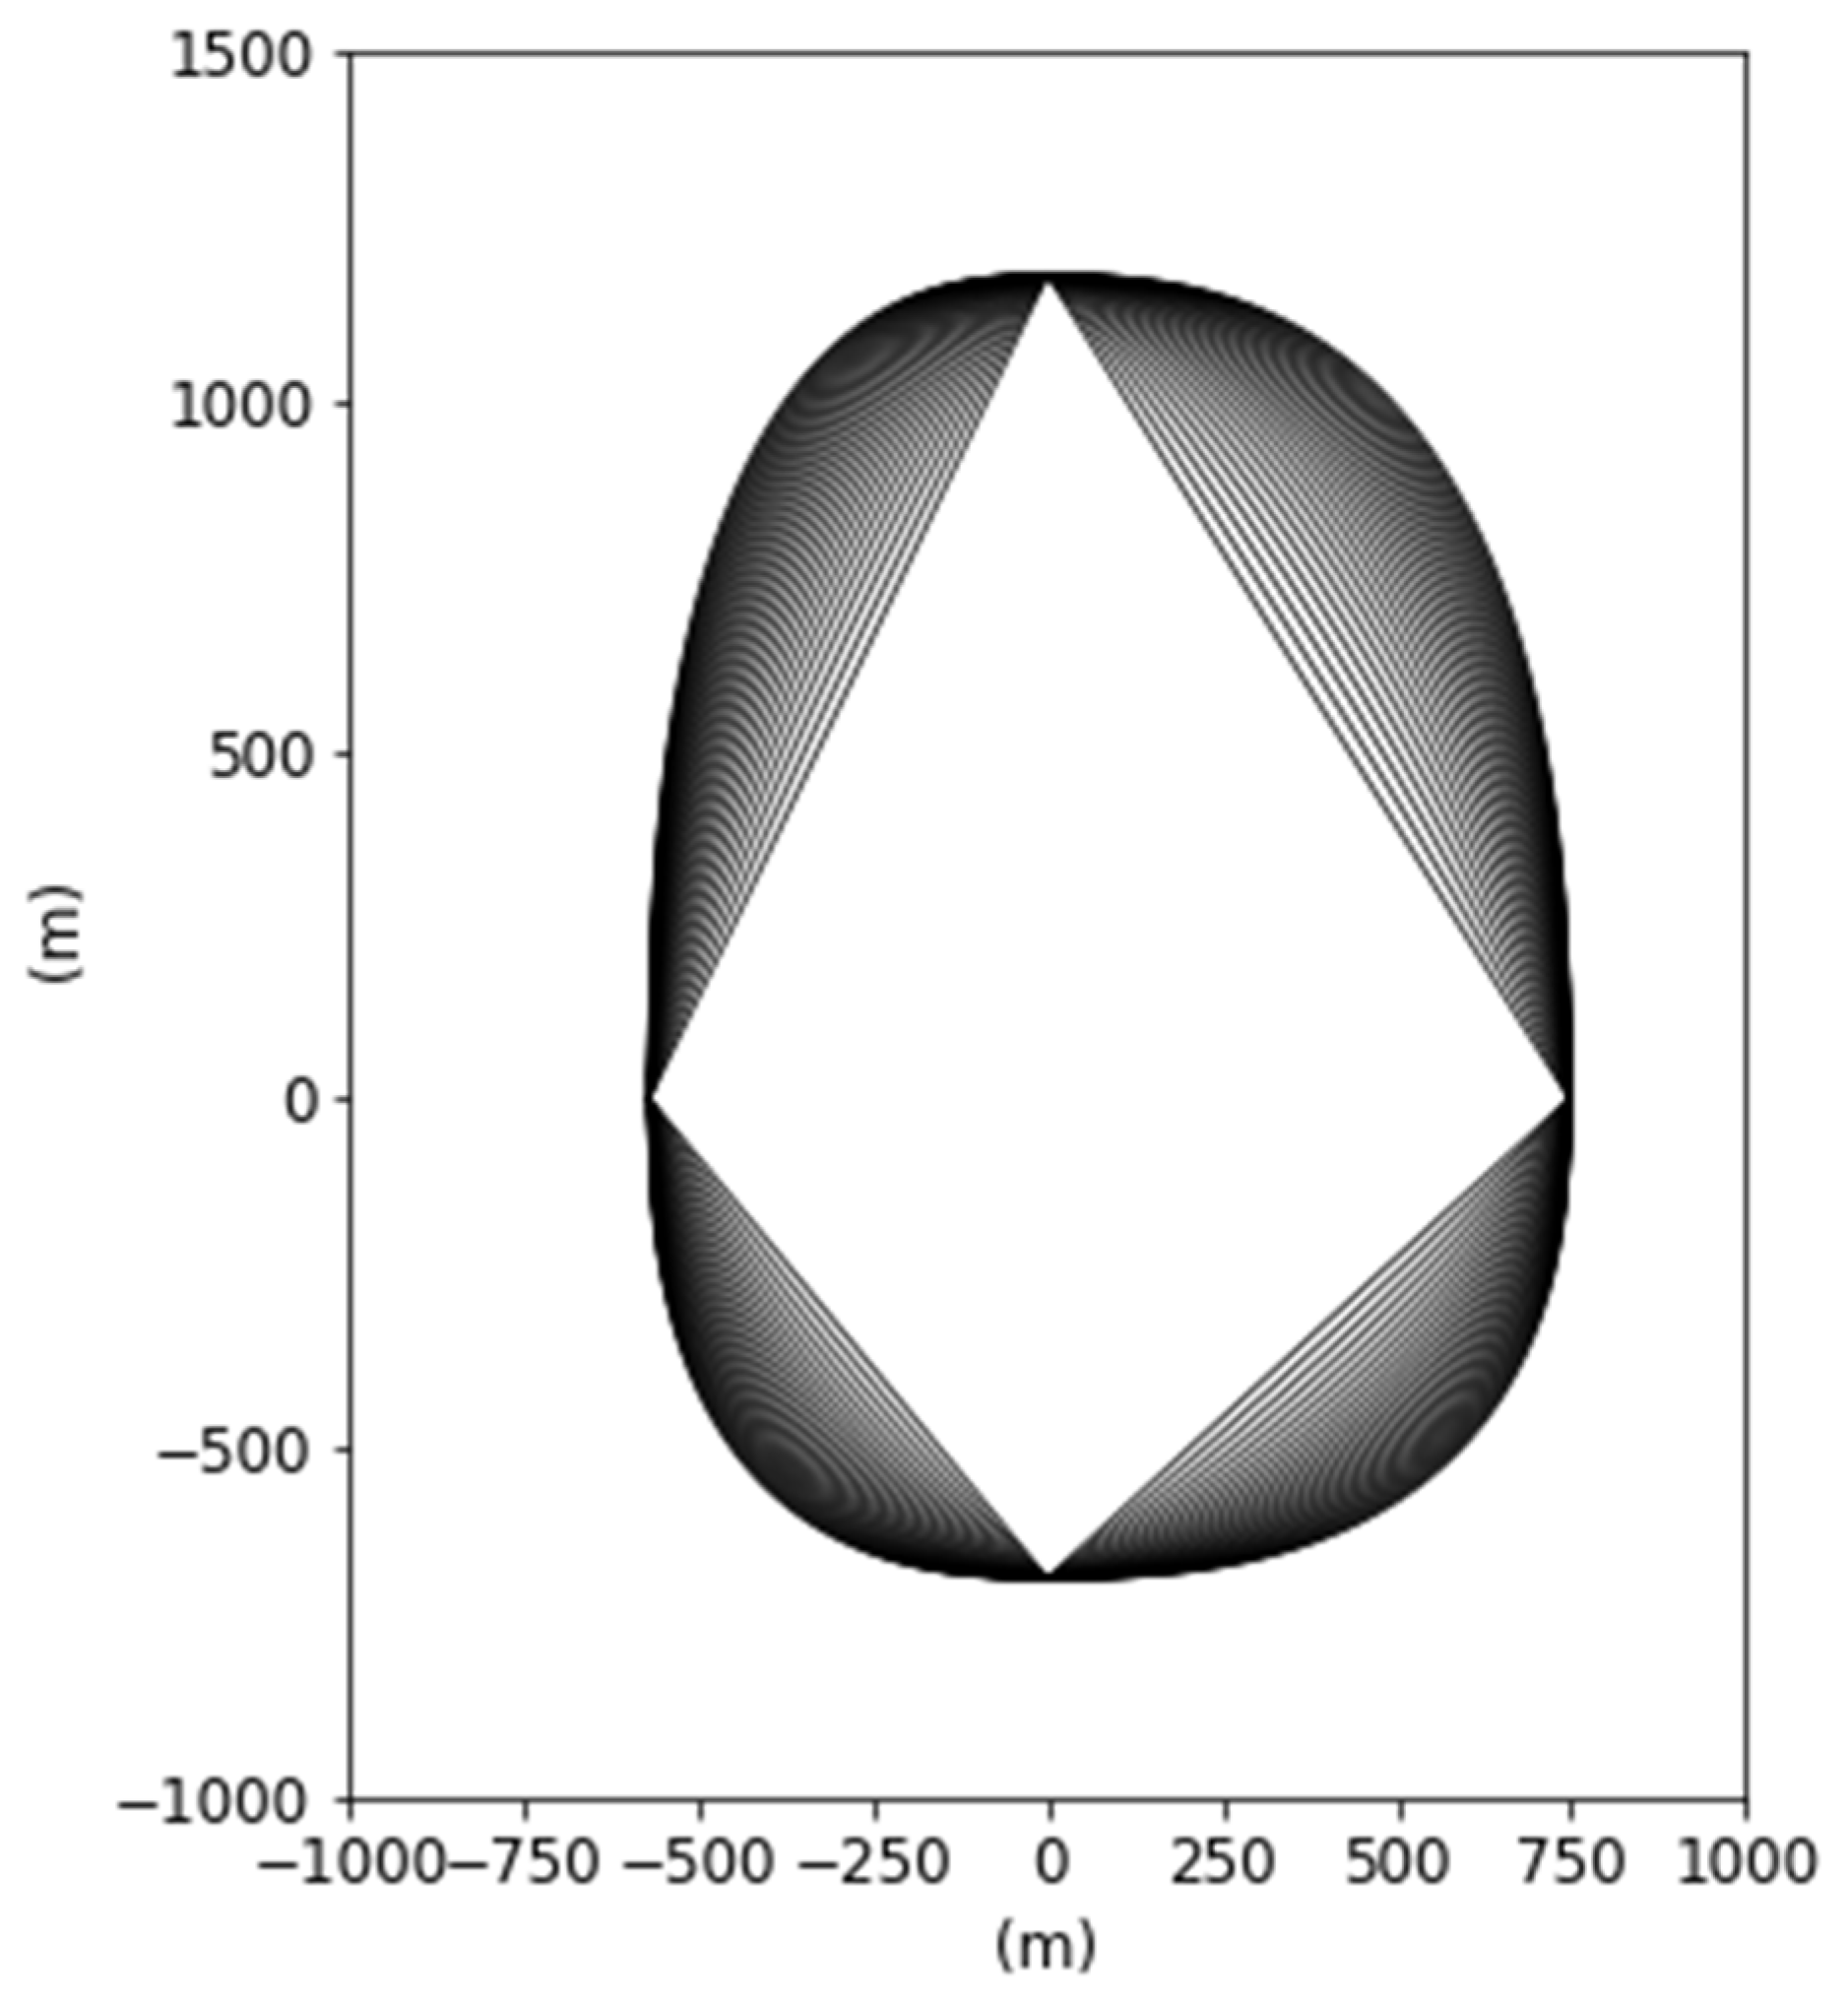
The simulation results of the boundaries in the ship domain are shown in Figure 20. The shape and area of the ship domain change dynamically with the navigator state. A deteriorating navigator state will cause the shape of the ship domain to continuously expand outward, and the domain area will also increase. When the navigator state is at its best, the shape of the ship domain is the smallest.
6. Discussion
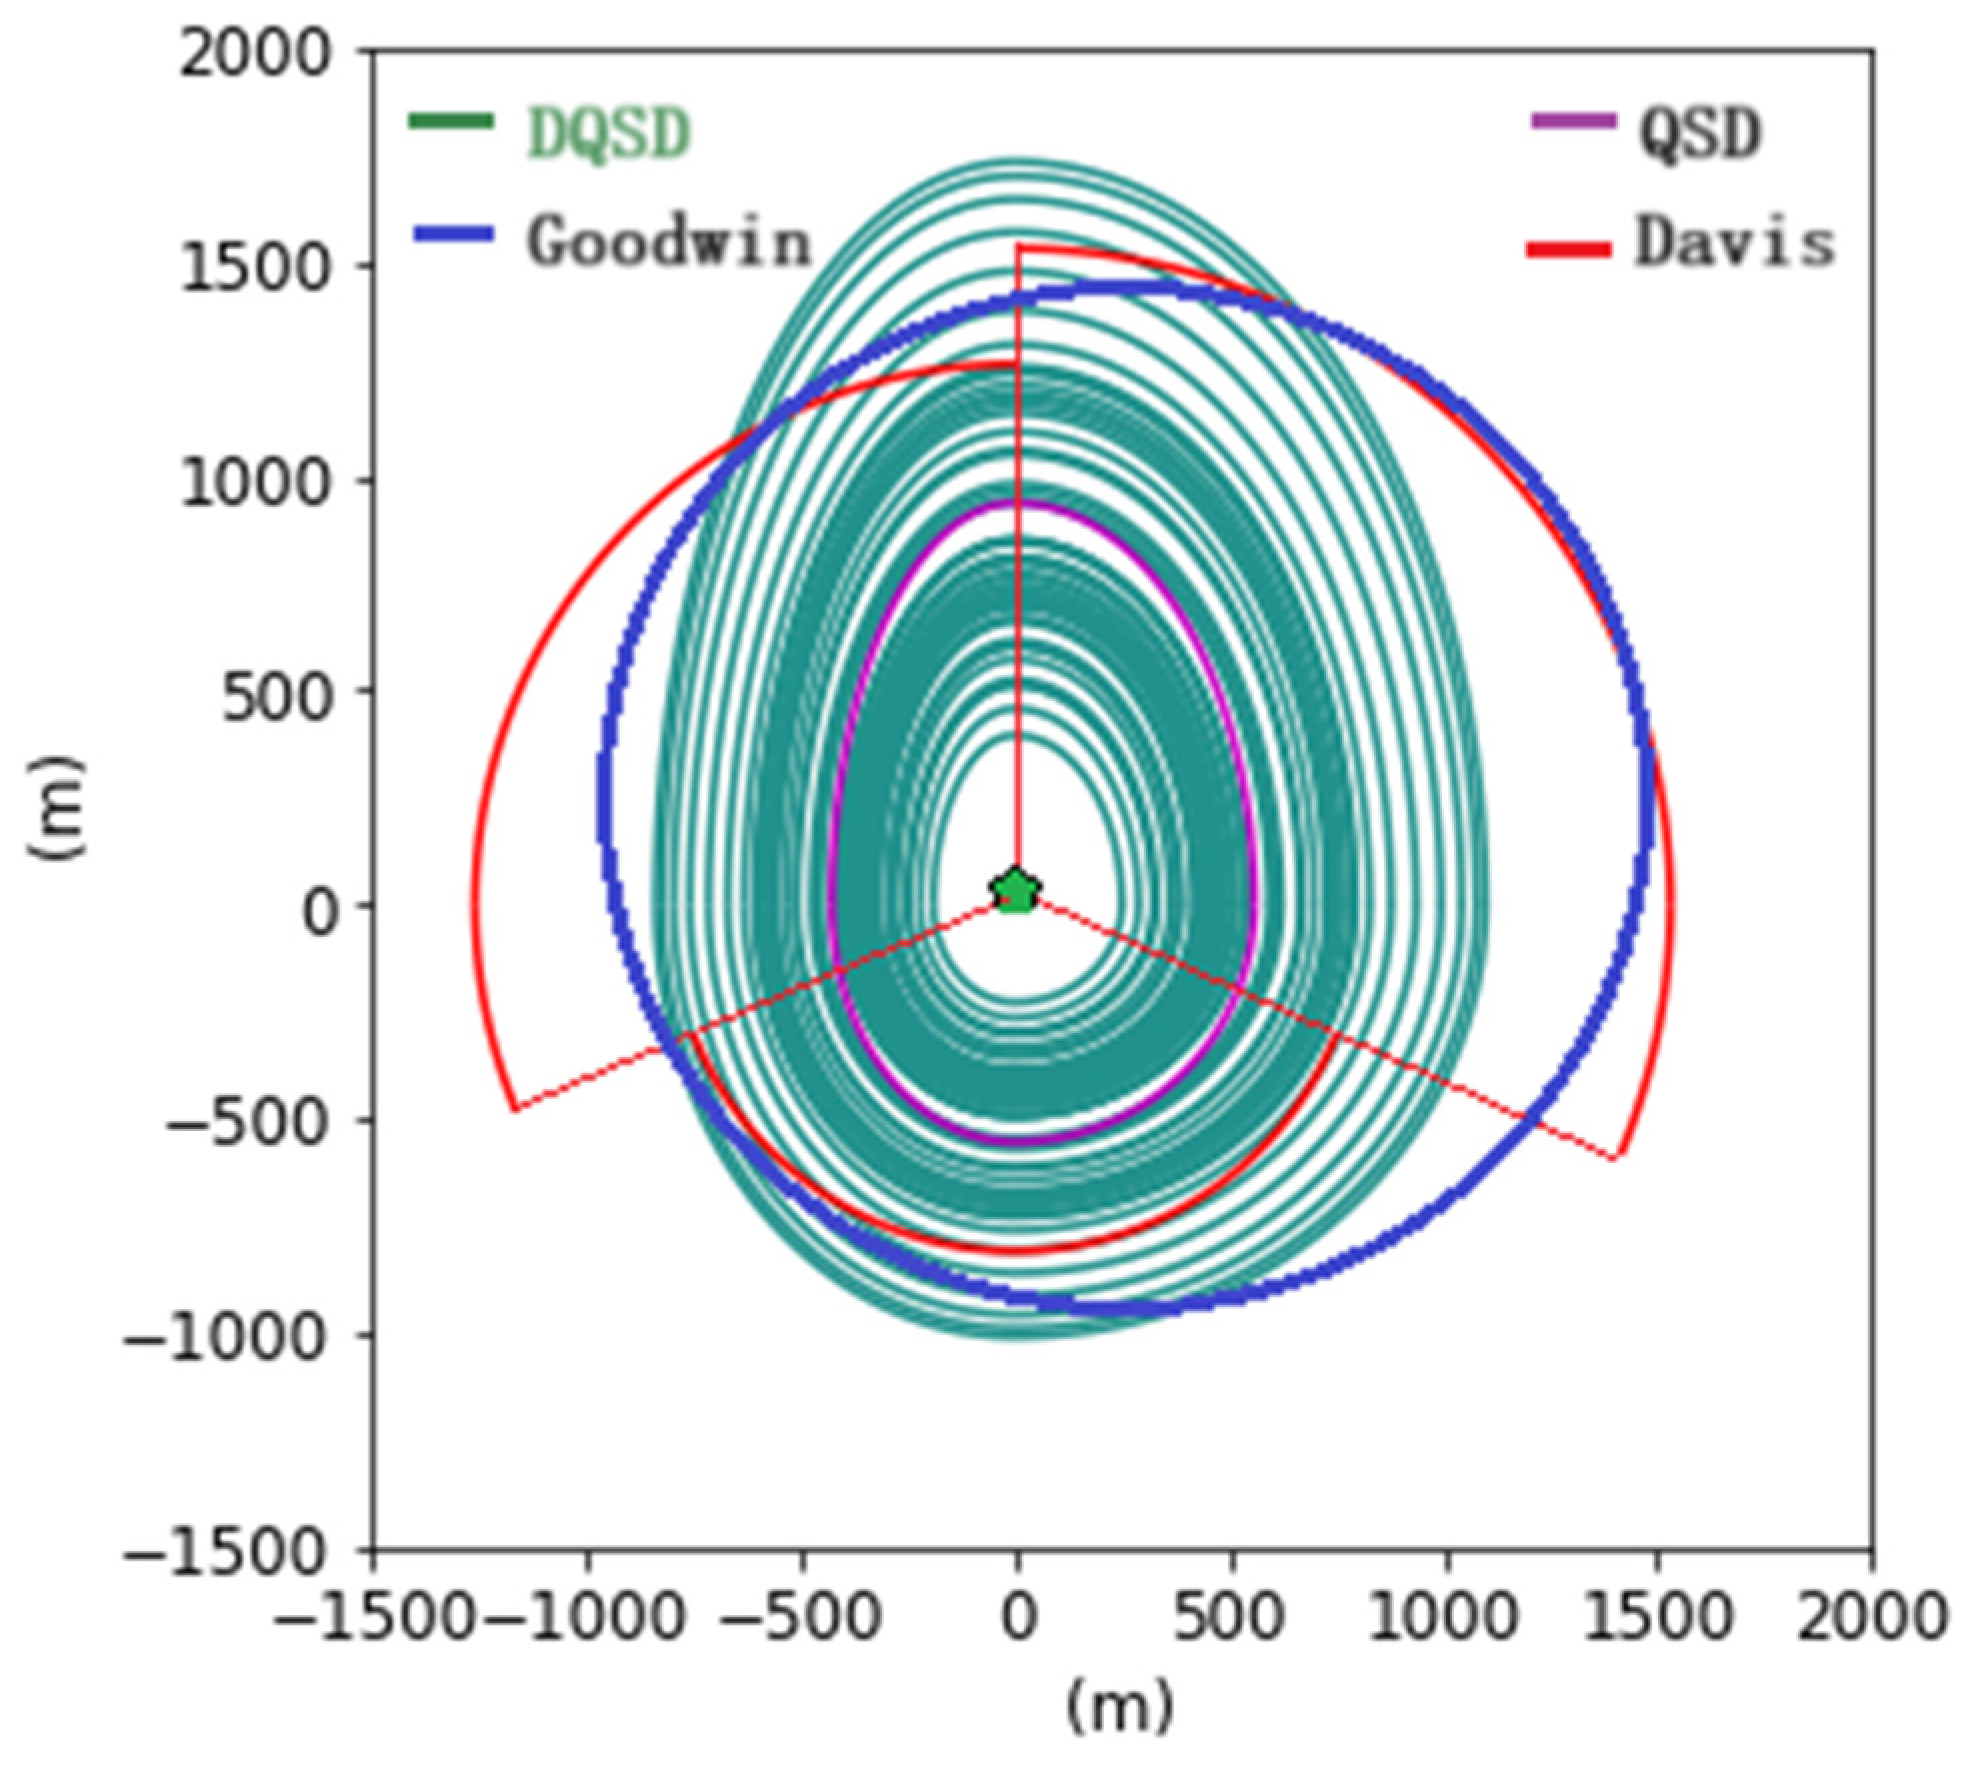
As shown in Figure 21, this article compares the established DQSD with the previous QSD established by Goodwin and Davis in open-water areas. Firstly, it has been found that the previously proposed QSD is much smaller than the ship domain established by Goodwin and Davis. It represents a relatively smaller domain, which directly reflects its unsuitability for water areas with complex traffic conditions and a higher number of large ships. Secondly, the QSD is obtained during moderate traffic conditions in a waterway. In the actual process of navigation, the ship is constantly faced with changing surroundings, and the ship’s domain does not remain the same at all times. In comparison to the QSD, the size and area of the DQSD change with varying traffic conditions. When conditions become more complex, the DQSD becomes closer to and compatible with the ship domain established by Goodwin and Davis. Conversely, when the ship operates in suitable traffic conditions with lower ship intensity, the required safety space for the ship is not extensive, resulting in a smaller ship domain. This aligns with the model established in this article. The superiority of the DQSD lies in considering a more comprehensive range of factors, thus providing a more realistic reflection of the actual ship domain size during navigation. In summary, the DQSD established in this article surpasses the previous models.
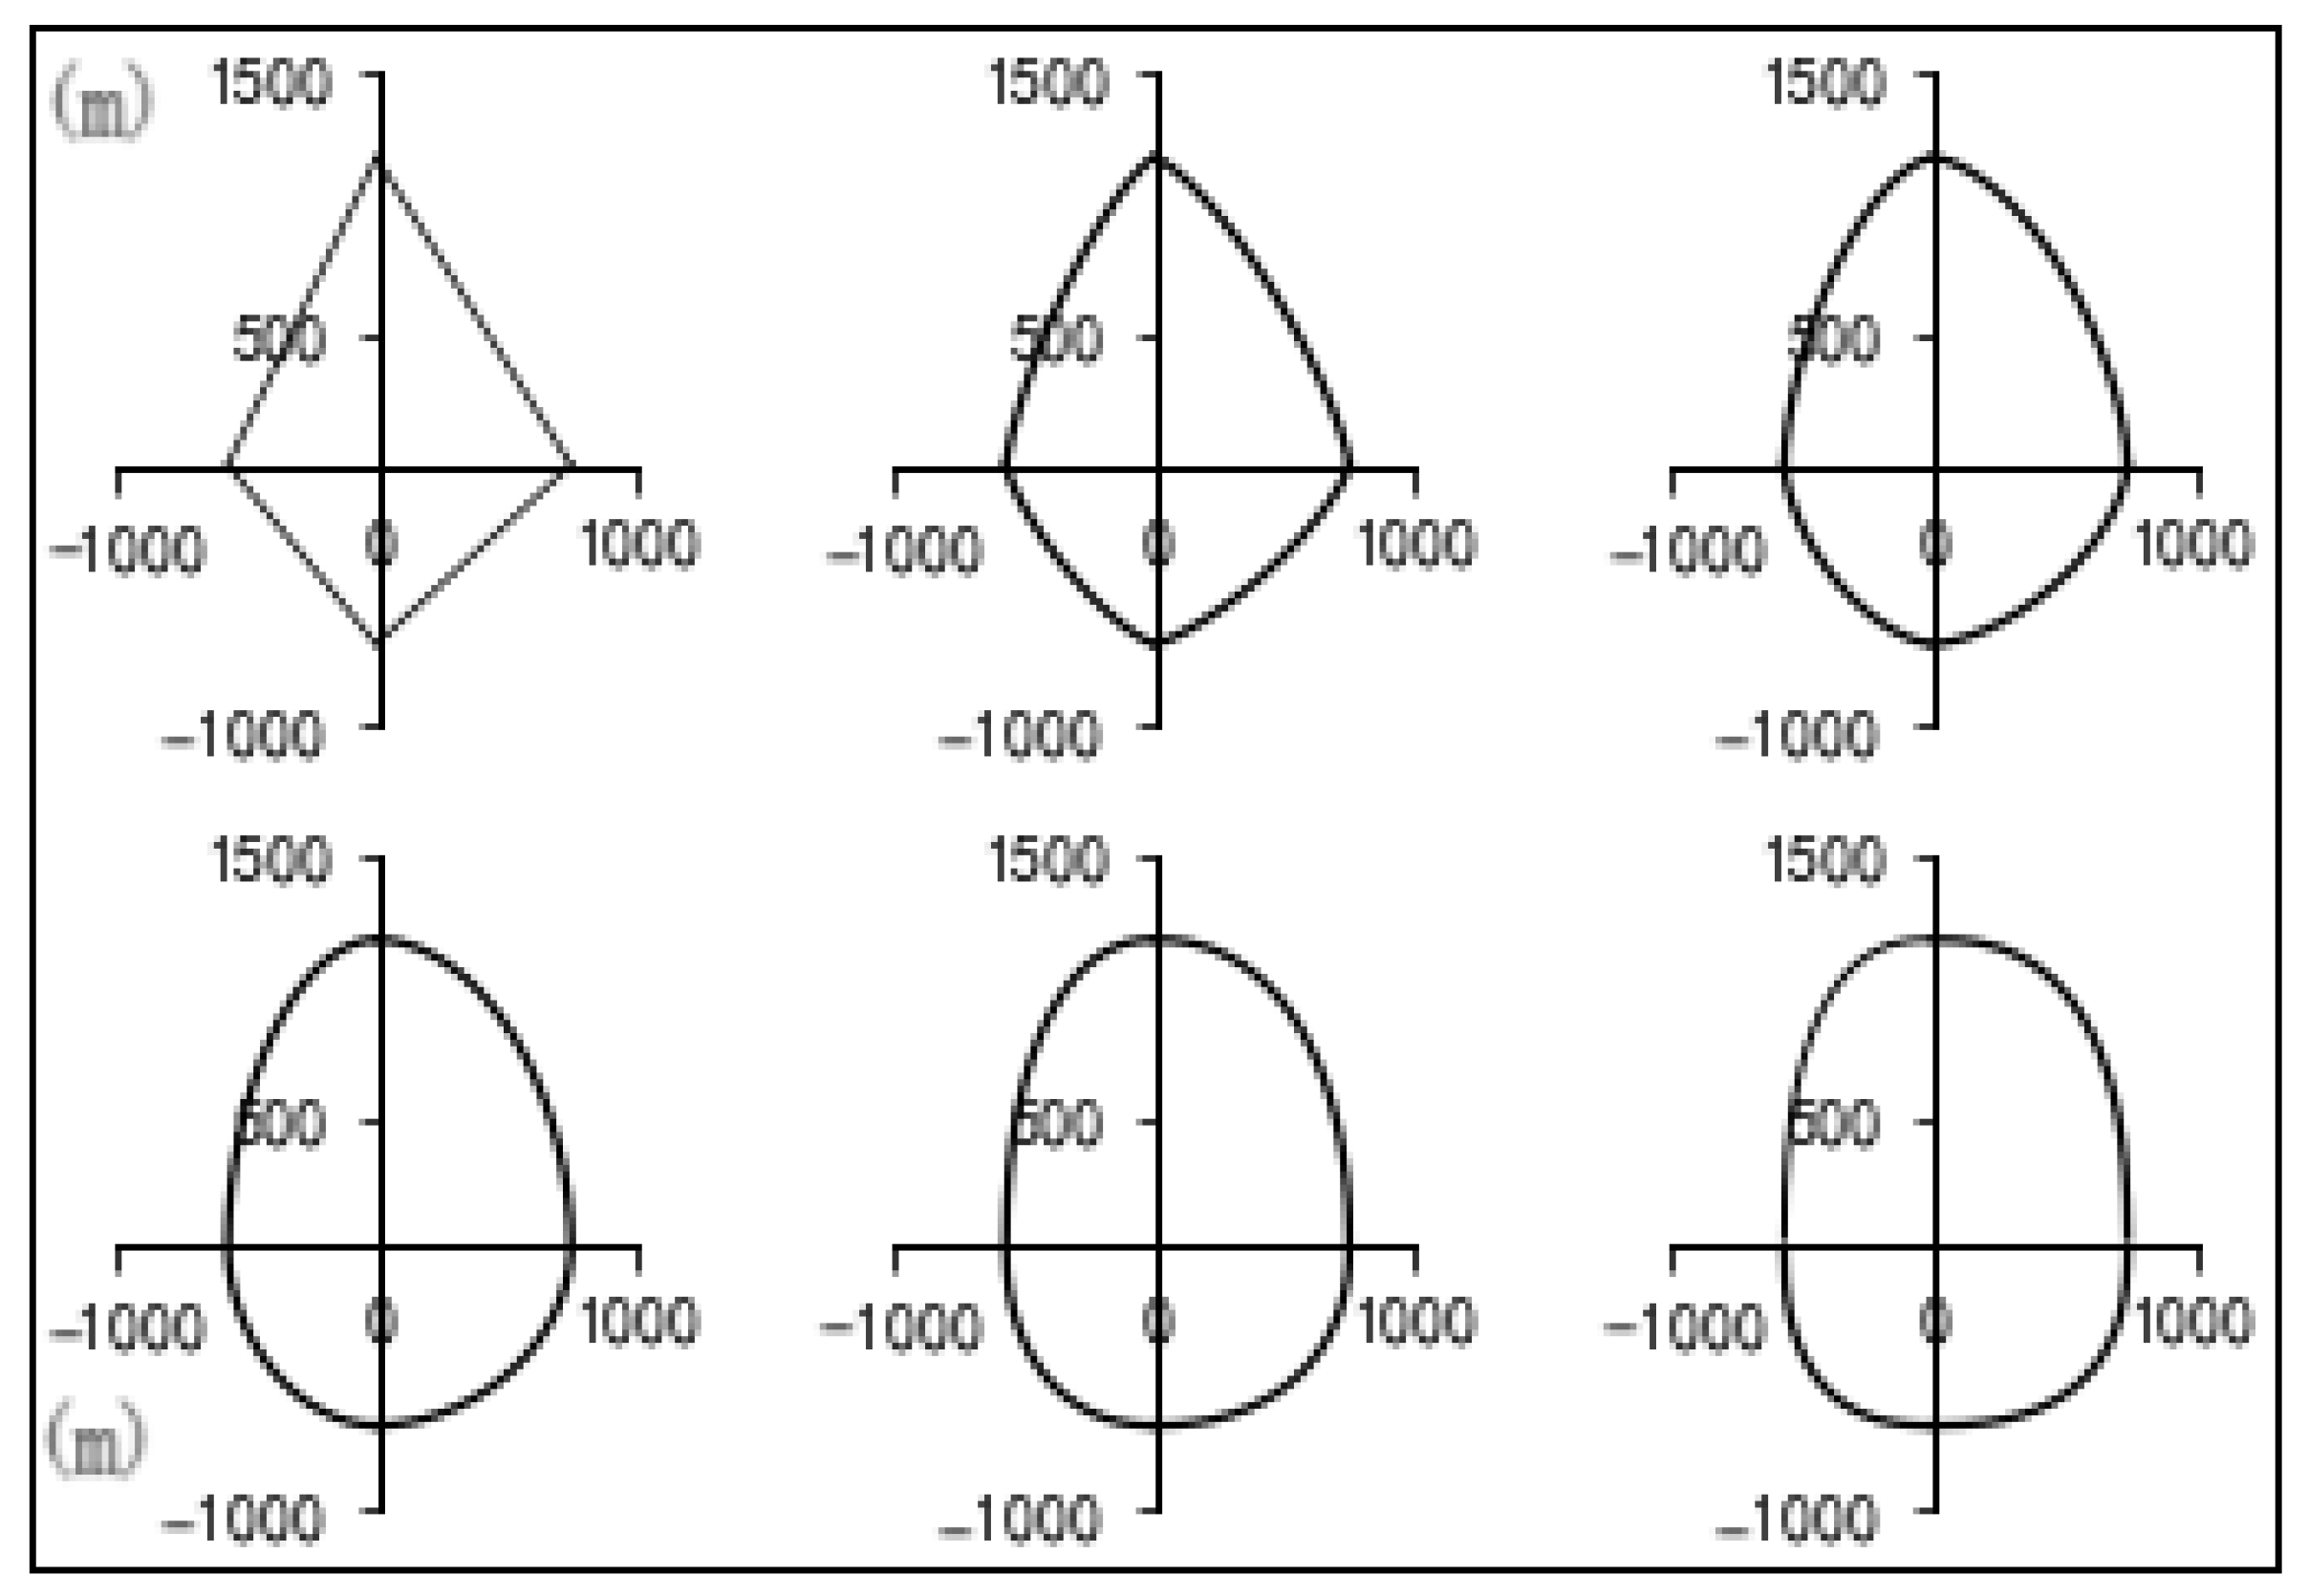
As shown in Figure 22, when the navigator state is excellent, the ship domain takes the form of a smooth and irregular diamond shape, which is the smallest among all ship domain models. When the navigator state is average or higher, the ship domain appears as an elliptical shape. However, when the navigator state is poor, the ship domain shape resembles a rectangle, representing the largest area among all ship domain models. The shape of the ship domain changes dynamically with the navigator state, ranging from poor to slightly poor to average to slightly good to good to excellent. As the navigator state improves, the ship domain shape continuously contracts inward, with smoother boundaries and a smaller area. Conversely, as the navigator state deteriorates, the ship domain expands outward, resulting in a larger area.
Figure 23 illustrates the changes in the ship domain during the actual navigation process for encountering ships in the Lao Tie Shan Waterway. With the model established in this study, we can observe the variations in the ship domain during the actual navigation process for drivers in different states.
7. Conclusions
To establish a more comprehensive ship domain model, this paper integrates actual AIS data from water areas with the foundation of the QSD while taking into account the influence of human–ship–environment interactions on ship domains. This paper effectively combines subjective and objective factors to promptly identify subjective and objective information in open-water areas and calculates the size and boundary shape of ship domains. The research findings can also provide support for future research on autonomous collision avoidance.
(1) The DQSD model established in this article is essentially a combination of empirical ship domain and analytical ship domain models. The QSD is derived from analytical expression analysis, involving multiple parameters but considering fewer factors. As a result, it does not adapt to changes in traffic conditions and is not suitable for complex open-water areas. On the other hand, the DQSD incorporates considerations for encounter course, traffic intensity, and relative velocity. It has been validated using actual AIS data, successfully combining empirical and analytical methods, and further advancing previous QSD models.
(2) Compared to the QSD, the DQSD model is more compatible with the empirical ship domain model established by Goodwin and Davis in open-water areas, particularly when there is high ship traffic intensity. It is better suited for open-water scenarios. The main reason is that Goodwin and Davis’s ship domain model was developed under conditions of high ship traffic intensity and complex waterway traffic, which were not considered in the modeling process of the QSD. Therefore, in open-water areas, the QSD appears smaller, but the DQSD effectively compensates for this limitation.
(3) This paper builds a dynamic ship domain model based on the previously proposed QSD. By determining the boundaries of the domain according to the navigator state and after verifying the effectiveness of the model, the final result is a dynamic ship domain with changing boundary shapes corresponding to the navigator state changes. The research results indicate that the better the navigator state, the more the shape of the ship domain tends to shrink inward, resulting in a smaller domain area. When the navigator state is optimal, the ship domain attains the smallest area, forming an irregular diamond shape. Conversely, when the navigator state is poor, the ship domain has the largest area and approximately takes the shape of a rectangle. This study addresses the challenge of determining the ambiguous boundaries of ship domains and highlights the impact of navigators on ship domains.
(4) After validating the model, it can be confirmed that the DQSD model proposed in this article can be well applied to open waters with suitable visibility. However, the research in this article is based on two assumptions. The first assumption is that the distribution of the navigator state follows a Gaussian distribution, and the second assumption is that the navigator’s situational environment and other factors (such as system design) are the same. Therefore, future research can improve the model by obtaining the actual distribution of the navigator state and considering factors such as the situational environment of the navigator in order to obtain a more accurate ship domain model.
(5) The findings of this study can contribute to maritime traffic safety and provide a foundation for the research on collision risk in open-water areas for ships. Additionally, it offers theoretical support for navigators in making collision avoidance decisions during the navigation process.
Author Contributions
Conceptualization, D.L.; methodology, D.L. and Z.Z.; software, D.L.; validation, D.L. and Z.L.; formal analysis, D.L.; investigation, D.L; resources, Z.Z. and Z.L.; data curation, D.L.; writing—original draft preparation, D.L.; writing—review and editing, Z.Z. and D.L.; visualization, D.L.; supervision, D.L. All authors have read and agreed to the published version of the manuscript.
Funding
This research was funded by the National Key R&D Program of China, grant number 2022YFC3302703.
Institutional Review Board Statement
Not applicable.
Informed Consent Statement
Not applicable.
Data Availability Statement
The data used to support the findings of this study are available from the first author upon request.
Acknowledgments
Much appreciation is given to each reviewer for their valuable comments and suggestions to improve the quality of this writing. The authors would like to thank anonymous reviewers for their valuable comments to improve the quality of this article.
Conflicts of Interest
The authors declare no conflicts of interest.
References
- Wu, Z.L.; Zhu, J. Marine Traffic Engineering, 2nd ed.; Dalian Maritime University: Dalian, China, 2004; p. 117. [Google Scholar]
- Fujii, Y. Traffic Capacity. J. Navig. 1971, 24, 543–552. [Google Scholar] [CrossRef]
- Goodwin, E.M. A Statistical Study of Ship Domains. J. Navig. 1975, 28, 328–344. [Google Scholar] [CrossRef]
- Davis, P.V.; Dove, M.J.; Stockel, C.T. A Computer Simulation of Marine Traffic Using Domains and Arenas. J. Navig. 1980, 33, 215–222. [Google Scholar] [CrossRef]
- Szlapczynskl, R.; Szlapczynska, J. Review of ship safety domains: Models and applications. Ocean Eng. 2017, 145, 277–289. [Google Scholar] [CrossRef]
- Zhang, F.; Peng, X.; Huang, L.; Zhu, M. A Spatiotemporal Statistical Method of Ship Domain in the Inland Waters Driven by Trajectory Data. J. Mar. Sci. Eng. 2021, 9, 410. [Google Scholar] [CrossRef]
- Hörteborn, A.; Ringsberg, J.W.; Martin, S. A Revisit of the Definition of the Ship Domain based on AIS Analysis. J. Navig. 2019, 72, 777–794. [Google Scholar] [CrossRef]
- Zhou, W.; Zheng, J.; Xiao, Y. An online identification approach for ship domain model based on AIS data. PLoS ONE 2022, 17, e0265266. [Google Scholar] [CrossRef] [PubMed]
- Wang, N. An Intelligent Spatial Collision Risk Based on the Quaternion Ship Domain. J. Navig. 2010, 63, 733–749. [Google Scholar] [CrossRef]
- Silveira, P.; Teixeira, A.P.; Soares, C.G. A method to extract the Quaternion Ship Domain parameters from AIS data. Ocean Eng. 2022, 257, 111568. [Google Scholar] [CrossRef]
- Liu, R.W.; Huo, X.; Liang, M.; Wang, K. Ship collision risk analysis: Modeling, visualization and prediction. Ocean Eng. 2022, 266, 112895. [Google Scholar] [CrossRef]
- Liu, R.W.; Hu, K.; Liang, M.; Li, Y.; Liu, X.; Yang, D. QSD-LSTM: Vessel trajectory prediction using long short-term memory with quaternion ship domain. Appl. Ocean Res. 2023, 136, 103592. [Google Scholar] [CrossRef]
- Pietrzykowskl, Z.; Uriasz, J. The Ship Domain—A Criterion of Navigational Safety Assessment in an Open Sea Area. J. Navig. 2009, 62, 93–108. [Google Scholar] [CrossRef]
- Zhou, D.; Zheng, Z.Y. Analysis on the Importance of Factors affecting the ship field when visibility is good. J. Harbin Eng. Univ. 2017, 38, 20–24. [Google Scholar]
- Chao, Q.G. Safety Evaluation; China Machine Press: Beijing, China, 2020; pp. 157–165. [Google Scholar]
- Hu, L.W.; Sun, Y.N.; Qi, S.M. Study on Calculation Methods and Simplification of Driving Error Rate on Highway. China J. Highw. Transp. 2014, 27, 101–108. [Google Scholar]
- Zhao, J.S.; Wu, Z.L.; Wang, F.C. Comments on Ship Domains. J. Navig. 1993, 46, 422–436. [Google Scholar]
- Pietrzykowskl, Z.; Wielgosz, M. Effective ship domain—Impact of ship size and speed. Ocean Eng. 2021, 219, 108423. [Google Scholar] [CrossRef]
- International Maritime Organization. The Human Element: A Guide to Human Behaviour in the Shipping Industry, 2nd ed.; International Maritime Organization Publishing: London, UK, 2019. [Google Scholar]
- Fan, S.Q.; Eduardo, B.; Yang, Z.L. Incorporation of human factors into maritime accident analysis using a data-driven Bayesian network. Reliab. Eng. Syst. Saf. 2020, 203, 107070. [Google Scholar] [CrossRef]
- Fan, S.Q.; Yang, Z.L.; Eduardo, B. Analysis of maritime transport accidents using Bayesian networks. Proc. Inst. Mech. Eng. Part O J. Risk Reliab. 2020, 234, 439–454. [Google Scholar] [CrossRef]
Figure 1.
The quaternion ship domain.

Figure 2.
Distribution of navigator driving states.

Figure 3.
Relationship between reliability and status.

Figure 4.
Ship navigation track diagram.

Figure 5.
Sample selection process.

Figure 6.
The division of encounter situations.

Figure 7.
Encounter course distribution.

Figure 8.
Ship traffic intensity distribution.

Figure 9.
Calculation of relative velocity between ships.

Figure 10.
Relative velocity distribution.

Figure 11.
The relationship between the encounter course and the minimum passing distance.

Figure 12.
Cumulative distribution plot of traffic intensity.

Figure 13.
Relationship between relative velocity and minimum passing distance in various meeting scenarios.
Figure 13.
Relationship between relative velocity and minimum passing distance in various meeting scenarios.

Figure 14.
Simulation results of navigator status and driver reliability.

Figure 15.
Simulation results of the shape parameters in the ship domain and navigator state.

Figure 16.
(a) Encounter courses, traffic intensity, and ship domain changes; (b) encounter courses, relative velocity, and ship domain changes; (c) traffic intensity, relative velocity, and domain changes.
Figure 16.
(a) Encounter courses, traffic intensity, and ship domain changes; (b) encounter courses, relative velocity, and ship domain changes; (c) traffic intensity, relative velocity, and domain changes.

Figure 17.
(a) Simulation of navigator state and shape parameter under three knowledge skills; (b) simulation of navigator state and shape parameter under three psychological qualities; (c) simulation of navigator r state and shape parameter under three physiological qualities.
Figure 17.
(a) Simulation of navigator state and shape parameter under three knowledge skills; (b) simulation of navigator state and shape parameter under three psychological qualities; (c) simulation of navigator r state and shape parameter under three physiological qualities.

Figure 18.
Dynamic ship domain of container.

Figure 19.
Variation in ship domain axis radius over time.

Figure 20.
Changes in the shape of the ship domain under different navigator states.

Figure 21.
Comparison of ship domain models.

Figure 22.
Shape of ship domain under five navigator states.

Figure 23.
The variation in ship domain in the Lao Tie Channel under different navigator states.


Table 1.
The decoded AIS data of the Lao Tie Shan Waterway.
| NO. | Received Time | MMSI | Longitude (°) | Latitude (°) | Speed (Kn) | Course (°) | Length (m) |
|---|---|---|---|---|---|---|---|
| 1 | 2018/6/1 0:00:02 | 414078000 | 120.9283 | 38.61372 | 9.6 | 298 | 163 |
| 2 | 2018/6/1 0:00:02 | 235108526 | 120.8543 | 38.58698 | 12.3 | 283.7 | 202 |
| 3 | 2018/6/1 0:00:03 | 477892100 | 120.8877 | 38.59542 | 10.2 | 275 | 208 |
| 4 | 2018/6/1 0:00:03 | 413200650 | 120.8741 | 38.60617 | 8.7 | 280.7 | 92 |
| 5 | 2018/6/1 0:00:03 | 538005831 | 120.9086 | 38.611 | 9.8 | 282.4 | 245 |
| 6 | 2018/6/1 0:00:03 | 414078000 | 120.9277 | 38.61391 | 9.6 | 296.1 | 163 |
| 7 | 2018/6/1 0:00:03 | 538005831 | 120.9081 | 38.61107 | 9.8 | 280.9 | 245 |
| 8 | 2018/6/1 0:00:03 | 235108526 | 120.8536 | 38.58713 | 12.3 | 283.6 | 202 |
| 9 | 2018/6/1 0:00:04 | 412435330 | 120.7817 | 38.56239 | 10.5 | 95.4 | 98 |
| …… | …… | …… | …… | …… | …… | …… | …… |
| 545303 | 2018/6/10 23:59:59 | 413525000 | 120.9224 | 38.58606 | 13.1 | 278.4 | 99 |
Table 2.
Sample data.
| MMSI | Length (m) | Speed (kn) | Encounter Course (°) | Relative Ship Velocity (kn) | Traffic Intensity (Vessels/100 km2) | Minimum Passing Distance (m) |
|---|---|---|---|---|---|---|
| 477892100 | 208 | 10.2 | 29.4 | 16.00464067 | 17.62780156 | 5350.194562 |
| 414078000 | 163 | 10.2 | 135.7 | 20.31389283 | 17.62780156 | 6033.626289 |
| 412435330 | 98 | 10.3 | 72.8 | 19.74808283 | 17.62780156 | 6219.971751 |
| 413757000 | 119 | 9.5 | 110.1 | 23.540971 | 17.62780156 | 6262.918341 |
| 413690760 | 90 | 9.5 | 151.6 | 7.249116978 | 18.88693024 | 4754.419704 |
| 414358000 | 200 | 11.2 | 21 | 18.5718723 | 18.88693024 | 6298.133722 |
| … | … | … | … | … | … | … |
| 413364000 | 166 | 13.6 | 172.9 | 22.76534238 | 16.36867288 | 6292.261618 |
Table 3.
The navigator state risk factors that cause maritime accidents.
| Navigator State | Risk Factors | Frequency | Weight |
|---|---|---|---|
| Knowledge and skills | Insufficient knowledge related to navigation (such as ship technology and equipment knowledge, communication knowledge, maritime meteorology knowledge, maritime regulations knowledge, etc.). | 70.19% | 63.6% |
| Insufficient skills in ship maneuvering. | 80.29% | ||
| Insufficient language communication skills. | 30.77% | ||
| Insufficient ability to observe and judge. | 42.3% | ||
| Psychological qualities | Lack of a safe environment. | 24.52% | 21.9% |
| High levels of stress. | 4.81% | ||
| Insufficient situational awareness. | 24.04% | ||
| Low sense of personal responsibility and vigilance. | 21.63% | ||
| Low emotional management ability. | 1.92% | ||
| Physiological qualities | Excessive workload. | 25.96% | 14.5% |
| Poor working conditions. | 17.31% | ||
| The influence of drugs and alcohol. | 6.73% | ||
| Factors of physical health. | 0.96% |
Table 4.
Experimental ship parameters information.
| Ship Type | Container |
|---|---|
| Length | 175 |
| Width | 25.4 |
| Draft | 8.5 |
| Design speed | 15 |
Table 5.
Navigation states classification.
| Navigator State | Poor | Slightly Poor | Average | Slightly Good | Good | Excellent |
|---|---|---|---|---|---|---|
| Knowledge and skills | (0, 0.1] | (0.1, 0.3] | (0.3, 0.5] | (0.5, 0.7] | (0.7, 0.9] | (0.9, 1] |
| Psychological qualities | (0, 0.1] | (0.1, 0.3] | (0.3, 0.5] | (0.5, 0.7] | (0.7, 0.9] | (0.9, 1] |
| Physiological qualities | (0, 0.1] | (0.1, 0.3] | (0.3, 0.5] | (0.5, 0.7] | (0.7, 0.9] | (0.9, 1] |
Disclaimer/Publisher’s Note: The statements, opinions and data contained in all publications are solely those of the individual author(s) and contributor(s) and not of MDPI and/or the editor(s). MDPI and/or the editor(s) disclaim responsibility for any injury to people or property resulting from any ideas, methods, instructions or products referred to in the content. |
© 2024 by the authors. Licensee MDPI, Basel, Switzerland. This article is an open access article distributed under the terms and conditions of the Creative Commons Attribution (CC BY) license (https://creativecommons.org/licenses/by/4.0/).
Share and Cite
MDPI and ACS Style
Liu, D.; Zheng, Z.; Liu, Z. Research on Dynamic Quaternion Ship Domain Model in Open Water Based on AIS Data and Navigator State. J. Mar. Sci. Eng. 2024, 12, 516. https://doi.org/10.3390/jmse12030516
AMA Style
Liu D, Zheng Z, Liu Z. Research on Dynamic Quaternion Ship Domain Model in Open Water Based on AIS Data and Navigator State. Journal of Marine Science and Engineering. 2024; 12(3):516. https://doi.org/10.3390/jmse12030516
Chicago/Turabian StyleLiu, Dongqin, Zhongyi Zheng, and Zihao Liu. 2024. "Research on Dynamic Quaternion Ship Domain Model in Open Water Based on AIS Data and Navigator State" Journal of Marine Science and Engineering 12, no. 3: 516. https://doi.org/10.3390/jmse12030516
Note that from the first issue of 2016, this journal uses article numbers instead of page numbers. See further details here.