Article

Research on Abrasive Particle Target Detection and Feature Extraction for Marine Lubricating Oil

Marine Engineering College, Dalian Maritime University, Dalian 116026, China
*
Author to whom correspondence should be addressed.
J. Mar. Sci. Eng. 2024, 12(4), 677; https://doi.org/10.3390/jmse12040677
Submission received: 28 March 2024 / Revised: 15 April 2024 / Accepted: 16 April 2024 / Published: 19 April 2024

Abstract

:
The hydraulic oil of marine equipment contains a large number of abrasive contaminants that reflect the operating condition of the equipment. In order to realize the detection of particulate contaminants, this research first proposes a shape-based classification method for oil abrasive particles, designs an oil abrasive particle collection system, and constructs a new dataset. After that, the research introduces deep learning target detection technology in computer vision, and uses GhostNet to lighten the network structure, the CBAM (Convolutional Block Attention Module) attention mechanism to improve the generalization ability of the model, and the ASPP module to enhance the model sensory wildness, respectively. A lightweight target detection model, WDD, is created for the identification of abrasive particles. In this study, the WDD model is tested against other network models, and the mAP value of WDD reaches 91.2%, which is 4.8% higher than that of YOLOv5s; in addition, the detection speed of the WDD model reaches 55 FPS. Finally, this study uses real ship lubricating oils for validation, and the WDD model still maintains a high level of accuracy. Therefore, the WDD model effectively balances the accuracy and detection speed of marine oil abrasive particle detection, which is superior to other oil abrasive particle detection techniques.

1. Introduction

For large ships, the hydraulic system is an important part of ensuring its safe operation and working efficiency, and the performance of hydraulic oil directly affects whether the hydraulic system can work normally [1,2]. During the operation of the ship’s hydraulic system, some contaminants will be mixed into the hydraulic oil, and when their content exceeds a certain limit, thus affects the normal operation of the whole system. Therefore, in order to avoid the failure of the ship’s hydraulic equipment, it is necessary to detect the solid metal particle contaminants in the hydraulic oil [3,4].
The traditional methods of abrasive particle detection are particle counting and image detection. The particle counting method is complicated to operate and requires operators with high professional skills and experience [5], so it cannot carry out real-time detection. The image detection method refers to the detection of the parametric features of the abrasive particles by computer combined with image processing techniques [6,7]. The image detection method can be divided into the iron spectrum analysis method and microscopic imaging method by different methods of obtaining abrasive images. After acquiring the image, a series of transformations and segmentation operations are performed on the abrasive particle image to capture the features of the abrasive particle [8,9].
The microscopic imaging method places a slide containing an oil abrasive sample under an optical microscope for observation during testing and then hands it over to a computer for subsequent analysis and processing [10]. Compared to iron spectrum analysis, microscopic imaging has a simpler experimental environment. And, under the same light source, the microscopic image method also has a better detection effect for non-ferromagnetic metal abrasive particles [11]. However, the microscopic image method still requires human observation and analysis and is more dependent on the operator’s experience [12]. With the rapid development of computer vision in recent years, some teams at home and abroad have started to apply this technique, which uses computer and digital image processing techniques to simulate human vision, to the field of abrasive particle detection. Jiang designed an oil abrasive particle detection system using a microfluidic chip and microscopic imaging method to monitor dynamic abrasive particles using visual saliency extraction of the image region of interest [13,14], and successfully detected abrasive particles in oil, and then conducted a study on the three-dimensional reconstruction method of abrasive particle images. Zhai took five types of typical abrasive particles as the research object and combined a convolutional neural network, Support Vector Machine (SVM), and Genetic Algorithm (GA) to design an abrasive particle classification model based on the fusion of GA-SVM and improved LeNet convolutional neural network [15,16], which led to a large improvement in the classification accuracy of sliding abrasive particles and fatigue abrasive particles. Wang H. et al. developed an optical oil detection system that can be used for large-diameter pipes with high flow rates [17,18,19]. The system used a background difference-based motion target extraction algorithm and the Otsu algorithm (OTSU) to extract images of abrasive particles and air bubbles and used a convolutional neural network algorithm to distinguish between air bubbles and debris, providing better classification results than traditional methods. Due to the small size and irregular shape of particles in marine lubricating oils and the complexity of the fluid background, there is a gap between the existing micro-imaging methods and the practical requirements in terms of efficiency, accuracy, and versatility in the detection of abrasive particles in marine hydraulic fluids.
With an aim to address the problem that the traditional model cannot detect the position information of abrasive grains, and has low detection efficiency and poor accuracy. This paper combines the deep learning target detection technology with the microscopic imaging method, and designs and trains an abrasive grains detection model based on GhostNet, ASSP, and the attention mechanism of YOLOv5. We call this the WDD (Wear Debris Detection) model, which not only solves the difficulty of the detection of abrasive grains’ position information, but also optimizes the YOLOv5 model in various aspects, such as the detection efficiency, the detection speed, the accuracy, and the practicality of the model. This method helps to realize the real-time monitoring of oil particles by quickly and accurately detecting the shape information of abrasive particle positions in the oil. The main contributions of this study are as follows:
Because of the previous inconsistency in the classification standard of abrasive grains, this research proposed a new method of image classification based on the shape of abrasive grains and collecting abrasive grains by microfluidic chip combined with microscopic imaging methods. Finally, we preprocess the images to form a new abrasive grains dataset.
In order to improve the detection speed of the model, this article improves the original YOLOv5s backbone based on the idea of GhostNet, which can significantly reduce the number of parameters and computation in YOLOv5 by using smaller convolutional kernels and depth-separable convolutions.
In order to strengthen the detection accuracy of the model for small targets, this article appends the CBAM attention module at the end of the C3 module, which improves the ability of the model to focus on key features and the generalization ability of the model.
In order to obtain a larger perceptual field and multi-scale information on oil abrasive particles, this article optimizes the backbone network by replacing the SPPF module with an ASPP module, which improves the network’s ability to process spatial information.
Combined with the above improvements, we propose an oil abrasive grains object detection algorithm—the WDD model and validate in real ship slippery oil, which evidences high-precision and real-time detection of marine oil abrasive grains.
This article designs the system of marine lubricating oil wear particle detection system, including a WDD&pyqt5 target detection interface and a wear particle auxiliary detection window, which provides help for the development of condition monitoring, intelligent operation, and a maintenance platform for marine mechanical equipment.

2. Materials and Methods

2.1. Oil Abrasive Grain Dataset Construction

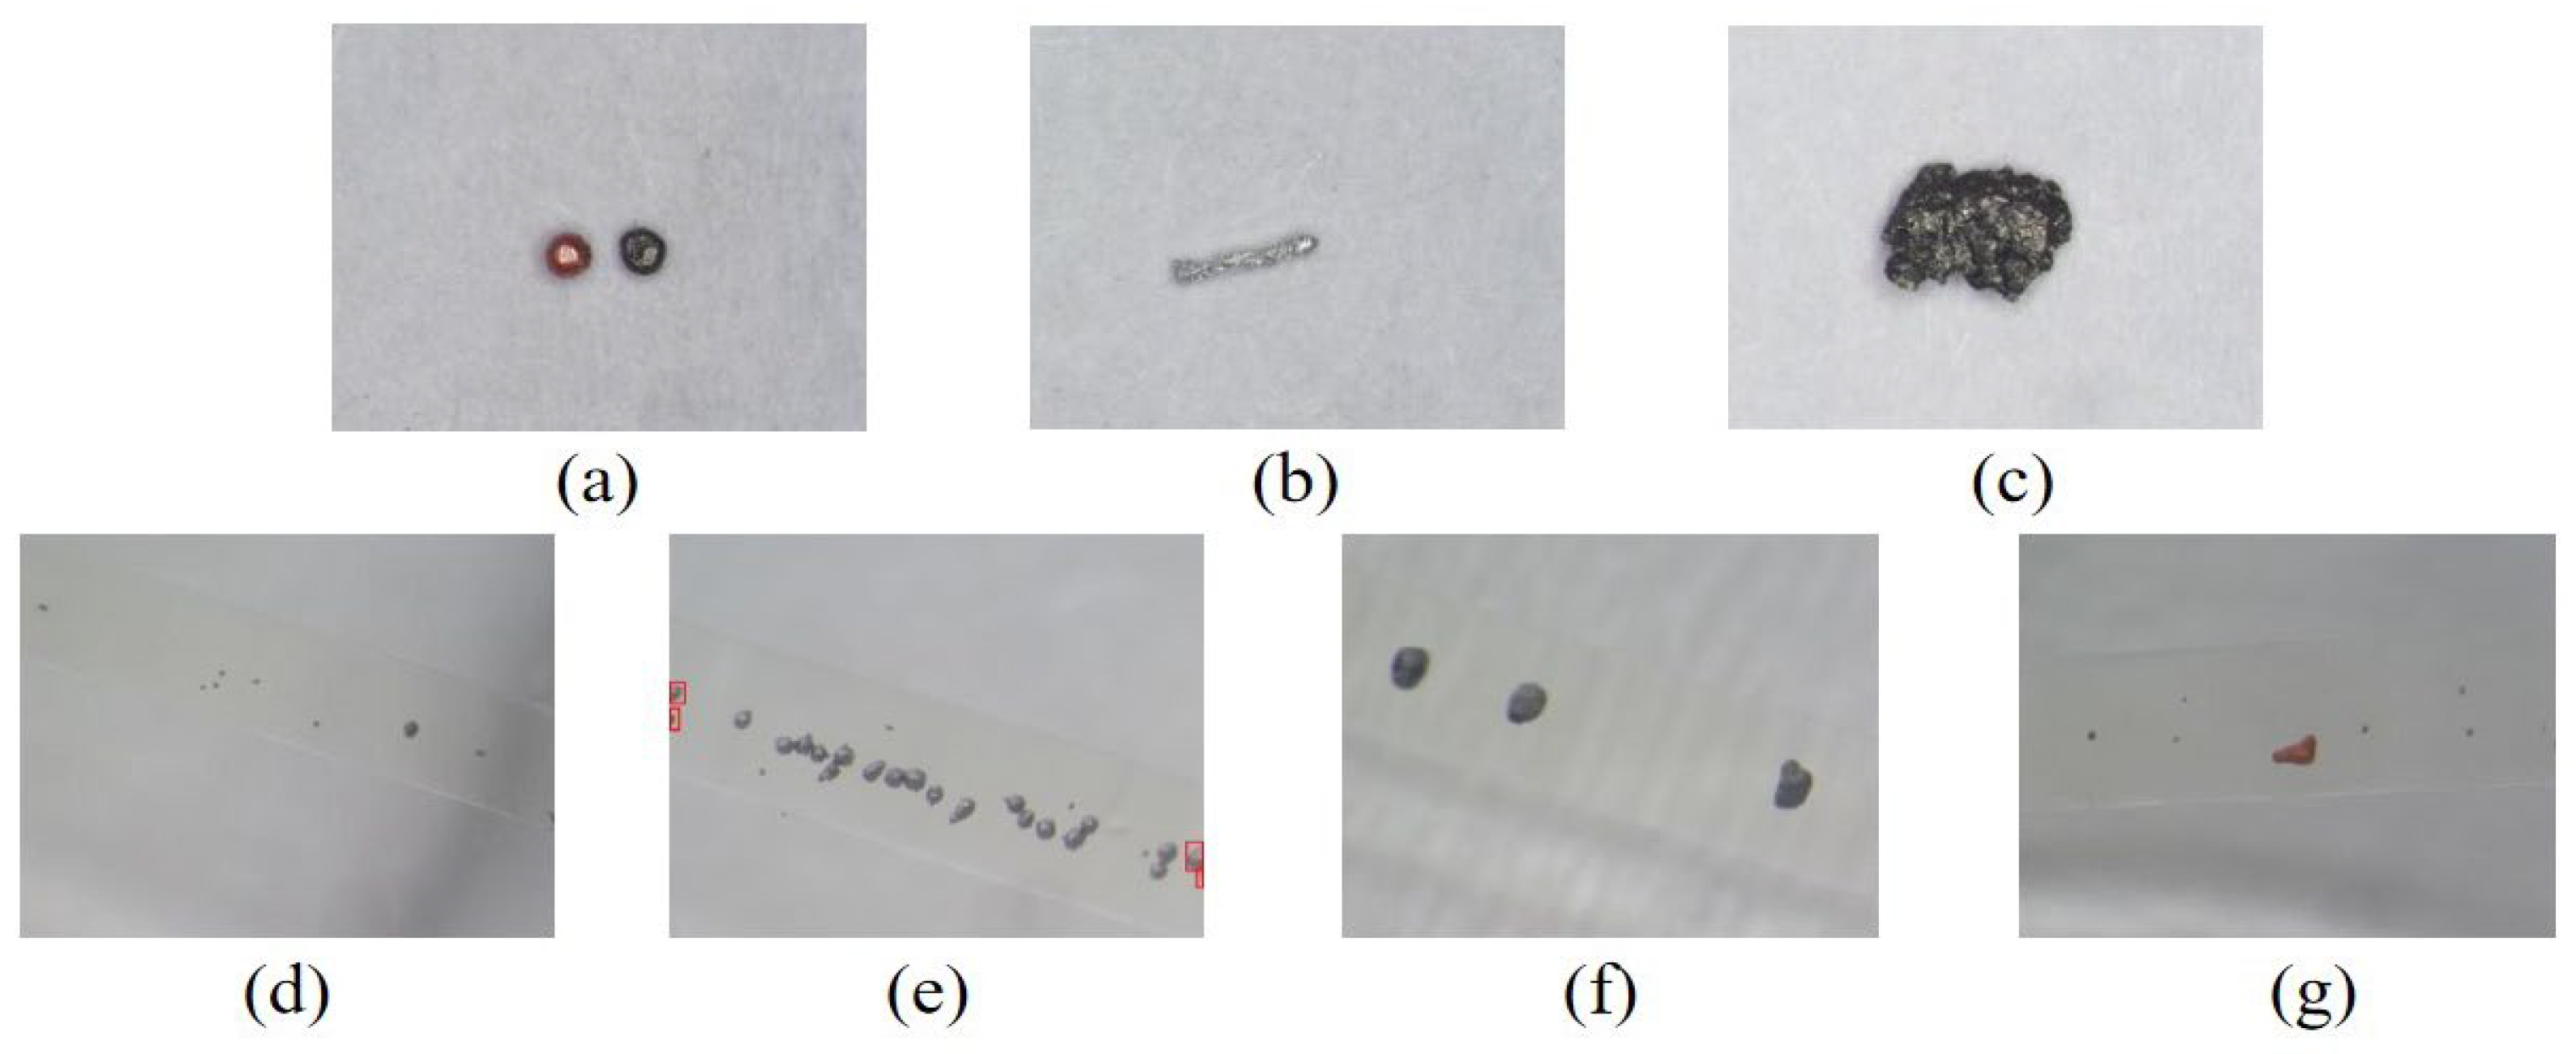
2.1.1. Image Classification Based on Abrasive Particle Shape

Current research classifies abrasive particles by type of wear or formation mechanism, but this approach requires a deep background and experience in the industry to support it [20,21]. This research proposes a classification based on the shape of abrasive grains to categorize marine hydraulic fluid abrasive grains into seven types. These are spherical, strip, block, tiny, edge, elliptical (regular), and irregular particles. Magnification under the microscope at 50× is shown in Figure 1.
Figure 1a shows a spherical abrasive particle that has a smoother surface and appears spherical. The minimum sample diameter of the spherical abrasive particles used in this paper is 40 µm and the maximum diameter sample is 350 µm. Figure 1b shows a strip abrasive particle, which refers to a long, slender abrasive particle. This article defines a long, slender abrasive particle as one whose ratio of the longest cross-sectional length to the actual length of the shortest cross-sectional length of the particle is greater than 3. Figure 1c shows a block abrasive particle, which is a collective term for fatigue flaking and laminated abrasive particle, and their samples range from a minimum of 350 µm to a maximum of 600 µm. Figure 1d shows a tiny abrasive particle, which refers to the overall small size compared to other abrasive particles, basically reaching the lower detection limit of the microscope, with the longest size of small abrasive particles not exceeding 30 µm and the smallest size observable being around 10 µm. Figure 1e shows an edge abrasive particle, which refers to the abrasive particles that appear at the edges of the whole image during the actual sampling process, and only the edges that appear in the only the edges that appear in the abrasive diagrams are due to the timing of the acquisition. Figure 1f shows an elliptical abrasive particle, which is the oval-like abrasive particle that indicates that the equipment is in a normal state of wear. Figure 1g shows an irregular abrasive particle, which is a particle other than the six described above; this abrasive particle does not have a strictly aggregated shape and ranges in size from 100 µm to 350 µm.
The wear particle information of marine lubricating oil contains rich information on the running state of the equipment. The shape, position, and quantity information of the wear particles detected in this study can provide feedback on the wear state of the equipment, to a certain extent. The spherical particles may be formed by the peeling of the shear mixing layer on the inner surface of the crack and the repeated kneading of the layered abrasive particles entering with the oil through the relative motion of the inner surface. The presence of spherical particles may indicate that the lubrication system needs further examination. The strip particles may indicate that the surface of some parts inside the diesel engine has been partially cut or scratched, which may be caused by improper clearance between parts, insufficient lubrication, or abnormal movement of parts. The block abrasive particles may indicate that some parts of the diesel engine are subjected to impact load during operation, resulting in material stripping. The elliptical (regular) abrasive particles may be worn, caused by sliding contact between components, or wear caused by rolling fatigue. This wear usually occurs on components such as bearings or bearing shells. The small abrasive particles may indicate that the surface roughness of the component is high, the viscosity of the lubricating oil is insufficient or the cleanliness of the equipment is insufficient, and it may also be an early sign of fatigue wear. The wear information of irregular abrasive reactions is difficult to confirm. Cutting wear, fatigue wear, and corrosion wear are all possible, and they need specific analysis.

2.1.2. Creation of Abrasive Particle Image Dataset

In order to efficiently collect high-resolution images of abrasive particles, this experiment builds a set of abrasive particle collection and detection systems, as shown in Figure 2. It includes an oil sample, driving unit, connection unit, microfluidic chip, observation acquisition unit, and collection unit. In this research, we first configured a certain proportion of oil samples containing iron, copper, and aluminum particles and injected them into the microfluidic detection chip through a micro syringe pump. The microfluidic chip used in this study was cast with PDMS, which not only has high chemical inertness, but also has good optical transparency, and can be directly observed under a microscope using natural light for imaging [22]. Finally, the data were collected by a microfilm camera and the used oil was recycled.
In this research, 780 images were captured by the above-mentioned device. After removing fuzzy pictures, this study received a total of 752 qualified wear particle images. Secondly, in order to improve the performance of the model, more abrasive particle images are also required to serve as training data. This research uses data enhancement techniques to expand the abrasive images by adding noise to the feature images, flipping the images, changing the contrast, panning, and rotating them, respectively. A total of 4984 images (including the original images) are obtained, which are further filtered, leaving only 4400 images of abrasive particles. In addition, the images of the abrasive particles are labeled according to the classification criteria using the Make Sense online image labeling tool. Finally, the images are divided into a training set, validation set, and test set by the function where there are 3200 images in the training set, 800 images in the validation set, and 400 images in the test set.

2.2. Constructing a Yolov5-Based WDD Target Detection Model

2.2.1. Network Lightweighting

Target detection technology refers to the identification and localization of specific objects in a target image or video using certain algorithms, which can be classified into two-stage detection algorithms and single-stage detection algorithms according to the current mainstream classification [23,24]. The YOLO (You Only Look Once) family of algorithms is a single-stage detection algorithm that extracts features directly through a convolutional neural network, the most widely used due to its high speed, accuracy, and good deployability. This paper selects the YOLOv5s network as the object of study [25,26]. The YOLOv5 target detection model adopts an efficient network structure to achieve fast and accurate target detection. The YOLOv5 algorithm is composed of input, backbone network, feature fusion network, and detection head. The main function of input is to preprocess the images from the dataset and the backbone is mainly responsible for extracting features from the input image. The function of the feature fusion network is to integrate feature maps from different levels in order to better capture the multi-scale information of the target. As the final part of the model, the detection head is responsible for converting the feature map transmitted from the feature fusion network into the final detection result.
GhostNet is a new lightweight neural network proposed by Huawei’s Noah’s Ark Lab, with better performance than Google’s Mobile Net. When visualizing the feature maps of the first residual group of ResNet50, the team found that three pairs of feature maps in the output of this residual group are highly similar, which indicates that there is redundancy among the feature maps, and the redundant feature maps are called the Ghost of the original feature maps, which is used to design a lightweight module—the Ghost module [27].
Let the input feature map have channel c with height h and width w, the output data have height h′ and width w′, the number of convolution kernels is n and size k, the average convolution kernel size for linear operations is d, the number of transformations is s, and the theoretical acceleration ratio for upgrading the standard convolution using the Ghost module can be calculated using Equation (1):
r s = n × h × w × c × k × k n s × h × w × c × k + ( s 1 ) × n s × h × w × d × d s × c s + c 1 s
Similarly, the compression ratio of the parameter can be calculated using Equation (2):
r c = n × c × k × k n s × c × k + ( s 1 ) × n s × d × d s × c s + c 1 s
From Equations (1) and (2), it can be seen that the acceleration and compression ratios are basically equivalent and are mainly affected by the number of transformations. From this, we can construct the Ghost structures suitable for this paper, which are GhostConv and C3Ghost, as shown in Figure 3.
The design idea of the GhostConv module is to split the convolutional layer Conv into two: the first part of the traditional convolution operation is used to generate part of the feature map and the number of feature maps according to the number of convolution kernels set to control; the other part of the conventional convolution is not used, but will be obtained from the input feature maps to carry out a simple operation; and, finally, the two will be spliced to generate the final feature maps. This operation generates a large number of feature layers with only a few parameters, which greatly reduces the amount of computation and thus the efficiency of the model. The design of the C3Ghost module is based on the Ghost module and the C3 module in YOLOv5, replacing the BottleNeck in the C3 module with GhostBottleneck. GhostBottleneck contains two GhostConv modules. The first GhostConv is to generate more channels, the second GhostConv is to reduce the number of channels in the output feature map to match the number of channels in the input, which, finally, connects the two GhostConv by a shortcut operation.

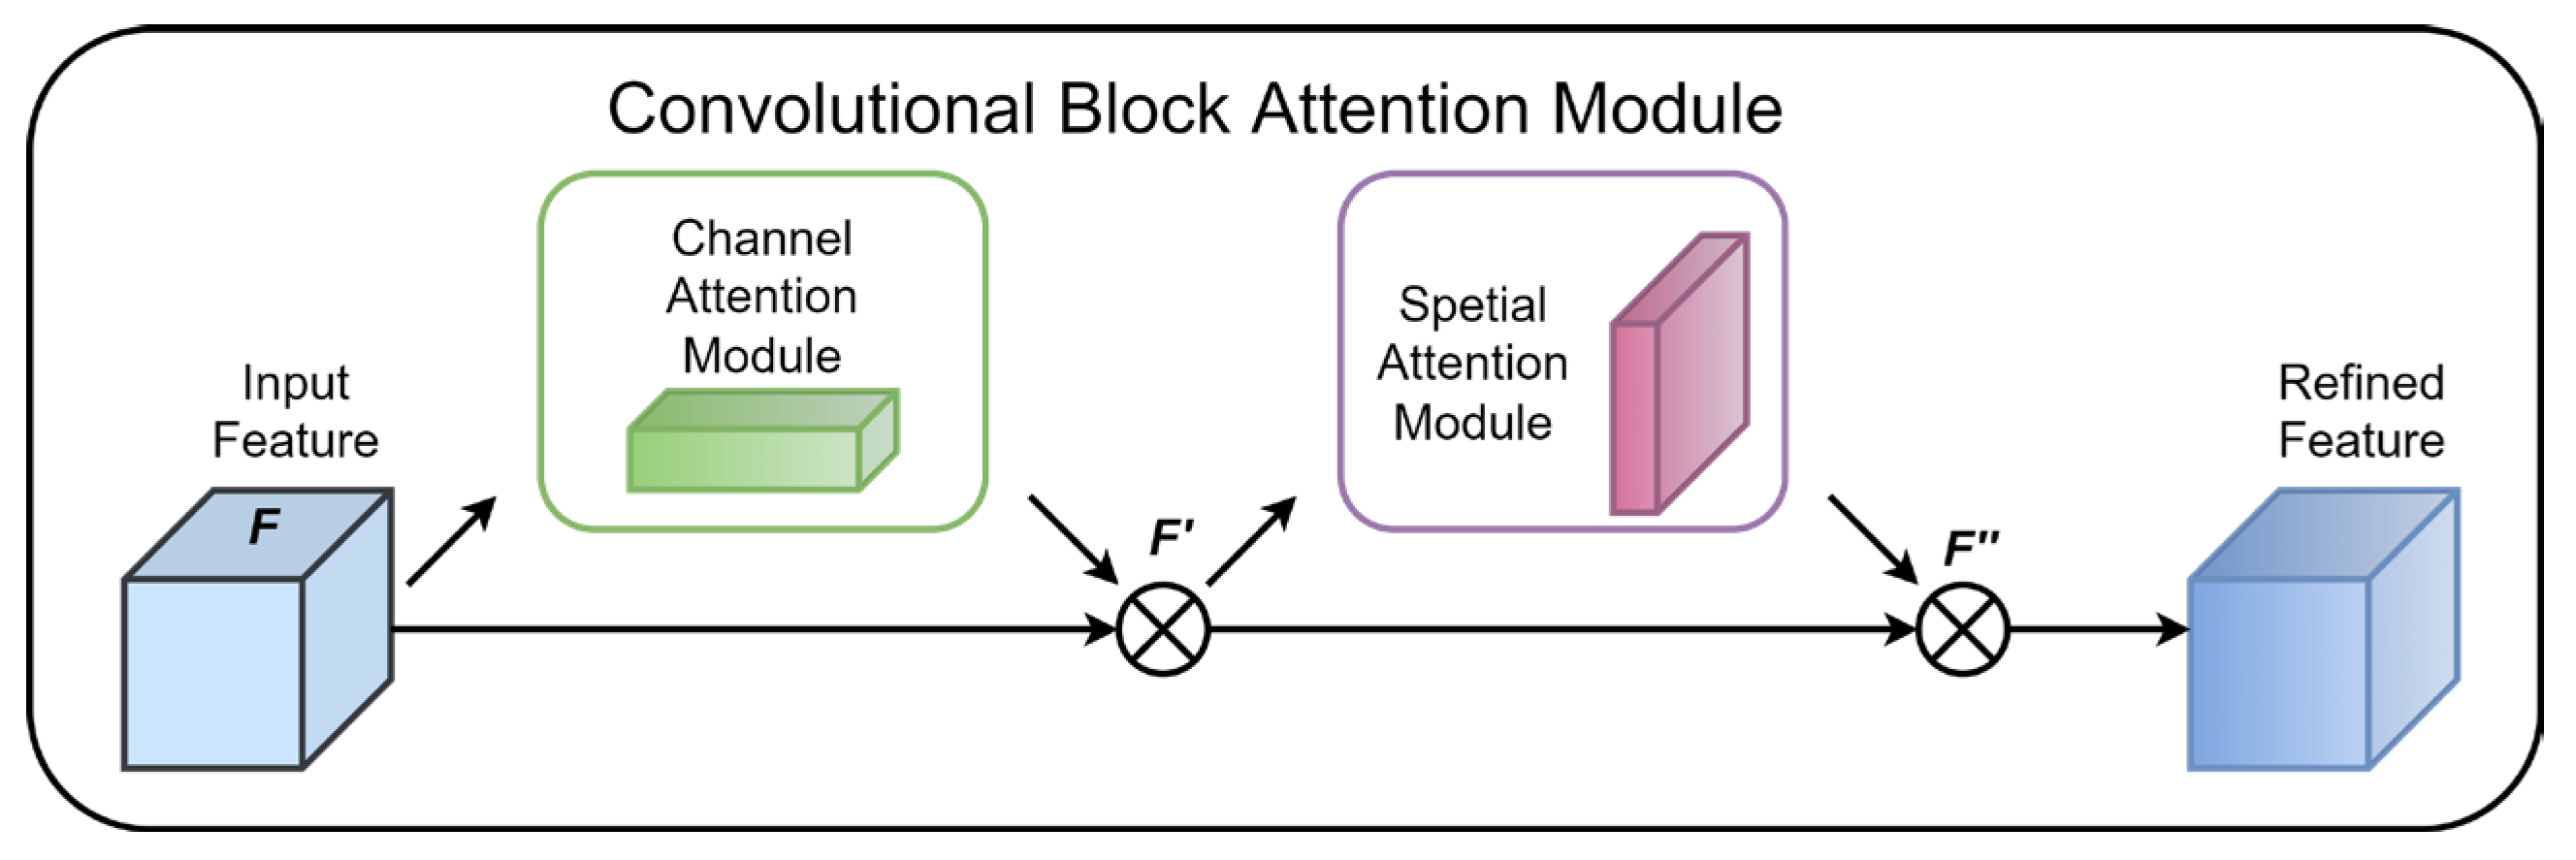
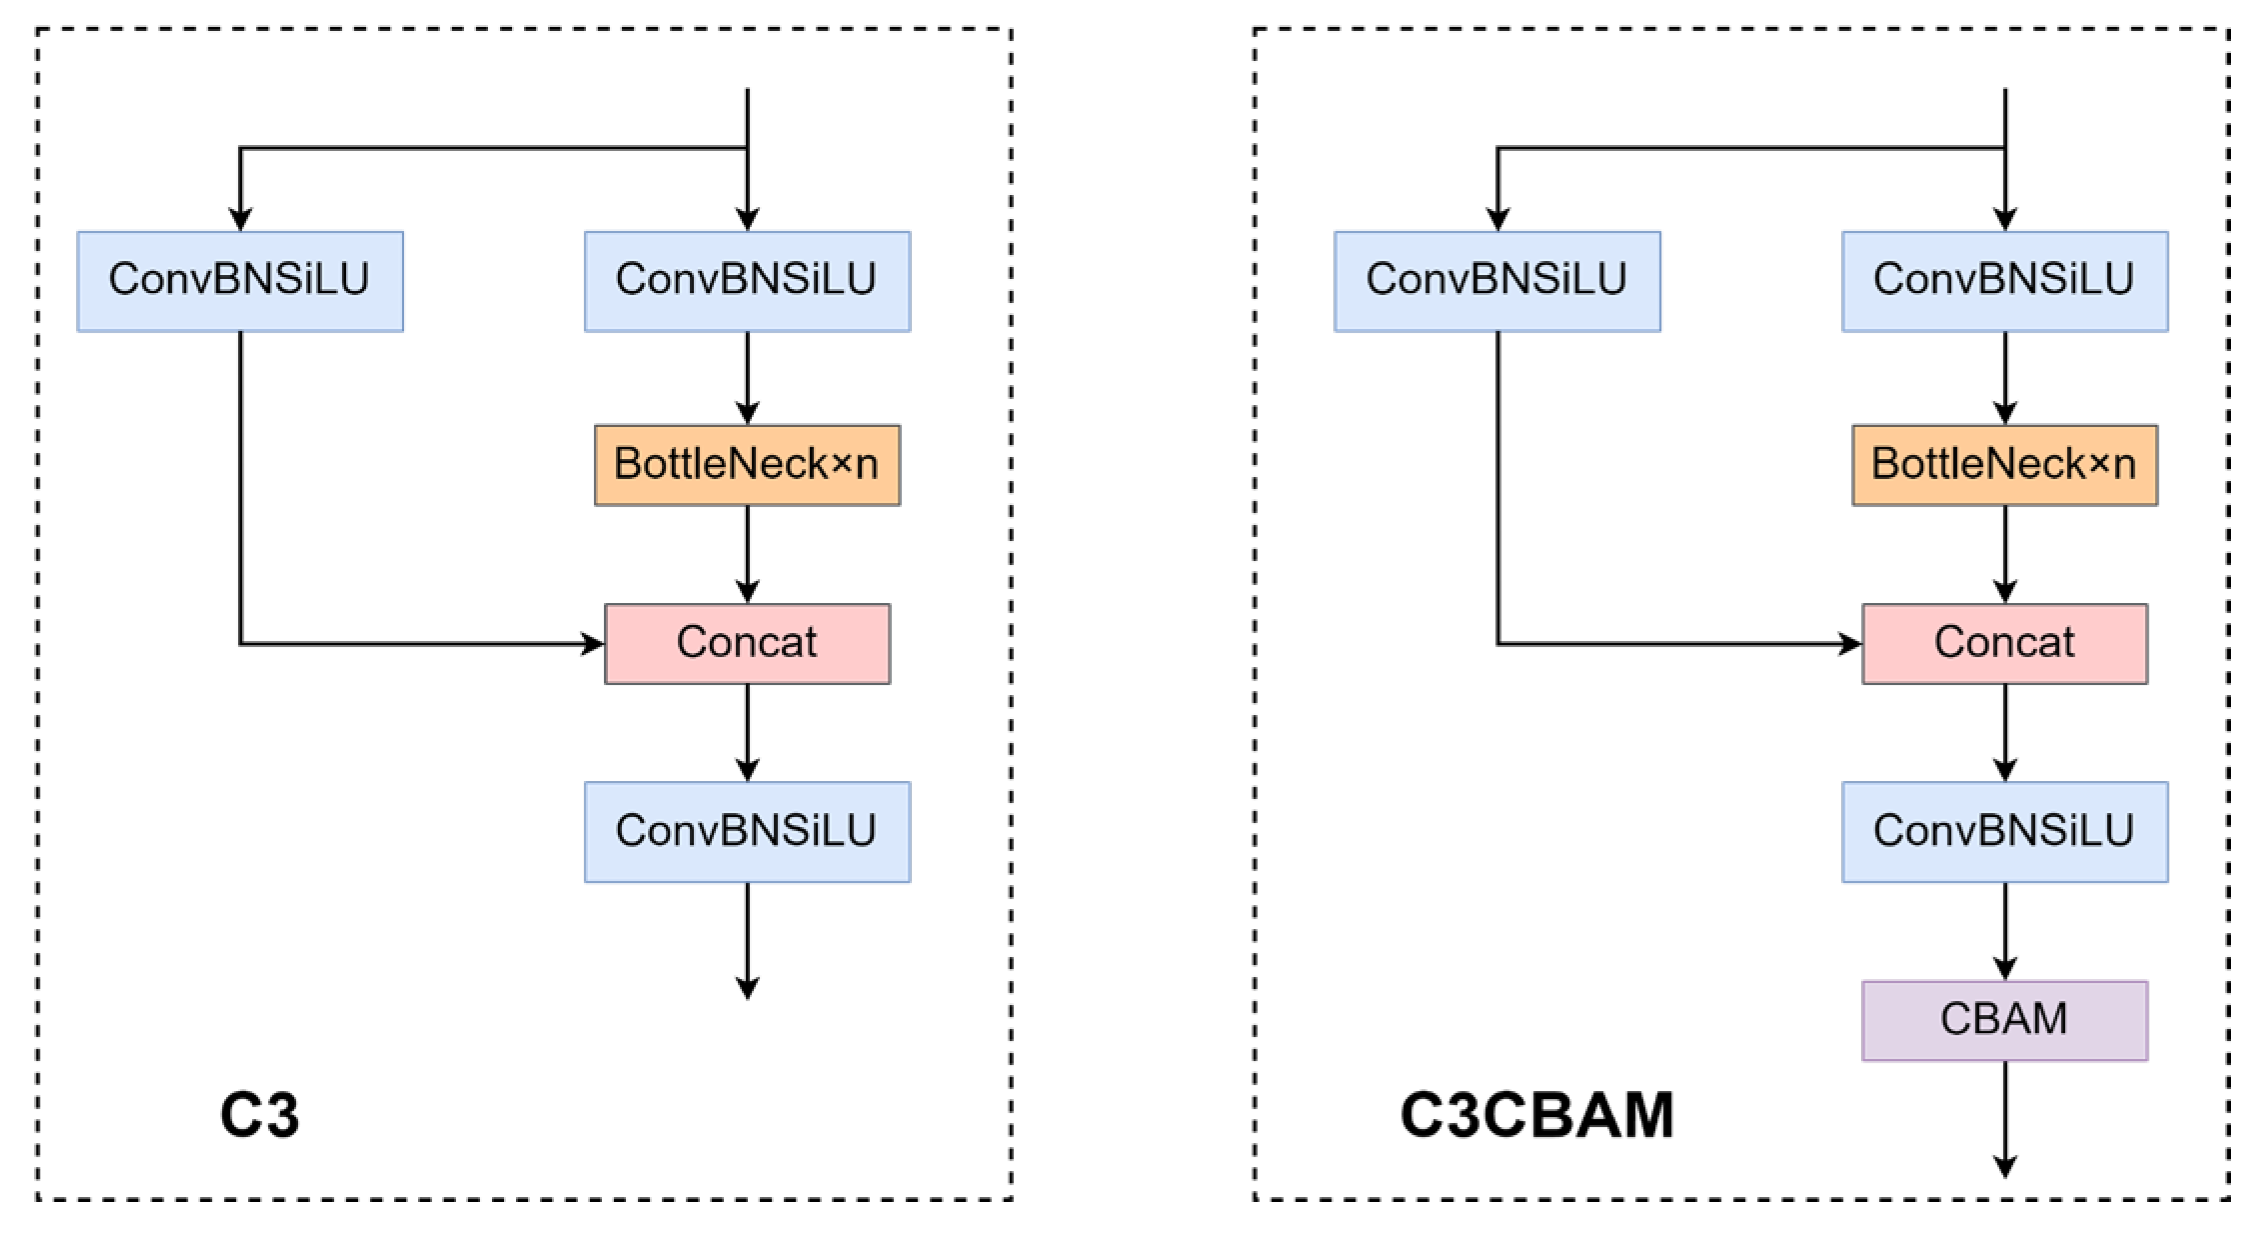
2.2.2. Enhancing the Attention Mechanism of the Model

The attention mechanisms can be used to enhance a model’s ability to focus on input data, thereby improving the model’s capabilities. This study chose to add the CBAM attention mechanism, as shown in Figure 4. The CBAM attention mechanism provides a more comprehensive focus of attention compared to other attention mechanisms by taking into account both the channel and spatial dimensions; in addition, the design of the CBAM allows it to improve performance while maintaining computational efficiency, making it more suitable for real-time detection of oil particles [28,29].
In this study, the CBAM module is placed at the end of the C3 module connected to the convolutional layer in the head. This method allows for better weighting and focuses on the channel dimension while retaining multi-scale feature information. This method allows for better weighting and focus on the channel dimension while retaining multi-scale feature information, which helps the model to more accurately capture and extract useful features at different scales and channels, improving the performance of this model in performing abrasive particle target detection tasks, as shown in Figure 5.

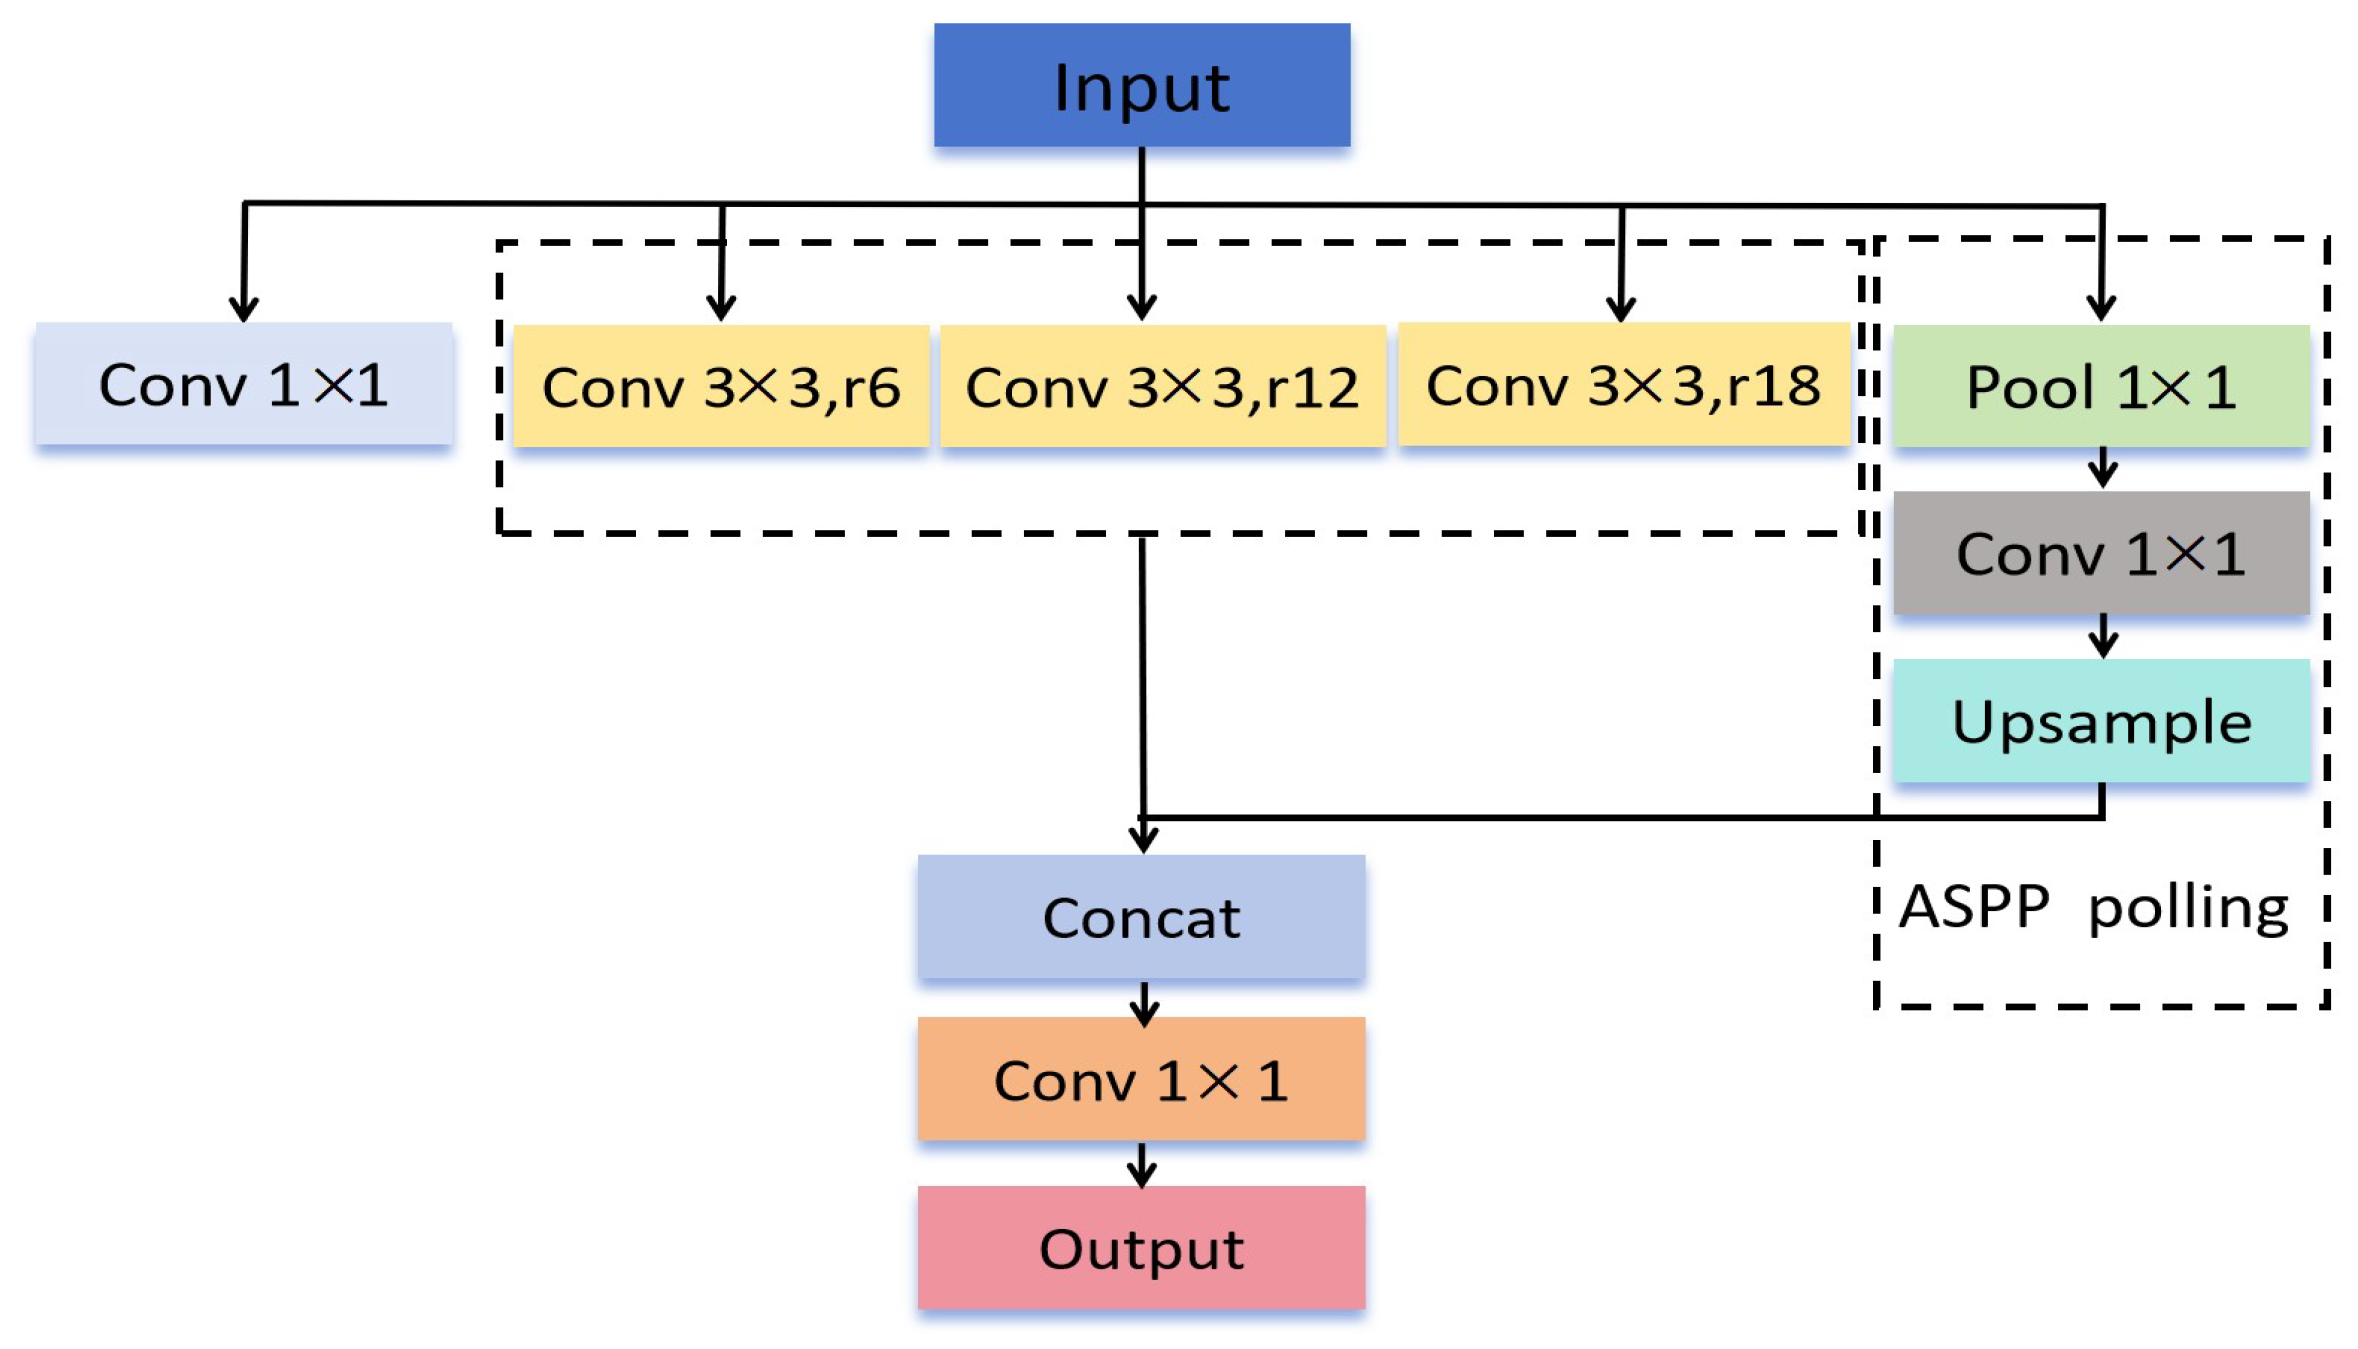
2.2.3. Increase the Model Receptive Field

The adjacent pixels in the collected oil debris images generally have the problem of information redundancy. In order to obtain a larger receptive field, improve the expression ability of the model, and realize the accurate detection of oil particles, the SPPF module in the backbone network is replaced by the Atrous Spatial Pyramid Pooling (ASPP) module.
The core idea of the ASPP module is to apply dilated convolution at different sampling rates to obtain multi-scale feature responses [30]. These dilated convolutional layers with different sampling rates can capture different scale information on the input feature map, as shown in Figure 6.
The operation principle of ASPP is mainly based on the combination of Atrous Convolution and Spatial Pyramid Pooling. The ASPP module first extracts features through a set of parallel dilated convolutional layers, which have different sampling rates. The convolutional layers of each sampling rate can capture features at different scales, thus forming a multi-scale feature representation. Then, the ASPP module inputs these feature maps of different scales into the spatial pyramid pooling layer. The spatial pyramid pooling layer can extract global context information from the feature map of each scale through pooling operation. Finally, the ASPP module stitches all these feature maps of different scales. Through the unsampled, the traditional interpolation method is used for upsampling and reduction to the original input size out of the layer. After that, concat fusion is performed on the five-layer output of ASPP, and the superimposed output is reduced to a given number of channels by 1 × 1 convolutional layer convolution operation to obtain the final output result [31]. The concat fusion process can be calculated using Equation (3):
n = k + ( k 1 ) × ( d 1 )
where n is the current convolution kernel size; k is the size of the original convolution kernel; d is a hyper-parameter; the value of d − 1 is the number of spaces added. The size of the feature map after convolution can be calculated using Equation (4):
o = i + 2 p k ( k 1 ) × ( d 1 ) s + 1
where o is the size of the feature map after the dilated convolution, i is the size of the input dilated convolution, and s is the step size.

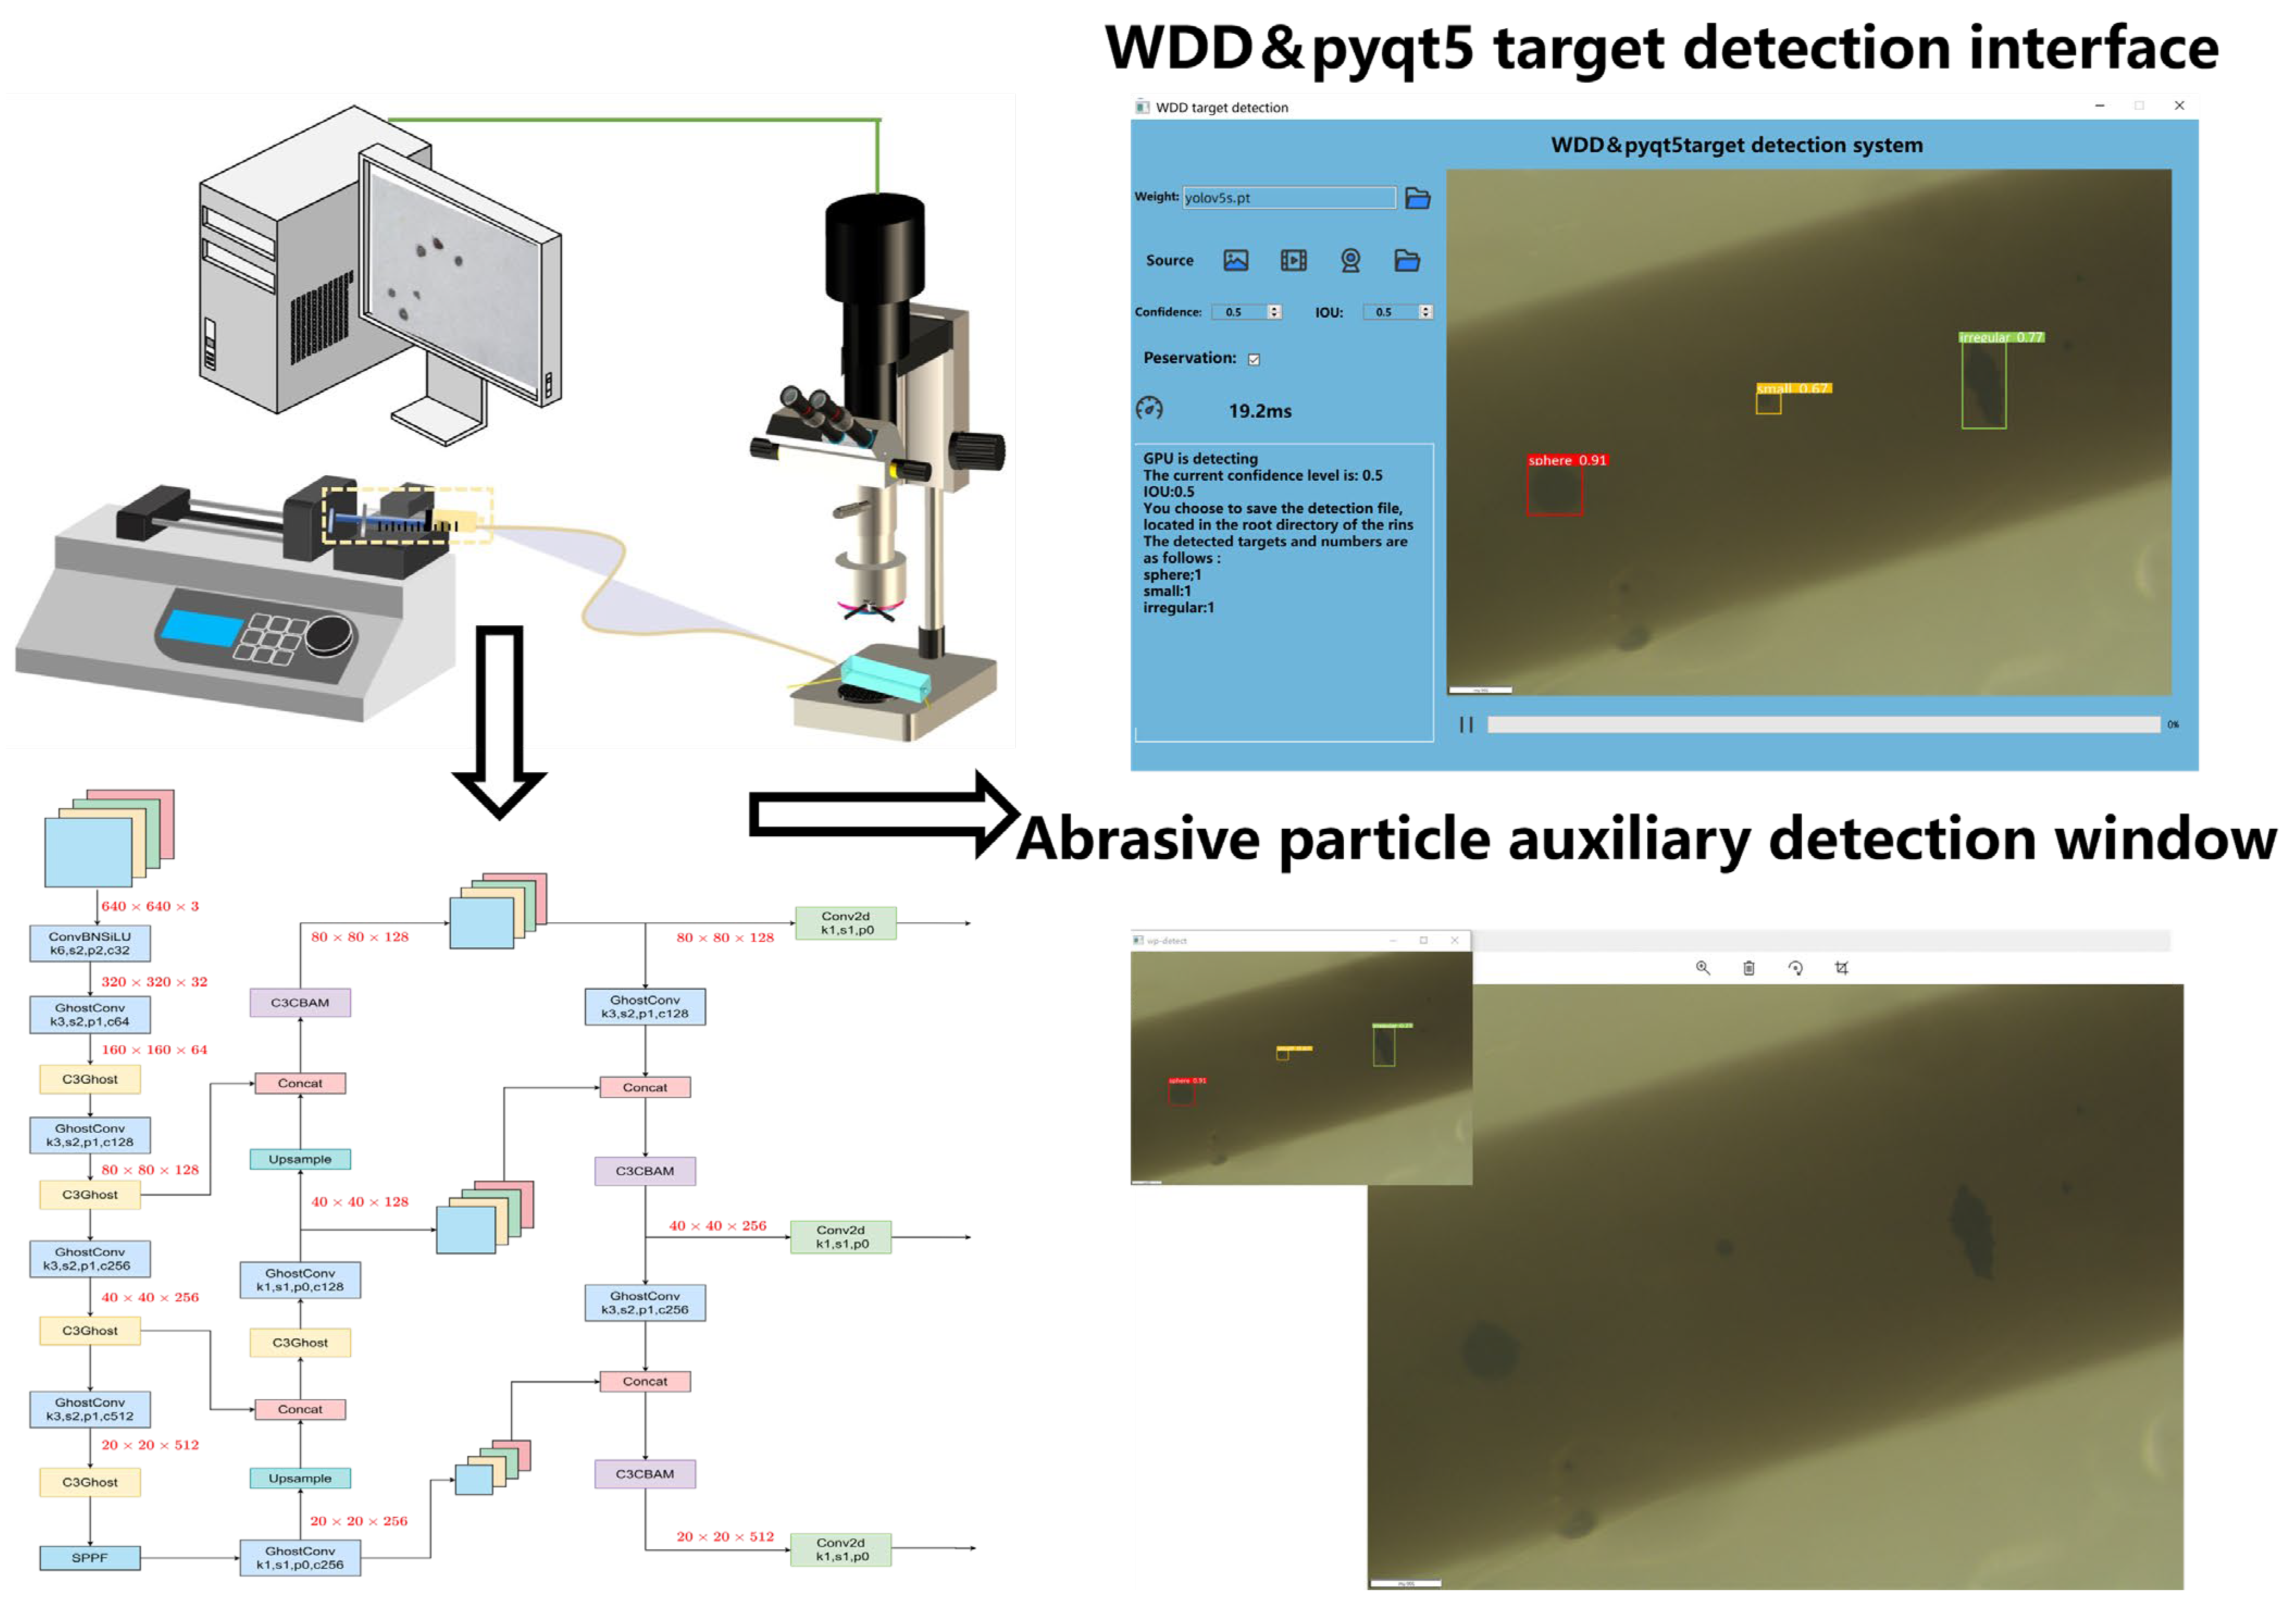
2.2.4. WDD Target Detection Model Based on YOLOv5

The structure of the WDD model designed in this paper for the detection of abrasive shape targets in marine fluids is shown in Figure 7. In addition to the first layer of 6 × 6 convolution unchanged, all the rest of the convolution GhostConv structure layer used for replacement, in addition to the connected to the head of the convolution layer of the C3 module, all the rest of the C3Ghost module used for replacement. Then, the C3CBAM module is replaced with three C3 modules connected to the convolutional layer. Finally, the SPPF module in the backbone is replaced with an ASPP module.

3. Results

3.1. Model Hyper-Parameter Settings

In order to objectively and fairly compare the performance of the improved models, our experiments were conducted on an NVIDIA Quadro P5000/16GB GPU, using CUDA 11.3, PyTorch 1.11.0, and other configurations.
The hyper-parameters need to be set in advance before the WDD model can be trained. Hyper-parameters are parameters that are not automatically learned from the training data and need to be set manually, such as learning rate, batch size, and number of training rounds [32]. After several experiments of optimization, this paper selects the Adam optimizer for the WDD model, and the size of the input image is set to 640×640. The batch size is set to 64, the epoch is set to 600, and the training hyper-parameters of the WDD model are set as shown in Table 1.

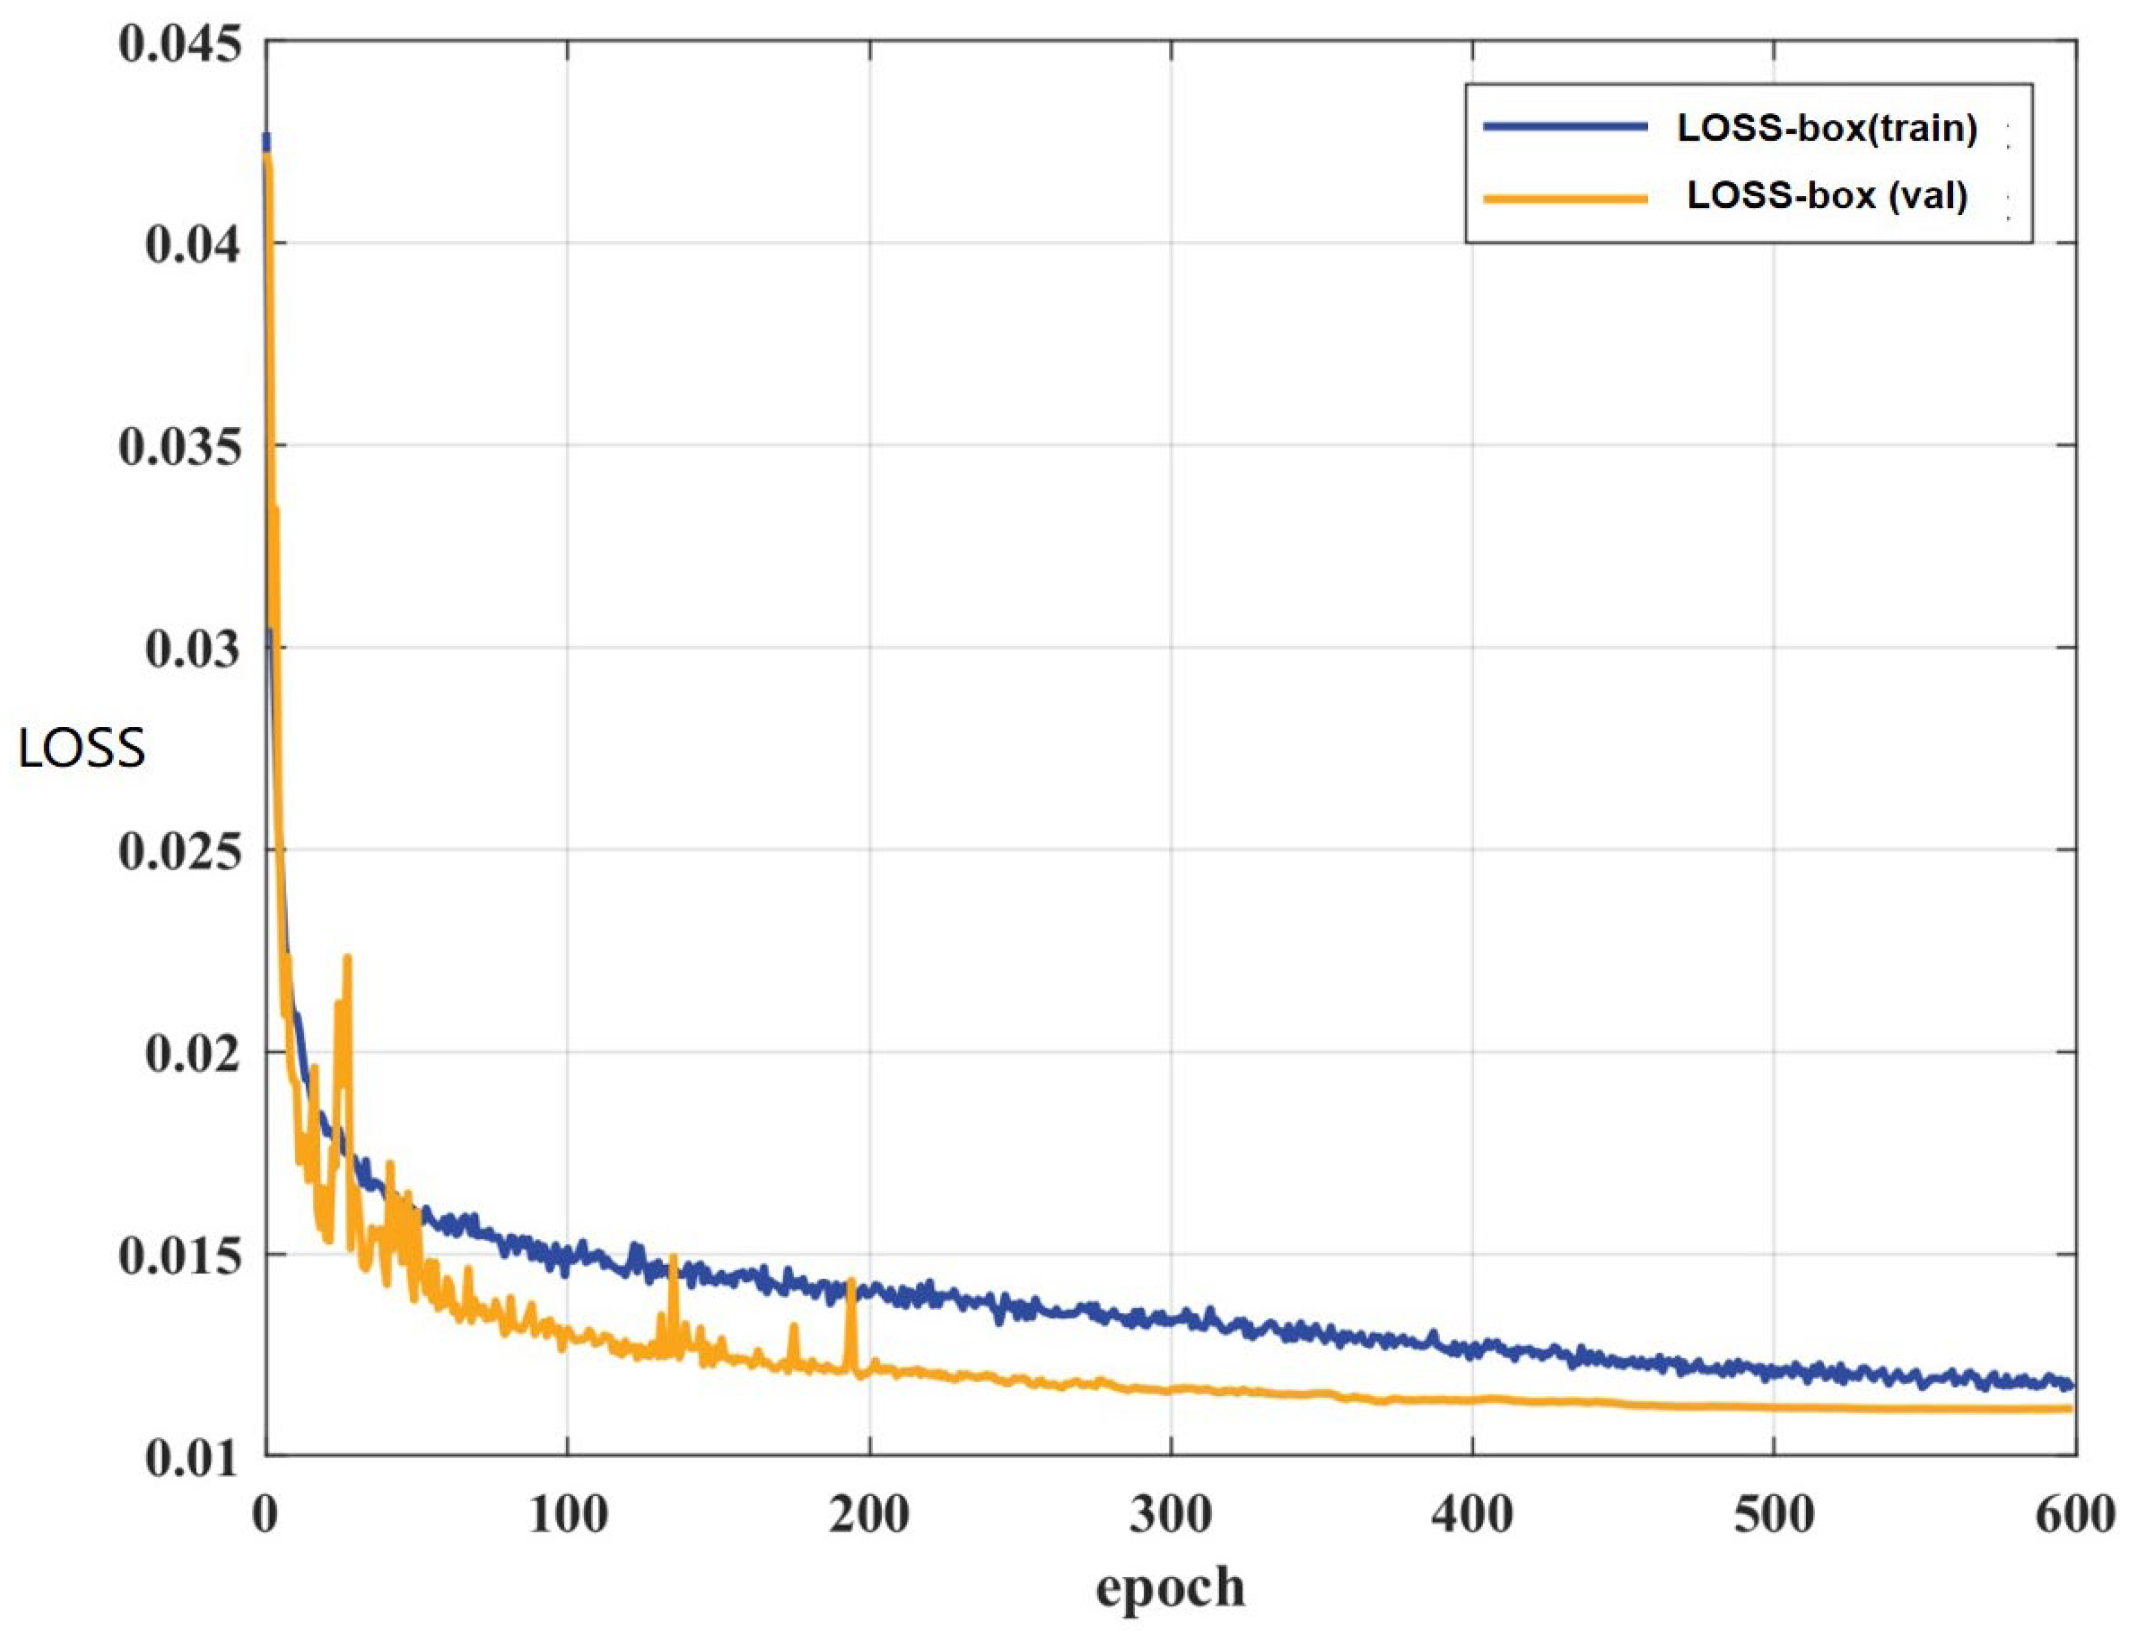
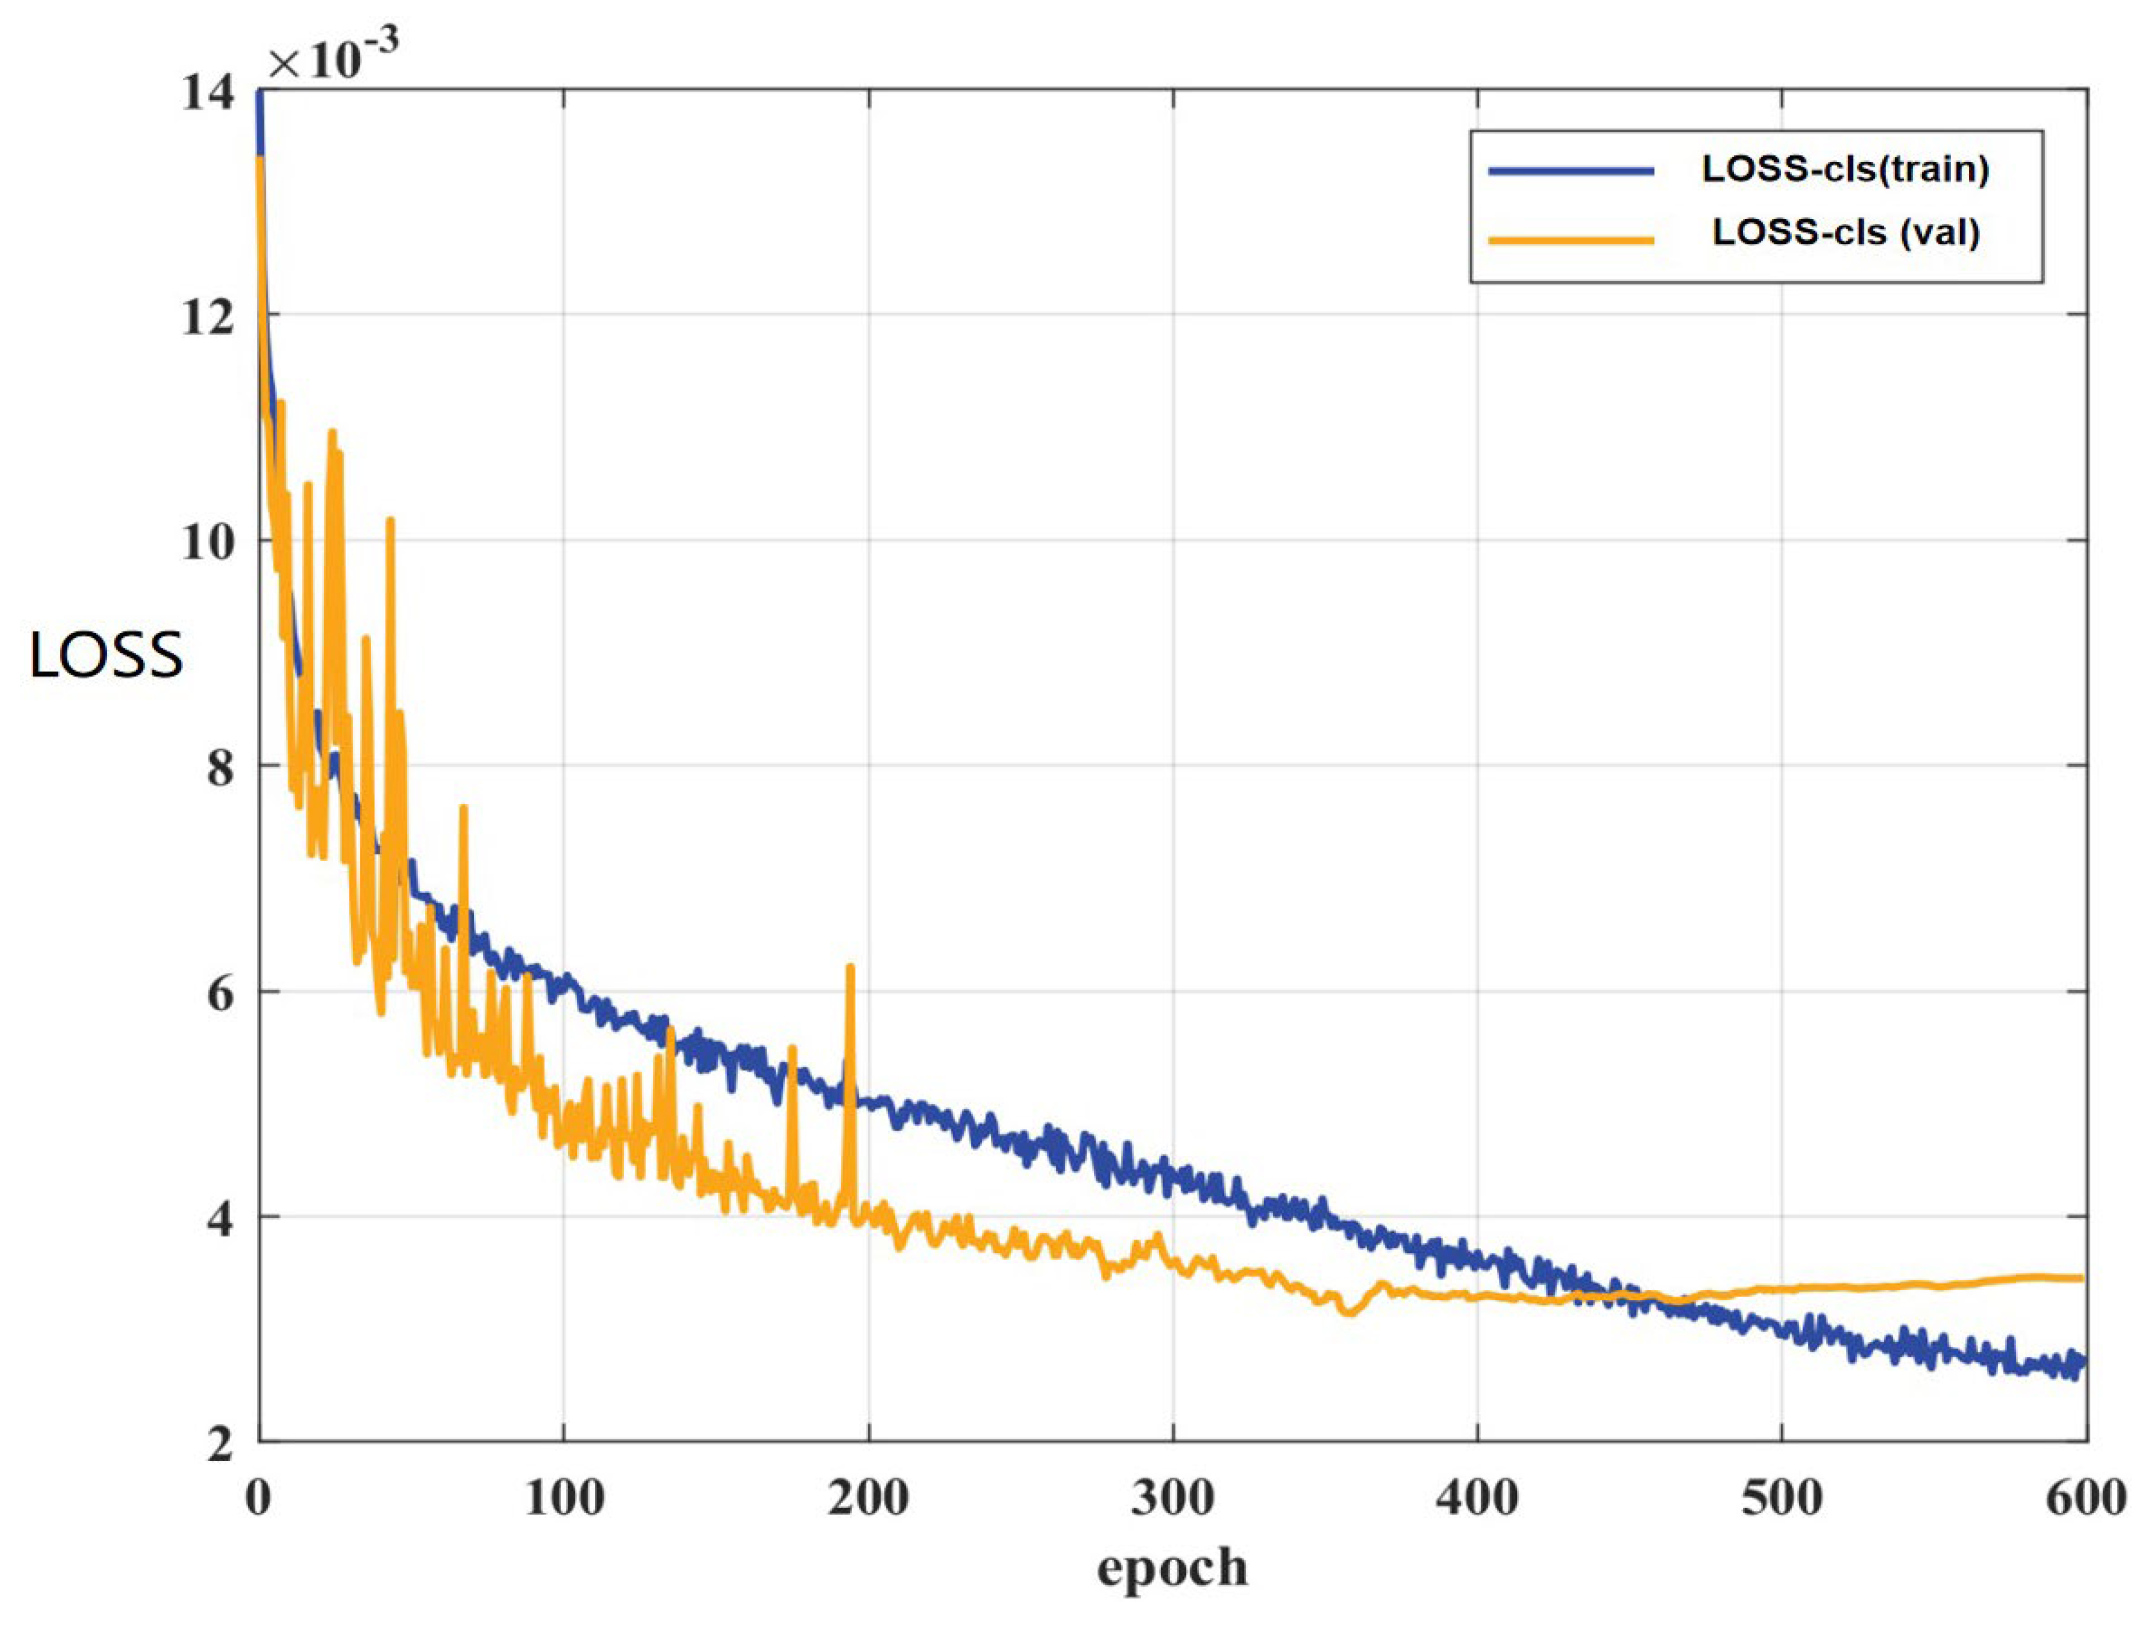
3.2. Model Loss Function

The WDD model contains three main aspects of loss during training: localization loss L b o x , classification loss L c l s , and confidence loss L o b j . The loss function of the WDD model can be calculated using Equation (5):
W D D _ L O S S = λ 1 L b o x + λ 2 L c l s + λ 3 L o b j
The localization loss L b o x , also known as rectangular box loss, mainly reflects the model’s prediction accuracy of the target position in target detection, which is used in this paper as CIOU Loss, and it can be calculated using Equations (6)–(9):
C I O U = I O U ( ρ 2 ( b , b g t ) c + α v )
v = 4 π 2 ( arctan w g t h g t arctan w h ) 2
α = v ( 1 I O U ) + v
C I O U _ L O S S = 1 C I O U
where IOU is the intersection and union ratio of the real bounding box and the predicted bounding box, b is the predicted target bounding box. b g t is the center point coordinates of the real target bounding box and ρ is the Euclidean distance between b and b g t . c denotes the length of the diagonal of the smallest outer rectangle of the two target bounding boxes. w g t is the width of the bounding box of the real target. h g t is the height of the real target bounding box. w represents the width of the predicted target bounding box. h represents the height of the predicted target bounding box.
The localization loss L b o x in the training and validation sets are shown in Figure 8. The loss of the training rectangular frame and the loss of the verification rectangular frame are both slowly decreasing. Before 200 epochs, the loss of the verification rectangular frame has a step phenomenon. After reaching 500 epochs, both of them gradually converge and remain stable, and the loss rate is lower than 0.012, which indicates that the models have achieved good results in learning target location prediction.
The classification loss L c l s refers to measuring the gap between the output of the model and the real label when performing classification tasks. The classification loss function uses the binary cross entropy loss function BCE Loss, as shown in Figure 9. As with localization loss, the model is still learning how to distinguish different classes before 200 epochs, resulting in a step phenomenon in the validation class loss function. All of them stabilize after 500 epochs, with the maximum value not exceeding 0.003, and the model obtains a good performance on the validation set.
The confidence loss L o b j refers to the predictive confidence used to measure whether the model predicts the existence of the target in the target detection task. The confidence loss still uses the binary cross entropy loss function BCE LOSS. The functional image of the confidence loss is shown in Figure 10. Confidence loss also shows a step in 200 epochs, but the confidence loss of training and validation stabilizes after 400 epochs, indicating that the model can determine the existence of the target earlier, but the specific location and the specific category of the target need to continue to learn iteratively. The 3 loss functions are all stable at 600 epochs, indicating that the model has stabilized and has good accuracy and robustness.

3.3. The Evaluation Index

The evaluation index of the model is an index system used to measure the performance of the model, which is used to evaluate the performance of the model on specific tasks, such as precision (P), recall (R), mean average precision (mAP), detection speed, and model size, etc. The calculation formula for precision can be calculated using Equation (10):
P = T P T P + F P
Recall can be calculated using Equation (11):
R = T P T P + F N
where TP denotes a positive sample that is correctly predicted, FP is a negative sample that is incorrectly predicted, TN is a negative sample that is correctly predicted, and FN is a positive sample that is incorrectly predicted.
The purpose of this research is to obtain a model that achieves both high precision and recall. Therefore, these two factors must be considered comprehensively. One method uses the harmonic mean F1 for measurement, and the other uses the area under the P-R curve (AUC)—that is, the average precision (AP). The AP can be calculated using Equation (12):
A P = 0 1 P ( R ) d R
The AP is for one category, and the average precision of all categories can be calculated using Equation (13):
m A P = 1 N i N A P ( i )
where N denotes the number of label categories in the marine oil particle dataset.
Consequently, in this study, we used mAP 0.5:0.95, mAP 0.5, and frames per second (FPS) as the evaluation indices of the model to comprehensively evaluate its actual performance. Among them, mAP 0.5:0.95 is the average precision of all categories with 10 thresholds between 0.5 and 0.95 (step = 0.05), and mAP 0.5 is the average precision of all categories with a threshold of 0.5. The FPS is an important index for measuring the real-time performance of a computer vision system, indicating the number of frames processed per second. In the object detection of marine oil particle images, a high FPS value ensures that the system can respond to object changes on time, thereby ensuring real-time and accurate detection.

3.4. WDD Model Performance

3.4.1. Model PR Curve

The PR curve of the WDD model performance on the validation set is shown in Figure 11. It can be seen that the overall average precision of the WDD model exceeds 90%, which has a good detection rate for the five classes of sphere, slender, blocky, edge, and regular, and the average precision is more than 90%. For the small category, the accuracy is lower due to its large size difference from the other categories of particles and the disadvantage of the YOLOv5s framework, but the attention mechanism added to this model also makes the accuracy of the detection reach a good level. For the irregular category of abrasive grains, its features are harder to capture for learning and there are fewer samples, but the precision of the WDD model is nearly 80%, which is acceptable for a lightweight model.

3.4.2. Comparative Analysis of Model Feature Diagram

The Ghost module uses simple operations to obtain a partial feature diagram and replaces all ConvBNSiLU modules with GhostConv modules. To observe whether the model thus loses feature information, the feature diagrams after the first C3 module of YOLOv5s and after the first C3Ghost module of WDD are visualized, respectively, as shown in Figure 12. Figure 12a is the first C3 module of WDD and Figure 12b is YOLOv5s. As can be seen from the two comparative feature diagrams, the two are generally closer to each other. However, the C3Ghost module extracts the shallowest feature diagrams of the model earlier (the feature diagram in the yellow background), suggesting that the model is more sensitive to the edge features of the model. The red-boxed feature diagrams represent features with weaker network response. Overall, there are four red-boxed feature diagrams in Figure 12a, compared to three in Figure 12b. Observing these feature diagrams on the shallow side, it is found that the abrasive particle contour information is much clearer in Figure 12a, indicating that the WDD model can extract information on the edges and textures of the model much faster.

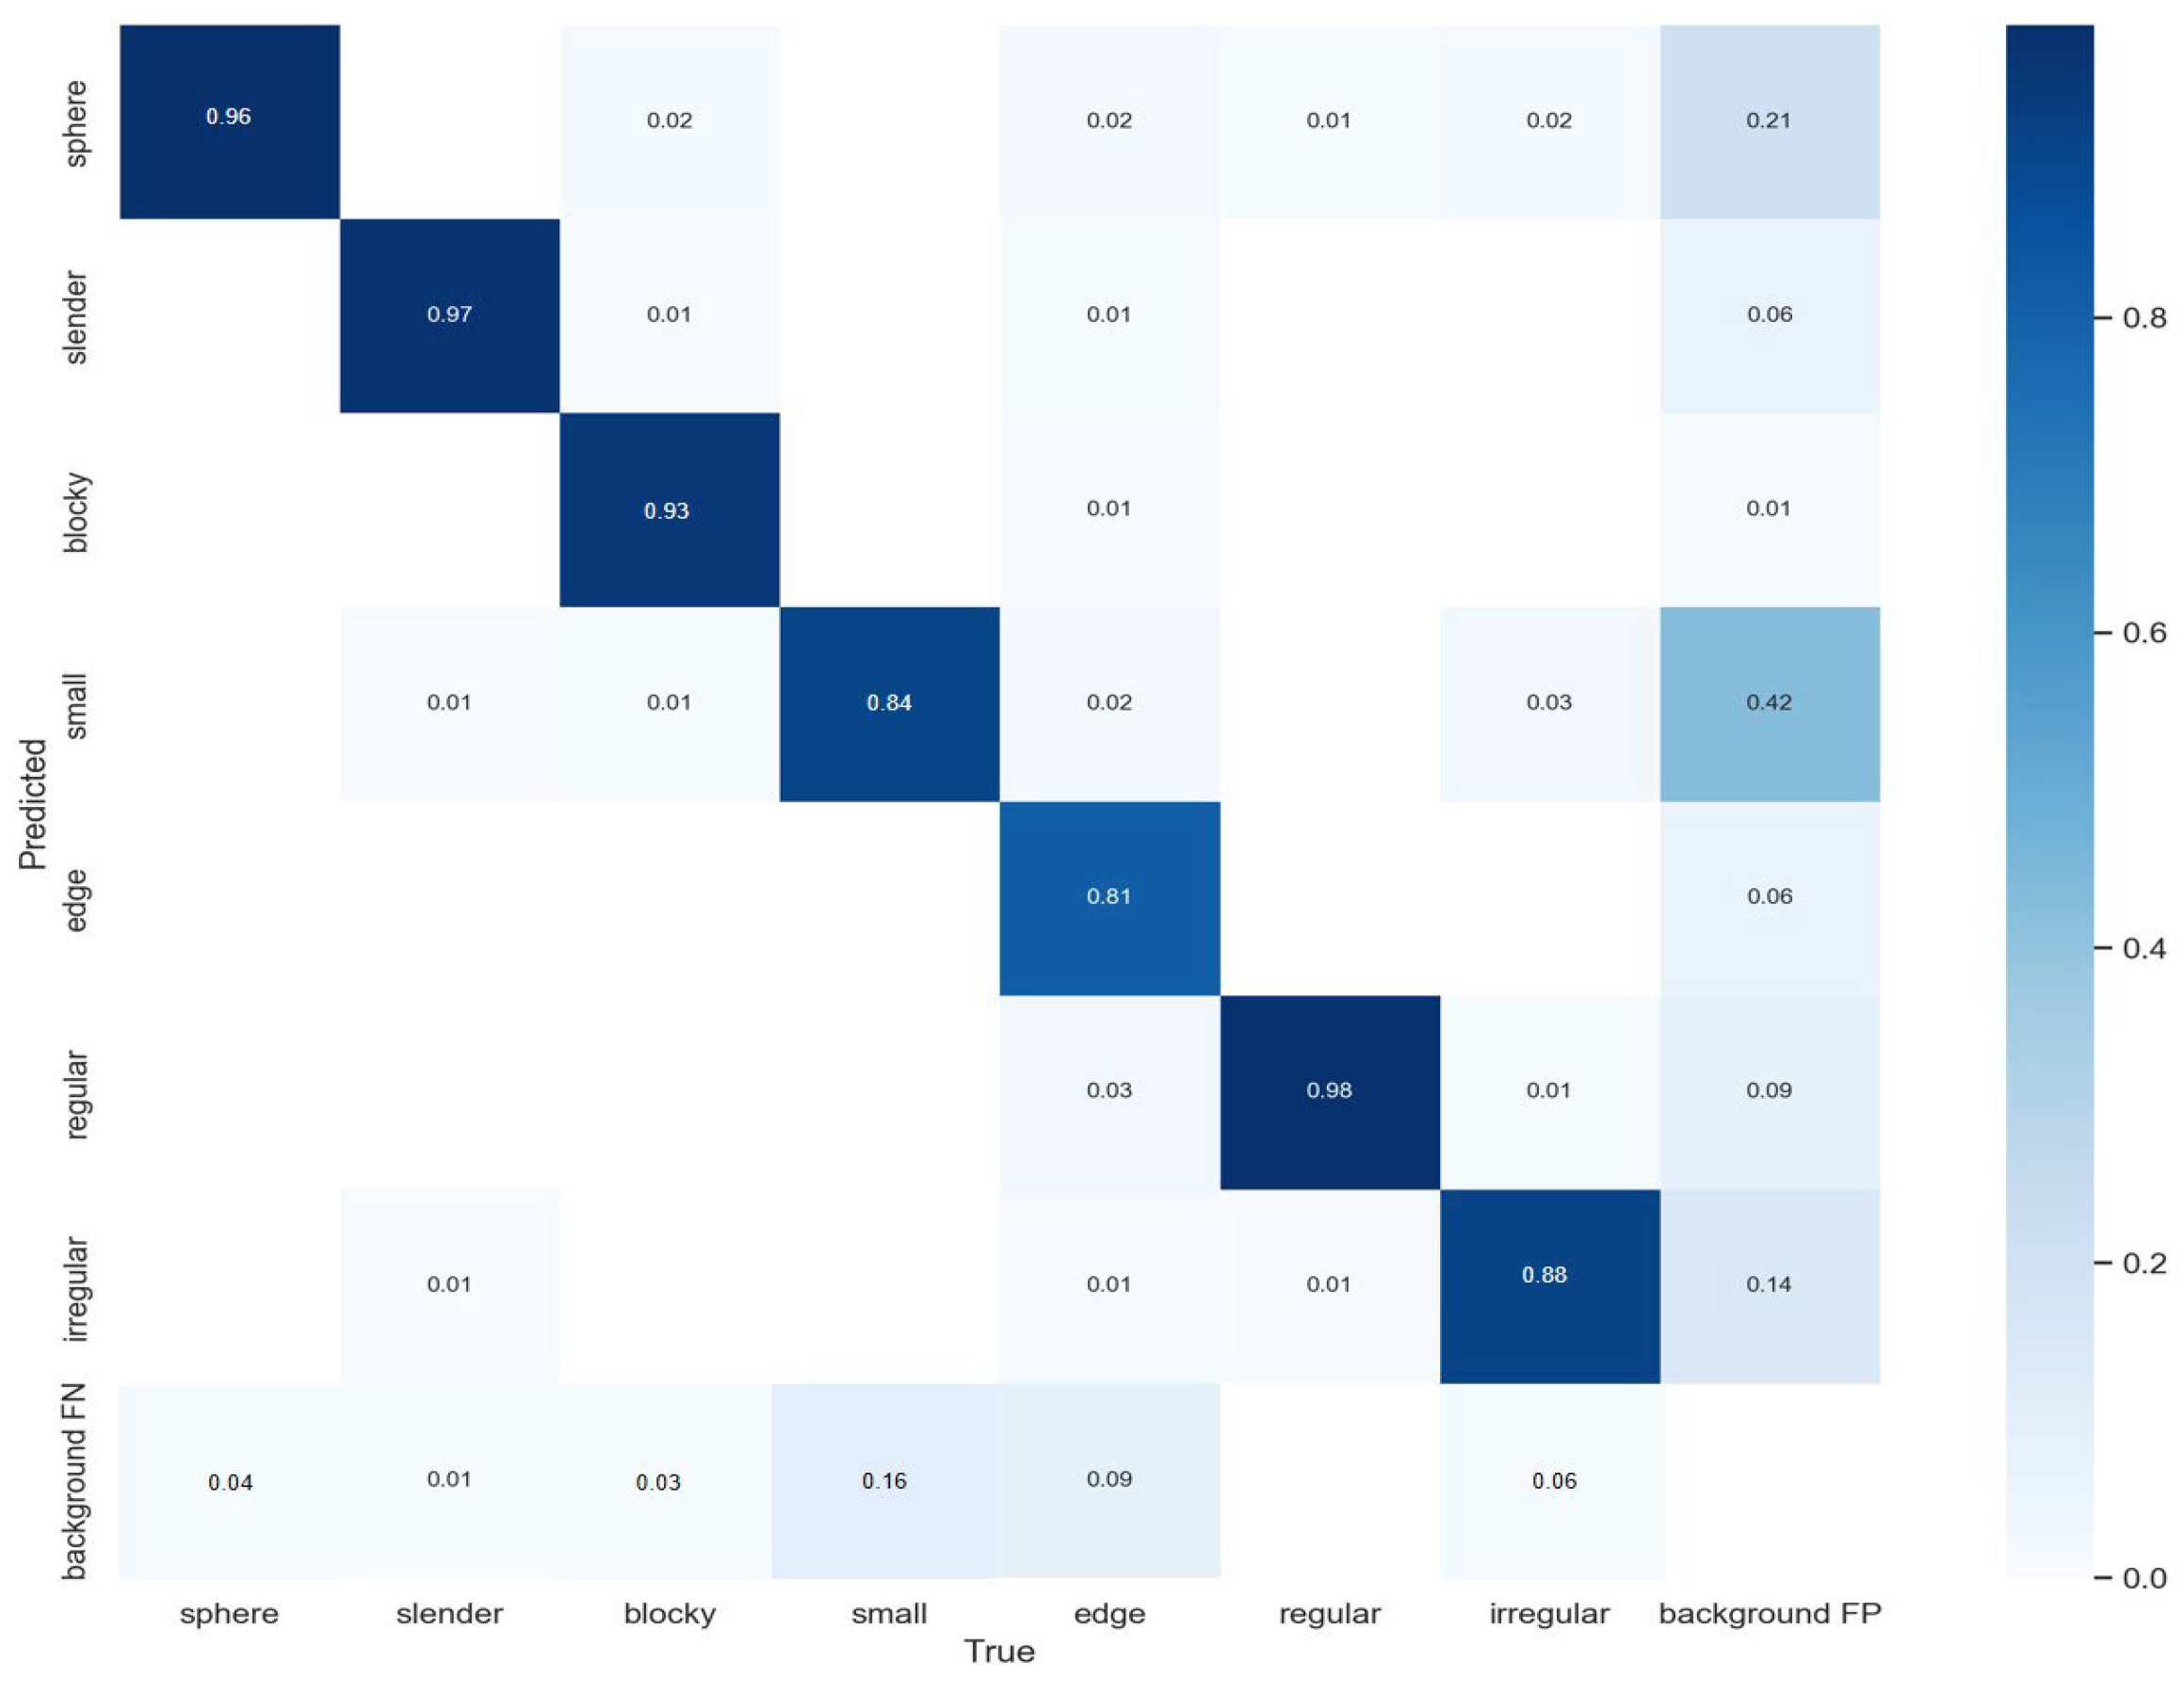
3.4.3. Comparison of Confusion Matrix

The confusion matrix is a table used to measure the classification performance of the classification model. The rows of the confusion matrix represent the actual category and the columns represent the predicted category. In the binary classification task, the confusion matrix usually includes four elements: True Positive (TP), False Positive (FP), True Negative (TN), and False Negative (FN).
True Positive: it means the number of positive samples that the model correctly identifies as positive samples.
False Positive: it means the number of positive samples that the model incorrectly identifies as negative samples.
True Negative: it means the number of negative samples that the model correctly identifies as negative samples.
False Negative: it means the number of positive samples that the model incorrectly identifies as negative samples.
The confusion matrix generated by the two models of YOLOv5s and WDD is shown in Figure 13 and Figure 14. Compared with the YOLOv5s model, the detection accuracy of the WDD model has increased, and the classification confusion rate has also decreased. In addition to the ‘edge’ and ‘small’ targets, the detection accuracy of the remaining targets has reached more than 90%, while the accuracy of ‘edge’ and ‘small’ targets has also increased by 4%. The last column shows that there are still a lot of backgrounds in the WDD model that are recognized as "small" particles, which is due to the high number of impurities in the fluid and is within the error margin.

3.4.4. Comparison of WDD Model with Other Algorithms

In order to further validate the performance of the WDD model, we conduct a side-by-side comparison test with six target detection algorithms, namely Faster R-CNN, YOLOv3, YOLOv5s, YOLOv5m, YOLOv7, and YOLOV8s. Faster Region-based convolutional neural network (Faster R-CNN) is a well-known two-stage object detection algorithm, which was proposed by Shaoqing Ren et al in 2015 [33]. YOLOv3 is a single-stage object detection algorithm proposed by Joseph Redmon and Ali Farhadi in 2018 [34]. YOLOv5s is the smallest model version in the YOLOv5 series. It reduces the amount of model parameters and computational resource consumption while maintaining high detection accuracy. YOLOv5m is a medium-sized model in the YOLOv5 series. It increases the depth and width of the model based on YOLOv5s to improve the detection accuracy. YOLOv7 network is a real-time target detection algorithm developed by Alexey and Wong Kinyiu in 2022 [35]. YOLOv8 is the latest model of the YOLO series, which further improves the accuracy of detection and can simultaneously realize the tasks of detection, classification, and segmentation [36].
The comparison of the WDD model with the other six models is shown in Table 2. The mAP0.5 value of the WDD model reaches 91.2%, which was 4.8% higher than the original YOLOv5s, and the mAP0.5:0.95 value is also improved. The detection speed of the model also reaches 55 FPS, which is slightly lower than that of the YOLOv5s, but meets the criteria for real-time detection of ship oil particles. The mAP value of the Faster R-CNN reaches 88.3%, but the detection speed is only 13 FPS, which cannot meet the requirements of real-time detection. As a representative of the single-stage detection algorithm, the YOLOv3 algorithm fails to meet the requirements in terms of accuracy and computing speed due to the limited feature extraction ability of the backbone network. The detection precision and detection speed of YOLOv5m have been improved, but there is still a big gap between it and the WDD model proposed in this research. Although the mAP value of YOLOv7 reaches 90.3%, the detection speed is 40% slower. The detection speed of YOLOv8s exceeds 50 FPS, but the mAP is 3% lower than the WDD model. In summary, the WDD model achieves both high precision and high detection speed and is suitable for real-time detection of marine oil particles.

3.4.5. Ablation Experiment

In order to study the influence of the optimization of different modules on the whole algorithm, we conducted ablation experiments based on YOLOv5 s and used the same parameters to train the whole model. Table 3 lists the optimization performance of each module based on YOLOv5s. When only using the Ghost module, its parameter number decreases a lot, so the detection speed of the model is increased to 61 FPS, but the model mAP is also decreased by 2%. The CBAM module is added separately, and the performance of the model is slightly improved, but it is not obvious. It may be because the attention mechanism assigns weights to different inputs, which leads to the unstable influence of the model on different inputs, making the original model training more complicated. The ASPP module is replaced separately, and the precision, recall rate, and average precision are improved, but the detection speed is also reduced to 49 FPS. The WDD model is used in this research, although the detection speed is not the fastest, it guarantees the highest precision, recall rate, and average precision. The detection speed of the model has also been greatly improved after the lightweight improvement.

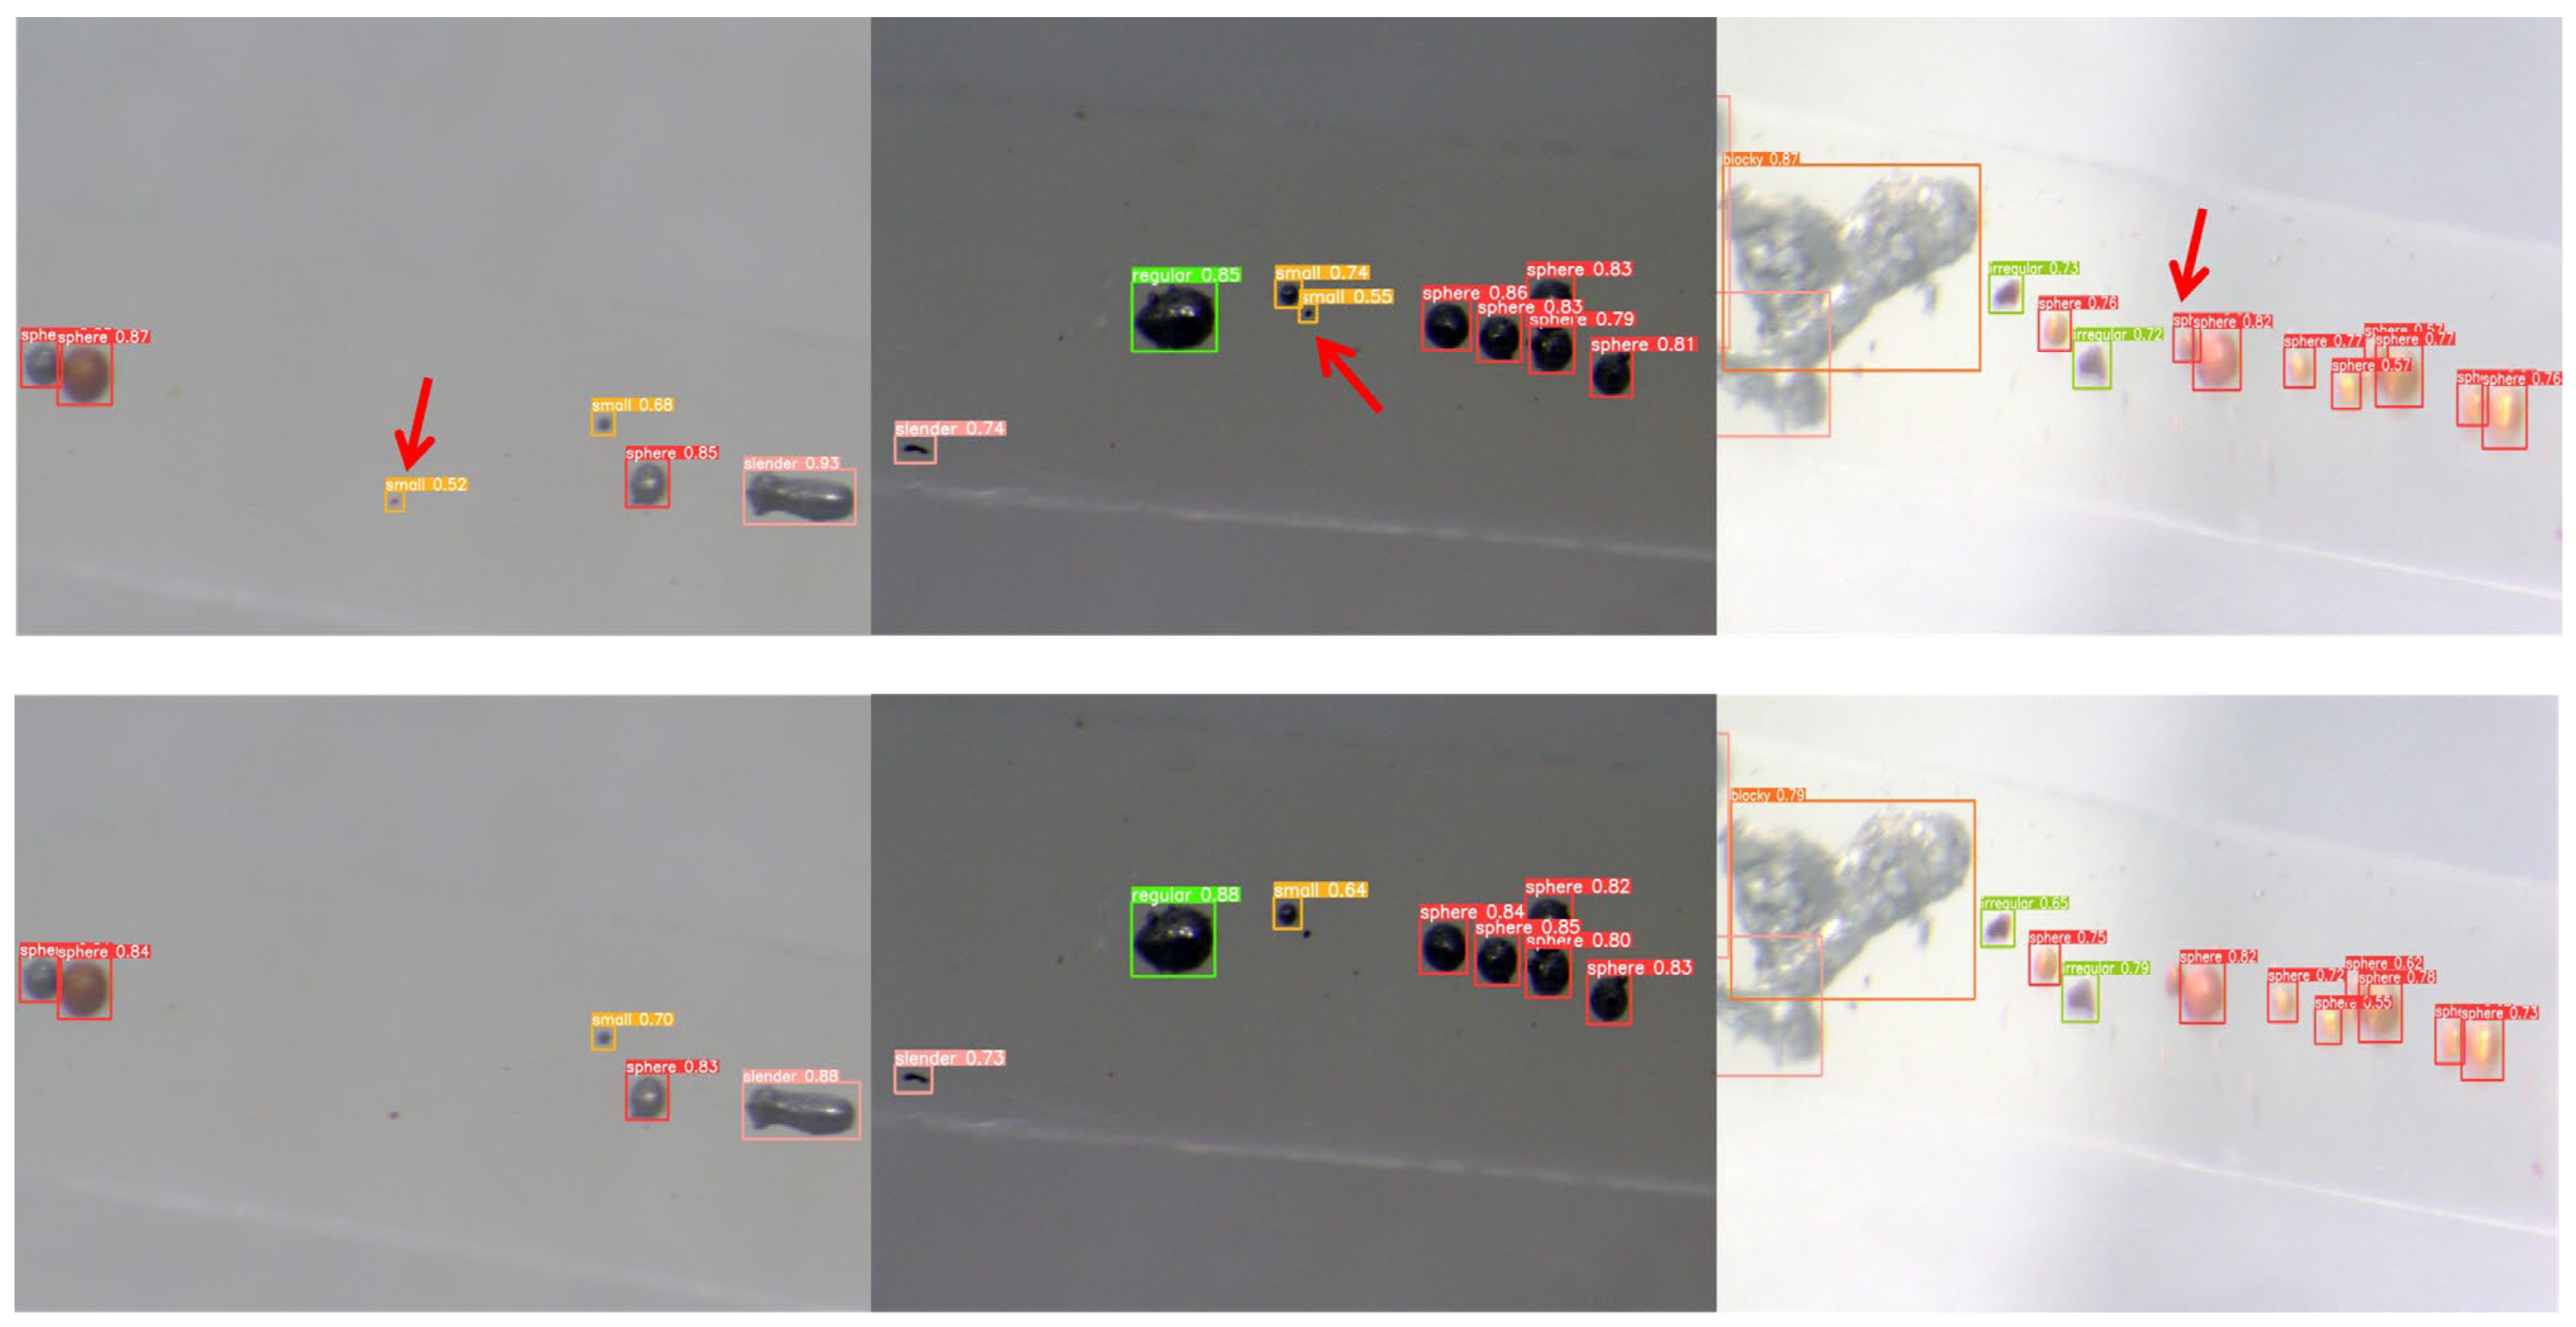
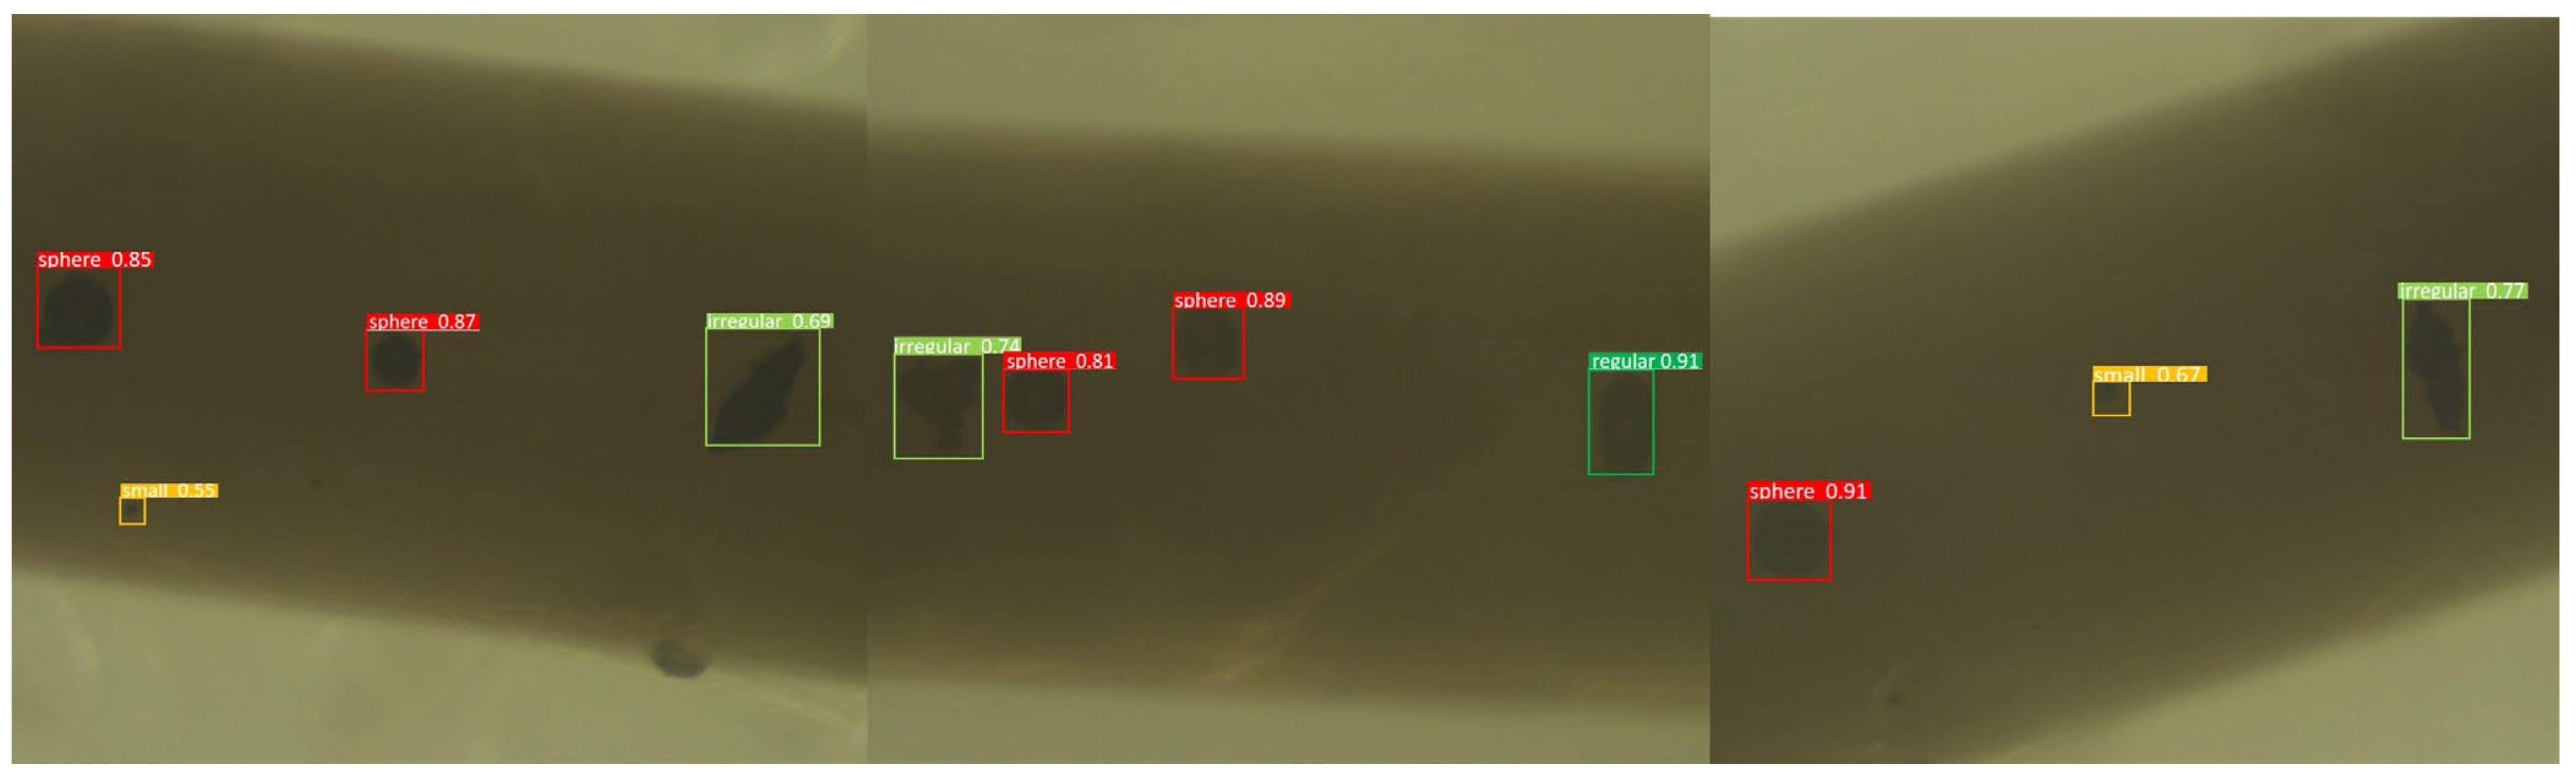
3.4.6. Compared with YOLOv5s Visualization Results

The experimental results of the WDD model and the YOLOv5s model are visualized and validated separately using images from the test set to verify the performance of the models on the new dataset. The output classification loss and confidence loss for the test set data are set to 0.5. The validation of the WDD model in the test set for the abrasive particle confidence is largely consistent with that in the test set, as shown in Figure 15. The above row is the test results of the WDD model, and the following is the original YOLOv5s test results. It is found that WDD can detect small abrasive particles and partially occluded targets that are not detected by YOLOv5s. The WDD model does not show any misdetection, indicating that it performs well in classification metrics and has good robustness and generalization ability. The validation of the WDD model for particle confidence in the test set is the same as that in the test set, and by comparing it with the YOLOv5s model, it is found that the WDD has higher confidence outputs for all seven particles, which indicates that the WDD model has a more favorable performance.

3.4.7. Analysis of the Detection Effect of Real Marine Lubricating Oil Particles

In order to verify the practical application effect of the model, the wear particles in the real marine lubricating oil are detected in this paper. The detection effect is shown in Figure 16. It can be seen that there are many pollutants in the real oil, and the background is more complex, which causes great difficulties in target detection. However, the WDD model has no error detection phenomenon and high confidence. Although some small particles are missed, they meet the standards of the practical application of ships.
Table 4 lists the detection indicators of each category in real oil. The recall rate and average accuracy of the WDD model in the five categories of spherical particles, strip particles, block particles, edge particles, and oval particles are more than 90%. The detection effect of irregular particles and tiny particles is lower than the average value due to the difficulty of detection. The recall rate of all categories reached 90.3% and the average accuracy was 89.8%, which proved that the WDD model had good generalization performance.

3.4.8. Architecture of the System

The oil particle target detection system includes a data acquisition terminal, data communication module, computer terminal, WDD detection algorithm, interactive interface, and auxiliary detection window. The CCD camera and the microscope collect the video stream information of the ship lubricating oil and transmit it to the computer terminal for target detection. In order to obtain the detection results conveniently and quickly, this study developed the WDD&pyqt5 target detection interface and the abrasive particle auxiliary detection window form, respectively, as shown in Figure 17. The WDD&pyqt5 target detection interface can visually detect the input video in real time and can obtain the detection time and the target category and number in the picture in the output bar at the lower right. At the same time, the interface can adjust the weight, confidence, and intersection ratio of the model at any time according to the detection results. The abrasive particle auxiliary detection window is compiled and encapsulated by Python. After opening, an adaptive size real-time detection window is opened in the upper left corner of the display, in which the shape of the abrasive particle is displayed in real time, and it is effective for both image and video streaming.

4. Conclusions

To address the problem of low efficiency of abrasive particle shape detection in hydraulic fluids, this paper designs a lightweight model WDD based on YOLOv5s in the deep learning target detection model for abrasive particle shape target detection. Firstly, this paper designs the oil particle collection system, constructs a new ship oil dataset, and solves the problem of imperfect classification of traditional abrasive particles. At the same time, this paper proposes a new model classification standard and analyzes the equipment wear information that may be expressed in each category. In this study, the backbone network structure is lightened and improved based on the basic idea of GhostNet, which in turn improves the efficiency of the model. The CBAM attention mechanism is also added after the C3 layer before the model output based on the CBAM idea, which helps the model to capture and extract useful features at different scales and channels more accurately. Finally, in this article, by replacing the SPPF module with the ASPP module, the model obtains a larger perceptual field and multi-scale oil mill information.
In this research, the collected oil abrasive particles are used for testing. The mAP of the WDD model reaches 0.912 and the FPS reaches 55. Compared with other target detection algorithms, the average accuracy is the highest under the premise of ensuring the detection speed. Through visual comparison, it is found that the WDD model can detect small particles and occluded particles that cannot be detected by the YOLOV5 s model, and the confidence is also better. After that, this research also verifies in real ship lubricating oil and finds that the model can still maintain a high detection effect, which is not greatly affected by the complex background of real oil. In addition, this research also summarizes the architecture of the marine lubricating oil wear particle detection system and designs the WDD&pyqt5 target detection interface and the wear particle assisted detection form, which provides help for the real-time detection of the marine lubricating oil particles.
After realizing the real-time monitoring of oil abrasive particles, this study plans to build an online marine oil abrasive grain inspection platform. The ship oil is extracted by a peristaltic pump, and the oil flows into the flow cell through the pipeline. Then, the images in the flow cell are collected by a CCD camera and a micro-microscope, and transmitted to the Jeston Nano TX2 (a development kit with GPU produced by NVIDIA) chip for subsequent processing. Finally, the chip performs the WDD target detection algorithm on the transmitted image, obtains the shape information, position information, and quantity information of the oil abrasive particles through the PYQT5 target detection interface, and displays them directly on the screen. The platform can detect the wear inside the ship’s engine in real time according to the relationship between the abrasive particles and the wear of the equipment analyzed above, so as to implement preventive maintenance, avoid potential mechanical failure and accidental shutdown, prolong the service life of key components, and reduce the replacement frequency and maintenance cost.
At present, the real-time detection of marine lubricating oil needs to process a large amount of data in a short time. The detection speed of the WDD model needs to be further strengthened. Therefore, in future work, the model needs to be converted into TensorRT format to improve the inference speed and performance of the model, to meet the engineering application requirements of real-time detection of marine lubricating oil particles.

Author Contributions

Conceptualization, C.B. and J.D.; methodology, C.B. and J.D.; software, C.B. and J.D.; validation, C.B., J.D. and Z.X.; formal analysis, J.D.; investigation, C.B. and H.L.; resources, H.Z.; data curation, C.B. and J.D.; writing—original draft preparation, C.B. and J.D.; writing—review and editing, C.B. and J.D.; visualization, J.D.; supervision, H.Z., W.L., Y.W., G.L. and J.W.; project administration, H.Z.; funding acquisition, H.Z. All authors have read and agreed to the published version of the manuscript.

Funding

This research was supported by the Natural Science Foundation of China (Grant No. 52301361, 52271303), Fundamental Research Funds for the Central Universities (Grant No. 3132023522), a project funded by China Postdoctoral Science Foundation (Grant No. 2023M730454), the Science and Technology Innovation Fund of Dalian (Grant No. 2022JJ11CG010), Innovative Projects for the Application of Advance Research on Equipment (62602010210), and The National Key R&D Program of China (2022YFB4301400).

Institutional Review Board Statement

Not applicable.

Informed Consent Statement

Not applicable.

Data Availability Statement

Data are contained within the article.

Acknowledgments

All authors thank Yiwen Zheng for providing language help.

Conflicts of Interest

The authors declare that they have no known competing financial interests or personal relationships that could have appeared to influence the work reported in this paper.

References

  1. Han, W.B.; Mu, X.T.; Liu, Y.; Wang, X.; Zhang, H.P. A Critical Review of on-Line Oil Wear Debris Particle Detection Sensors. J. Mar. Sci. Eng. 2023, 11, 236. [Google Scholar] [CrossRef]
  2. Bai, C.Z.; Kan, X.M.; Yang, Y.; Yu, S.; Xu, Z.W. Dual-channel Metal Debris Signal Differential Detection Based on Frequency Division Multiplexing. IEEE Sens. J. 2024, 24, 3361551. [Google Scholar] [CrossRef]
  3. Wang, S.; Zhang, Y.; Zhang, B.; Fei, Y.; He, Y.; Li, P.; Xu, M. On the Sparse Gradient Denoising Optimization of Neural Network Models for Rolling Bearing Fault Diagnosis Illustrated by a Ship Propulsion System. J. Mar. Sci. Eng. 2022, 10, 1376. [Google Scholar] [CrossRef]
  4. Wang, X.Y.; Wang, C.Y.; Liu, H.L.; Zhang, H.P.; Bai, C.Z. An Adversarial Single-Domain Generalization Network for Fault Diagnosis of Wind Turbine Gearboxes. J. Mar. Sci. Eng. 2023, 11, 2384. [Google Scholar] [CrossRef]
  5. Shirmohammadi, S.; Ferrero, A. Camera as the instrument: The rising trend of vision based measurement. IEEE Instru Meas Mag. 2014, 17, 41–47. [Google Scholar] [CrossRef]
  6. Lin, C.; Chen, W.; Zhou, H.F. Multi-Visual Feature Saliency Detection for Sea-Surface Targets through Improved Sea-Sky-Line Detection. J. Mar. Sci. Eng. 2020, 8, 8100799. [Google Scholar] [CrossRef]
  7. Tuhtan, J.A.; Nag, S.; Kruusmaa, M. Underwater bioinspired sensing: New opportunities to improve environmental monitoring. IEEE Instru. Meas. Mag. 2020, 23, 30–36. [Google Scholar] [CrossRef]
  8. Kaushik, A.; Singh, P.; Kumar, H. Experimental comparison of unbonded, agglutinated and sintered SiC-based magnetic abrasive particles in magnetic abrasive finishing process. J. Magn. Magn. Mater. 2023, 587, 171294. [Google Scholar] [CrossRef]
  9. Beigmoradi, S. Investigation of the ability of low-frequency acoustic energy for polishing of the CK60 steel using a hybrid FE/BE/DEM approach. Comput. Part. Mech. 2022, 9, 1337–1349. [Google Scholar] [CrossRef]
  10. Deng, H.; Wang, G.; Li, Q.; Sun, Q.Z. Transmissive Single-Pixel Microscopic Imaging through Scattering Media. Sensors 2021, 21, 2721. [Google Scholar] [CrossRef]
  11. Zhang, Q.; Sun, L.; Chen, J.; Zhou, M.; Hu, M.; Wen, Y. Speeded-Up Robust Features-based image mosaic method for large-scale microscopic hyperspectral pathological imaging. Meas. Sci. Technol. 2021, 32, 035503. [Google Scholar] [CrossRef]
  12. Zhao, H.; Ke, Z.; Chen, N.; Wang, S.; Gong, X. A new deep learning method for image deblurring in optical microscopic systems. J. Biopkotonics 2020, 13, 201960147. [Google Scholar] [CrossRef]
  13. Zhai, L.; Ma, X.; Shao, Y.; Zhong, G. Metric and strong metric dimension in commuting graphs of finite groups. Commun. Algebra. 2023, 51, 1000–1010. [Google Scholar] [CrossRef]
  14. Wang, H.; Liu, M.L.; He, H. Magneto telluric inversion based on BP neural network optimized by genetic algorithm. Chin. J. Geophys. 2018, 61, 1563–1575. [Google Scholar]
  15. Zhao, S.K.; Chen, B.; Wang, H.; Luo, Z.Y.; Zhang, T. A Feed-Forward Neural Network for Increasing the Hopfield-Network Storage Capacity. Int. J. Neural. Syst. 2022, 32, 2250027. [Google Scholar] [CrossRef]
  16. Bediaga, I.; Mendizabal, X.; Etxaiz, I.; Munoa, J. An Integrated System for Machine Tool Spindle Head Ball Bearing Fault Detection and Diagnosis. IEEE Instru. Meas. Mag. 2013, 16, 42–47. [Google Scholar] [CrossRef]
  17. Wang, S.Y.; Fu, X.Y.; Zhao, Y.; Wang, H. Modification of CFAR Algorithm for Oil Spill Detection from SAR Data. Intell. Autom. Soft. Co. 2015, 21, 163–174. [Google Scholar] [CrossRef]
  18. Li, B.; Xu, J.; Pan, X.X.; Chen, R. Preliminary Investigation on Marine Radar Oil Spill Monitoring Method Using YOLO Model. J. Mar. Sci. Eng. 2023, 11, 670. [Google Scholar] [CrossRef]
  19. Wang, H.P.; Wan, X.; Yuan, R.J. Rapid Detection of Extra Virgin Olive Oil Based on Supercontinuum Spectroscopy. Spectrosc. Spect. Anal. 2020, 40, 1251–1256. [Google Scholar]
  20. Wang, Y.H.; Lai, J.Y.; Lo, Y.C.; Lin, P.C. An Image-Based Data-Driven Model for Texture Inspection of Ground Workpieces. Sensors 2022, 22, 5192. [Google Scholar] [CrossRef]
  21. Tang, H.S.; Ren, Y.; Zhang, X.L. Tribological performance of MoS2 coating on slipper pair in axial piston pump. J. Cent. South Univ. 2020, 27, 1515–1529. [Google Scholar] [CrossRef]
  22. Somaweera, H.; Estlack, Z.; Devadhasan, J.P.; Kim, J. Characterization and Optimization of Isotachophoresis Parameters for Pacific Blue Succinimidyl Ester Dye on a PDMS Microfluidic Chip. Micromachines 2020, 11, 951. [Google Scholar] [CrossRef]
  23. Khoshboresh, M.; Hasanlou, M. Improving hyperspectral sub-pixel target detection in multiple target signatures using a revised replacement signal model. Eur. J. Remote. Sens. 2020, 53, 316–330. [Google Scholar] [CrossRef]
  24. Jiang, Y.H.; Dong, L.L.; Chen, Y.; Xu, W.H. An Infrared Small Target Detection Algorithm Based on Peak Aggregation and Gaussian Discrimination. IEEE. Access. 2020, 8, 106214–106225. [Google Scholar] [CrossRef]
  25. Abdelhamid, A.; Alotaibi, S.R.; Mousa, A. Deep learning-based prototyping of android GUI from hand-drawn mockups. IET. Software 2020, 14, 816–824. [Google Scholar] [CrossRef]
  26. Ren, P.M.; Wang, L.; Fang, W.; Song, S.L.; Djahel, S. A novel squeeze YOLO-based real-time people counting approach. Int. J. Bio-Inspir. Com. 2020, 16, 94–101. [Google Scholar] [CrossRef]
  27. Liu, J.H.; Wang, C.Y.; Su, H.; Du, B.; Tao, D.C. Multistage GAN for Fabric Defect Detection. IEEE. Trans. Image. Process. 2020, 29, 3388–3400. [Google Scholar] [CrossRef]
  28. Aguerre, N.V.; Bajo, M.T.; Carlos, J. Dual mechanisms of cognitive control in mindful individuals. Psychol. Res. Psych. 2021, 85, 1909–1921. [Google Scholar] [CrossRef]
  29. Guan, X.Y.; Frenkel, S. Organizational support and employee thriving at work: Exploring the underlying mechanisms. Pers. Rev. 2021, 50, 935–953. [Google Scholar] [CrossRef]
  30. Chen, L.C.; Papandreou, G.; Kokkinos, I. Semantic image segmentation with deep convolutional nets and fully connected CRFs. Computer. Sci. 2014, 4, 357–361. [Google Scholar]
  31. Ziengler, T.; Fritschie, M.; Kuhn, L. Efficient Smoothing of Dilated Convolutions for Image Segmentation. arXiv 2019, arXiv:1903.07992 . [Google Scholar]
  32. Shang, X.N.; Chen, Z.B.; Sun, G.D.; Yang, G.X. Data collection in sensor nets with heterogeneous duty cycles: Pursuit of efficient opportunity. Eurasip. J. Wirel. Commun. Netw. 2018, 4, 97. [Google Scholar] [CrossRef]
  33. Xu, X.Y.; Zhao, M.; Shi, P.X.; Ren, R.Q.; He, X.H. Crack Detection and Comparison Study Based on Faster R-CNN and Mask R-CNN. Sensors 2022, 22, 1215. [Google Scholar] [CrossRef] [PubMed]
  34. Deng, L.X.; Li, H.; Liu, H.; Gu, J. A lightweight YOLOv3 algorithm used for safety helmet detection. Sci. Rep. 2022, 12, 10981. [Google Scholar] [CrossRef] [PubMed]
  35. Wang, W.; Chen, J.; Huang, Z.; Yuan, H.; Li, P. Improved YOLOv7-Based Algorithm for Detecting Foreign Objects on the Roof of a Subway Vehicle. Sensors 2023, 23, 9440. [Google Scholar] [CrossRef]
  36. Li, S.; Huang, H.; Meng, X.; Wang, M. A Glove-Wearing Detection Algorithm Based on Improved YOLOv8. Sensors 2023, 23, 9906. [Google Scholar] [CrossRef]
Figure 1. Comparison of abrasive particle shapes: (a) spherical particle; (b) strip particle; (c) block particle; (d) tiny particle; (e) edge particle; (f) elliptical particle; (g) irregular particle.
Jmse 12 00677 g001
Figure 2. Abrasive particle collection and inspection system.
Jmse 12 00677 g002
Figure 3. Schematic diagram of the structure of GhostConv and C3Ghost.
Jmse 12 00677 g003
Figure 4. Schematic diagram of the CBAM structure.
Jmse 12 00677 g004
Figure 5. C3 module for adding attention mechanisms.
Jmse 12 00677 g005
Figure 6. ASPP module structure.
Jmse 12 00677 g006
Figure 7. WDD model structure diagram.
Jmse 12 00677 g007
Figure 8. The localization loss in the training and validation sets.
Jmse 12 00677 g008
Figure 9. The classification loss in the training and validation sets.
Jmse 12 00677 g009
Figure 10. The confidence loss in the training and validation sets.
Jmse 12 00677 g010
Figure 11. PR curves for the WDD model.
Jmse 12 00677 g011
Figure 12. First C3 feature diagram: (a) the first C3Ghost feature map of WDD; (b) the first C3 feature map of YOLOv5s.
Jmse 12 00677 g012
Figure 13. Confusion matrix of YOLOv5s model.
Jmse 12 00677 g013
Figure 14. Confusion matrix of WDD model.
Jmse 12 00677 g014
Figure 15. Comparison of WDD and YOLOv5s detection of the test set.
Jmse 12 00677 g015
Figure 16. Real marine lubricating oil detection effect diagram.
Jmse 12 00677 g016
Figure 17. Architecture of the oil particle target detection system.
Jmse 12 00677 g017
Table 1. Training hyper-parameter settings for the WDD model.
Hyper-ParameterDepth
Multiple
Width
Multiple
Initial
Learning
Rate
Final
Learning
Rate
Learning
Momentum
Weight
Decay
Value0.330.500.003340.151350.748320.00025
Table 2. Comparison of WDD model with other algorithms.
DetectionBackbonemAP0.5mAP0.5:0.95FPS
Faster R-CNNResNet500.8830.47513
YOLOv3Darknet530.8690.54631
YOLOv5sCSPDarknet530.8640.53857
YOLOv5mCSPDarknet530.8750.55344
YOLOv7CSPDarknet530.9030.54534
YOLOv8sCSPDarknet530.8820.55853
WDDImproved CSPDarknet530.9120.56455
Table 3. Ablation experiment.
DetectionPRmAP 0.5FPS
YOLOv5s0.9180.9420.86457
+Ghost0.9210.9380.83561
+CBAM0.9390.9620.86653
+ASPP0.9450.9540.89149
+Ghost&CBAM0.9430.9670.88758
+Ghost&ASSP0.9410.9530.88556
+CBAM&ASSP0.9620.9710.90547
+Ghost&CBAM&ASSP0.9650.9780.91255
Table 4. The detection results of each category in real marine lubricating oil.
ClassPRmAP 0.5
Spherical particle0.9760.9680.973
Strip particle0.9070.9350.904
Block particle0.9190.9420.902
Tiny particle0.8340.7140.801
Edge particle0.9050.9050.916
Elliptical particle0.9410.9340.939
Irregular particle0.7880.8780.768
All classes0.9060.9030.898
Disclaimer/Publisher’s Note: The statements, opinions and data contained in all publications are solely those of the individual author(s) and contributor(s) and not of MDPI and/or the editor(s). MDPI and/or the editor(s) disclaim responsibility for any injury to people or property resulting from any ideas, methods, instructions or products referred to in the content.

