Article

Response of Shallow-Water Temperature and Significant Wave Height to Sequential Tropical Cyclones in the Northeast Beibu Gulf

1
Laboratory of Coastal Ocean Variability and Disaster Prediction, College of Oceanography and Meteorology, Guangdong Ocean University, Zhanjiang 524088, China
2
Guangdong University Key Laboratory of Climate, Resources and Environment in Continental Shelf Sea and Deep Ocean, Zhanjiang 524088, China
3
Key Laboratory of Space Ocean Remote Sensing and Application, Ministry of Natural Resources, Zhanjiang 524088, China
*
Author to whom correspondence should be addressed.
J. Mar. Sci. Eng. 2024, 12(5), 790; https://doi.org/10.3390/jmse12050790
Submission received: 24 March 2024 / Revised: 4 May 2024 / Accepted: 5 May 2024 / Published: 8 May 2024
(This article belongs to the Special Issue Ocean Observations)

Abstract

:
Using shallow-water buoy observations, reanalysis data, and numerical models, this study analyzes the variations in sea temperature and significant wave height (SWH) caused by two sequential tropical cyclones (TCs) ‘Lionrock’ and ‘Kompasu’ in October 2021 in the northeast Beibu Gulf, South China Sea. The results show that the sea surface temperature (SST) cooling of the nearshore waters was larger than the offshore water in the basin of the gulf, with the cooling amplitude and rate decreasing and the cooling time lagging behind wind increasing from coast to offshore. The near-surface temperature at the buoy station had a maximum decrease of 2.8 °C after ‘Lionrock’, and the decrease increased slightly to 3 °C after the stronger wind of ‘Kompasu’. The total decrease of 4.6 °C indicates that the sequential TCs had a superimposed effect on the cooling of the Beibu Gulf. The heat budget analysis revealed that the sea surface heat loss and the Ekman pumping rate in the nearshore waters during ‘Kompasu’ (−535 W/m2 and 5.8 × 10⁻⁴ m/s, respectively) were significantly higher than that (−418 W/m2 and 4 × 10⁻⁴ m/s) during ‘Lionrock’. On the other hand, the SST cooling (−1.2 °C) during the second TC is smaller than (−1.6 °C) the first weaker TC in the gulf basin, probably due to the deepening of the mixed layer. During the observation period, the waves in the Beibu Gulf were predominantly wind-driven. The maximum SWHs reached 1.58 m and 2.3 m at the bouy station near shore during the two TCs, and the SWH variation was highly correlated to the wind variation with a correlation of 0.95. The SWH increases from the nearshore to offshore waters during the TCs. The SAWN and ARCIRC coupled model results suggest that wave variations in the Beibu Gulf are primarily influenced by water depth, bottom friction, and whitecapping. Two days after the TCs, sea surface cooling and high waves appeared again due to a cold air event.

1. Introduction

Tropical cyclones (TCs) are low-pressure vortices with warm centers formed over tropical or subtropical warm oceans. They typically bring widespread destructive winds, torrential rains, and other catastrophic weather conditions, leading to secondary disasters like storm surges, thunderstorms, and floods. The TCs are significant threats to coastal regions and islands but also disturb the ocean dramatically.
Using measured data in combination with ocean models and coupled air–sea models, previous researchers [1,2,3,4] have found that the interaction between the ocean and the atmosphere plays a pivotal role in the formation and development of TCs. The changes in local ocean surface temperatures directly affect atmospheric circulation. As the ocean surface temperatures rise, evaporation increases and releases more water vapor into the atmosphere, resulting in more humidity and convection in the atmosphere and favoring the formation of a tropical low-pressure system. Once a tropical low-pressure system is formed, it continues to involve the surrounding atmosphere and water vapor and continues to absorb heat from the ocean surface to sustain itself [5]. The process not only cools the sea surface temperature (SST) but also alters the heat uptake of the local ocean [6,7,8], thus contributing to global ocean heat transport [9,10,11].
Strong winds generated by TCs enhance the sensible heat flux from the ocean to the atmosphere, boost evaporation, and transfer kinetic energy into the ocean surface waves and currents, as well as gravitational potential energy. This increases ocean turbulence and deep-sea mixing and thus promotes ocean diapycnal diffusivity and ocean circulation [12,13,14]. The winds also generate surface waves, which heighten the sea surface’s roughness [15,16,17,18] and, counterintuitively, reduce the wind speed near the surface [4]. The interaction between wind and waves deepens the inflow layer, enhances the boundary inflow beyond the radius of maximum winds, and ultimately leads to an increased TC intensity [19].
Previous studies have found that the ocean’s response to TCs varies in different oceanic environments. In the open ocean of the Northern Hemisphere, the strong near-surface winds in the right of TCs resonate with the near-inertial current, resulting in a more significant sea surface cooling on the right-hand side of the TC’s track [20,21,22]. The magnitude of the cooling ranges from −1 to −9 °C, and in extreme instances, can drop to −11 °C.
The continental shelf sea, unlike the open ocean, features rich dynamic processes and intricate topographic boundaries, which complicate its response to TCs. Yang and Tang [23] analyzed the SST cooling distribution characteristics caused by 92 TCs passing through the South China Sea (SCS) from 1998 to 2009 using various satellite data. They found that 46.7% of the maximum cooling occurred on the right of TC tracks, 14.1% near the tracks, and 8.7% significantly on the left. Sadhuram [24] also found that TCs in coastal regions cause maximum cooling to their left. Xie et al. [25] noted that coastal waters get warm under the influence of TCs. Shi et al. [26] attributed the unusual cooling in the northwestern SCS after the passage of Typhoon ‘Mujigae’ in the autumn of 2015 to the intrusion of the cold air jet from the Tibetan Plateau. Furthermore, several studies have indicated that the impact of TCs in shallow water can reach the bottom of the sea [27,28,29].
TCs gain heat from the sea surface while transfer kinetic energy to the ocean, mostly by generating surface waves. Influenced by the wind structure, moving direction, and speed of TCs, the maximum significant wave height (SWH) usually occurs in the right-front quadrant of TC’s center [30]. In the open ocean, typhoon-generated waves tend to have longer wavelengths and lower frequencies. With fewer obstacles, these waves can propagate farther, and their direction of propagation aligns with the wind direction. However, in the continental shelf region, typhoon-generated waves are limited by water depth. Their wavelengths gradually become shorter, and their propagation speed diminishes, leading to a decrease in the alignment between wave direction and wind direction.
The Beibu Gulf, located at the northwestern part of the SCS, is a semi-enclosed shelf sea bordered by the Leizhou Peninsula and Hainan Island on the east, the Guangxi Zhuang Autonomous Region on the north, and Vietnam on the west. This region plays a strategic role in China’s ‘Belt and Road’ Initiative, Beibu Gulf Urban Agglomeration, and Hainan Free Trade Zone [31]. It is a traditional fishing area with rich tropical ecosystems such as coral reefs, planted forests, and seagrasses, which are vulnerable to weather extremes such as high temperatures and TCs [32,33,34,35]. The destruction of seagrass beds can have a detrimental effect on the survival of marine mammals and some fish species in the Beibu Gulf [36,37]. Given the Beibu Gulf’s susceptibility to catastrophic weather, revealing the impact of TCs on temperature and waves in this gulf is crucial for the ecosystems and navigation.
The statistics from the China Meteorological Administration indicate that nearly half of the TCs landed in China pass through Guangdong and Hainan. Specifically, about 80.4% of the TCs landed over Hainan Island further move westward across the island and enter the Beibu Gulf [38]. As global warming intensifies, the frequency and strength of TCs increase [39,40], as well as TCs impacting coastal regions [41]. The passage and landfall of TCs impacts the production and life of coastal residents [42,43]. Therefore, studying the response of nearshore waters to TCs is helpful for disaster prevention.
Previous research in the Beibu Gulf mostly focused on the impacts of TCs on storm surges [44], biochemical changes [45], and geological responses [46]. Li et al. [47] used satellite remote sensing data to analyze the SST response in the Beibu Gulf to the super typhoon ‘Rammasun’ in 2014, discovering a decrease in SST of 0.5–1 °C across the Gulf. Liu et al. [48] pointed out that the super typhoon ‘Mangkhut’ in 2018 led to the accumulation of warm water in the southern Beibu Gulf, resulting in a warming effect on the nearshore regions. Chen et al. [49] reported sea temperature changes during the passage of tropical storm ‘Wipha’ through the Beibu Gulf in 2019. They found that the magnitude of the temperature drop and the duration of recovery in the nearshore areas differe from those in the deep water of the gulf.
Satellite data and numerical simulations are generally used to investigate the response of the deep waters to TCs in the Beibu Gulf, while changes in the SST and waves in shallow waters near shore are seldom observed, particularly, under the influence of sequential TCs. What are the difference responses between shallow and deep water in the semi-closed gulf? How does the shallow water response to sequential TCs? This study addresses these questions by utilizing buoy observation data from the super-shallow waters in the northeast nearshore area of the Beibu Gulf (with a water depth of 5 m), combined with reanalysis data and the numerical model. The variations in nearshore sea temperatures and SWH after two sequential TCs, ‘Lionrock’ and ‘Kompasu’ in October 2021, are investigated.
Observational data collected during TCs are valuable resources. Buoy W3 (109.73° E, 20.65° N) captured the nearshore sea temperature and SWH in the northeast Beibu Gulf from July to November 2021. During the observation, ‘Lionrock’ and ‘Kompasu’, passed over the Beibu Gulf from 6 to 14 October. Utilizing these data, the study investigates the nearshore water response to the TCs.

2. Data and Methodology

2.1. Buoy Observation Data

From June to November 2021, Guangdong Ocean University deployed a buoy (109.73° E, 20.65° N) nearshore in the northeastern part of Beibu Gulf, which was located at a distance of about 2.5 km from Wanghaijiao, Leizhou Peninsula, in a water depth of about 5 m. The buoy was equipped with a SBE37 and RHW-2 gravity wave sensor, and the interval between the sampling of the SEB37 and the wave sensor was 10 min. The buoy experienced two sequential TCs, ‘Lionrock’ and ‘Kompasu’, from 6 to 14 October (Figure 1). According to China’s ‘Tropical Cyclone Levels’ standard [50], TCs are divided into six levels: Tropical Depression (TD, 10.8~17.1 m/s), Tropical Storm (TS, 17.2~24.4 m/s), Strong Tropical Storm (STS, 24.5~32.6 m/s), Typhoon (TY, 32.7~41.1 m/s), Strong Typhoon (STY, 41.5~50.9 m/s), and Super Typhoon (Super TY, >51 m/s).

2.2. Reanalysis Data

The sea surface temperature data used in this study were sourced from the Copernicus Marine Environment Monitoring Service (CMEMS), which provides high-resolution reanalysis data (GlobalOcean1/12°Physics Analysis and Forecast updated Daily) covering the global ocean. The temporal resolution is 1 h, and the spatial resolution is 0.083° × 0.083°. Additionally, SWH data are also provided by CMEMS, with a spatial resolution of 0.083° × 0.083° and a temporal resolution of 3 h.
The 10 m wind vector, sea surface shortwave radiation, longwave radiation, latent heat flux, and sensible heat flux data were obtained from the European Centre for Medium-Range Weather Forecasts (ECMWF) through ERA5 reanalysis assimilation data. The spatial resolution is 0.25° × 0.25°, and the temporal resolution is 1 h.
TC data (including TC tracks, maximum wind speeds, etc.) were sourced from the China Meteorological Administration (CMA), providing the best track data for TCs. Each best track includes the position of the TC center every 6 h, the central minimum pressure, and the 2 min average maximum wind near the center. (Source: https://tcdata.typhoon.org.cn, accessed on 29 April 2024).

2.3. SWAN and ADCIRC Model Data

SWAN is a third-generation numerical wave model developed by Delft University of Technology in the Netherlands based on the wave action conservation equation [51]. This model employs an implicit format to discretize the control equations and offers a more comprehensive consideration of the propagation and deformation processes of shallow-water waves, in contrast to WAM and WWW-III. It also takes into account wind, four-wave interactions, and frictional dissipation in the equilibrium equations. The SWAN model mainly includes the following mechanisms: wave propagation along rays caused by flow and non-stationary changes in water depth, wave refraction, wave breaking, wave damping and reflection, as well as wave generation of setdown and setup mechanisms. Additionally, the SWAN model considers dissipative processes including wind energy input, whitecap dissipation, bottom friction, and wave-current interactions. SWAN describes waves using energy density spectra, with the expression as follows:
t N + x C x N + y C y N + σ C σ N + θ C θ N = S σ
In the equation, N ( σ , θ) represents wave action density, where N ( σ , θ) = E( σ , θ)/ σ , with σ as the relative frequency and θ as the wave direction. The first term in the equation signifies the rate of change of wave action density N over time, the second and third terms indicate the propagation in the geographical space x and y directions at velocities C x and C y , respectively, the fourth term denotes the propagation in frequency space σ , and the fifth term represents the propagation in the spectral distribution direction θ space. On the right-hand side of the equation, S represents wave generation and dissipation, where:
S = S i n + S n l 3 + S n l 4 + S d s , w + S d s , b + S d s , b r
The terms on the right-hand side represent wind energy input, third-order wave interactions, fourth-order wave interactions, whitecapping dissipation, bottom friction dissipation, and wave breaking.
The ocean current model adopts the ADCIRC (Advanced Circulation Model) jointly developed by the University of North Carolina at Chapel Hill and Delft University of Technology in the Netherlands, which is a non-structured grid, finite element hydrodynamic model [52]. It is a two-dimensional model, and the continuity and momentum equations in the Cartesian coordinate system are as follows.
ζ + h t + U H x + V H y = 0
U t + U U x + V U y f V = g x P s ρ 0 g + ζ α η + τ s x ρ 0 H τ b x ρ 0 H + M x H D x H B x H V t + U V x + V V y f U = g y P s ρ 0 g + ζ α η + τ s y ρ 0 H τ b y ρ 0 H + M y H D y H B y H
where H = ζ + h is the total water depth derived from sea surface level ζ and topography depth h . U and V are the vertical mean velocities in the x and y directions. f is the Coriolis parameter; g is the acceleration due to gravity; P s is the atmospheric pressure at the sea surface; ρ is the reference density; η is the Newtonian equilibrium tidal potential. α is the effective Earth elastic coefficient; τ s x and τ s y are the components of external forcing surface stress in the x and y directions, respectively; τ b x and τ b y are the two components of bottom stress in the x and y directions, respectively; M x and M y are the vertically averaged stress gradients at the lateral boundaries in the x and y directions, respectively; D represents the momentum dissipation term; B x and B y are the vertically averaged cross-gradient of pressure in the x and y directions, respectively [53].
The simulation domain of the SWAN model spans from 105° E to 115° E and 17° N to 24° N. The topography is interpolated from the GEBCO2023 global bathymetric dataset (General Bathymetric Chart of the Oceans), with a total of 119,497 nodes and 228,083 triangular elements. The spatial resolution varies from 10 km in the open ocean to 200 m in nearshore areas, and the time resolution is 600 s. The wind forcing is based on the ERA5 reanalysis data, while the SWAN model boundaries automatically assume the surrounding areas of the computational grid as land points, forming closed domains. The ADCIRC and SWAN models share the same grid and are driven by identical wind force. Initial velocities and water levels were set to zero, with a zero mean flow velocity at solid boundaries. The open ocean boundaries utilize the Oregon State University TPXO9 tidal dataset, which comprises 8 constituents including K1, M1, O1, P1, S1, M2, N2, and S2, and has a time step of 0.5 s. As a coupled model, the data exchange between the ADCIRC and SWAN models is set to 600 s. ADCIRC provides the simulated flow field to the SWAN model as the background field for wave modeling.
The buoy-measured SWH in the nearshore waters of the Beibu Gulf was used to verify the validity of the SWAN model to simulate the SWH.

2.4. Parameter Calculation Method

Ekman pumping is an important indicator for measuring the vertical motion of upper water bodies, and its calculation formula is as follows:
E P V = C u r l ( τ ρ f )
In the above equation, ρ represents seawater density (1020 kg/m3), f is the Coriolis force parameter, C u r l denotes the curl operation, and τ stands for the surface stress on the sea surface, calculated using the bulk formula as follows:
τ = ρ a C d | U | U
where ρ a is the atmospheric density (1.29 kg/m3), U is the wind velocity at the sea surface at a 10 m height, and C d is the drag coefficient. The value of C d varies depending on the magnitude of U , and C d is calculated as follows:
C d =    4 0.6 U × 10 3 U < 5   m / s 0.737 + 0.525 × U × 10 3 5   m / s U < 25   m / s    2.05 × 10 3 U 25   m / s
Hao et al. [54] proposed an effective SWH model indicating that under low wind (≤16.808 m/s), the SWH and sea surface 10 m wind exhibit a quadratic polynomial relationship. Conversely, at high wind (>16.808 m/s), the relationship between the two is linear as follows:
H s = 0.082 + 0.076 U + 0.01 U 2          0 < U 16.808 0.588 + 0.21 U                      16.808 < U < 40
H s in the above equation is the SWH.

3. Sea Surface Temperature Response

3.1. Offshore Response

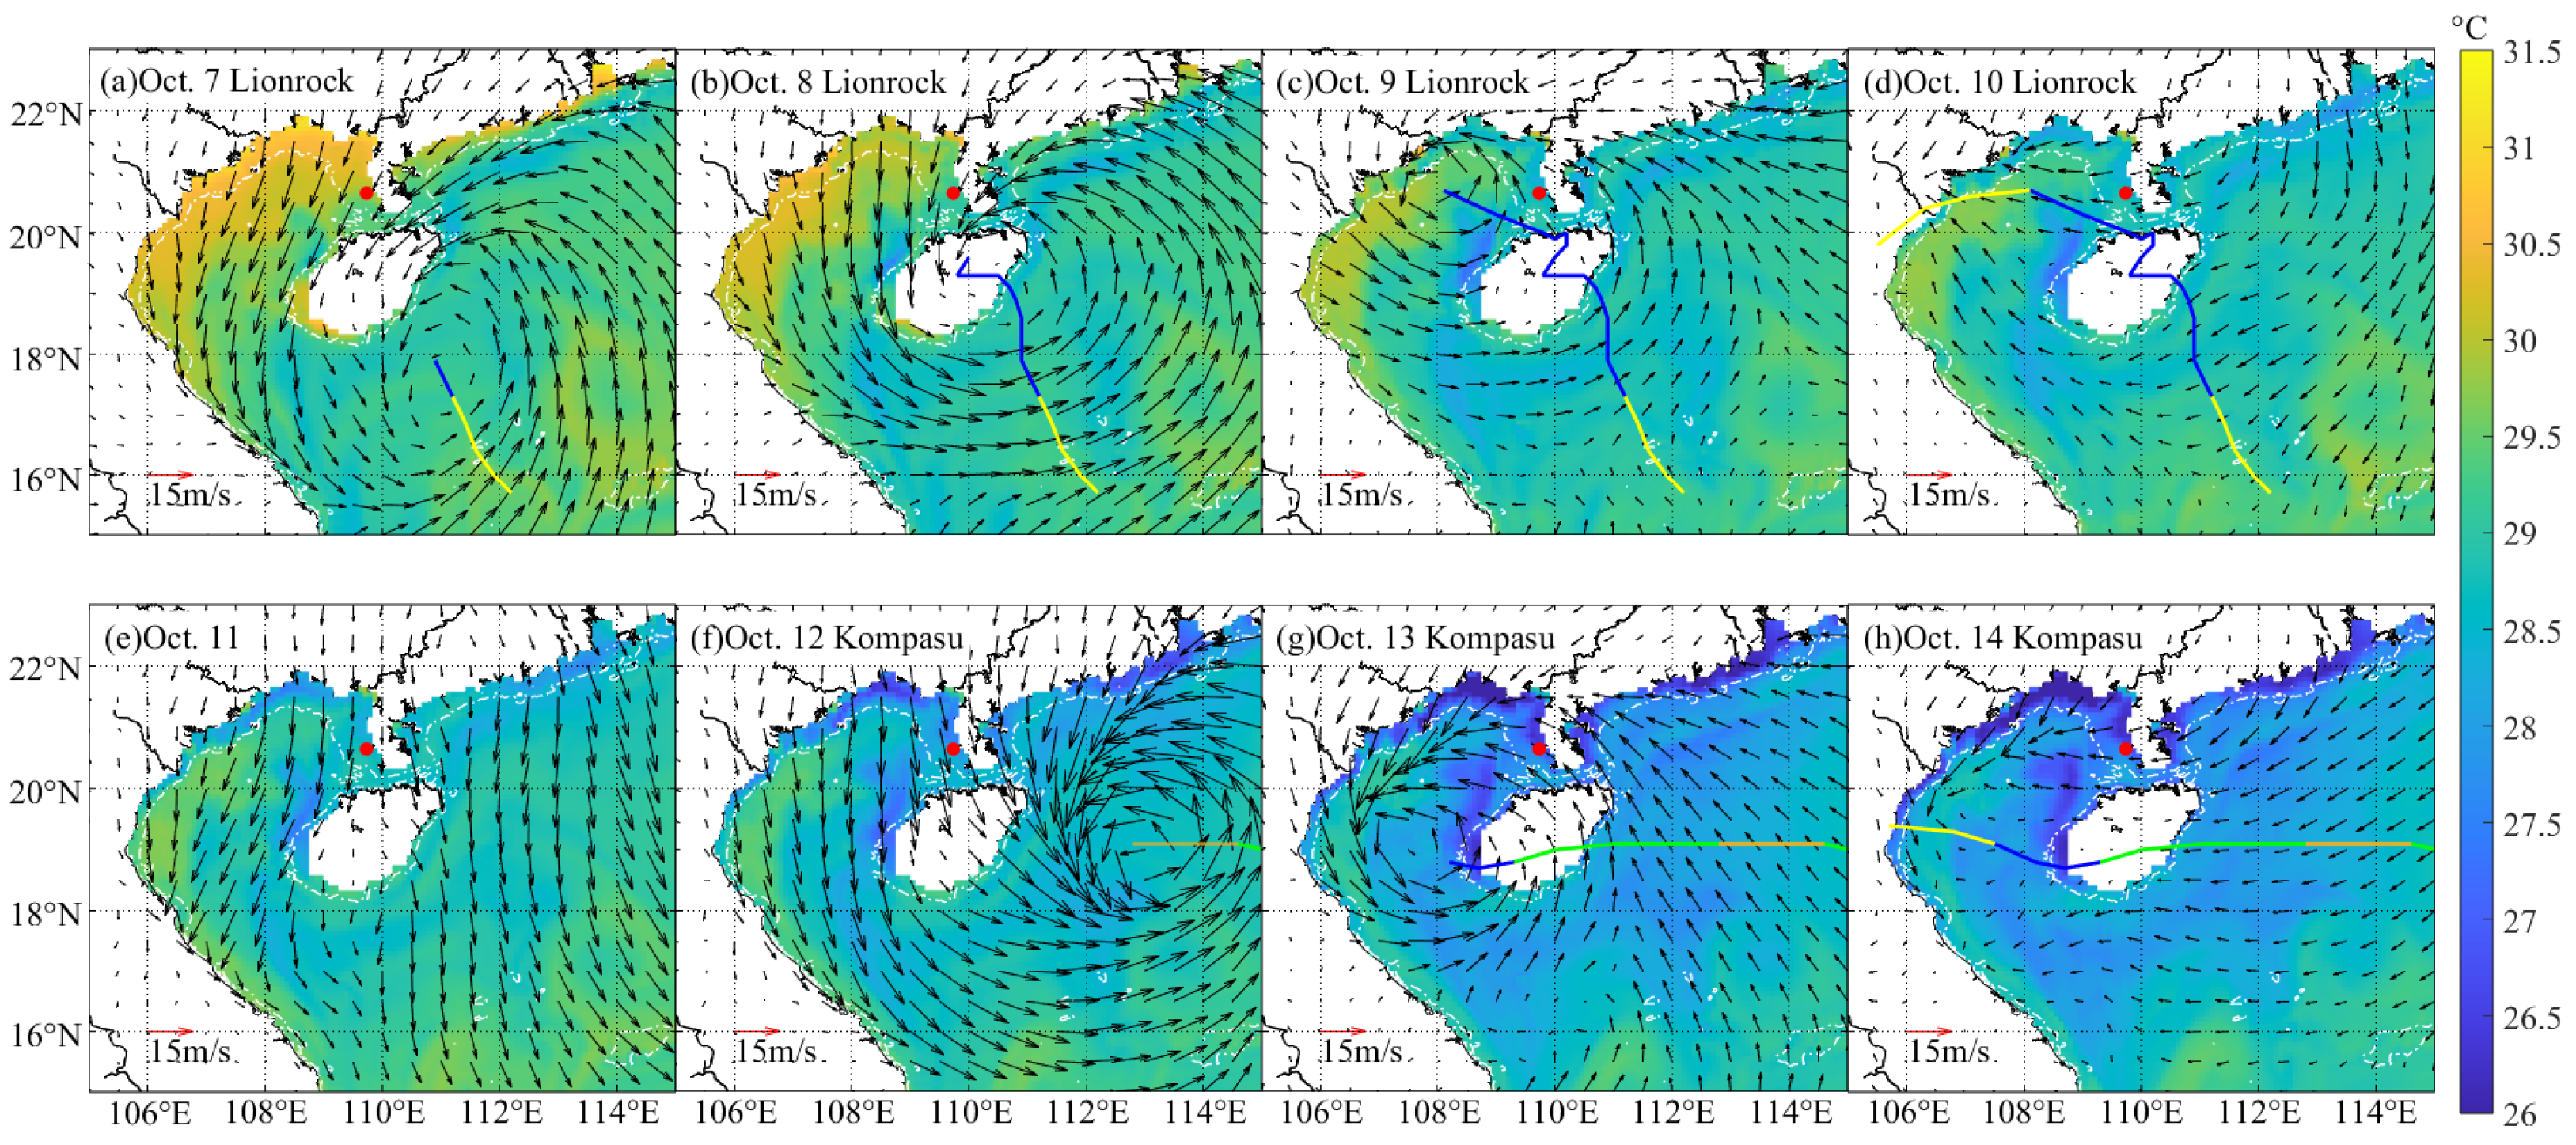
Figure 2 presents the spatial and temporal distribution of the SST and sea surface wind fields in the Beibu Gulf and its neighboring seas during the passage of ‘Lionrock’ and ‘Kompasu’.
On 7 October 2021, the mean SST in the nearshore areas of the northwest and northern of the Beibu Gulf (water depth less than 20 m) was close to 30.5 °C. The following day, ‘Lionrock’ led to wind in the northern Beibu Gulf reaching 13.45 m/s, and the nearshore SST dropped by 1.3 °C (Figure 2b). On the 9th and 10th (Figure 2c,d), the wind direction near the northern area of the Beibu Gulf coast varied, with wind ranging from 12.82 to 17.33 m/s. The temperature continued to drop, showing a trend of spreading from the coast towards the central Beibu Gulf basin (CBGB). Due to ‘Lionrock’, the SST at the buoy station dropped by 2.8 °C, with the Qiongxi upwelling area experiencing the largest drop of 3.2 °C. The CBGB saw an average decrease of 1.6 °C, with the most significant SST decreases occurring on either side of the ‘Lionrock’s track. Along the nearshore area from the Pearl River estuary to Yangjiang, the maximum decrease was 2.7 °C, while the average SST decrease in the regional offshore waters of the northwestern SCS (NWSCS) was 0.7 °C.
On the 11th (Figure 2e), ‘Kompasu’ was positioned east of the Philippines, with little change in the SST in the northern Beibu Gulf. From the 12th to the 14th (Figure 2f–h), northerly wind in the region strengthened to 22.45 m/s (Table 1). Building on the SST cooling of ‘Lionrock’, ‘Kompasu’ further exacerbated the cooling, with the nearshore buoy station in the Beibu Gulf experiencing a temperature drop of 3.0 °C (Table 1), and the maximum cooling in the Qiongxi upwelling region was 1.6 °C. The cooling range in the Beibu Gulf extended from the periphery to the CBGB. The average decrease in the SST in the CBGB was 1.2 °C, with the largest decrease located on the right-hand side of the path of ‘Kompasu’, which is consistent with the characteristics of most TC-induced sea surface cooling. The SST nearshore, from the Pearl River estuary to Yangjiang, saw a maximum decrease of 2.1 °C, and the average drop in offshore waters in the NWSCS was 0.8 °C.
The intense wind stress generated by TCs induces upwelling of colder water from the lower layer, mixing with surface water and resulting in a notable decrease in the SST. Sequential TCs can cause the SST to fall again before it has a chance to recover, resulting in a total drop that is unequal to the sum of the two drops. In the Beibu Gulf, the SST at the nearshore buoy station decreased from 30.0 °C to 25.4 °C, a total decrease of 4.6°C, In the CBGB, it decreased from 30.0 °C to 27.3 °C, a decrease of 2.3 °C. The mean SST in the offshore waters of the NWSCS decreased from 29.5 °C to 28.2 °C, a decrease of 1.3 °C (Table 2).
The nearshore waters of the Beibu Gulf experience a greater magnitude and rapid decrease in SST and a shorter lag time between wind speed and cooling compared with the offshore waters of the CBGB and NWSCS. The lag time between wind speed and cooling in the nearshore waters of the Beibu Gulf is 9~11 h, while in the NWSCS is about 28~29 h (Table 1).

3.2. Nearshore Response

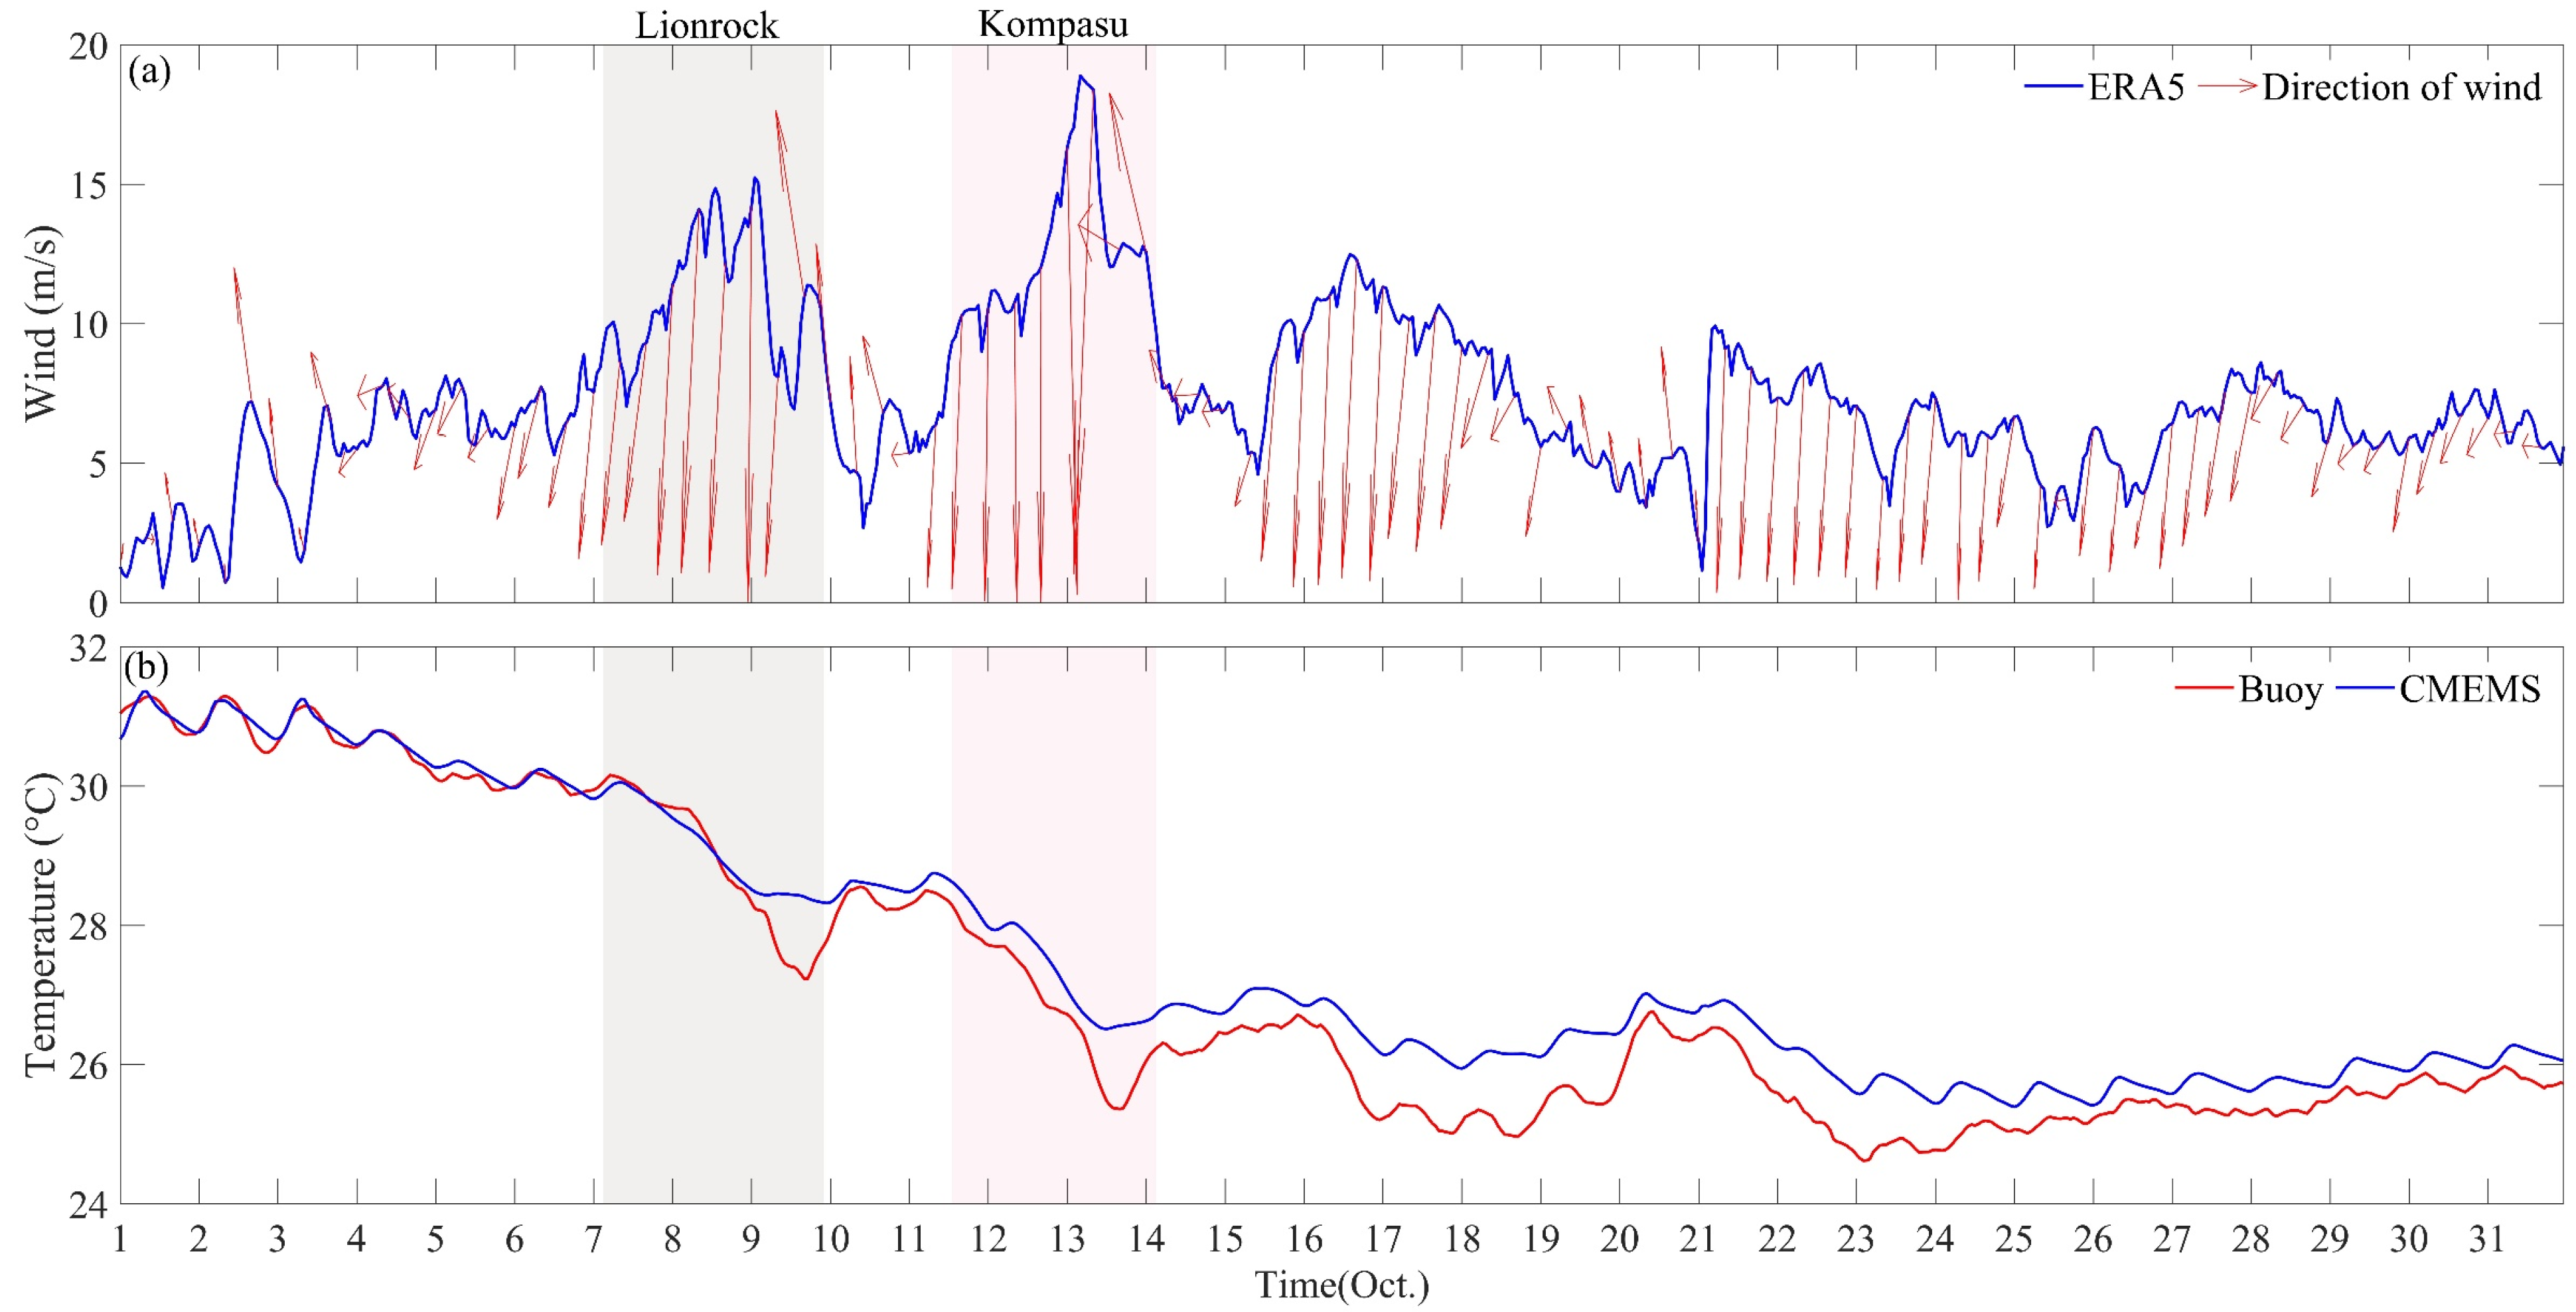
Figure 3 shows the time series of sea surface wind and sea temperature recorded by the buoy during October 2021. From the time series of sea surface wind (Figure 3a) and temperature (Figure 3b) at the buoy observation station, a negative feedback relationship is evident between wind speed and sea temperature, with a correlation coefficient of 0.83 (p < 0.05). The buoy’s measured sea temperature data show consistency with the reanalyzed sea temperature data trends. In nearshore areas, due to satellite measurement accuracy affects the reanalyzed data, resulting in smaller magnitude changes compared to the buoy data.
Before being influenced by ‘Lionrock’, the sea temperature fluctuations at the buoy station remained within 1 °C, with the wind at the station below 9 m/s. At 15:00 on 8 October, ‘Lionrock’ made landfall over Hainan Island and moved erratically over the island. By 01:00 on 9 October, the station recorded a maximum wind of 15.05 m/s. At 02:00 on the 9th, ‘Lionrock’ entered the Beibu Gulf, and the wind direction at the buoy station shifted from northerly to southerly, with winds decreasing to 9.7 m/s from their peak. By 12:00 on the 9th, the sea temperature at the buoy station dropped to 27.2 °C, with a maximum decrease of 2.8 °C, which lagged the peak wind speed by 11 h. From 10 to 11 October at 13:00, as ‘Lionrock’ moved away from the station, the wind at the station decreased and gradually shifted to southeasterly winds. The temperature at the buoy station rose to 28.4 °C, but after 13:00, influenced by ‘Kompasu’, the wind exceeded 9.12 m/s, and the sea temperature began to drop. By 03:00 on the 13th, the station recorded a maximum wind speed of 18.88 m/s. As the TC’s center moved closer, the wind gradually weakened and shifted to a northeasterly direction. By 12:00, the sea temperature had dropped to 25.4 °C, a maximum decrease of 3.0 °C, which lagged the peak wind by 9 h. At 15:00, ‘Kompasu’ entered the Beibu Gulf, bringing southwest winds to the station, which then gradually decreased. On the 14th, ‘Kompasu’ made landfall over eastern Vietnam.
The buoy observation station was impacted by ‘Lionrock’ for 67 h, during which the average wind speed was 11.01 m/s. Similarly, the average wind speed during the impact of ‘Kompasu’, which lasted for 62 h, was 12.62 m/s. The cumulative impact of these tropical cyclones lowered the temperature of the observation station by −4.6°C.
Two days after the TC dissipated, the wind speed at the buoy station increased to 11.8 m/s, and the SST dropped from 26.6 °C to 25.0 °C, a decrease of 1.6 °C. On the 23rd day, the maximum wind speed was 9.92 m/s, and the SST at the buoy station dropped from 26.5 °C to 24.6 °C, a decrease of 1.9 °C. The SST at the buoy station fluctuated up and down at 25.4 °C after the disappearance of the cold air.

3.3. Sea Surface Temperature Change Mechanism

3.3.1. Heat Flux at the Sea Surface

The maintenance and development of TCs rely on the energy and water vapor provided by heat flux [54]. Therefore, the study of sea surface heat flux is of great significance for the ocean’s response.
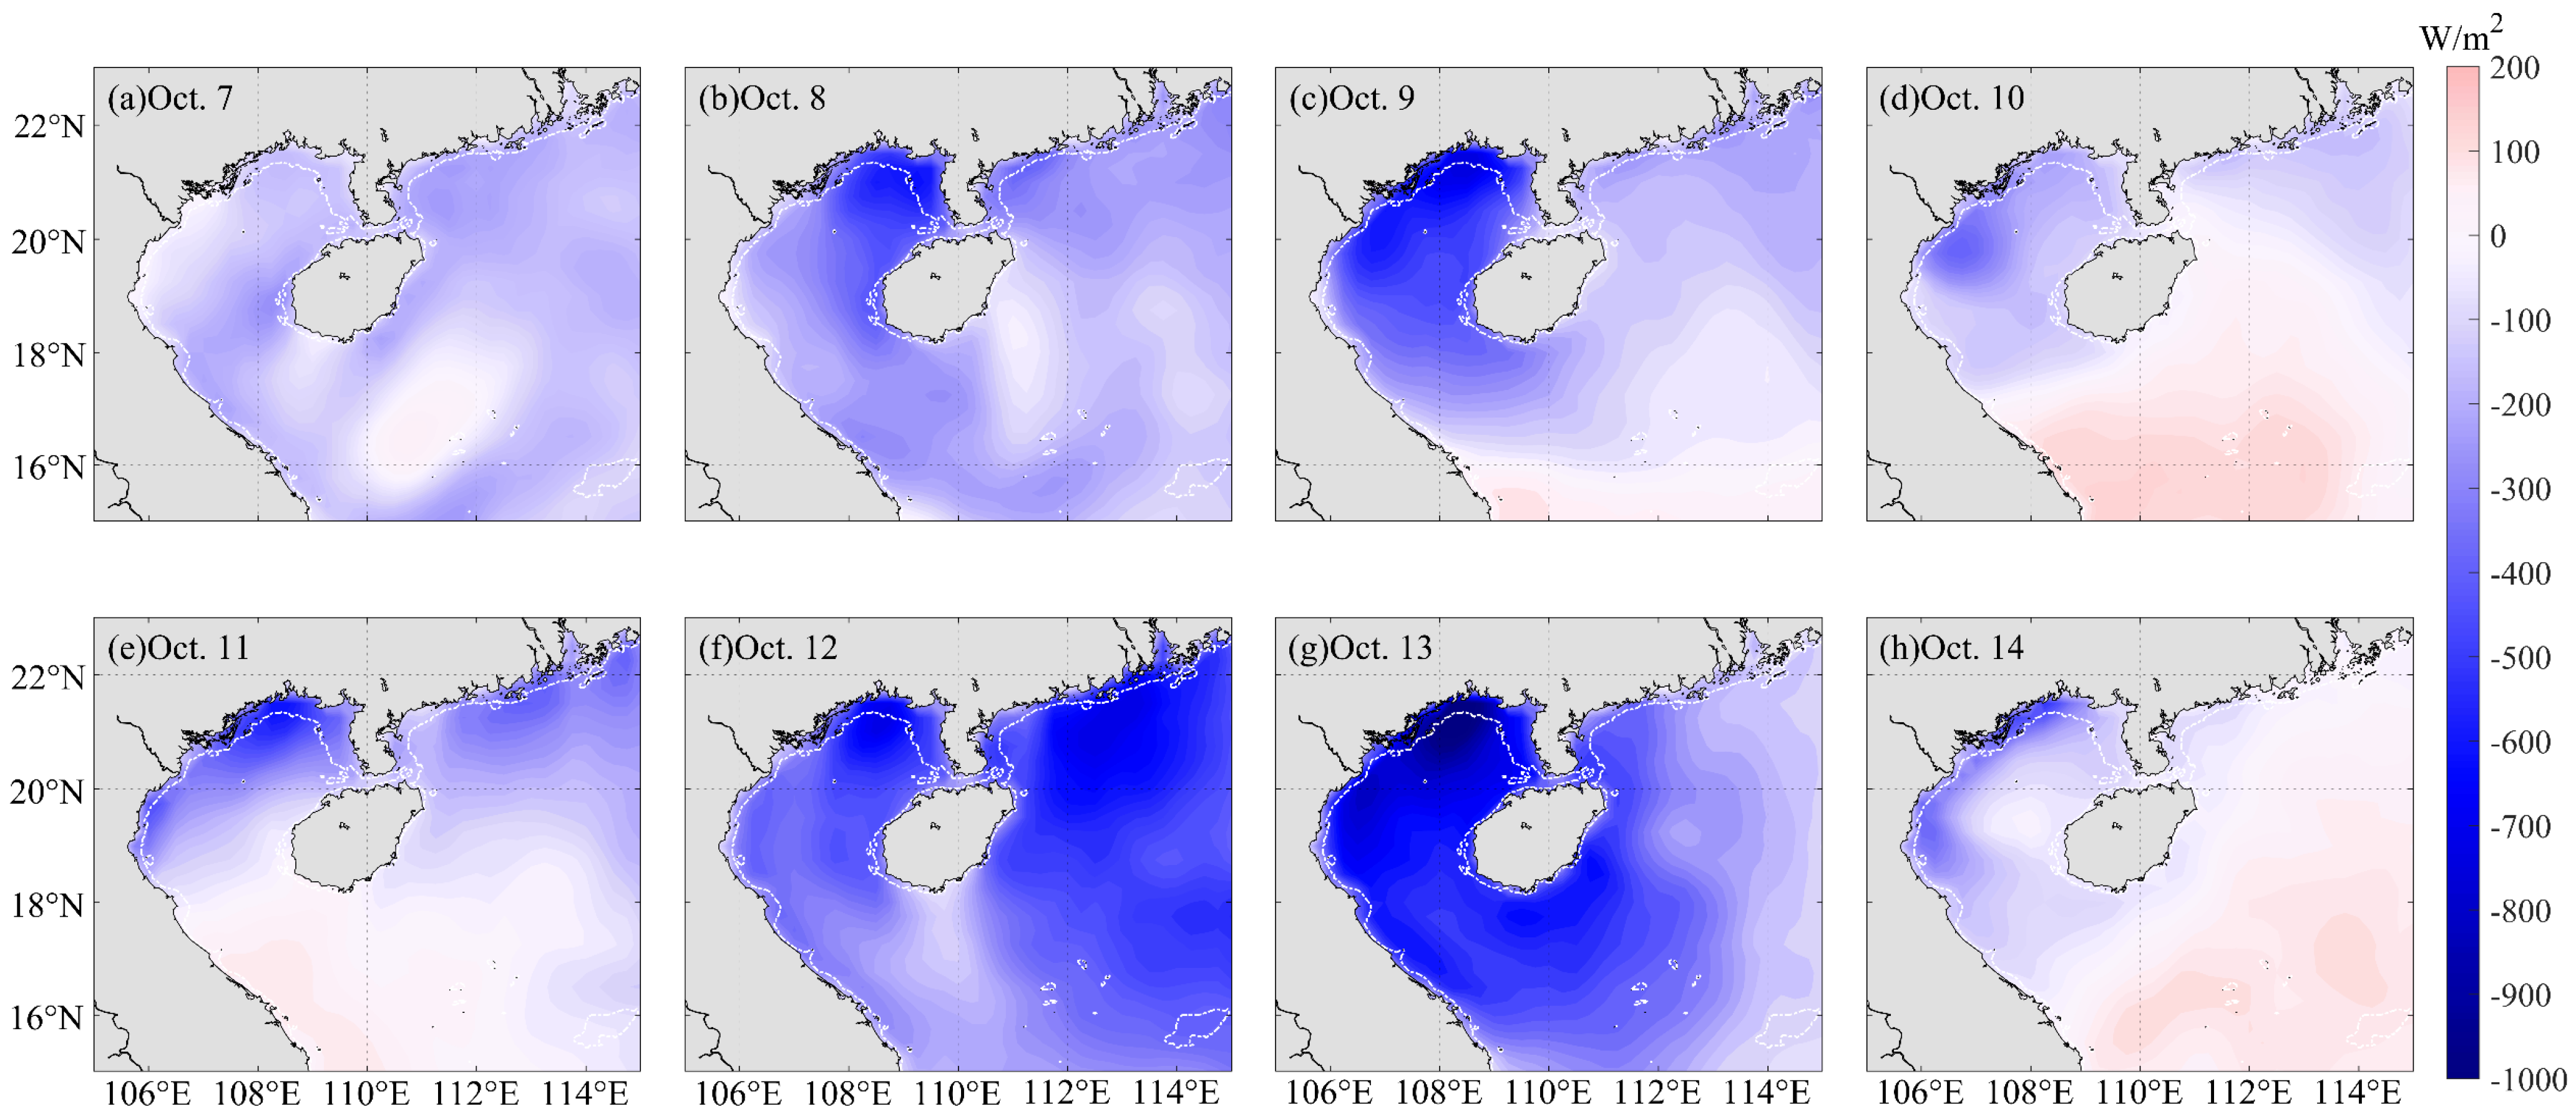
The spatial and temporal distribution of sea surface heat flux during the ‘Lionrock’ and ‘Kompasu’ periods is shown in Figure 4, where positive values represent heat gain and negative values represent heat loss. On 8–9 and 12–13 October, the nearshore waters of the northern part of the Beibu Gulf experienced the maximum heat loss, reaching −736 W/m2 and −1039 W/m2, respectively. During the ‘Lionrock’ period and before ‘Kompasu’ landed on Hainan Island, the center of heat loss in the Beibu Gulf was in the nearshore area. Following ‘Kompasu’ landfall, the center of heat loss remained in the nearshore region. Examining the distribution of the daily average heat loss on the sea surface in Figure 4 reveals that the main concentration of heat loss was in the nearshore waters of the northern Beibu Gulf, with a rightward bias of the heat loss.
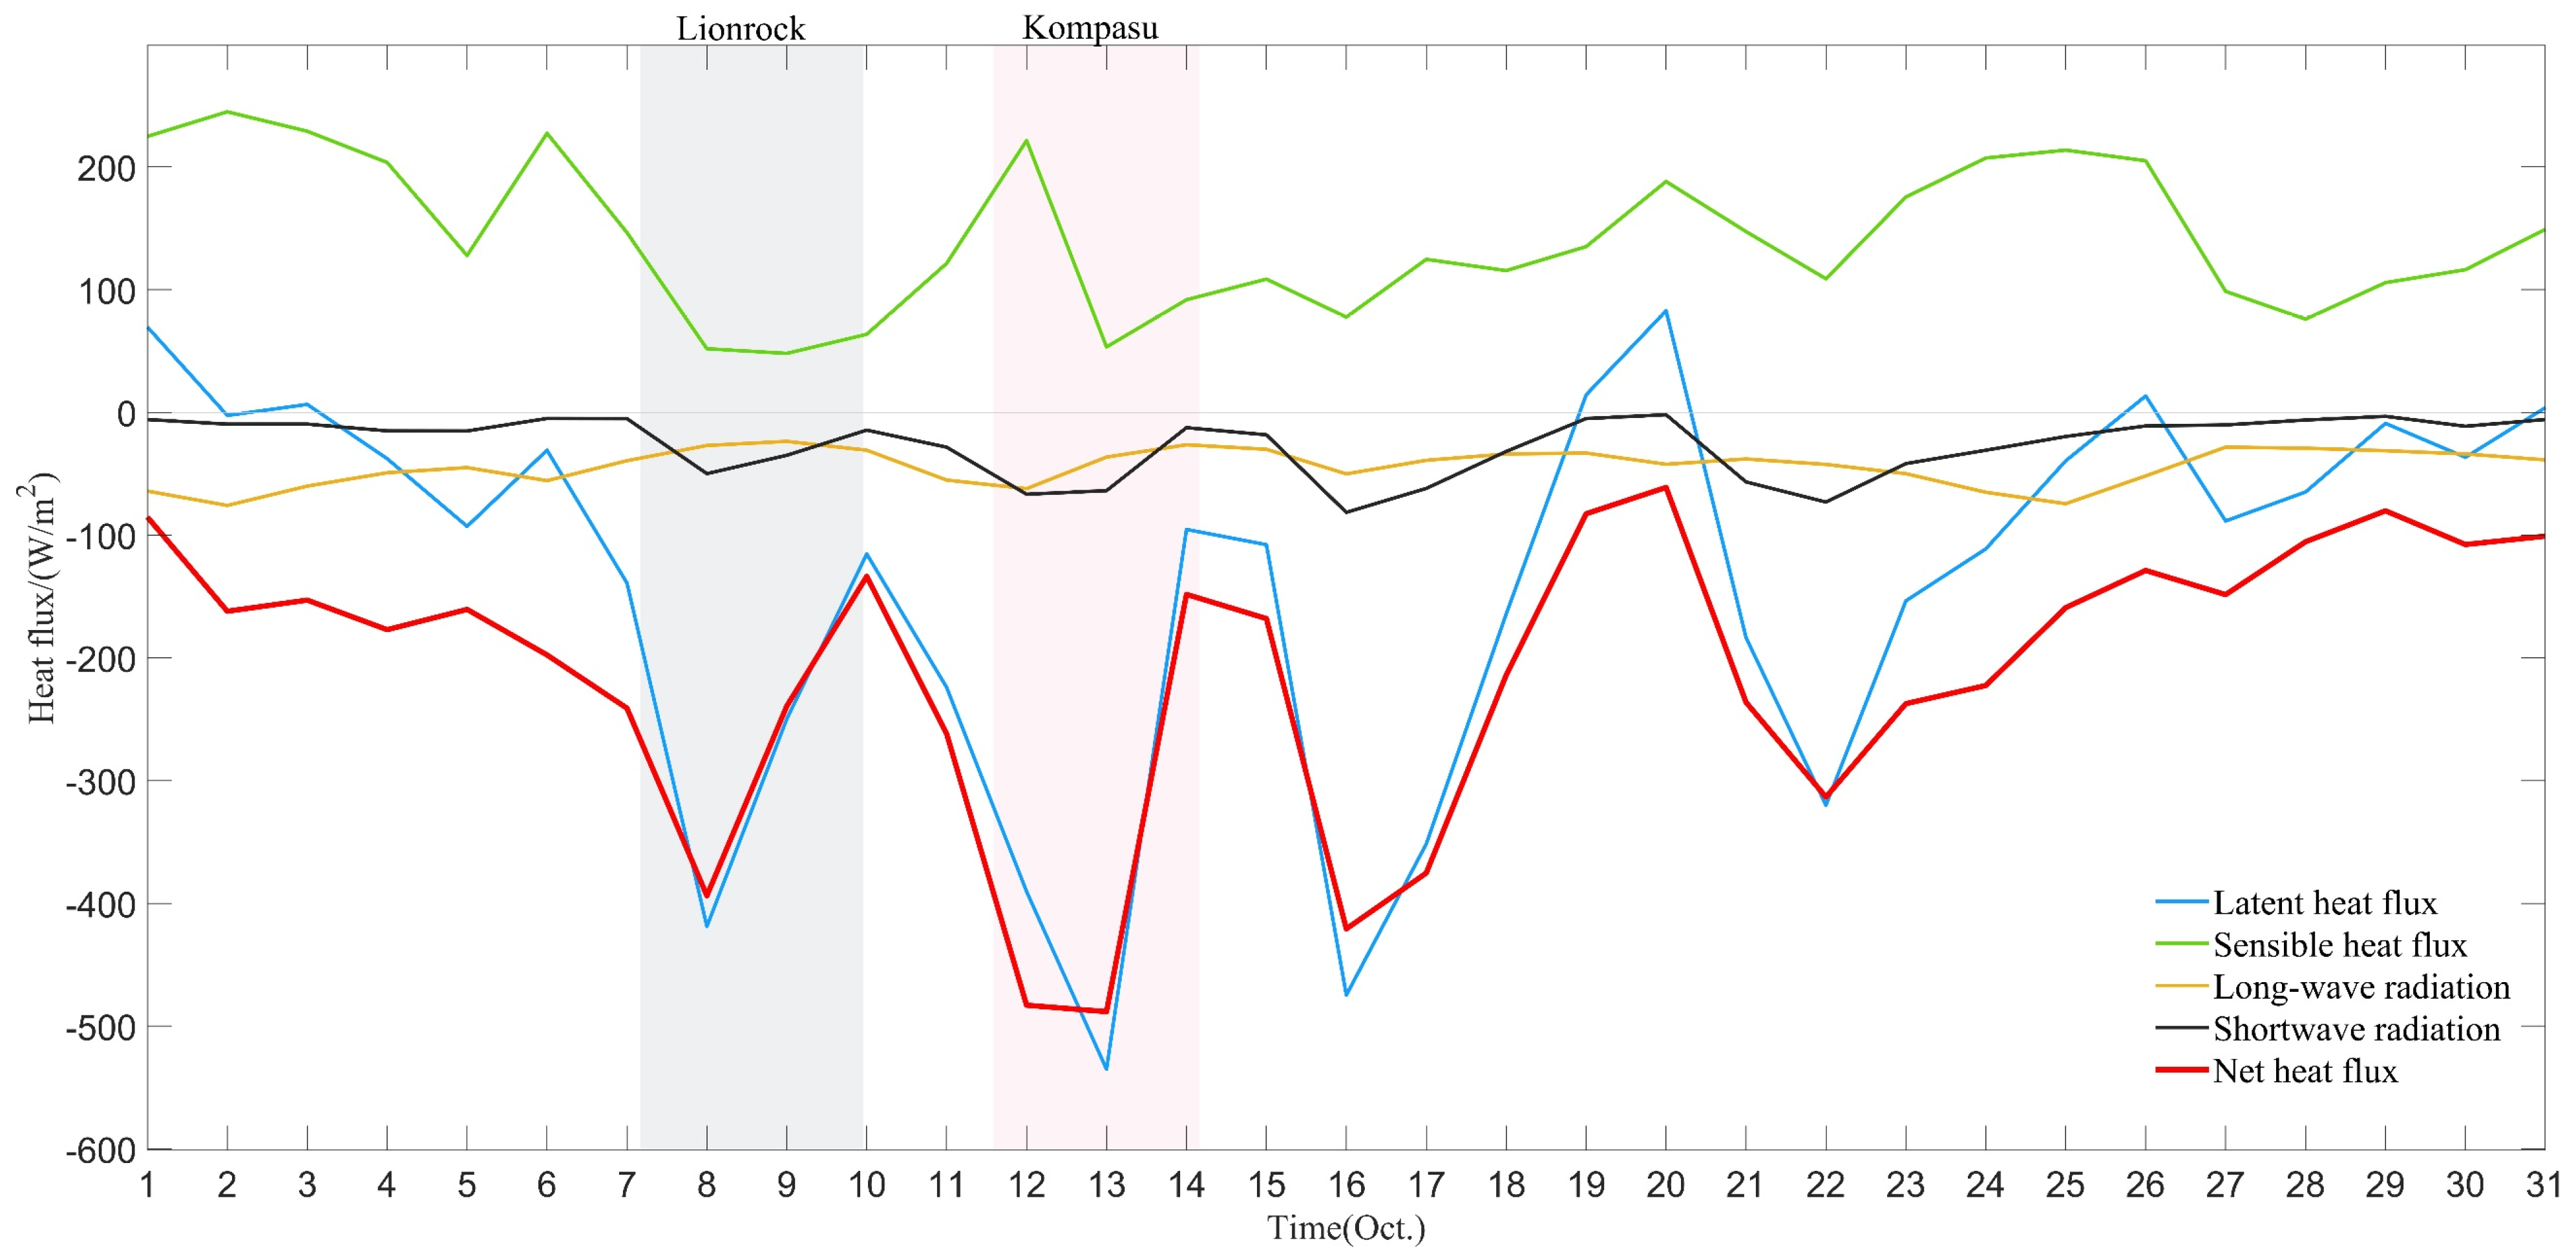
Figure 5 displays the time series of each heat flux component at the Beibu Gulf buoy station. The figure reveals four major heat loss events at the station in October 2021. From the 7th to the 14th, two major heat loss events occurred, peaking at −418 W/m2 and −535 W/m2, respectively. Analysis of the various components shows that latent heat flux and shortwave radiation play a major role in the change of net heat flux at the sea surface, which is consistent with the results of previous studies [55,56]. The daily average values of sensible heat flux and longwave radiation flux ranged from −85 to −2 W/m2, and the changing trend of shortwave radiation and latent heat flux was similar. The decrease in shortwave radiation due to ‘Lionrock’s formation and development indicates a reduction in the amount of radiation heat received in the region. ‘Lionrock’ moved away and ‘Kompasu’ did not enter the SCS, shortwave radiation initially increased but then decreased again as ‘Kompasu’ drew near. At the same time, the overall latent heat flux showed an increasing trend in the opposite direction, indicating that the passage of TC led to an increase in water vapor evaporation in the region. The evaporation process requires the heat absorption of from the sea surface, causing heat loss at the sea surface, resulting in a decrease in the SST and causing rainfall.
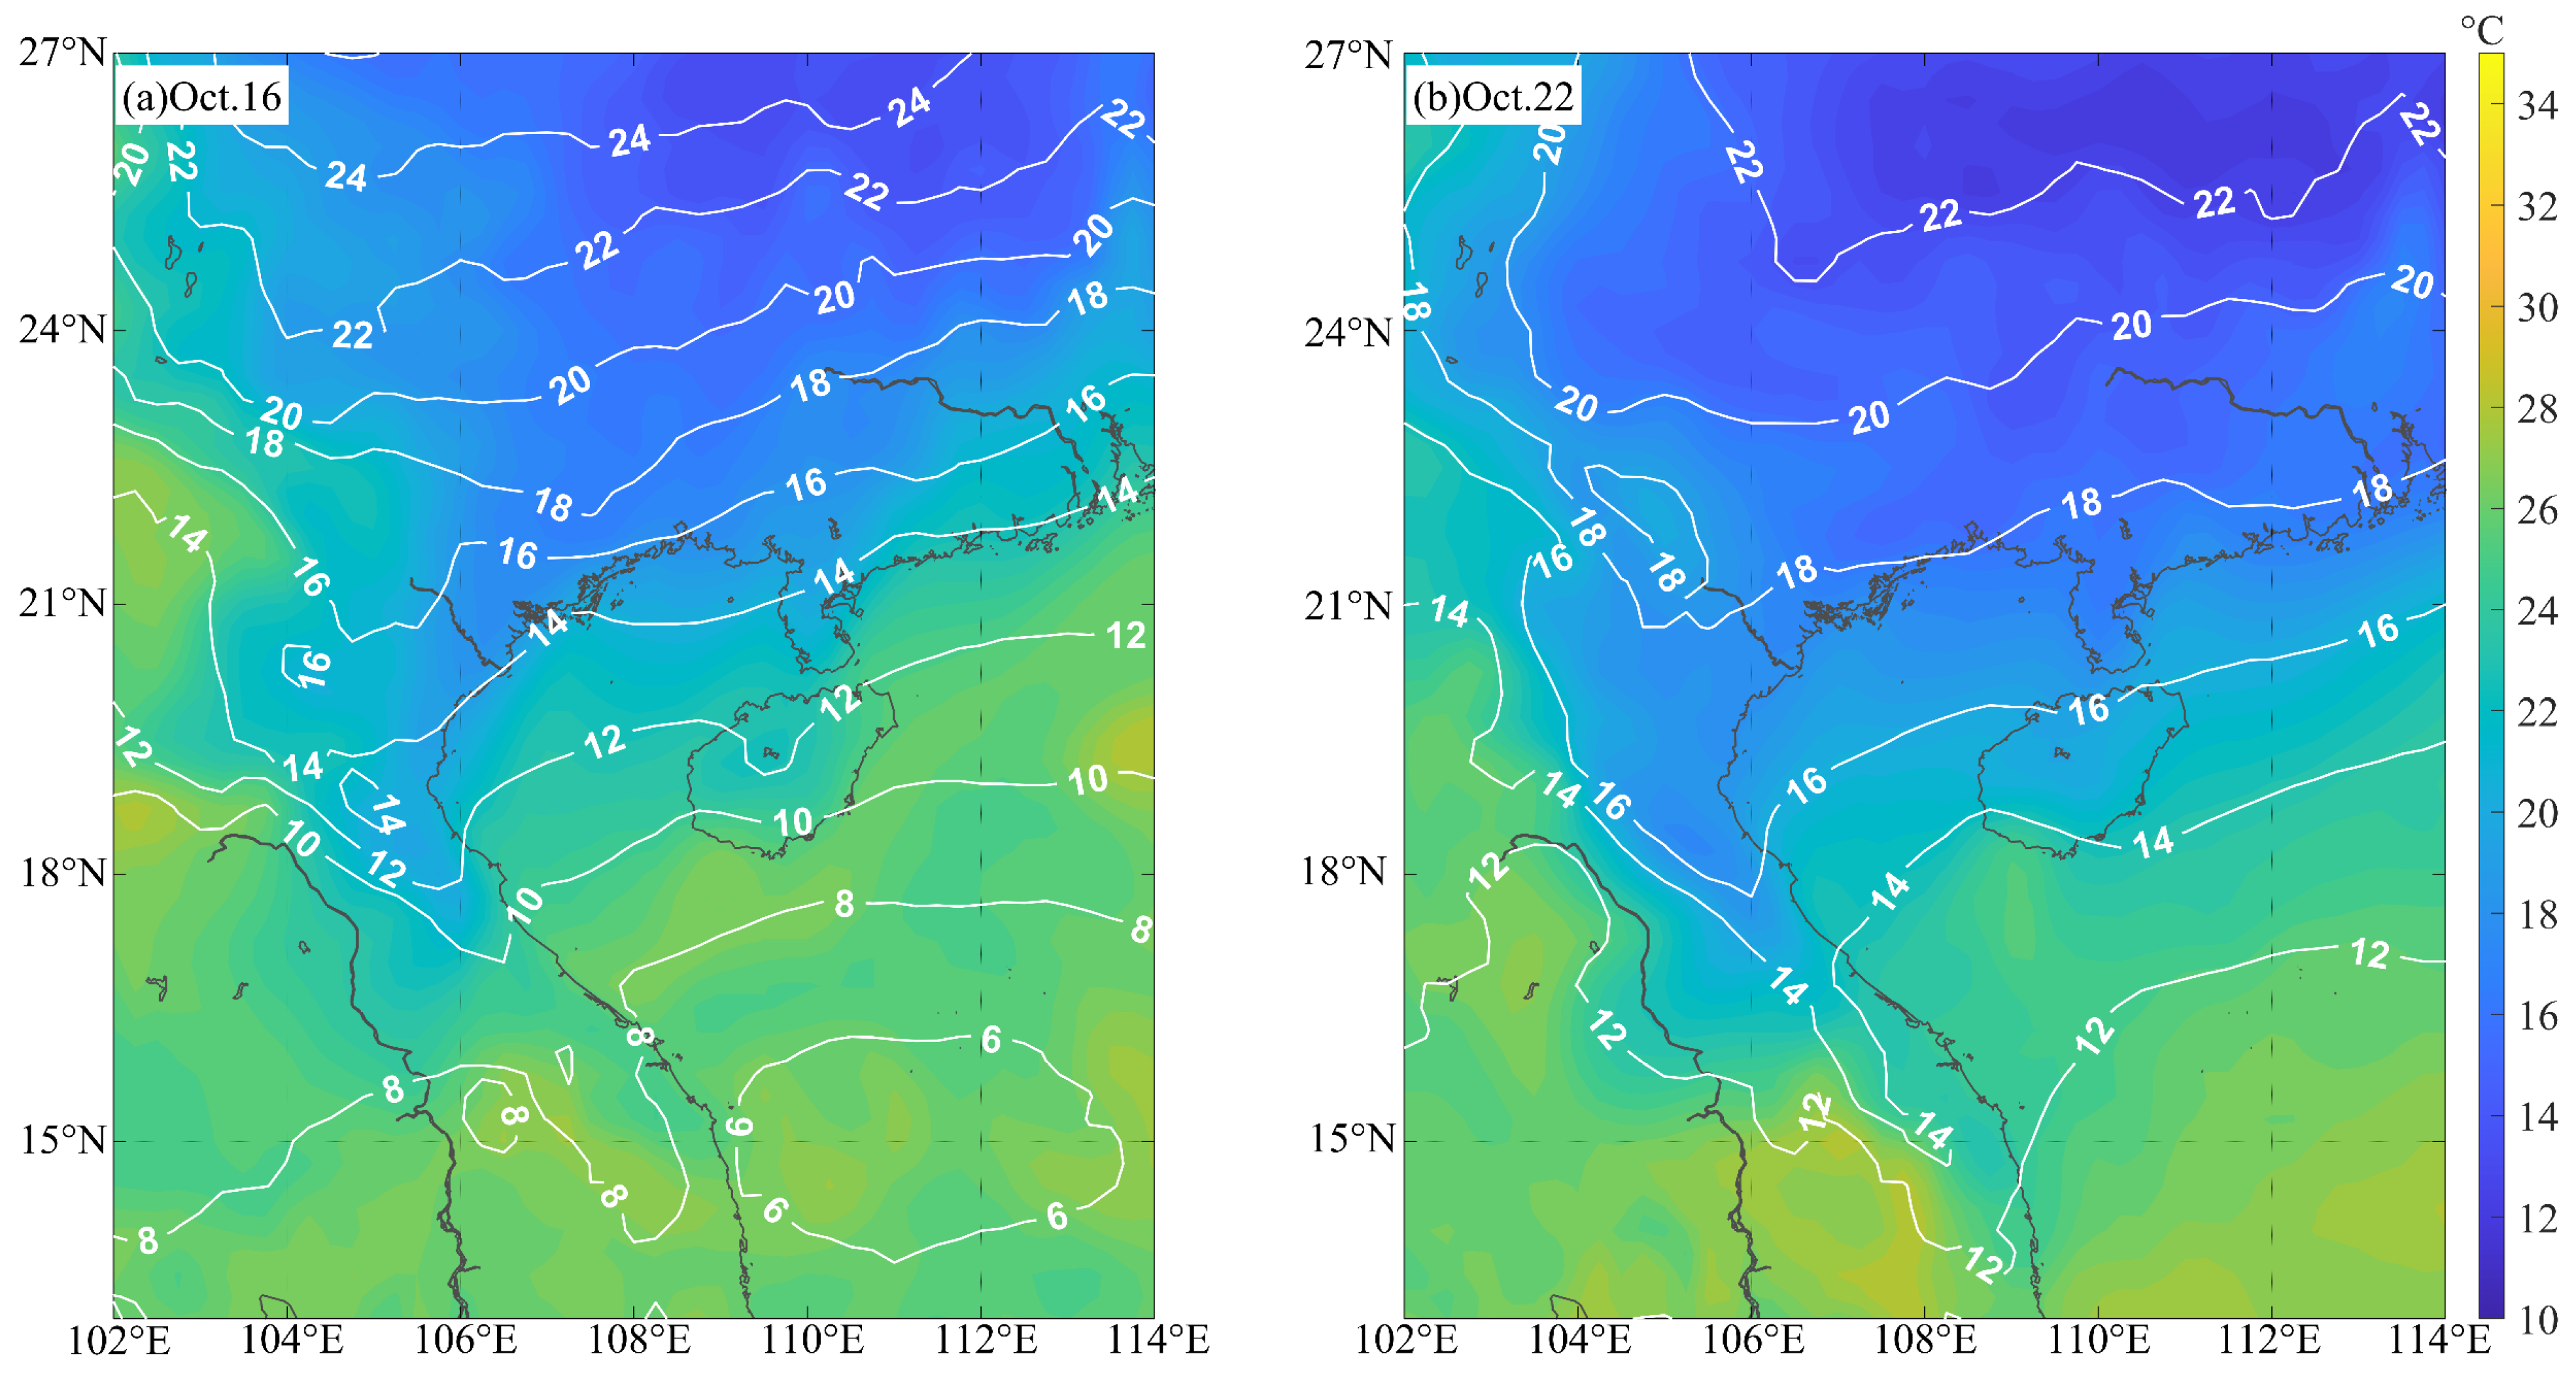
From the 14th to the 16th, the buoy station remained in a state of heat loss, which intensified from −95 W/m2 to −474 W/m2, marking the occurrence of the third major heat loss event. At the same time, the longwave radiation received at the buoy station was relatively stable at around 100 W/m2, due to the blocking effect of precipitation and cloud cover. This was because cold air from the north moved southward, leading to an increase in the pressure gradient in the northern part of the Beibu Gulf, mainly resulting in northerly winds. Meanwhile, there was a low-pressure center in the western part of the SCS (Figure 6a), and the combined action of cold air and the low-pressure system caused the SST along the coast of the Beibu Gulf to drop by 1.6 °C on the 16th, with the SWH at the station rising to 0.82 m (Table 2). As the low-pressure center dissipated and the cloud cover decreased, shortwave radiation increased. The shift of the low-pressure center to the northwest in the western South China Sea resulted in southeasterly wind at the station from the 19th to the 20th, transitioning the region into an overall heat gain state. From the 20th to the 22nd, another round of cold air arrived, leading to an increase in the pressure gradient in the Beibu Gulf and surrounding areas (Figure 6b), intensified wind at the station, and prompting a swift shift from southeasterly to northerly winds. As a result, the SST dropped, and with the season transition, the station temperature remained at around 25.4 °C (Figure 3).

3.3.2. Ekman Pumping Rate

Previous studies have shown that although sea surface heat flux is one of the reasons for the decrease in the SST caused by TCs, its contribution is only about 10%. The main reason for the decrease in the SST is the strong wind-induced water upwelling and mixing caused by TCs [21,57].
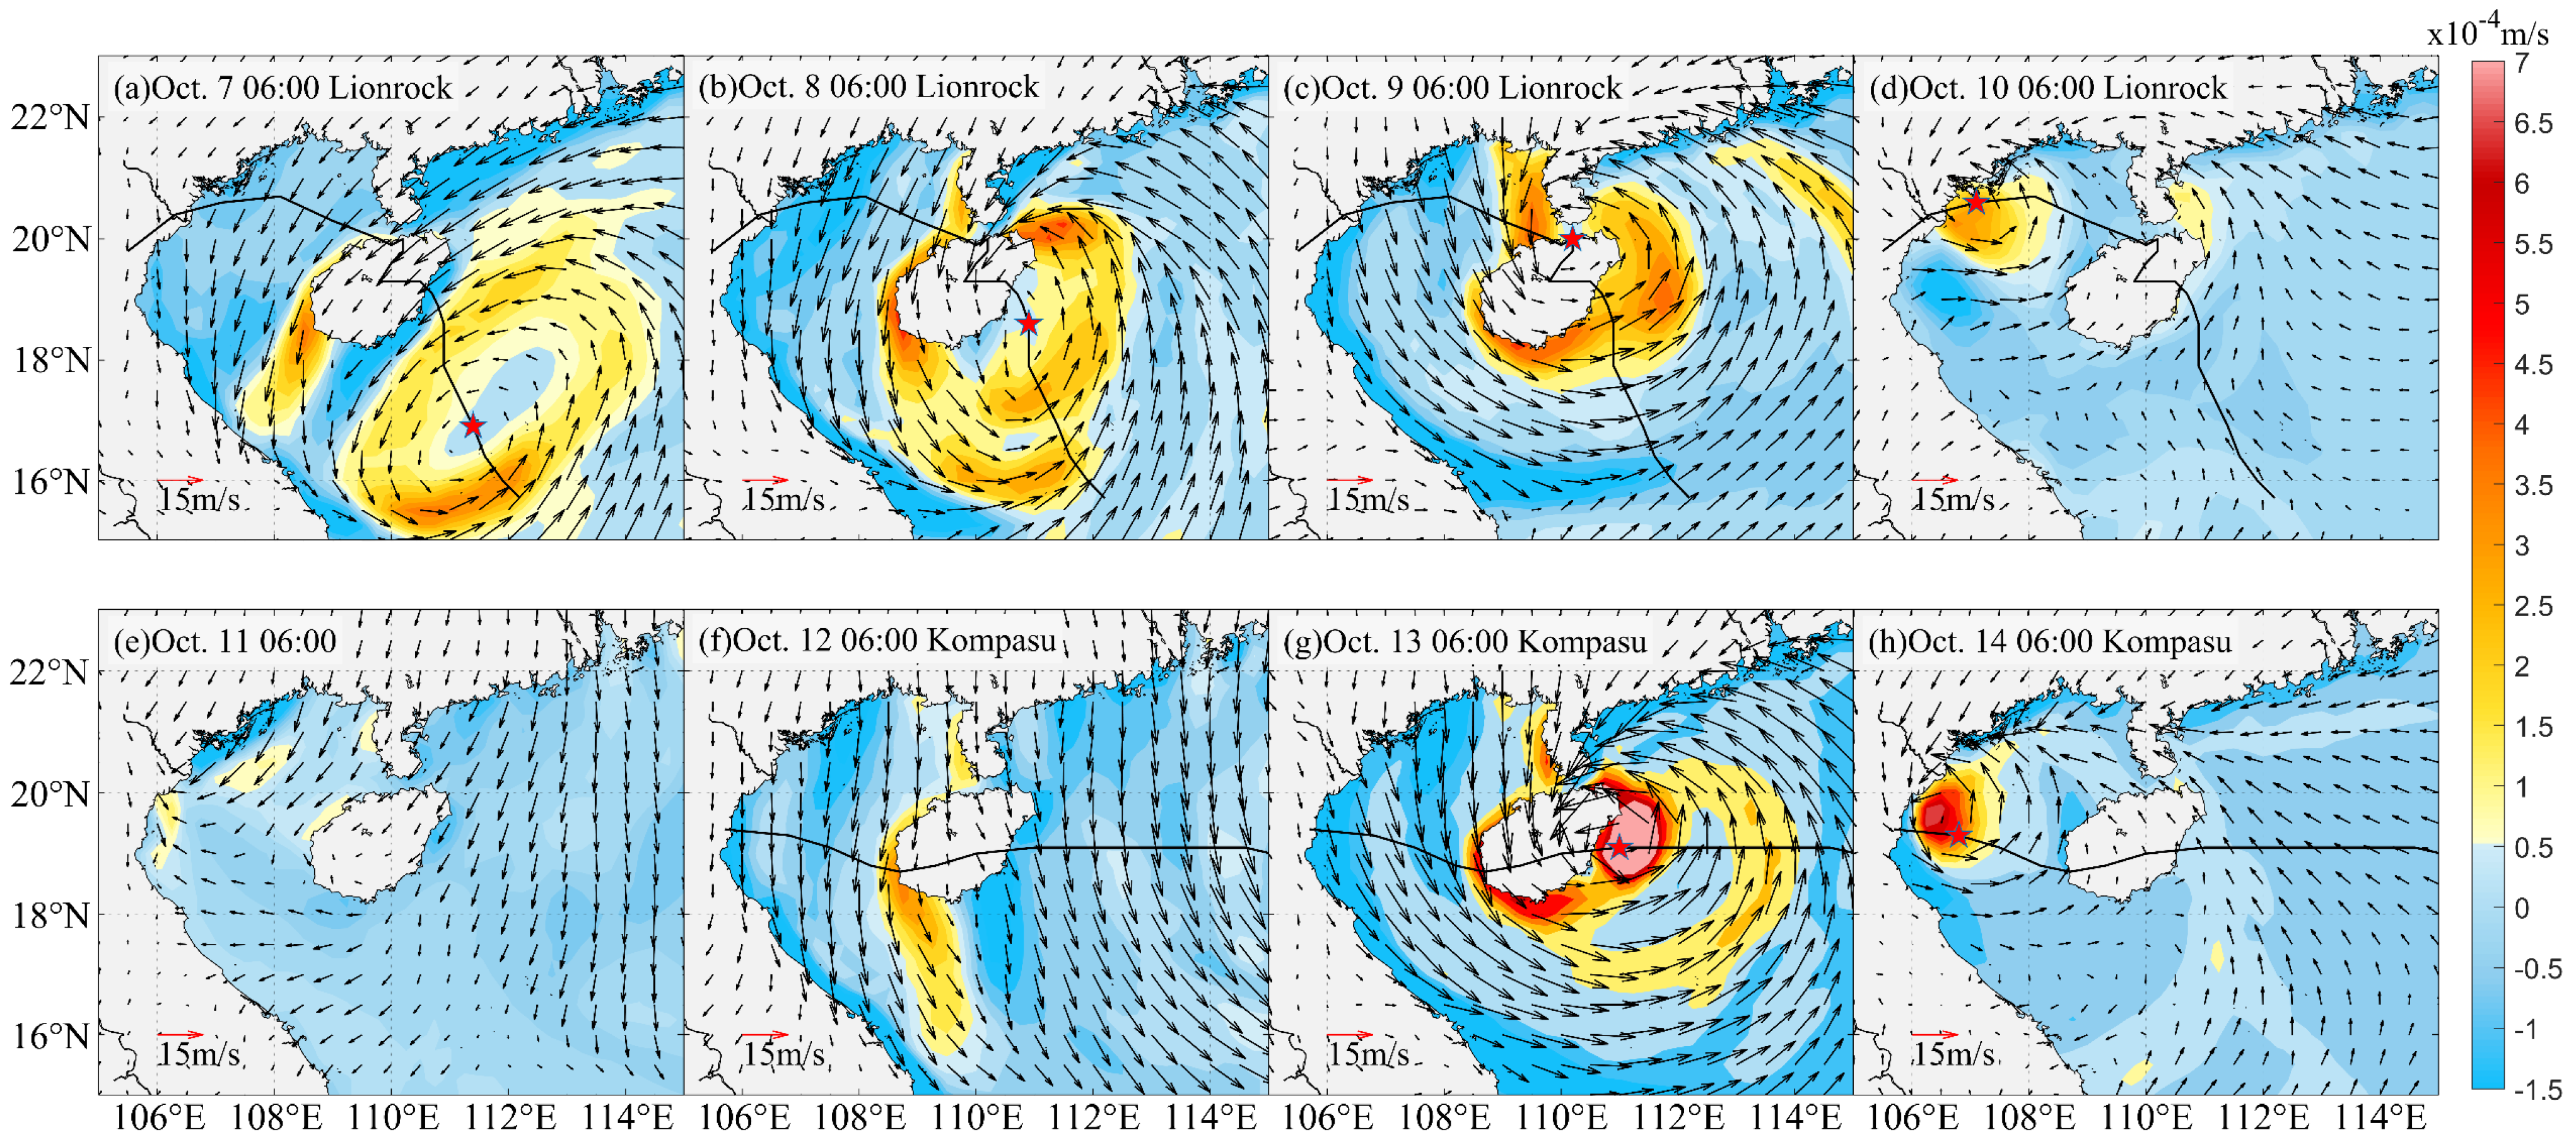
At 6:00 on 8 October (Figure 7b), the marginal sea area of Hainan Island was influenced by ‘Lionrock’ with an upward pumping rate of about 1.5~3 × 10⁻⁴ m/s. As ‘Lionrock’ made landfall and entered the Beibu Gulf, the EPV in the northern part of the gulf peaked at 4 × 10⁻⁴ m/s. ‘Kompasu’ passing through the CBGB let to the maximum EPV of 5.8 × 10⁻⁴ m/s. The overall spatiotemporal distribution showed the Ekman pumping effect on the right-hand side of the TC’s moving path was more significant than on the left, to some extent influenced by the asymmetric structure of the TC [58]. The Ekman pumping action causes the vertical movement of seawater, leading to the upwelling of cold water at the base of the mixed layer [59], which in turn reduces the SST.
Since the Ekman vertical velocity is less than the speed of movement of the TC, the wind-induced vertical mixing will lag behind the TC’s passage by 2–3 days [60]. However, in relatively shallow Beibu Gulf, the temperature changes induced by TCs exhibit a shorter lag time behind the peak wind. The maximum cooling of the sea surface caused by the vertical mixing of ‘Lionrock’ lagged behind the peak wind by 11 h, and the maximum cooling caused by the vertical mixing of ‘Kompasu’ lagged behind the peak wind by 9 h.

4. Effective Wave Height Response

4.1. Offshore Response

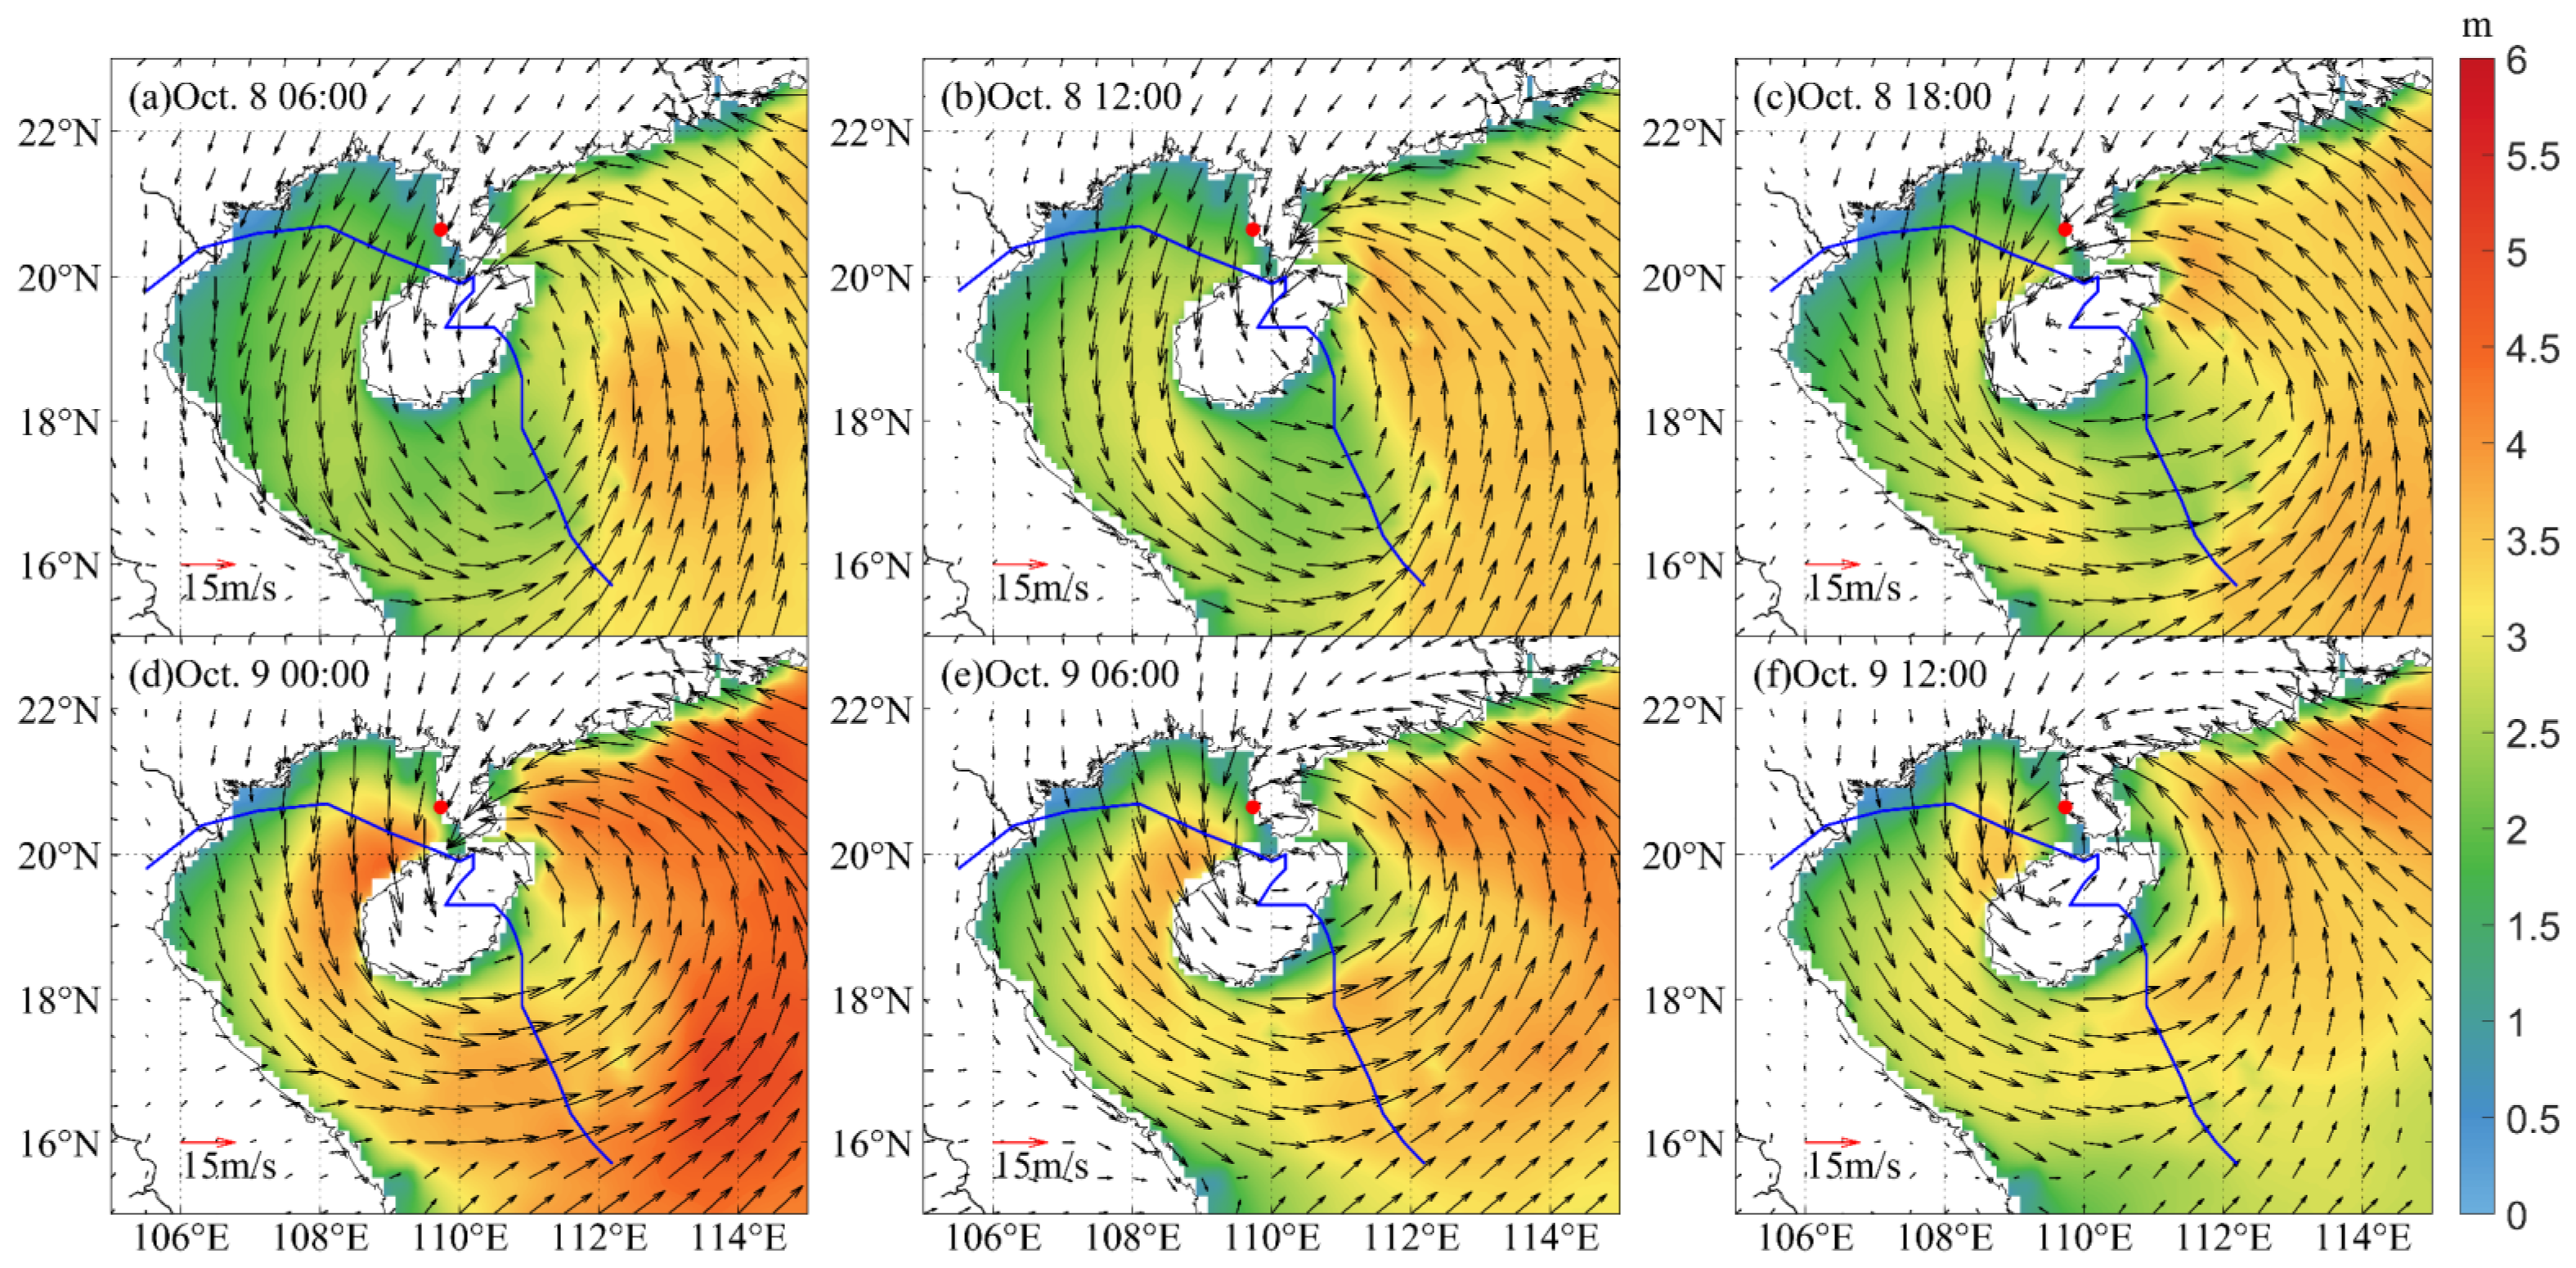
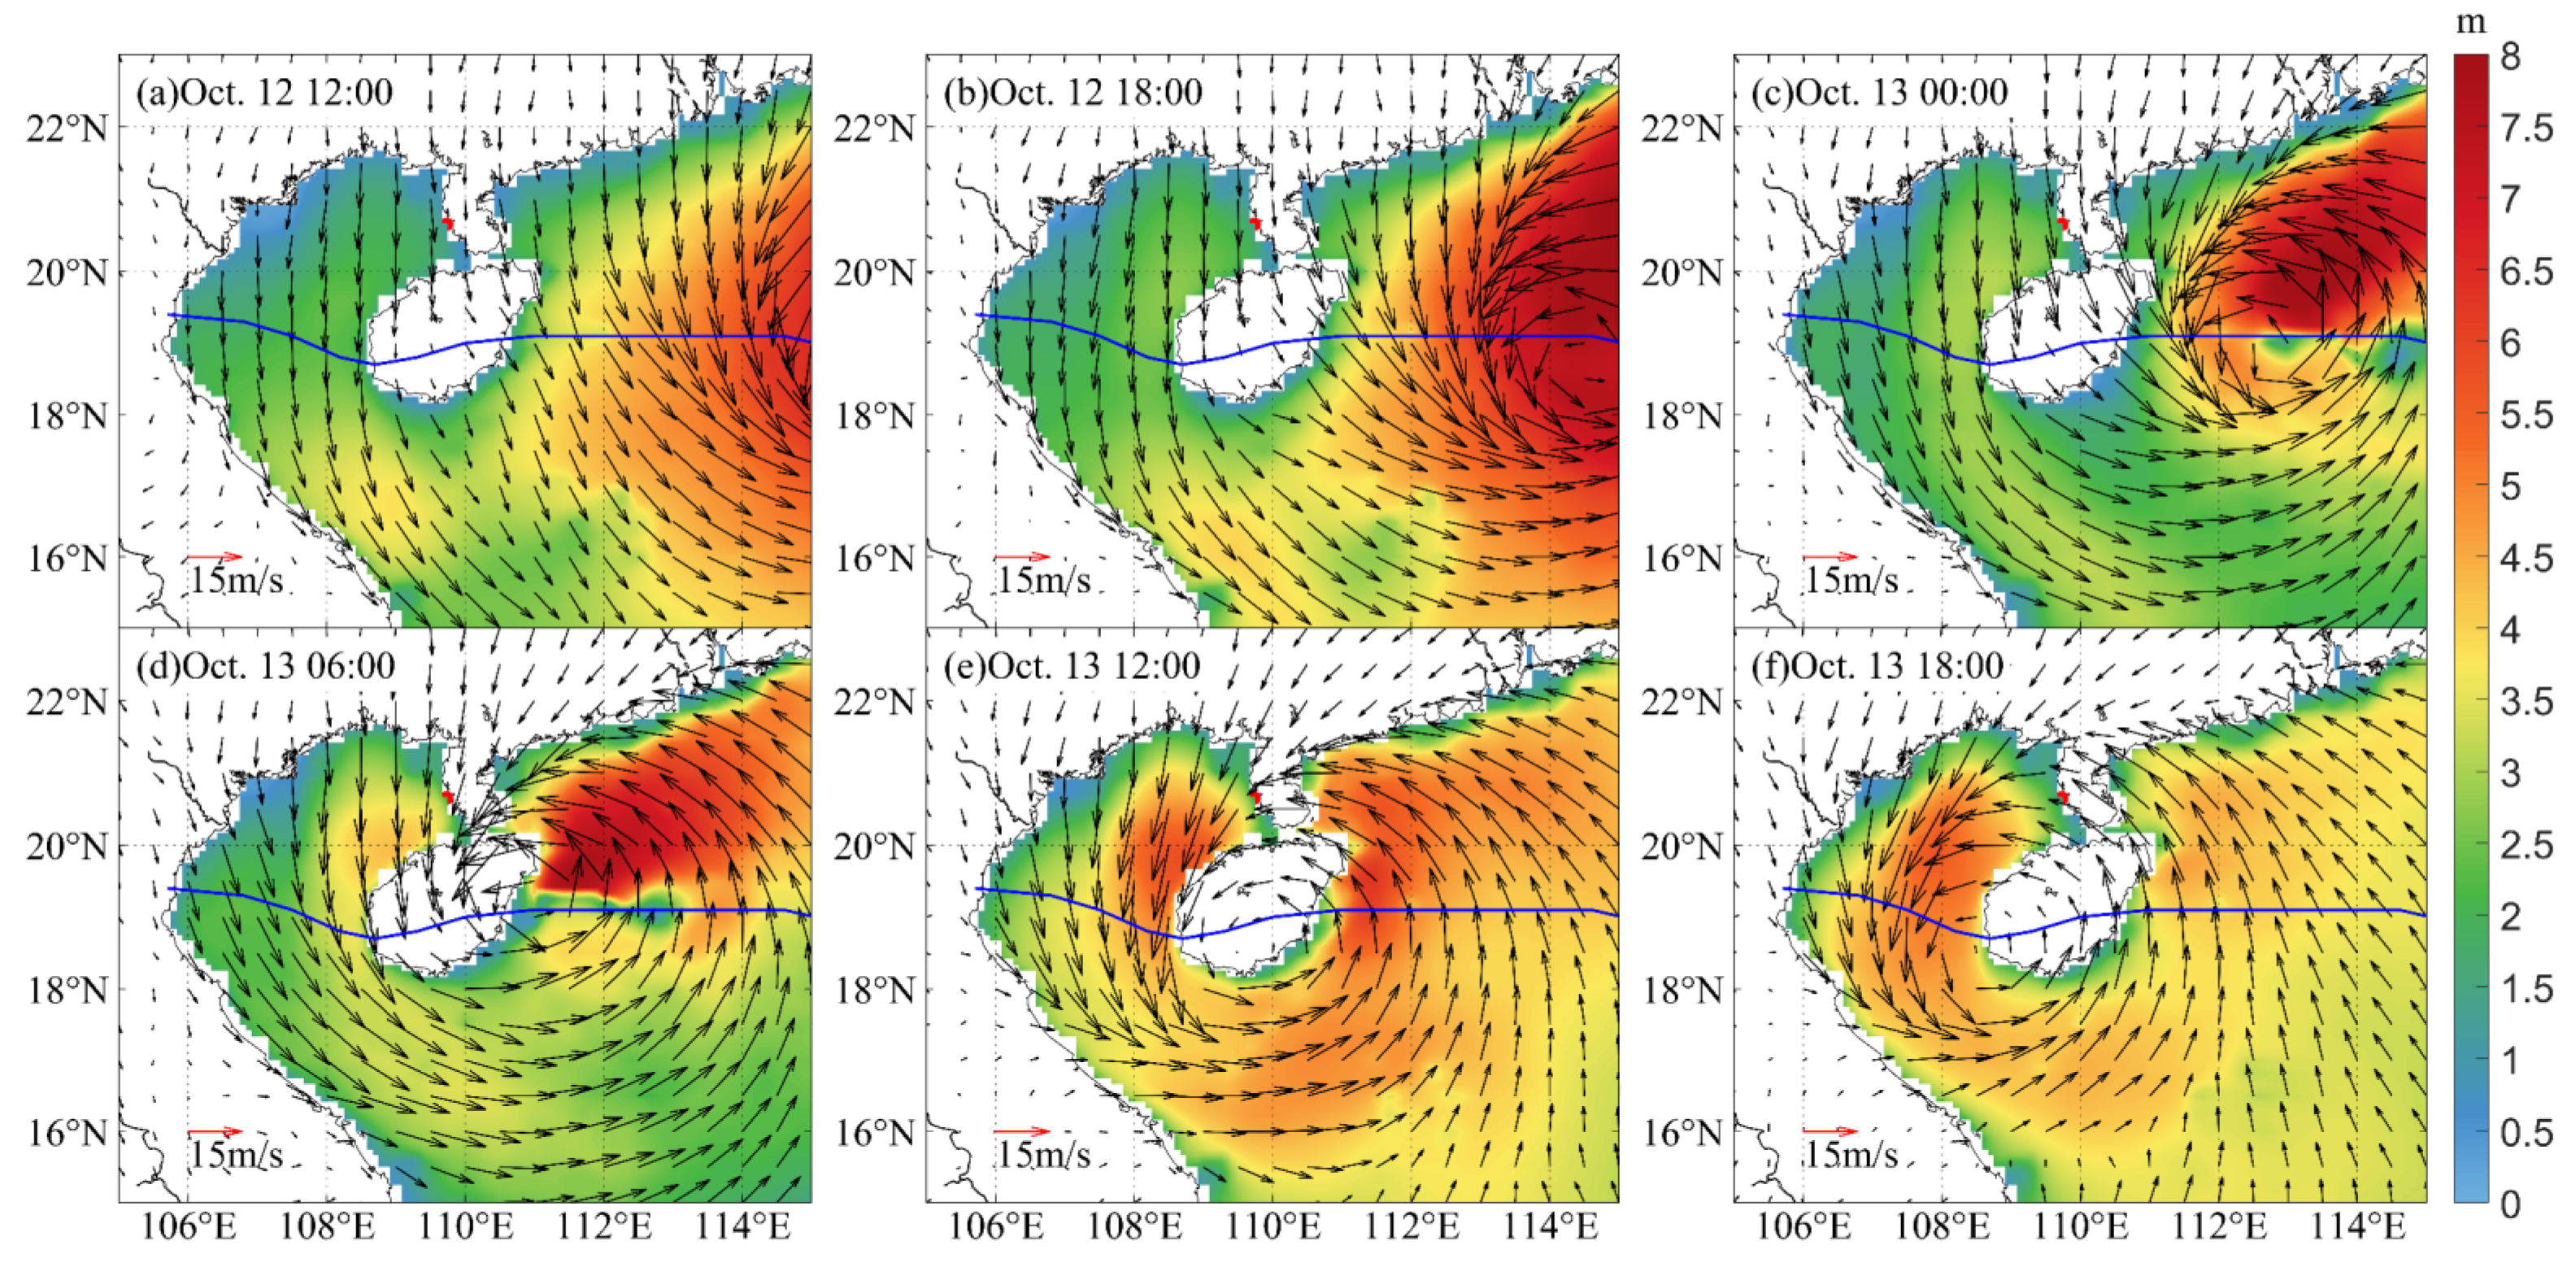
The SWH in the NW SCS during the processes of ‘Lionrock’ and ‘Kompasu’ is shown in Figure 8 and Figure 9. These figures reveal that the SWH at the sea surface exhibits the characteristic of a central low with higher wave heights around it, with the maximum SWH appearing on the right-hand side of the TC track. This pattern is a result of the low wind speed at the cyclone center, high wind speeds in the eyewall, and the asymmetric wind structure. On the 13th (Figure 9c and d), wave energy accumulated due to coastal blocking on the right-hand side of the ‘Kompasu’ track, resulting in higher wave heights on the right-hand side compared to the left. This feature is consistent with previous studies [61,62,63].
Affected by the obstruction due to Hainan Island, the wave height variation in the Beibu Gulf is mainly influenced by TCs. During the TC period, swell waves existed in the bay entrance, the southern part of the bay, and to the left of the Qiongzhou Strait. This is consistent with the research finding of Shen et al. [64] on the South China Sea (SCS) wave field during the passage of super typhoon ‘Megi’. Despite the differences in the path of ‘Megi’ compared to ‘Lionrock’ and ‘Kompasu’, the results are similar. This suggests that under the influence of TCs, the SCS mainly affects the semi-enclosed northern Beibu Gulf area through the bay entrance and the Qiongzhou Strait.

4.2. Nearshore Response

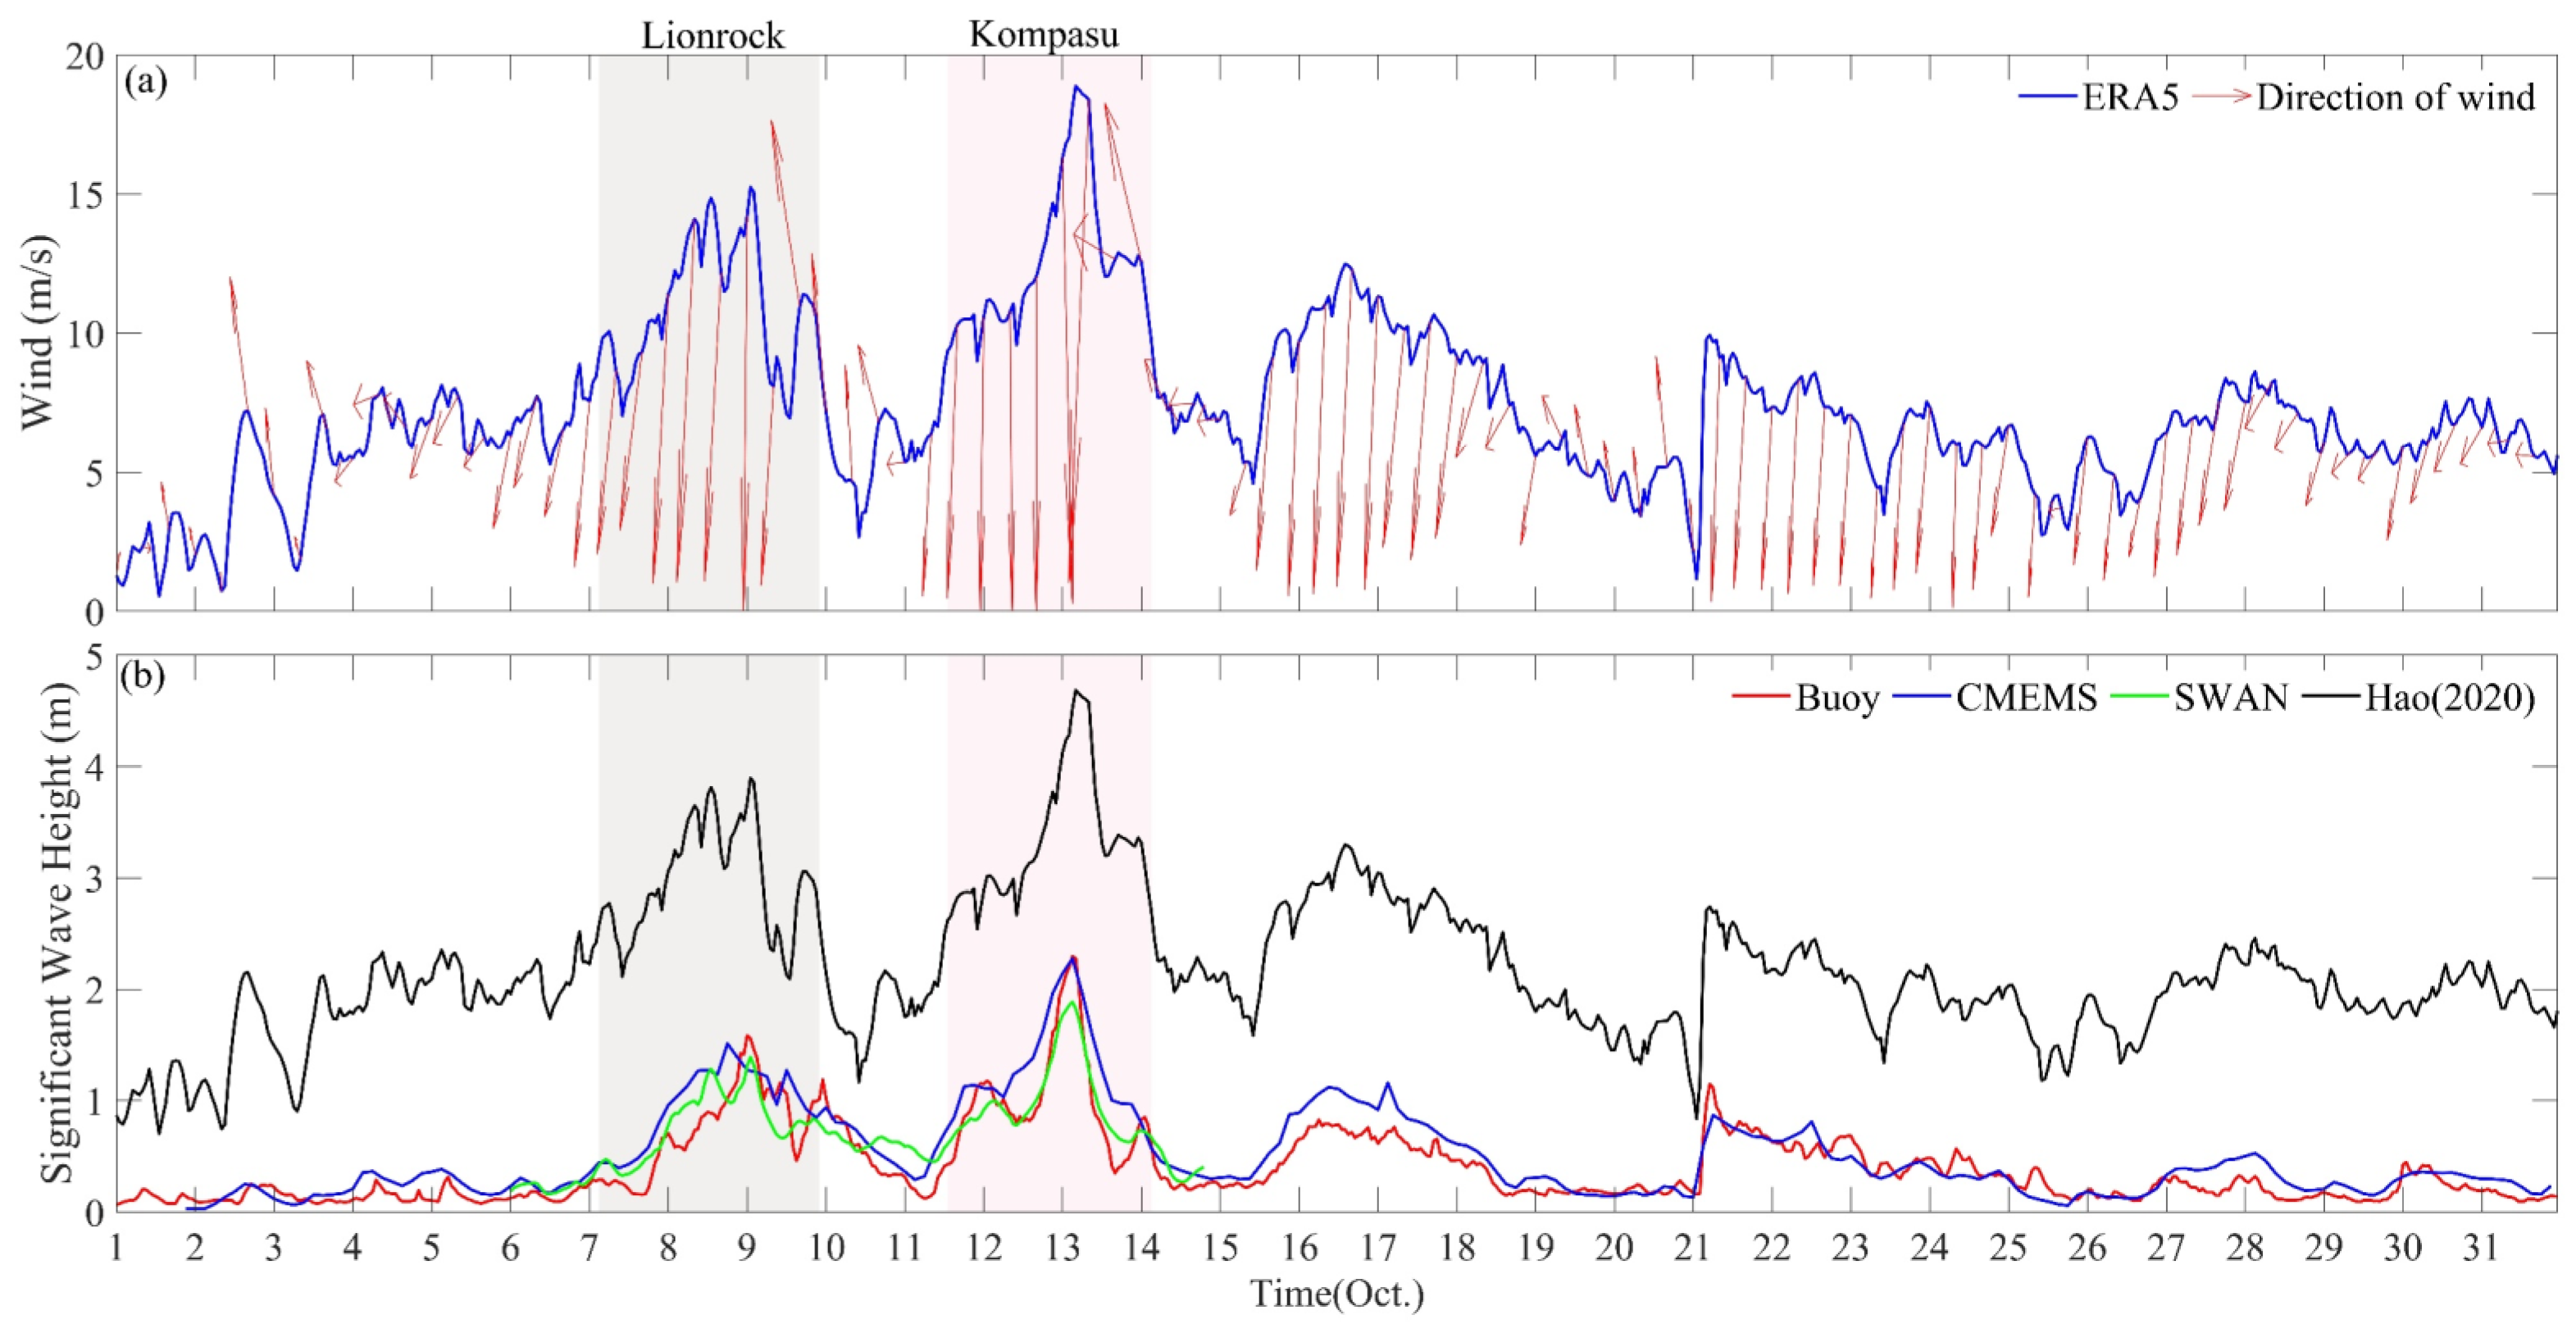
Figure 10 illustrates the time series of sea surface wind and SWH changes at the buoy station in October 2021. From the figure, it can be seen that during the period when ‘Lionrock’ was generated until the 8th, the maximum SWH at the station was 0.68 m. In the early morning of the 9th, the SWH reached the maximum value during the ‘Lionrock’ period (1.58 m) before decreasing in response to shifts in wind speed and direction. ‘Kompasu’ formed over the Northwest Pacific Ocean, at a considerable distance from the buoy station in the Beibu Gulf, and did not affect the station before entering the SCS on October 11th. Starting from the 11th, the south wind at the station shifted to a north wind, and the wind strength gradually increased. It reached the first peak at 0:00 on the 12th, with the SWH at the station was 2.3 m by 1:00 on the 13th, reaching its maximum. Thereafter, it gradually decreased to 0.79 m by 0:00 on the 14th, following which the TC dissipated and the wave height diminished. The surge in SWH following ‘Kompasu’ coincided with a period of intense wind events, lasting about 2 days, and peaked at a maximum SWH of 1.2 m. Correlation analysis was performed on the measured data and reanalyzed wind data during the ‘Lionrock’ and ‘Kompasu’ periods from 7 to 15 October. The results indicated that the change in wave height followed the change in wind, with a high correlation coefficient of 0.95 (p < 0.05).
During the periods influenced by ‘Lionrock’ and ‘Kompasu’, there were distinct peaks in the SWH at the observation station, because the buoy was located in the right-front of the cyclone path before and during the passage of ‘Lionrock’ and ‘Kompasu’. As the TCs landed and approached, the wave height at the buoy observation station reached its maximum; when ‘Lionrock’ and ‘Kompasu’ entered the Beibu Gulf, the observation station was then located on the right-hand rear side of the TC, during which the wind direction and speed at the buoy observation station changed, resulting in a small peak in SWH. As the TCs dissipated, the wave height returned to its unaffected level.
Figure 10b reveals that the trends of SWH changes in October 2021 are consistent for the four types of the buoy station. The difference between the SWH at the buoy station obtained by interpolating the CMEMS data and those obtained by adding the constraints of topography and water depth of the Beibu Gulf to the SWAN model, along with the measured data at the buoy, is very small, ranging from −0.35 m to 0.39 m. This suggests that the simulation results of the SWAN model for the SWH in the Beibu Gulf are accurate. On the other hand, the SWH was calculated by using Hao’s [54] SCS typhoon formula and the buoy measured data differs by 1.1–2.4 m, indicating that the formula does not apply to the Beibu Gulf.
The preliminary nearshore typhoon wave equation was obtained by fitting the buoy data (504 data) and the ERA5 reanalyzed wind field data from the 11th to 31st days, resulting in the equation: H s = 0.006 U 2 0.01 U + 0.11 . where H s represents the significant wave height and U represents the wind speed. This formula was then validated using 1 to 10 days of buoy data, and the correlation coefficient between the nearshore SWH of the Beibu Gulf calculated by the formula and the buoy SWH was found to be 0.72 (p < 0.01). The fitting formula has significant accuracy in describing the changing trend of typhoon-generated waves in the nearshore waters of the Beibu Gulf. However, while the fitting formula demonstrates accuracy in this context, more research and validation are necessary to enhance the wide applicability of the formula. This could involve expanding the dataset, adjusting the formula parameters, and conducting comparative analysis using other typhoon wave models.

4.3. Mechanism of Wave Changes

Under sustained wind input, waves continue to grow in height and steepen. When the steepness of the waves exceeds a certain limit, they break and their growth becomes restricted. As waves transition from deep water to shallow water, they are influenced by various factors. Wave energy dissipation is one of the three major mechanisms in the balance of wind–wave energy, consisting of whitecapping, bottom frictional energy dissipation, and depth-induced breaking energy dissipation, which play an important role in the spatial distribution of waves.
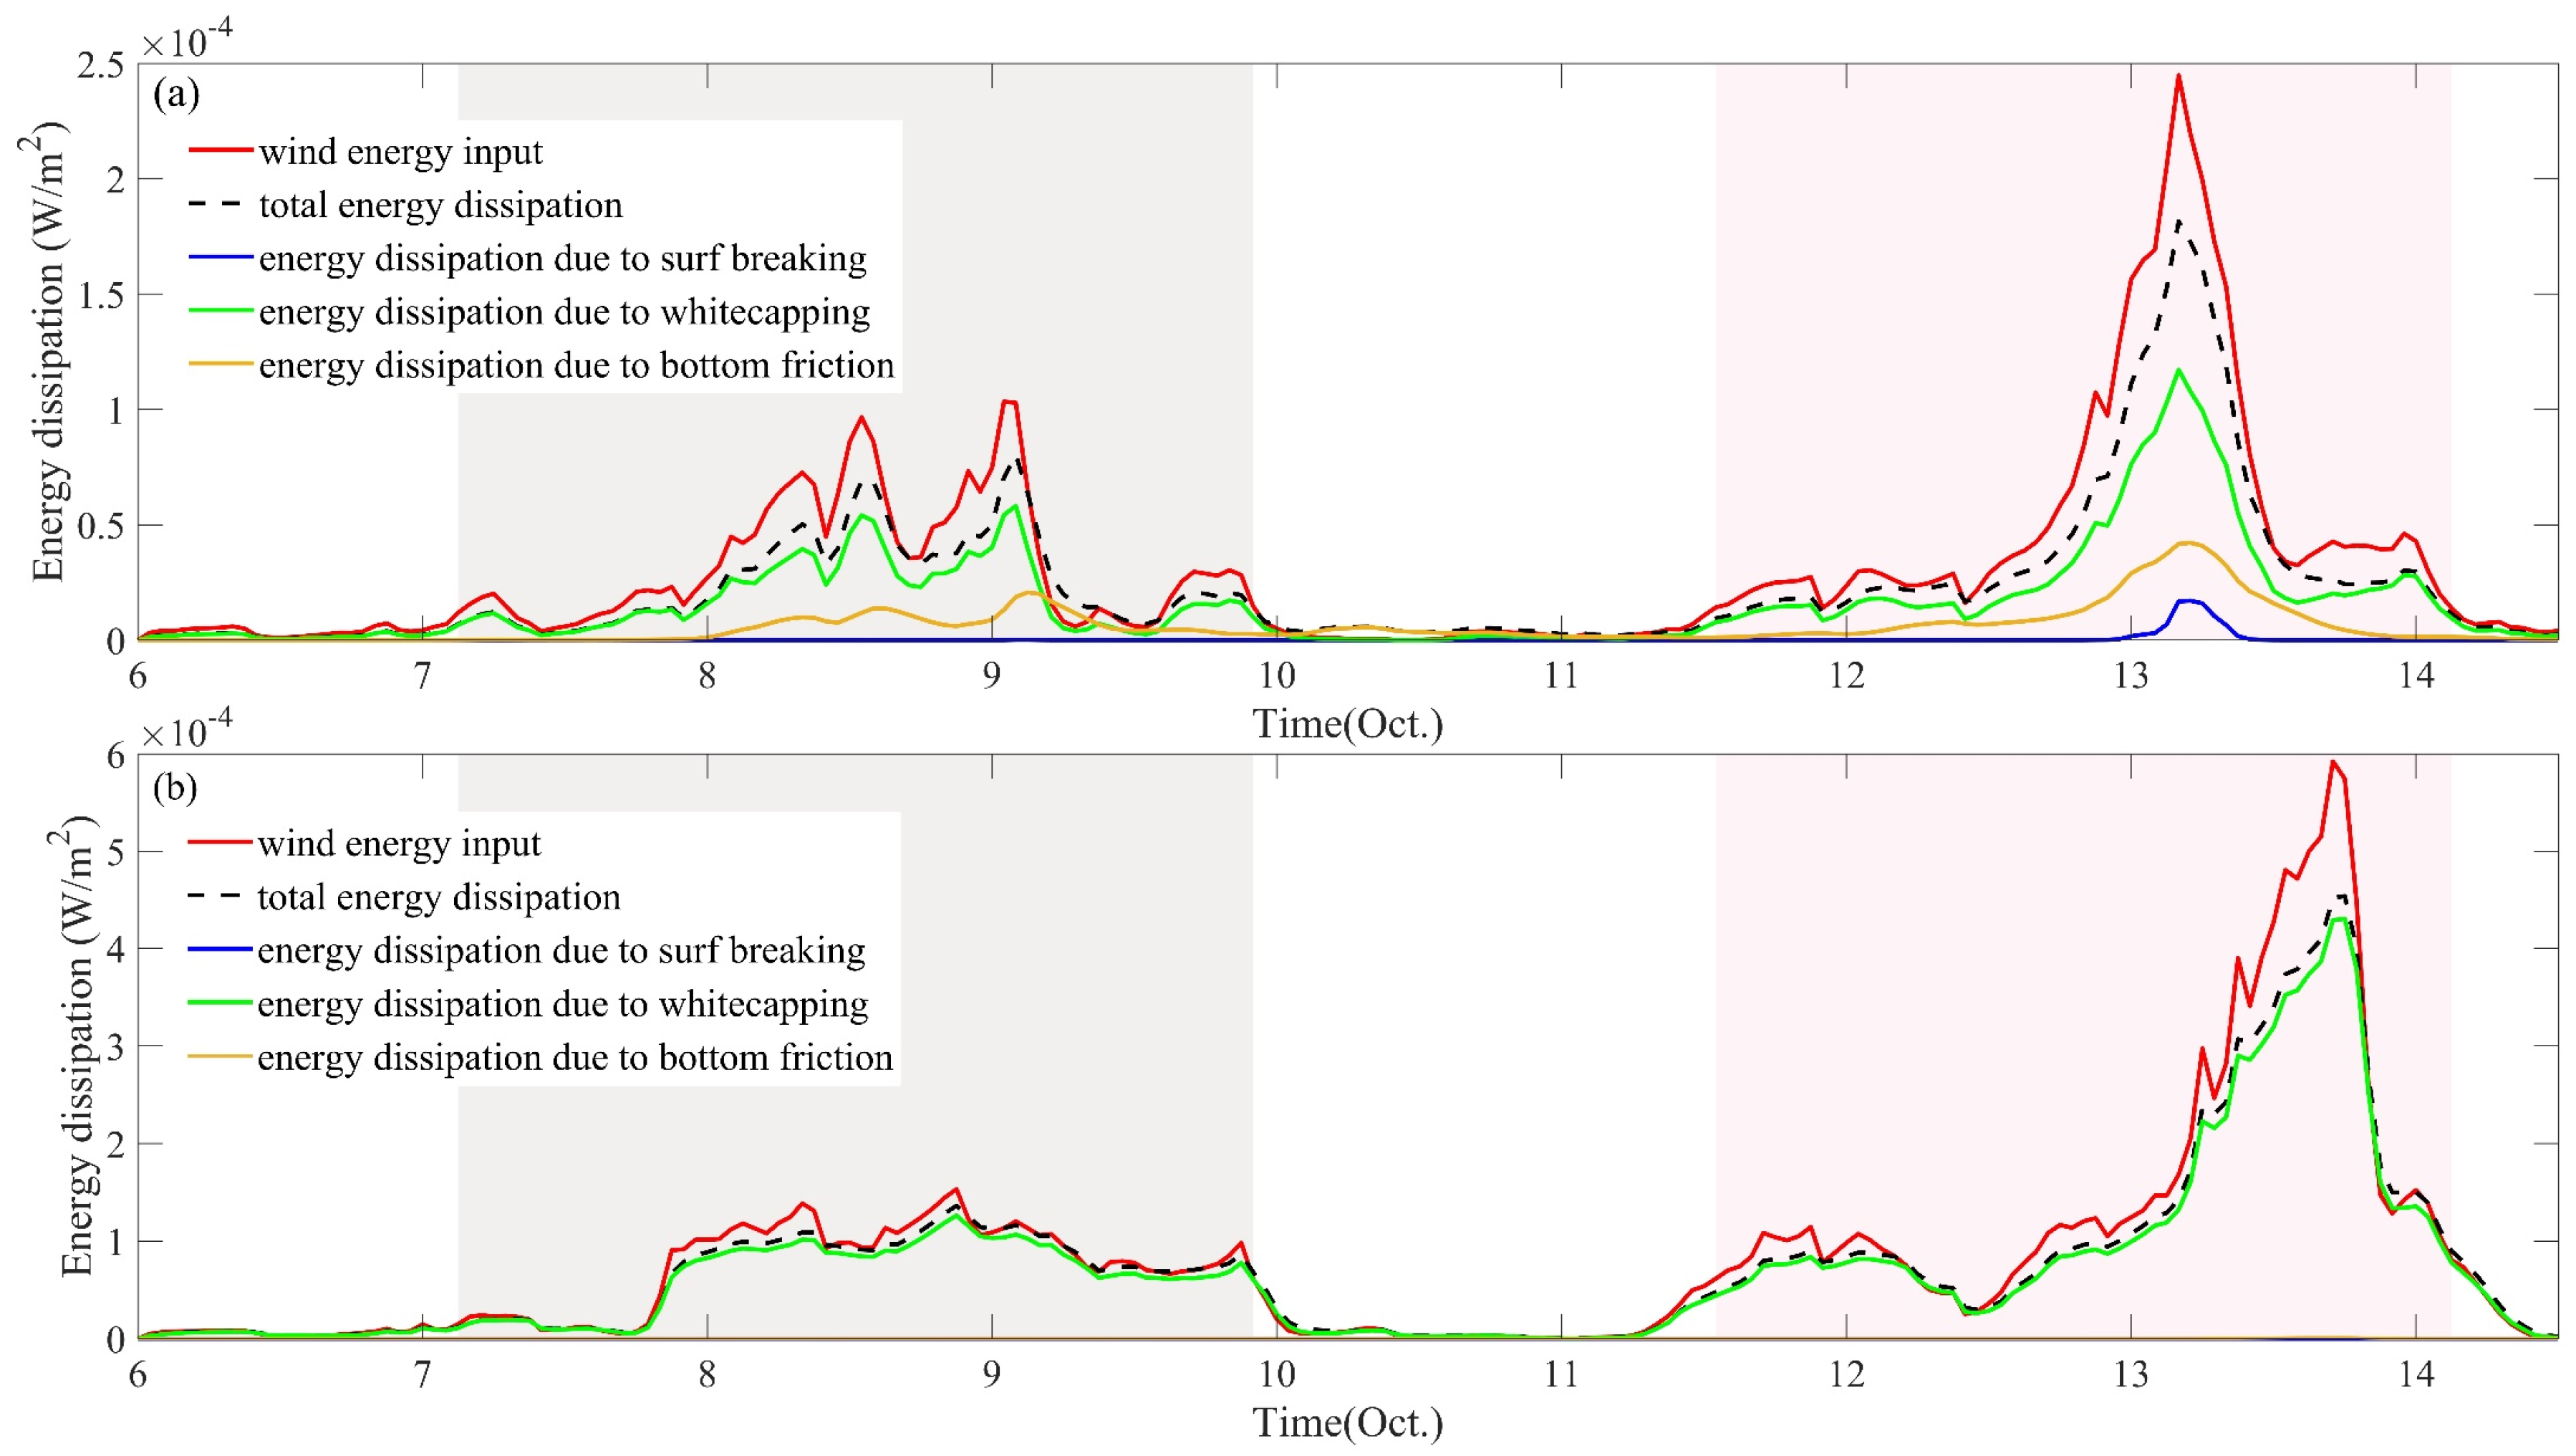
It can be observed that when not influenced by TCs, the input of wind energy at the ocean surface is roughly equal to dissipation. However, when affected by TCs, the input energy from the wind exceeds the dissipation energy (Figure 11). During the ‘Lionrock’ period, the energy dissipation due to whitecapping at the nearshore buoy station in the Beibu Gulf amounted to 5.8 × 10⁻⁵ W/m2, which constituted 74% of the total energy dissipation. As waves propagated into the shallower nearshore regions, the interaction between the waves and the seabed intensified, resulting in an increase in energy dissipation due to bottom friction, which escalated to 2.1 × 10⁻⁵ W/m2, comprising 22% of the overall energy dissipation. During the ‘Kompasu’ period, wave energy dissipation at the nearshore buoy in the Beibu Gulf was primarily influenced by whitecapping, bottom friction, and depth-induced wave breaking. The respective energy dissipation rates reached 1.1 × 10⁻⁴ W/m2, 4.2 × 10⁻⁵ W/m2, and 1.7 × 10⁻⁵ W/m2, accounting for 69%, 24%, and 3% of the total energy dissipation, respectively (Figure 11a). Therefore, energy dissipation due to whitecapping, bottom friction, and depth-induced wave breaking are the primary factors contributing to the reduction in wave height near the shoreline of the Beibu Gulf. The curve in Figure 11b clearly shows that under the two sequential TCs’ effects, the wave energy in the offshore waters of the Beibu Gulf was minimally influenced by bottom friction and water depth. Energy dissipation due to whitecapping accounts for 91–93% of the total energy dissipation, acting as the primary mechanism for maintaining wave energy balance and limiting the wave height in the offshore waters of the Beibu Gulf.

5. Discussion

5.1. Different Responses in Nearshore and Offshore Areas

The response speed of the upper ocean temperature to TCs is closely related to depth, with shallower depths resulting in faster responses [65,66]. The maximum cooling of the ocean generally occurs 1 to 7 days after the passage of a TC, with a higher frequency within the first day after the passage [61]. This study focused on a super-shallow water area, where the water depth is 5 m and the distance from the coast is 2.5 km. The in-situ observation shows the response time of temperature here to the TCs, ‘Lionrock’ and ‘Kompasu’, was shorter than 12 h. The lag time tends to increase as the water depth deepens.
Under the influence of these two sequential TCs of similar intensity, the offshore buoy station recorded maximum SST cooling of −2.8 °C and −3.0 °C for ‘Lionrock’ and ‘Kompasu’, respectively. The central basin of the Beibu Gulf experienced average cooling of −1.6 °C and −1.2 °C, surpassing the −0.7 °C and −0.8 °C observed in the SCS offshore (Table 1). The magnitude of cooling decreases with increasing water depth. During the periods of ‘Lionrock’ and ‘Kompasu’, offshore winds along the Beibu Gulf coast led to offshore transport and upwelling compensation, resulting in rapid cooling near the shore. The difference in the SST drop between the super-shallow coastal water and offshore gulf basin reached over 1.2 °C in this study, much higher than the global mean difference of about 0.2 °C between the coastal and offshore waters [67].
The observations and numerical studies indicate that 75–90% of the sea surface temperature cooling induced by TCs is attributed to the upwelling of cold subsurface water, while the contribution of air-sea heat exchange is relatively small [68,69,70,71]. Moreover, Prakash et al. [72] and Lingala et al. [73] found that horizontal convection plays a dominant role in controlling significant cooling. The buoy is located in the nearshore waters on the left-hand side of the Leizhou Peninsula. During ‘Lionrock’ and ‘Kompasu’, it was primarily influenced by northerly or northeasterly winds in the early stages and later controlled by easterly or southeasterly winds, the maximum EPV reached 5.8×10⁻⁴ m/s, and the sea temperature decreased by a total of 4.6°C. Through the calculation of the heat budget at the sea surface, it was found that the variation in sea temperature was consistent with the change in net heat flux. Although other factors may also contribute to the sea temperature variations, it is undeniable that the coastal cooling process is influenced by net heat flux and vertical advection.
Typically, the cooling caused by TCs recovers to 44% of its original state within 5 days after a cyclone passes, and to 88% within 30 days or even shorter periods [74]. The recovery of sea surface cooling induced by ‘Lionrock’ and ‘Kompasu’ was influenced by sequential TCs and the southward intrusion of cold air, and the current data are insufficient to analyze the duration of this recovery fully. Further exploration can be conducted through simulations.
During ‘Lionrock’ and ‘Kompasu’, the SWH tended to increase from nearshore to offshore waters. During ‘Lionrock’, the SWH was 1.58 m at the nearshore buoy station, 3.51 m at the CBGB, and 3.59 m at the NWSCS. During ‘Kompasu’, the SWH was 2.30 m at the nearshore buoy station, 5.36 m at the CBGB, and 6.39 m at the NWSCS (Table 2). The nearshore wave heights were reduced due to shallower water and bottom friction. The magnitude of the SWH in the offshore waters is mainly limited by the energy consumption of whitecapping [75].
Previous studies have indicated that considering wave–current interactions, the simulated SWH generated by TCs can decrease by approximately 10% [76,77], and the SST is modulated by waves, enhancing mixing through wave-induced and wave-breaking processes, and the breaking of surface waves enhances vertical mixing, causing a reduction of over 60% in hurricane-driven surface currents [78]. We employed the ADCIRC-SWAN coupled model to simulate the SWH change induced by TCs in the Beibu Gulf, and the simulated results match the observation. Compared to using the SWAN model in isolation, the integration of observational data and the application of a wave–current coupled model demonstrate superior performance in simulating surface waves and the SST [78]. Consequently, we infer that reliance on the SWAN model alone for simulations may result in an overestimation of the nearshore SWH in the Beibu Gulf. Additionally, we observed coastal cooling in the Beibu Gulf, similar to the positions and directions of coastal currents induced by strong winds in the area. The wave intensity affects sea surface flow fields and the SST, with the SST exhibiting trends consistent with changes in sea surface flow fields induced by waves [79]. We hypothesize that the nearshore sea temperature in the Beibu Gulf may be influenced by waves, but the exact correlation requires further confirmation based on nearshore typhoon data and model simulations.

5.2. Impacts of Sequential Tropical Cyclones

Compared to a single TC, sequential TCs exacerbate the variability of marine elements. The interval between ‘Lionrock’ and ‘Kompasu’ influencing the buoy was 39 h. During this period, the SST in the northern Beibu Gulf rebounded by 1.15 °C from the cooling caused by ‘Lionrock’, recovering by 26.7%. Subsequently, ‘Kompasu’ intensified the SST drop by another 3.0 °C, which is slightly larger than for the early ‘Lionrock’. In the open ocean, the statistical results show that the cooling due to a later TC is suppressed by the earlier one [80]. The total drop in the coastal area of the northern Beibu Gulf after the sequential TCs was 4.6 °C, which also exceeded the total SST drop in the northern Pacific Ocean (3.2 °C) after sequential TCs [81]. These sequential TCs had severe effects on the shallow coastal water.
The wind speed, heat loss, and EPV in the CBGB were greater during ‘Kompasu’ than during ‘Lionrock’, but the SST decrease was comparatively smaller. The Beibu Gulf basin, affected by ‘Lionrock’, experienced overall northerly winds during the interval between the two TCs, with the northern part of the basin continuing to undergo heat loss (Figure 4e), resulting in an SST increase of 0.1 °C (Table 2). The SST cooling (−1.2 °C) during the second TC is smaller than (−1.6 °C) the first weaker TC in the gulf basin, probably due to the deepening of the mixed layer [66].
Moreover, both TCs were impacted by the eastward movement of a trough guiding cold air southward, with ‘Kompasu’ being more affected than ‘Lionrock’ [82]. The cold air partially amplified the cooling of the sea surface in the Beibu Gulf. Unlike closely spaced TCs that can interact with each other [83], ‘Lionrock’ formed in the western part of the SCS on 6 October 2021, while ‘Kompasu’ originated east of the Philippines on the 8th. The two TCs were widely separated and had intensities of a tropical storm and typhoon, resulting in minimal interaction between them.
The comparison between the simulated SWH and buoy-measured data in the shallow coastal waters of the northeastern Beibu Gulf indicates a close match between the two datasets. This suggests that using the reanalysis of wind forcing and high-resolution wave models can effectively simulate the surface wave field under TC conditions in the nearshore shallow waters of the Beibu Gulf. In contrast to the limited temporal and spatial observational data, this approach enables a more comprehensive analysis of the wave field generated by TCs.

6. Conclusions

The Beibu Gulf, as a semi-enclosed area in the northwestern part of the SCS, is an important gulf with abundant resources and ecosystems. The temperature and surface wave responses to TCs is crucial for both natural lives and human activities. Using the buoy observations combined with the reanalysis data and SWAN model, this study shows the special response of the SST and SWH in the super-shallow coastal water of the Beibu Gulf to the sequential TCs, ‘Lionrock’ and ‘Kompasu’. The mechanism and difference from local and other offshore waters were also analyzed and discussed.
During the observation period, the SST in the nearshore area of the Beibu Gulf decreased significantly. The cooling of the nearshore waters of the Beibu Gulf was the largest in the whole northwestern SCS due to sea surface heat loss, strong offshore winds, and shallow water depth. The area of SST cooling expanded from nearshore to offshore waters, with a decreasing trend in amplitude and rate from nearshore to offshore (CBGB, NWSCS) areas and an increasing trend in the lag time. The sequential TCs have a super effect on the cooling. In addition, the regions of maximum cooling for the first TC occurred on both sides of the track. The wind speed, heat loss, and EPV in the CBGB were significantly higher during the period of ‘Kompasu’ compared to ‘Lionrock’, but the intensification of cooling was limited, suggesting that the earlier TC may have influenced the response of the later TC to some extent.
Throughout the passage of the two TCs, wave variations in the northern Beibu Gulf were primarily induced by the intense wind forcing, while in the southern Beibu Gulf, the wave heights were the result of the combined effects of the wind waves and a small portion of swell waves. During the TC movement, the maximum wave height occurred to the right front of the TC center. The trends in the wave height at the buoy stations were consistent with the changes in wind, with a correlation coefficient of 0.95. Wave height in the nearshore zone of the Beibu Gulf was observed to be smaller compared to the offshore region. The variations in wave dynamics offshore were predominantly governed by whitecapping, whereas the nearshore wave dynamics were influenced by a combination of whitecapping, water depth, and bottom friction.
Additionally, it was discovered that the typhoon wave equation, which is applicable to the SCS, does not apply to the waters of the Beibu Gulf. This study employed nearshore buoy data from the Beibu Gulf to fit the nearshore typhoon wave equation. It was found that under the premise of the quadratic relationship between the nearshore SWH and the wind speed of the Beibu Gulf, it is necessary to obtain more nearshore measured data to determine the coefficients of the nearshore typhoon wave equation.
The response of nearshore areas to TCs differs from that of open oceans. Due to the influence of factors such as freshwater input and topography, the response mechanism in nearshore marine heat flux and shallow water waves is more complex. Further analysis requires a combination of more detailed numerical models and additional observational data.

Author Contributions

Conceptualization, L.X.; methodology, X.C.; software, X.C. and Y.W.; validation, X.C. and Y.W.; formal analysis, X.C.; investigation, M.L. and Y.X.; resources, L.X. and Y.X.; data curation, M.L.; writing—original draft preparation, X.C.; writing—review and editing, X.C. and L.X.; visualization, X.C.; supervision, L.X., M.L. and Y.X.; project administration, L.X.; funding acquisition, L.X. All authors have read and agreed to the published version of the manuscript.

Funding

This work was supported by the National Natural Science Foundation of China, with grant numbers 42276019, 42249911, and 42176184.

Data Availability Statement

The SST and SWH used in this study were sourced from the Copernicus Marine Environment Monitoring Service (source: https://data.marine.copernicus.eu/products, accessed on 29 April 2024). The 10 m wind vector, sea surface shortwave radiation, longwave radiation, latent heat flux, and sensible heat flux data were obtained from the European Centre for Medium-Range Weather Forecasts (source: https://cds.climate.copernicus.eu/cdsapp#!/dataset/reanalysis-era5-single-levels, accessed on 29 April 2024). The TC data (including TC tracks, maximum wind speeds, etc.) were sourced from the China Meteorological Administration (source: https://tcdata.typhoon.org.cn, accessed on 29 April 2024). SWAN model: https://swanmodel.sourceforge.io/download/download.htm, accessed on 29 April 2024. The buoy observations in this study are available on request from the corresponding author.

Acknowledgments

Thanks the Guangdong Provincial Observation Station for Tropical Ocean Environment in Western Coastal Waters for providing data support.

Conflicts of Interest

The authors declare no conflicts of interest.

References

  1. Pasquero, P.C. Role of sst patterns on surface wind modulation of a heavy midlatitude precipitation event. J. Geophys. Res. Atmos. 2018, 123, 9081–9096. [Google Scholar]
  2. Li, D.Y.; Tan, Z.M. The role of ocean-atmosphere interactions in tropical cyclone intensity predictability. J. Atmos. Sci. 2023, 80, 1213–1226. [Google Scholar] [CrossRef]
  3. Warner, J.C.; Armstrong, B.; He, R.; Zambon, J.B. Development of a Coupled Ocean–Atmosphere–Wave–Sediment Transport (COAWST) modeling system. Ocean Model. 2010, 35, 230–244. [Google Scholar] [CrossRef]
  4. Olabarrieta, M.; Warner, J.C.; Armstrong, B.; Zambon, J.B.; He, R. Ocean–atmosphere dynamics during Hurricane Ida and Nor’Ida: An application of the coupled ocean–atmosphere–wave–sediment transport (COAWST) modeling system. Ocean Model. 2012, 43–44, 112–137. [Google Scholar] [CrossRef]
  5. Black, P.; Dasaro, E.; Drennan, W.; French, J.; Niiler, P.; Sanford, T.; Terrill, E.; Walsh, E.; Zhang, J. Air–Sea Exchange in Hurricanes: Synthesis of Observations from the Coupled Boundary Layer Air–Sea Transfer Experiment. Bull. Am. Meteorol. Soc. 2007, 88, 357–374. [Google Scholar] [CrossRef]
  6. Emanuel, K. Contribution of tropical cyclones to meridional heat transport by the oceans. J. Geophys. Res. Atmos. 2001, 106, 14771–14781. [Google Scholar] [CrossRef]
  7. Chelton, D.B.; Schlax, M.G.; Samelson, R.M. Summertime coupling between sea surface temperature and wind stress in the California Current System. J. Phys. Oceanogr. 2007, 37, 495–517. [Google Scholar] [CrossRef]
  8. Chelton, D.B.; Esbensen, S.K.; Schlax, M.G.; Thum, N.; Freilich, M.H.; Wentz, F.J.; Gentemann, C.L.; McPhaden, M.J.; Schopf, P.S. Observations of coupling between surface wind stress and sea surface temperature in the eastern tropical Pacific. J. Clim. 2001, 14, 1479–1498. [Google Scholar] [CrossRef]
  9. D’Asaro, E.A.; Sanford, T.B.; Niiler, P.P.; Terrill, E.J. Cold wake of hurricane Frances. Geophys. Res. Lett. 2007, 34, L1560. [Google Scholar] [CrossRef]
  10. Korty, R.L.; Emanuel, K.A.; Scott, J.R. Tropical cyclone–induced upper-ocean mixing and climate: Application to equable climates. J. Clim. 2008, 21, 638–654. [Google Scholar] [CrossRef]
  11. Fedorov, A.V.; Brierley, C.M.; Emanuel, K. Tropical cyclones and permanent El Niño in the early Pliocene epoch. Nature 2010, 463, 1066–1070. [Google Scholar] [CrossRef]
  12. Pasquero, C.; Desbiolles, F.; Meroni, A.N. Air-sea interactions in the cold wakes of tropical cyclones. Geophys. Res. Lett. 2021, 48, e2020GL091185. [Google Scholar] [CrossRef]
  13. Zhou, L.; Chen, D.; Lei, X.; Wang, W.; Wang, G.; Hang, G. Progress and Perspective on Interaction between Ocean and Typhoon. Sci. Bull. 2019, 64, 60–72. [Google Scholar] [CrossRef]
  14. Jiang, X.; Liu, C.; Mo, H.; Wang, Y. The impact of air-sea interaction on typhoon structure. J. Trop. Meteorol. 2010, 26, 55–59. [Google Scholar]
  15. Soloviev, A.V.; Lukas, R.; Donelan, M.A.; Haus, B.K.; Ginis, I. The air-sea interface and surface stress under tropical cyclones. Sci. Rep. 2014, 4, 5306. [Google Scholar] [CrossRef] [PubMed]
  16. Li, F.N.; Song, J.B.; He, H.L.; Li, S.; Li, X.; Guan, S.D. Assessment of surface drag coefficient parametrizations based on observations and simulations using the Weather Research and Forecasting model. Atmos. Ocean. Sci. Lett. 2016, 9, 327–336. [Google Scholar] [CrossRef]
  17. Tian, D.; Zhang, H.; Zhang, W.; Zhou, F.; Sun, X.; Zhou, Y.; Ke, D. Wave glider observations of surface waves during three tropical cyclones in the South China Sea. Water 2020, 12, 1331. [Google Scholar] [CrossRef]
  18. Nystrom, R.G.; Chen, X.; Zhang, F.; Davis, C.A. Nonlinear impacts of surface exchange coefficient uncertainty on tropical cyclone intensity and air-sea interactions. Geophys. Res. Lett. 2020, 47, e2019GL085783. [Google Scholar] [CrossRef]
  19. Lee, C.Y.; Chen, S.S. Symmetric and asymmetric structures of hurricane boundary layer in coupled atmosphere–wave–ocean models and observations. J. Atmos. Sci. 2012, 69, 3576–3594. [Google Scholar] [CrossRef]
  20. Liu, Z.; Xu, J.; Zhu, B.; Sun, C.; Zhang, L. The upper ocean response to tropical cyclones in the northwestern Pacific analyzed with Argo data. Chin. J. Oceanol. Limnol. 2007, 25, 123–131. [Google Scholar] [CrossRef]
  21. Price, J.F. Upper ocean response to a hurricane. J. Phys. Oceanogr. 1981, 11, 153–175. [Google Scholar] [CrossRef]
  22. Black, W.J.; Dickey, T.D. Observations and analyses of upper ocean responses to tropical storms and hurricanes in the vicinity of Bermuda. J. Geophys. Res. Ocean. 2008, 113, C0800. [Google Scholar] [CrossRef]
  23. Yang, X.; Tang, D. Location of sea surface temperature cooling induced by typhoon in the South China Sea. J. Trop. Oceanogr. 2010, 29, 26–31. [Google Scholar]
  24. Sadhuram, Y. (Ed.) Record Decrease of Sea Surface Temperature Following the Passage of a Super Cyclone over the Bay of Bengal; Indian Academy of Sciences: Bengaluru, India, 2004. [Google Scholar]
  25. Xie, L.; He, C.; Li, M.; Tian, J.; Jing, Z. Response of sea surface temperature to typhoon passages over the upwelling zone east of Hainan Island. Adv. Mar. Sci. 2017, 35, 8–19. [Google Scholar]
  26. Shi, Y.; Xie, L.; Zheng, Q.; Zhang, S.; Li, M.; Li, J. Unusual coastal ocean cooling in the northern South China Sea by a katabatic cold jet associated with Typhoon Mujigea (2015). Acta Oceanol. Sin. 2019, 38, 62–75. [Google Scholar] [CrossRef]
  27. Li, Y.; Wang, A.; Qiao, L.; Fang, J.; Chen, J. The impact of typhoon Morakot on the modern sedimentary environment of the mud deposition center off the Zhejiang–Fujian coast, China. Cont. Shelf Res. 2012, 37, 92–100. [Google Scholar] [CrossRef]
  28. Milliman, J.; Lin, S.; Kao, S.; Liu, J.; Liu, C.; Chiu, J.; Lin, Y. Short-term changes in seafloor character due to flood-derived hyperpycnal discharge: Typhoon Mindulle, Taiwan, July 2004. Geology 2007, 35, 779. [Google Scholar] [CrossRef]
  29. Yang, G.-B.; Lü, L.-G.; Wang, G.-S.; Jiang, Y.; Liu, Z.-W.; Yang, C.-M.; Chen, Z.; Zhang, C. Coastal sound-field change due to typhoon-induced sediment warming. J. Acoust. Soc. Am. 2016, 140, EL242–EL246. [Google Scholar] [CrossRef]
  30. Shi, H.; Cao, X.; Wen, X.; Wu, Q.; Guo, P. Numerical model research of the spatial characteristics of typhoon waves in the northwestern of the south China sea near Hainan island during the transmit of typhoon “Son-Tink”. Mar. Environ. Sci. 2016, 35, 366–373. [Google Scholar]
  31. Shi, M.; Chen, B.; Ding, Y.; Wu, L.; Zheng, B. Wind effects on spread of runoffs in Beibu Bay. Guangxi Sci. 2016, 23, 485–491. [Google Scholar]
  32. Rasheed, M.A.; Unsworth, R.K.F. Long-term climate-associated dynamics of a tropical seagrass meadow: Implications for the future. Mar. Ecol. Prog. Ser. 2011, 422, 93–103. [Google Scholar] [CrossRef]
  33. Zhang, W.; Zheng, Z.; Zhang, T.; Chen, T. Strengthened marine heatwaves over the Beibu Gulf coral reef regions from 1960 to 2017. Haiyang Xuebao 2020, 42, 45–52. [Google Scholar]
  34. Micheli, F.; Bishop, M.J.; Peterson, C.H.; Rivera, J. Alteration of seagrass species composition and function over two decades. Ecol. Monogr. 2008, 78, 225–244. [Google Scholar] [CrossRef]
  35. Fan, H.Q.; Peng, S.; Shi, Y.J.; Zheng, X.W. The situations of seagrass resources and researches along Guangxi coasts of Beibu Gulf. Guangxi Sci. 2007, 14, 289–295. [Google Scholar]
  36. Wu, Z.J.; Chen, S.Q.; Wang, D.R.; Cai, Z.F.; Zhang, G.X.; Tu, Z.G.; Li, Y.C. The health assessment of the sea grass bed ecosystem in the east coast of Hainan Islands. Mar. Sci. 2014, 38, 67–74. [Google Scholar]
  37. Deng, C.B.; Lian, X.Q. Conservation and management of rare and endangered marine mammals in the Beibu Gulf in Guangxi. Chin. J. Guangxi Acad. Sci. 2004, 20, 123–126. [Google Scholar]
  38. Chen, Y.; Lin, X.; Luo, J.; You, Y. Analysis of Spatial and Temporal Pattern of Tropical Cyclone Landing on Hainan lsland in Recent 31 Years. Green Technol. 2021, 23, 4–6+20. [Google Scholar]
  39. Emanuel, K. Increasing destructiveness of tropical cyclones over the past 30 years. Nature 2005, 436, 686–688. [Google Scholar] [CrossRef] [PubMed]
  40. Walsh, K.J.E.; McBride, J.L.; Klotzbach, P.J.; Balachandran, S.; Camargo, S.J.; Holland, G.; Knutson, T.R.; Kossin, J.P.; Lee, T.-C.; Sobel, A.; et al. Tropical cyclones and climate change. Wiley Interdiscip. Rev. Clim. Change 2016, 7, 65–89. [Google Scholar] [CrossRef]
  41. Wang, S.; Toumi, R. Recent migration of tropical cyclones toward coasts. Science 2021, 371, 514–517. [Google Scholar] [CrossRef]
  42. Liu, G.; Li, X.; Wang, J.; Kou, Y.; Wang, X. Research on the statistical characteristics of typhoon frequency. Ocean Eng. 2020, 209, 107489. [Google Scholar] [CrossRef]
  43. Zhang, Q.; Wu, L.; Liu, Q. Tropical cyclone damages in China 1983–2006. Bull. Am. Meteorol. Soc. 2009, 90, 489–496. [Google Scholar] [CrossRef]
  44. Jiang, C.; Zhao, B.; Deng, B.; Wu, Z. Numerical simulation of typhoon storm surge in the Beibu Gulf and hazardous analysis at key areas. Mar. Forecast. 2017, 34, 32–40. [Google Scholar]
  45. Zhang, M.; Jie, M.; Dai, Z. Impacts of sea-level rise on storm surge in the Beibu Gulf: A case study on Typhoon Son-Tinh in 2012. Mar. Sci. Bull. 2021, 40, 309–318. [Google Scholar]
  46. Dong, Z.-H.; Cao, L.-H. The influence on topography and relief in south gulf Beibu and suspending of pipe caused by typhoon. Mar. Technol. 2004, 23, 24–28+34. [Google Scholar]
  47. Li, X.; Fu, D.; Zhang, Y.; Liu, D.; Ding, Y.; Wang, W.; Luan, H.; Jiang, C. The impacts of super typhoon Rammasun on the environment of the northwestern South China Sea. J. Trop. Oceanogr. 2016, 35, 19–28. [Google Scholar]
  48. Liu, S.; Li, J.; Sun, L.; Wang, G.; Tang, D.; Huang, P.; Yan, H.; Gao, S.; Liu, C.; Gao, Z.; et al. Basin-wide responses of the South China Sea environment to super typhoon Mangkhut (2018). Sci. Total Environ. 2020, 731, 139093. [Google Scholar] [CrossRef]
  49. Chen, Y.; Ren, C.; Feng, Y.; Shi, H.; Pan, G.; Cooper, M.; Zhao, H. Different Responses of Chlorophyll a to the Passage of the Tropical Storm Wipha (2019) in the Coastal Waters of the Northern Beibu Gulf. Front. Mar. Sci. 2022, 9, 887240. [Google Scholar] [CrossRef]
  50. GB/T 19201-2006; Grade of Tropical Cyclones. China Meteorological Administration Policy and Regulations Department: Beijing, China, 2006.
  51. Booij, N.; Ris, R.C.; Holthuijsen, L.H. A third-generation wave model for coastal regions: 1. Model description and validation. J. Geophys. Res. Ocean. 1999, 104, 7649–7666. [Google Scholar] [CrossRef]
  52. Westerink, J.J.; Luettich, R.A.; Baptists, A.M.; Scheffner, N.W.; Farrar, P. Tide and storm surge predictions using finite element model. J. Hydraul. Eng. 1992, 118, 1373–1390. [Google Scholar] [CrossRef]
  53. Kolar, R.L.; Gray, W.G.; Westerink, J.J.; Luettich, R.A., Jr. Shallow water modeling in spherical coordinates: Equation formulation, numerical implementation, and application. J. Hydraul. Res. 1994, 32, 3–24. [Google Scholar] [CrossRef]
  54. Hao, Z.; Tu, Q.; Zhang, S.; Chen, J.; Pan, D. Wind-Wave relationship model and analysis of typhoon wave fields in the south China sea from HY-2A Satellite observations. IEEE J. Sel. Top. Appl. Earth Obs. Remote Sens. 2020, 13, 4008–4015. [Google Scholar] [CrossRef]
  55. Ma, L.; Qing, Z.; Duan, Y.; Du, B. Ocean impact on the development of cyclone over the East China Sea. Acta Oceanol. Sin. 2002, S1, 112–122. [Google Scholar]
  56. Yang, J.; Hong, B. Response of the Upper Ocean in the Northeastern South China Sea to Typhoon ‘Lianhua’. Mar. Bull. 2021, 40, 161–171. [Google Scholar]
  57. Chen, X.; Qiu, C.; Zhang, H.; Liu, D.; Shi, H.; Ma, Y.; Wang, D. Response of the Marine Environment near Jitimen in the Pearl River Estuary to Typhoon. Oceanol. Limnol. Sin. 2022, 53, 872–881. [Google Scholar]
  58. Prasad, T.; Hogan, P.J. Upper-ocean response to Hurricane Ivan in a 1/25 nested Gulf of Mexico HYCOM. J. Geophys. Res. Ocean. 2007, 112, C0401. [Google Scholar] [CrossRef]
  59. Zhang, Z. A Case Study on the Response of the Upper Ocean in the Northwestern Pacific Ocean to Typhoons. Mar. Bull. 2019, 38, 562–568. [Google Scholar]
  60. Chen, D.; Lei, X.; Wang, W.; Wang, G.; Han, G.; Zhou, L. Response and Modulation Mechanism of the Upper Ocean to Typhoons. Adv. Earth Sci. 2013, 28, 1077–1086. [Google Scholar]
  61. Halpern, D. Observations of the deepening of the wind-mixed layer in the northeast Pacific Ocean. J. Phys. Oceanogr. 1974, 4, 454–466. [Google Scholar] [CrossRef]
  62. Zhou, L.; Wang, A.; Wang, Z. Wave spectrum characteristics under typhoon wind forcing in coastal waters of the Beibu Bay through numerical simulation by SWAN. Mar. Sci. Bull. 2010, 12, 1–14. [Google Scholar]
  63. Chen, T.; Zhou, L.; Wang, Z.; Li, Q. Analysis of Wave and Sea Surface Temperature Changes in the Northern South China Sea during Typhoon ‘Haiou’. Mar. Lake Bull. 2017, 4, 1–11. [Google Scholar]
  64. Shen, X.; Fan, L.; Chen, G.; Gao, C.; Zhong, X. Numerical Simulation Study of the Wave Field in the South China Sea under the Influence of Typhoon ‘Nianyu’. Waterw. Port 2016, 37, 369–374. [Google Scholar]
  65. Li, Z.; Meng, Z.; Liu, C.; Mao, K.; Han, S. Study on the Impact of Typhoon ‘Dujuan’ on Upper Ocean Temperature in the Western Pacific Ocean. Mar. Lake Bull. 2020, 3, 24–30. [Google Scholar]
  66. Xu, W.L.; Su, J. The impact of typhoons on sea surface temperature in the Western North Pacific Ocean. Period. Ocean. Univ. China 2007, 37 (Suppl. Ⅱ), 17–22. [Google Scholar]
  67. Dac Da, N.; Foltz, G.R.; Balaguru, K.; Fernald, E. Stronger Tropical Cyclone–Induced Ocean Cooling in Near-Coastal Regions Compared to the Open Ocean. J. Clim. 2023, 36, 6447–6463. [Google Scholar] [CrossRef]
  68. Huang, P.; Sanford, T.B.; Imberger, J. Heat and Turbulent Kinetic Energy Budgets for Surface Layer Cooling Induced by the Passage of Hurricane Frances (2004). J. Geophys. Res. 2009, 114, 2169–9291. [Google Scholar] [CrossRef]
  69. Jacob, S.D.; Shay, L.K.; Mariano, A.J.; Black, P.G. The 3D oceanic mixed layer response to hurricane Gilbert. J. Phys. Oceanogr. 2000, 30, 1407–1429. [Google Scholar] [CrossRef]
  70. Chen, S.; Campbell, T.J.; Jin, H.; Gaberšek, S.; Hodur, R.M.; Martin, P. Effect of two-way air-sea coupling in high and low wind speed regimes. Mon. Weather. Rev. 2010, 138, 3579–3602. [Google Scholar] [CrossRef]
  71. Sui, Y.; Sheng, J.; Tang, D.; Xing, J. Study of storm-induced changes in circulation and temperature over the northern South China Sea during Typhoon Linfa. Cont. Shelf Res. 2022, 249, 104866. [Google Scholar] [CrossRef]
  72. Prakash, K.R.; Pant, V. Upper oceanic response to tropical cyclone Phailin in the Bay of Bengal using a coupled atmosphere-ocean model. Ocean. Dyn. 2017, 67, 51–64. [Google Scholar] [CrossRef]
  73. Jyothi, L.; Joseph, S.; Suneetha, P. Surface and sub-surface ocean response to Tropical Cyclone Phailin: Role of pre-existing oceanic features. J. Geophys. Res. Ocean. 2019, 124, 6515–6530. [Google Scholar] [CrossRef]
  74. Dare, R.A.; McBride, J.L. Sea surface temperature response to tropical cyclones. Mon. Weather. Rev. 2011, 139, 3798–3808. [Google Scholar] [CrossRef]
  75. Drost, E.J.F.; Lowe, R.J.; Ivey, G.N.; Jines, N.; Péquignet, C.A. The effects of tropical cyclone characteristics on the surface wave fields in Australia’s North West region. Cont. Shelf Res. 2017, 139, 35–53. [Google Scholar] [CrossRef]
  76. Wang, P.; Sheng, J. A comparative study of wave-current interactions over the eastern Canadian shelf under severe weather conditions using a coupled wave-circulation model. J. Geophys. Res. Ocean. 2016, 121, 5252–5281. [Google Scholar] [CrossRef]
  77. Sun, Y.; Perrie, W.; Toulany, B. Simulation of wave-current interactions under hurricane conditions using an unstructured-grid model: Impacts on ocean waves. J. Geophys. Res. Ocean. 2018, 123, 3739–3760. [Google Scholar] [CrossRef]
  78. Lin, S.; Sheng, J.; Ohashi, K.; Song, Q. Wave-current interactions during Hurricanes Earl and Igor in the northwest Atlantic. J. Geophys. Res. Ocean. 2021, 126, e2021JC017609. [Google Scholar] [CrossRef]
  79. Xiao, L.; Shi, J.; Jiang, G.; Liu, Z. The influence of ocean waves on sea surface current field and sea surface temperature under the typhoon background. Mar. Sci. Bull. 2018, 37, 396–403. [Google Scholar]
  80. He, S.; Cheng, X.; Fei, J.; Li, X.; Wei, Z.; Huang, X. Thermal response to sequential tropical cyclone passages: Statistic analysis and idealized experiments. Front. Earth Sci. 2023, 11, 1142537. [Google Scholar] [CrossRef]
  81. Ning, J.; Xu, Q.; Feng, T.; Zhang, H.; Wang, T. Upper ocean response to two sequential tropical cyclones over the northwestern Pacific Ocean. Remote Sens. 2019, 11, 2431. [Google Scholar] [CrossRef]
  82. Xu, J.; Lei, Z.; Chen, W.; Chen, Q. Comparative Analysis of the Precipitation Effects of Typhoon ‘Lionrock’ and ‘Yuanfeng’ on Xiapu County. Strait Sci. 2022, 6, 8–12. [Google Scholar]
  83. Xu, F.; Cheng, Z.; Xia, M. Surface wave field under binary typhoons Sarika and Haima (2016) in South China Sea. Estuar. Coast. Shelf Sci. 2020, 241, 106802. [Google Scholar] [CrossRef]
Figure 1. Track and intensity changes of TCs, ‘Lionrock’ and ‘Kompasu’.
Jmse 12 00790 g001
Figure 2. (ah) Daily SST and SST variations in the Beibu Gulf and its adjacent waters from 7 to 14 October 2021. The wind field is the momentary wind field at 24 h per day and the black arrow is the wind speed (m/s) and direction, and the white dotted dashed line is the 20 m water depth isobath. The curve represents the TC movement path, where the color represents the TC class (the color corresponds to the specific class; see the legend of Figure 1). The red dot is the location of the buoy.
Jmse 12 00790 g002
Figure 3. (a) Variations of wind at the nearshore buoy observation station in the Beibu Gulf in October 2021. The gray shadow is the period when the buoy was affected by ‘Lionrock’ (the wind speed was greater than 9.12 m/s, the same as below), and the pink shadow is the period when the buoy was affected by ‘Kompasu’. The blue solid line is the reanalyzed ERA5 wind speed (m/s), and the red arrow is the wind direction; (b) Variations of temperature at the nearshore buoy observation station in the Beibu Gulf in October 2021. The red solid line is the buoy temperature (°C), and the blue solid line is the SST of the buoy station obtained via interpolation from CMEMS.
Jmse 12 00790 g003
Figure 4. (ah) Changes in sea surface heat flux in Beibu Gulf from 7 to 14 October 2021. The color bar represents the heat flux value (W/m2), and the white dotted dashed line is the 20 m water depth isobath.
Jmse 12 00790 g004
Figure 5. Changes in each component of sea surface heat flux at the north buoy station in the Beibu Gulf in October 2021. The gray shadow is the period when the buoy was affected by ‘Lionrock’ (the wind speed was greater than 9.12 m/s), and the pink shadow is the period when the buoy was affected by ‘Kompasu’.
Jmse 12 00790 g005
Figure 6. Geopotential height and temperature distribution map of Beibu Gulf on 16 October (a) and 22 October (b), 2021. (Geopotential height unit: 10 m).
Jmse 12 00790 g006
Figure 7. (ah) is the distribution of ERA5 wind field (vector arrows represent the wind field, and the position marked by a red pentagram in the figure is the center of the TC at that time) and Ekman pumping rate (the color bar represents the Ekman pumping rate) in the Beibu Gulf during ‘Lionrock’ and ‘Kompasu’ at 06:00 on 7–14 October 2021.
Jmse 12 00790 g007
Figure 8. (af) Distribution of SWH (m) and wind (black arrow size is wind speed (m/s) and direction) in Beibu Gulf and adjacent waters on 8–9 October 2021. The blue solid line is the ‘Lionrock’ track. The red dot is the location of the buoy.
Jmse 12 00790 g008
Figure 9. (af) Distribution of SWH (m) and wind (black arrow size is wind speed (m/s) and direction) in Beibu Gulf and adjacent waters on 12–13 October 2021. The blue solid line is the ‘Kompasu’ track. The red dot is the location of the buoy.
Jmse 12 00790 g009
Figure 10. (a)Variation of sea surface wind at Beibu Gulf Buoy Station in October 2021. Gray shading is the period when the buoy was affected by ‘Lionrock’, pink shading is the period when the buoy was affected by ‘Kompasu’, the blue solid line is the wind speed (m/s), and the red arrow is the wind direction; (b) Variation of SWH at Beibu Gulf Buoy Station in October 2021. The red solid line is the SWH observed by the buoy; the blue solid line is the SWH interpolated from CMEMS; the green solid line is the SWH computed by the SWAN model; and the black solid line is the SWH computed from the typhoon wave equation of Hao et al. [54].
Jmse 12 00790 g010
Figure 11. Wave energy input and dissipation at nearshore buoy station in the Beibu Gulf (a) and in offshore waters (b) on 6–14 October 2021. The gray shadow is the period when the buoy was affected by ‘Lionrock’ (the wind speed was greater than 9.12 m/s), and the pink shadow is the period when the buoy was affected by ‘Kompasu’.
Jmse 12 00790 g011
Table 1. Values of the SST decrease in the nearshore and offshore waters during ‘Lionrock’ and ‘Kompasu’ as well as temperature change impact factors.
Temperature (°C)Wind
(m/s)
Net Heat Flux
(W/m2)
EPV
(×10−4 m/s)
Lag Time
(h)
Nearshore
(buoy station, depth < 20 m)
−2.815.05−4184.011
−3.018.88−5355.89
Offshore
(Central Beibu Gulf basin, CBGB, depth 20~100 m)
−1.615.46−5451.2826
−1.220.14−8584.0011
Offshore
(Northwest South China, NWSCS, depth > 100 m)
−0.713.49−2911.3328
−0.818.33−6223.3329
The CBGB ranges from 107 to 109° E, 19 to 20.5° N; the NWSCS is 112 to 114° E, 16 to 20.5° N, and regional averages were calculated for each factor in the region to obtain the maximum value during the TC. In the above table, the numbers in gray font are for the ‘Lionrock’ period; the numbers in black font are for the ‘Kompasu’ period.
Table 2. Nearshore and offshore temperature data for the Beibu Gulf, October 2021.
Pre-LionrockDuring LionrockAfter Lionrock
(Pre-Kompasu)
During Kompasu
T (°C)SWHT (°C)SWH T (°C)SWH T (°C)SWH
(m)(m)(m)(m)
Nearshore
(Buoy station, depth < 20 m)
300.2127.21.5828.40.5725.42.3
Offshore
(Central Beibu Gulf basin, CBGB, depth 20~100 m)
301.128.43.5128.50.627.35.38
Offshore
(Northwest SCS, NWSCS, depth > 100 m)
29.52.228.83.59291.5228.26.39
After Kompasu
(Pre-Cold Air on the 16th)
During Cold Air on the 16thAfter Cold Air on the 16th
(Pre-Cold Air on the 22rd)
During-Cold Air on the 22ndAfter Cold Air on the 22rd
T(°C)SWHT(°C)SWHT(°C)SWHT(°C)SWHT(°C)SWH)
(m)(m)(m)(m)(m)
Nearshore
(Buoy station, depth < 20 m)
26.60.24250.8226.50.2324.61.1525.40.32
Offshore
(Central Beibu Gulf basin, CBGB, depth 20~100 m)
27.51.24273.127.50.1726.42.3326.80.38
Offshore
(Northwest SCS, NWSCS, depth > 100 m)
28.51.0328.24.1128.30.9227.83.0227.81.78
The CBGB ranges from 107 to 109° E, 19 to 20.5° N; the NWSCS is 112 to 114° E, 16 to 20.5° N.
Disclaimer/Publisher’s Note: The statements, opinions and data contained in all publications are solely those of the individual author(s) and contributor(s) and not of MDPI and/or the editor(s). MDPI and/or the editor(s) disclaim responsibility for any injury to people or property resulting from any ideas, methods, instructions or products referred to in the content.