Article

Mechanism of Speed Loss Reduction and Propulsion Efficiency Improvement of ONR Tumblehome with Active-Controlled Stern Flaps in Resonance Waves

1
School of Naval Architecture and Ocean Engineering, Dalian Maritime University, Dalian 116026, China
2
Department of Ocean Engineering, Texas A&M University, College Station, TX 77843, USA
*
Author to whom correspondence should be addressed.
J. Mar. Sci. Eng. 2024, 12(5), 822; https://doi.org/10.3390/jmse12050822
Submission received: 17 April 2024 / Revised: 10 May 2024 / Accepted: 12 May 2024 / Published: 14 May 2024
(This article belongs to the Section Ocean Engineering)

Abstract

:
The stern flap is a practical hull appendage equipment that enhances ship navigation performance and saves energy. The existing studies mainly focus on the fixed stern flap, other than an actively controlled one, so it is worth further exploring its effect and mechanism. By implanting the PID controller to the stern flap, this paper proposed a free-running CFD model on the ONRT (the Office of Naval Research Tumblehome) ship coupled with the active-controlled stern flap to investigate the hydrodynamic performance in resonance waves. The free-running performance in calm water and regular waves is numerically researched and verified versus the experimental and referenced results. Then, the effect of different PID coefficients and control strategies of the stern flap on the traveling speed, attitudes, and propulsion performance under the resonance wave condition is conducted, and the influence mechanism is explored. The results show that adopting a fixed flap controller and PID controller can reduce the original speed loss by 4.2% and 6.9%, respectively, and increase the average propulsive efficiency of the propeller by 1.0% and 1.4%, respectively. Further analysis reveals that the global effect of the suppressed motion attitudes due to the installation of the fixed flap effectively contributes to the resistance reduction. However, the local effect of the stern flap increases the resistance due to interaction with the propeller and stern. The PID-controlled stern flap exhibits similar average attitudes compared to the fixed one, which means the resistance reduction of the global effect is kept the same, and the active stern flap further improves the stern flow field, where the resistance increment of the local effect is weakened, enhancing the traveling speed and improving the propulsion efficiency.

1. Introduction

Installing appendages on ships has become an important approach to reduce resistance and save energy. Among different appendages, the stern appendage stands out as a preferred solution for many ships to improve their navigation performance and achieve energy-saving and emission-reduction goals due to its ease of installation, lower cost, technological maturity, and significant effectiveness. The stern appendage mainly includes the interceptor, stern wedge, and stern flap. Its primary function is to reduce trim and decrease resistance by increasing the lift at the stern, thereby improving the ship’s motion characteristics. This effect is particularly significant at high speeds, making it commonly used on high-speed boats [1,2]. Since the 1980s, the United States Navy has extensively researched applying stern flaps on naval vessels. Extensive full-scale test data and model test results have shown that the installation of stern flaps can increase the vessels’ maximum speed, reduce fuel consumption, and improve propeller cavitation characteristics, where the expected fuel cost savings within less than a year can offset the installation expenses of the stern flaps [3,4,5]. Specifically, the installation of stern flaps with fixed angle ranges from 3 deg to 10 deg on hundreds of ships [6] that receive considerable benefits, like fuel savings ranging from 2 to 7% [7], a 7.6% reduction in required output power [8], and a large amount of cost saving [9].
The CFD (Computational Fluid Dynamics) approach has been widely used in the research of stern flap problems to study the details of stern flap–ship interaction. Atsuo Maki et al. [10] investigated the effect of stern flaps on resistance through towing tank model experiments and CFD analysis, where the wave resistance reduction is regarded as the result of the influence of the stern flaps on the stern waves. Different sizes and fixed angles of the stern flap on resistance research conducted by Jadmiko et al. [11] using NUMECA Fine Marine software indicated that the best reduction effect occurred at a stern flap angle of 4° and a chord length of 1% Lpp, resulting in a 3.5% reduction in resistance at 28 knots. At higher speeds, the Froude number ranges from 0.334 to 0.50; the stern flaps obviously influenced the flow field at the stern and, consequently, affected propulsion performance, ultimately reducing energy consumption [12,13]. For the planning boat with the Froude number ranging from 0.88 to 5.20, the resistance reduction effect becomes even more remarkable, with stern flap angles of 2 deg, 3 deg, and 4.5 deg [14].
The mechanism of the stern flap on ships has been researched in different aspects. Zhang et al. [15] used the URANS method to study the drag reduction and energy-saving mechanism of the fixed stern flaps on a trimaran with waterjet propulsion. The result shows that the global effect due to motions and local effects referenced to the stern flap and the waterjets are the leading causes of drag increase, with the non-linear coupling term of local effects contributing the most to drag reduction. Li et al. [16] and Budiarto et al. [17] studied the effect of stern flaps on a ship in regular waves and high-speed conditions, respectively, and Tripath and Vijayakumar’s found that flaps affect trim, sinkage, and propulsion, while the wave suppression improves performance [18].
As noticed from the literature review, the existing studies are mainly focused on the fixed stern flap effect. In the latest research, Zhang et al. [19] applied the rotated stern flap on a trimaran to investigate its effect on motions and propulsion performance, and the result showed that the pitch and heave attitude were effectively reduced, and the propulsor revolution decreased by about 4.2% in random waves. However, the deep mechanism of how the active rotated stern flap works on the speed and propulsion performance promotion needs further investigation. Meanwhile, the traditional CFD model relies on the relative motion assumption: the vessel is fixed in the surge direction, which could not fully reflect the real-time interaction of the stern flap–hull–propeller and its influence on speed and propulsion performance directly. This demands a CFD model that frees surge freedom, the so-called free-running CFD model, which has been widely validated and applied in self-propulsion simulations [20,21] and direct maneuvering computations [22]. To bridge this gap in the above aspect, the present research proposed a free-running CFD model coupled with an active-controlled stern flap on the ONRT vessel in resonance waves to research the effect of different control algorithms and the mechanism on navigation performance. Both the global effect due to the motion attitude variation and the local effect due to the stern flap–propeller–stern interaction on the resistance are discussed, which reveals the speed loss reduction and propulsion efficiency promotion mechanism of the fixed stern flap and active-controlled one.

2. CFD Method and Control Model

2.1. RANS Equations

The viscous flow CFD numerical simulation, applied in various research fields [23,24,25,26,27,28,29,30], is based on the RANS (Reynolds-averaged Navier–Stokes) equations in the present research. The mass conservation continuity equation and the momentum conservation governing equation of incompressible fluid are as follows:
u i x i = 0
u i t + x j ( u i u j ) = 1 ρ p x i + ν x j ( u i x j + u j x i ) + τ i j x j + f s ρ
where in the above two formulas, ρ, p, ν, and fs represent fluid density, average pressure, kinematic viscosity coefficient, and source term, respectively. ui and xi (xj) are the velocity vector and coordinate vector of tensor representation in the Cartesian coordinate system, respectively, where i, j = 1, 2, and 3. τ i j = u i u j ¯ is the second-order tensor form of the Reynolds stress term, which needs to be calculated by the turbulent transport equation. The SST k ω turbulence model is used to solve the Reynolds stress term of the RANS equations in this paper.

2.2. ONR Tumblehome Ship and Control Model

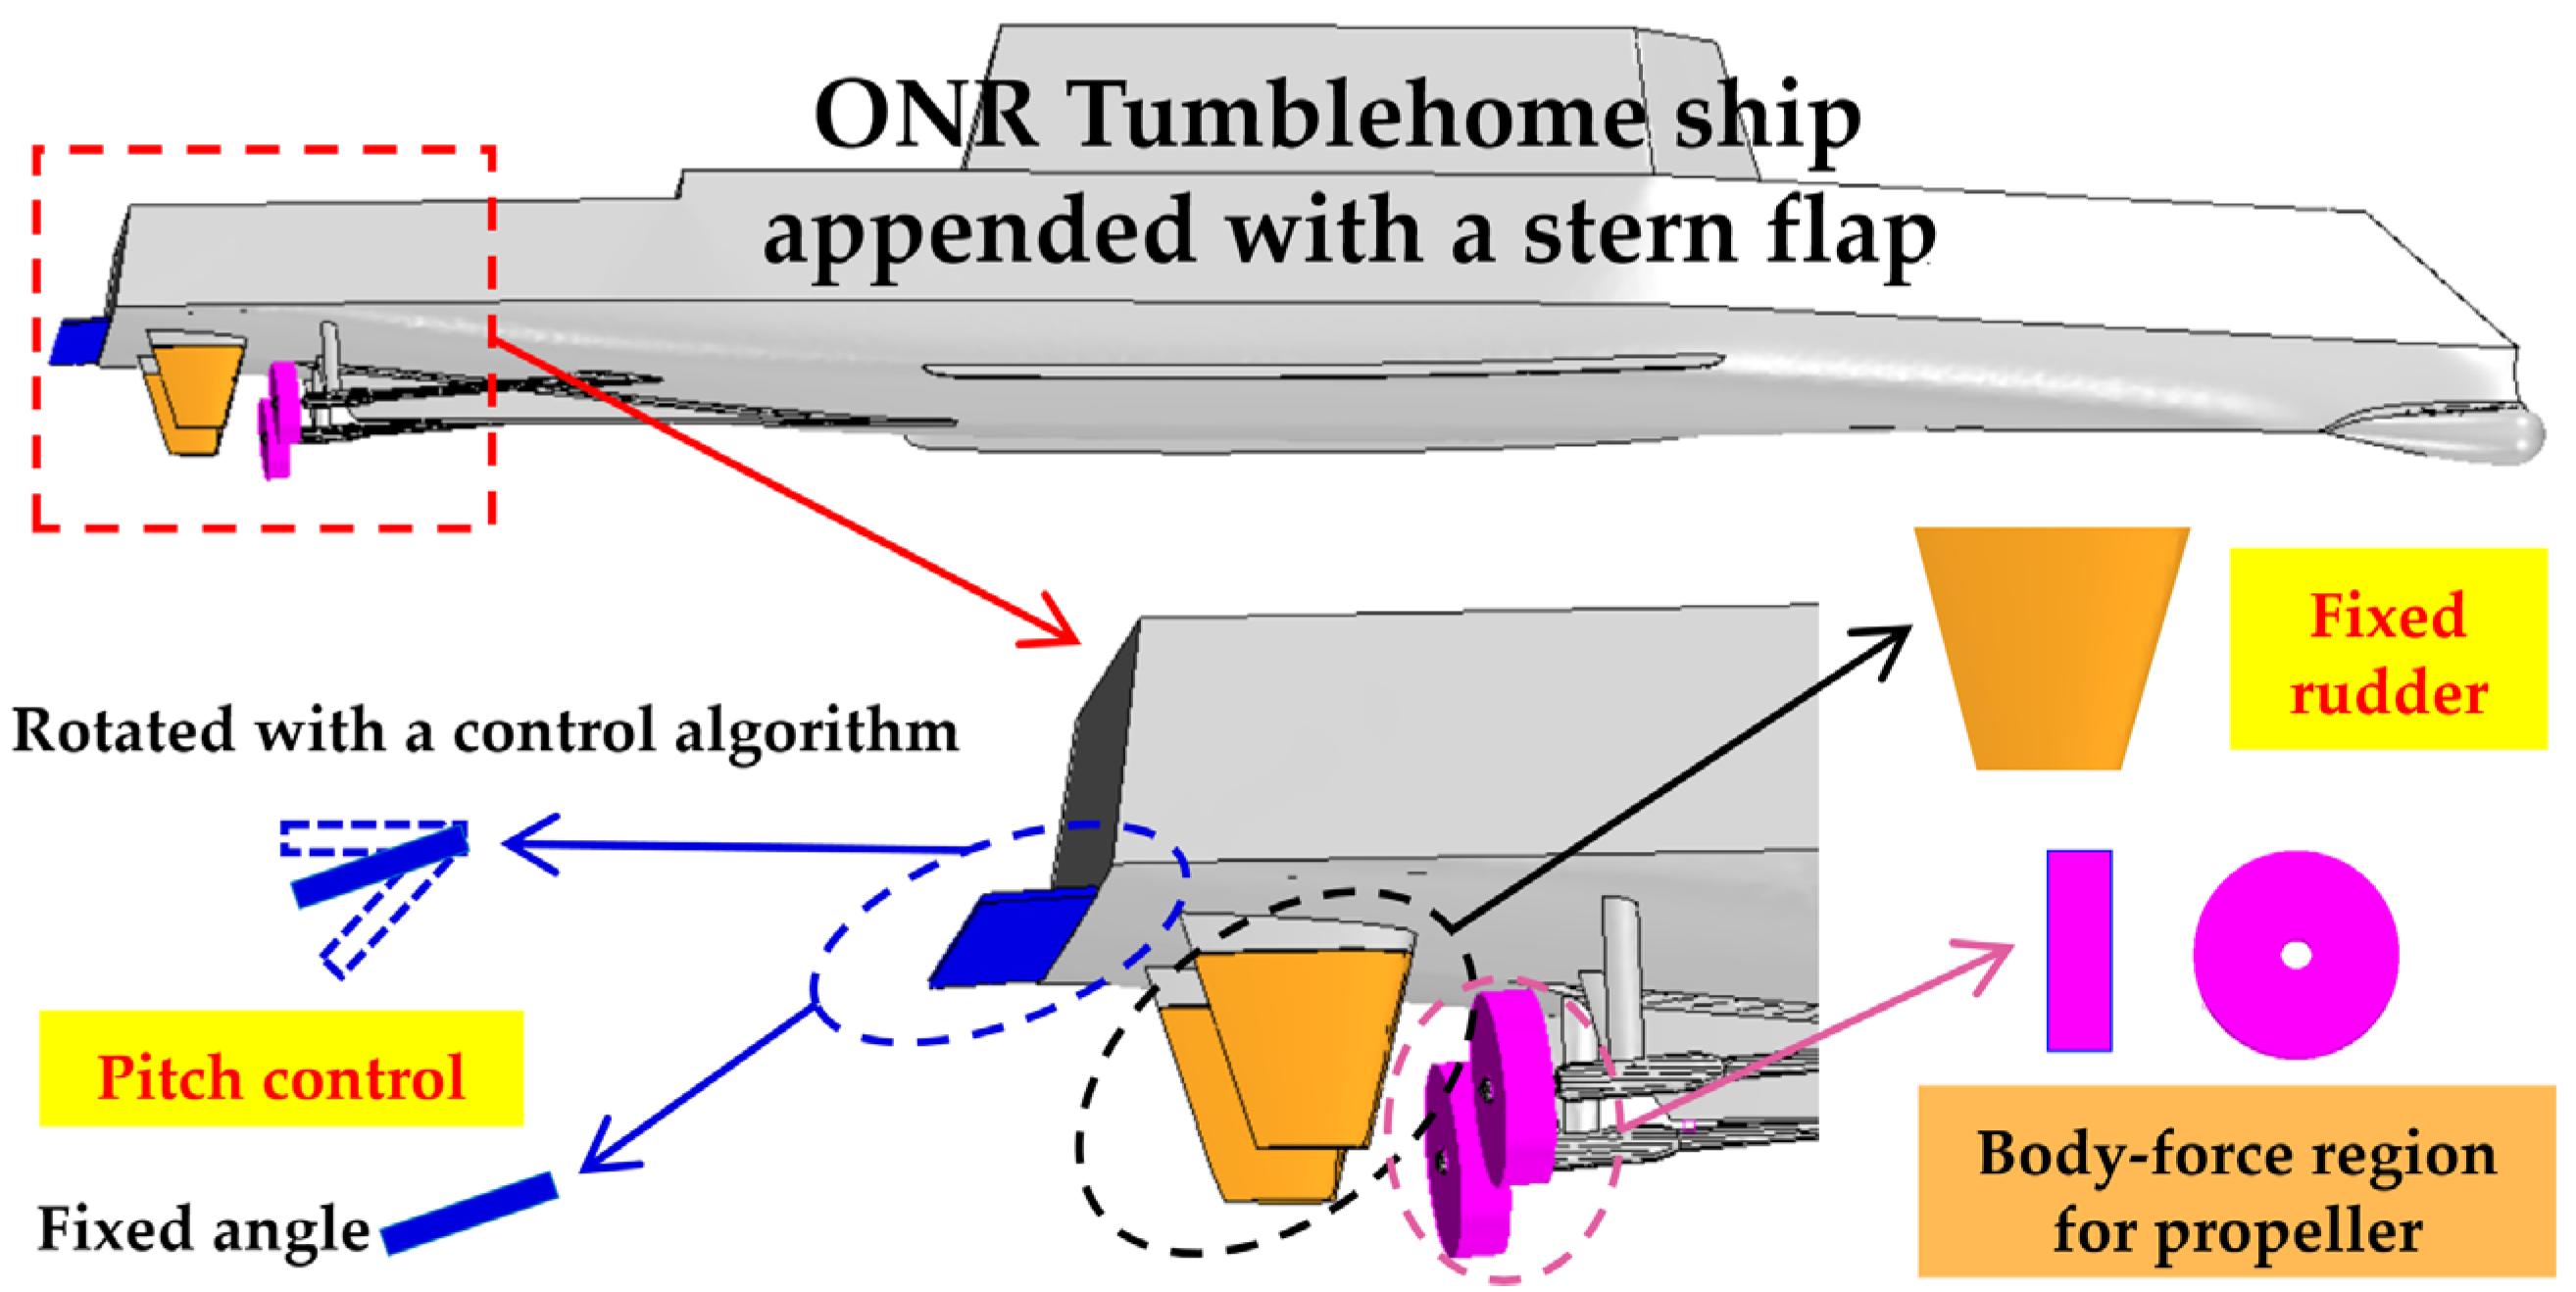
The fundamental research and model test data of the ONRT ship model are publicly available at the Workshop on CFD in Ship Hydrodynamics of Tokyo 2015 [31]. The principal data and physical model of the ONRT ship model are shown in Figure 1. The right-handed coordinate system is adopted in simulations where the origin is at the stern axis and baseline intersection, and the x-axis points to the bow. The ONRT ship of the present research contains three degrees of freedom: surge, pitch, and heave. The propeller controls the hull speed, while pitch and heave are controlled by a stern flap, as shown in Figure 2.

2.2.1. Propulsion Model

The restriction of the CFL (Courant–Friedrichs–Lewy) condition in simulating the rotation of the actual propeller, proposed by ITTC 2014 [32], needs to control the propeller rotating at 0.5–2.0 degrees per time step, leading to a large time consumption. The body force method (BFM), applying the virtual disk model on the propeller disk domain to simulate the propeller/hull interaction, which has been widely used in the propulsion model of ship self-propulsion and maneuverability CFD simulations [33,34], can save considerable computation resources. Present simulations adopt the propeller’s characteristic performance curves on the virtual disk region, where the EFD open water ONRT propeller data (Figure 3) were used, and the propeller could be effectively simulated with reasonable accuracy for time saving and lower computational cost.

2.2.2. Speed Control Strategy

The PID-controlled propeller is applied in the self-propulsion simulation, reaching and maintaining the target heading speed. Taking the velocity difference as the error term, the revolution can be expressed as follows [21,35]:
n = P e + I 0 t e d t + D d e d t = P v ( V A V N ) + I v i = 2 N T ( 2 V 0 V i V i 1 ) Δ t / 2 + D v a v
In the above formula, n is the propulsor revolution, and the unit is RPM (r/min) or RPS (r/s). Each coefficient subscript v represents the corresponding coefficient of velocity difference, respectively. P, I, and D are the corresponding proportional term, integral term, and differential term coefficients. The specific values are set according to the different conditions of the research object; a is the acceleration of the proportional deviation term. VA, Vi, and VN are the target vessel speed, the speed at simulated time steps I, and the current speed (at the simulated time steps NT).

2.2.3. Pitch and Heave Control Strategy

The adaptively rotated stern flap and the fixed one are considered stabilizers for the pitch and heave control in the present research. The equations of the PID controller and the fixed angle stern flap are as follows [19]:
θ S F = P θ ( θ 0 θ N ) + I θ i = 2 N T ( 2 θ 0 θ i θ i 1 ) Δ t / 2 + D θ a θ ( P I D C o n t r o l ) θ S F = C ( F i x e d C o n t r o l )
In the above formulas, θSF represents the angle between the stern flap and the horizontal plane. Θ0, θi, and θN are the target pitch value, the pitch at simulated time steps I, and the current pitch (at the simulated time steps NT). Pθ, Iθ, and Dθ are the corresponding proportional term, integral term, and differential term coefficients. C represents a constant fixed angle of the stern flap.

3. Free-Running CFD Model and Validation

3.1. Self-Propulsion of the ONRT Ship Model in Calm Water

For the traditional self-propulsion CFD model with a fixed background domain, the ship’s longitudinal freedom is restricted, and the ship’s traveling is relatively realized by inputting the constant ship speed at the inlet boundary, which makes the direct calculation of the speed loss impossible. However, by releasing the ship’s surge freedom and enabling the background domain horizontally moves with the hull motion domain synchronously, the free-running CFD model could be established to realistically simulate ship motions without freedom limitation, which has been widely validated in our previous research [19,21,35].
In the viscous CFD numerical simulation, especially for complex ship models and free-surface flows, the mesh needs to be meticulously processed. High-quality hull surface mesh, reasonable turbulent boundary layer mesh, sufficiently thin free-surface mesh, and a sufficient total grid contribute significantly to successful simulations. The commercial CFD software Star-CCM+ v14.06 is used to perform the simulations. The computational domain of the ONRT simulation model is as illustrated in Figure 4, with a 4.5Lpp × 3.0Lpp × 1.5Lpp cubic domain and a relatively small motion domain around the hull. Figure 4 also shows the grid detail of the two domains, with a locally refined mesh generated among the free-surface elevation range and the hull motion domain. The prism layer is set with six layers with a growth factor of 1.414, and the y+ value of the hull surface is less than 100. The numerical simulation uses the SST kω turbulence model, the near-wall flow field is solved by the two-layer all y+ method, and the VOF method is applied to track and capture the free surface. Rigid hull motions are released in pitch, heave, roll, and surge using the Dynamic Fluid Body Interaction (DFBI) scheme for the free-running model, while the background domain horizontally moves at the same pace.
Roy [36] defined the refinement ratio rg as it relates to the total grid number while using the trimmed volume grids. The grids of the calculation region in three coordinate directions are uniformly refined; the refinement ratio r of the 3D simulation is expressed as follows:
r g = ( N f i n e N c o a r s e ) 1 / 3
where Nfine and Ncoarse are the total grid number of the specified density. Generally, at least three sets of grid densities are required to analyze the grid convergence. S1, S2, and S3 represent the computational results of fine, medium, and coarse grid density; then, the convergence ratio is given as follows:
R G = ( S 1 S 2 S 2 S 3 )
Then, the estimated order of accuracy PRE and the distance metric to the asymmetric range PG are written as follows:
P R E = ln ( 1 / R G ) ln r g P G = P R E P G t h
where PGth is the theoretical order of accuracy. Grid uncertainty is calculated as follows:
U G = ( 2.45 0 . 85 P G ) S 1 S 2 r g P R E 1 , 0 < P G < 1 = ( 16.4 P G 14 . 8 ) S 1 S 2 r g P R E 1 , P G > 1
For the grid independence analysis, three kinds of grid density are generated, coarse (1.0 M), medium (1.8 M), and fine (3.1 M), with a mean refinement ratio of 1.2. The self-propelled free-running simulations are carried out at Fr = 0.2. Accounting for the lower computation cost, the BFM with the input open water curves of the real propeller is applied in the rotational region. Compared with the traditional self-propulsion simulation, which needs at least three calculations to obtain the SP point using the interpolation between the drag and thrust curves, the free-running model with the PID controller could obtain an accurate converged SP point in a one-time simulation. The propeller revolution and total resistance convergence curves of the ONRT ship model under different grid densities are shown in Figure 5, and the corresponding uncertainty results are listed in Table 1.
Figure 5a shows the propeller revolution curves. At the given ship model speed Vm = 1.11 m/s, the propeller revolution controlled by PID reacts rapidly after the start of the simulation, reaching the maximum of close to 13.0 RPS in a fraction of a second; then, it rapidly drops to 9.0 RPS and then stabilizes at 9.4 RPS, fluctuating up and down until basically stable. The simulated propeller revolution curves with three different density grids show the same fluctuation trend. The convergence value is 9.55 RPS for the coarse grids, 9.44 RPS for the medium grids, 9.36 RPS for the fine grids, and the experiment result is 8.97 RPS. The relative errors between the three methods and the experimental results are 6.47%, 5.24%, and 4.35%, respectively, as listed in Table 1. Hosseini [37] also uses the BFM to simulate the self-propulsion performance in calm water, which obtains a 5.8% relative error of propeller revolution in fine grids (about 3.7 M grids). In comparison, Wang [20] performed the simulation using the real propeller appeared with an error of −1.7% (about 7.0 M grids). Comparing the results of the present simulations with the above two results, we can see that the predicted propeller revolution using the BFM has a small overshoot prediction, mainly due to the limitation of the BFM using just open water propulsion hydrodynamic performance results. In general, the relative error of the fine grids is the smallest at 4.35%, and the uncertainty is 4.06 %D.
Similar to the variation trend of the curves in Figure 5a, the hull resistance curves in Figure 5b show the fluctuating convergence process. The simulation errors of three different density grids are 3.96% for coarse grids, 2.42% for medium grids, and 1.32% for fine grids. It can be seen that the resistance error is smaller than that of the propeller revolution under different grids, and the relative error decreases gradually with the increase in grid density. The resistance uncertainty is 4.59 %D, which indicates that the relative error and uncertainty of resistance are within the acceptable range.
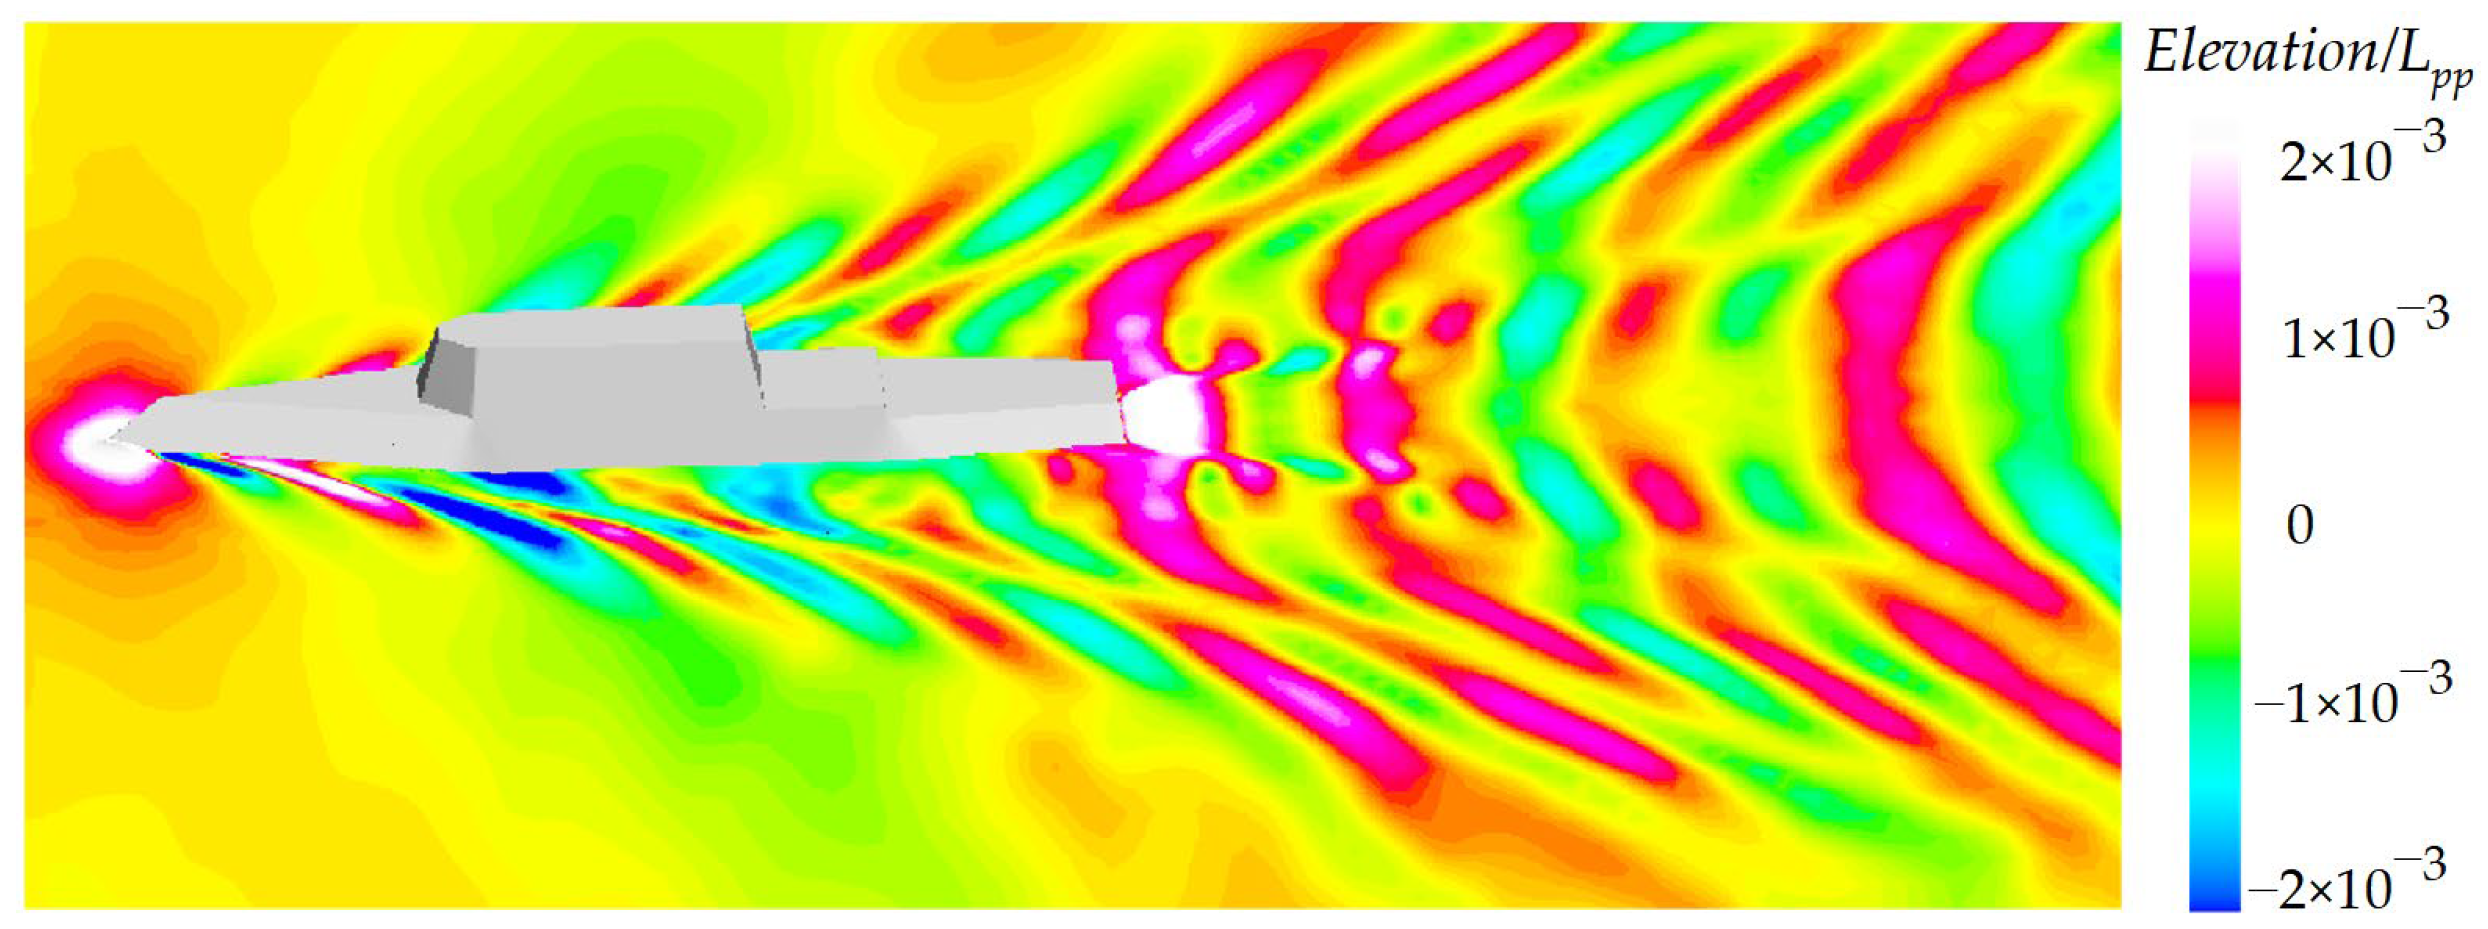
Figure 6 shows the wave pattern of the present simulation of the fine mesh results, where the free surface is captured well with sufficient details that are in good agreement with Wang’s simulation [20].
In general, the relative error of the fine mesh’s propeller revolution and hull resistance are within 4.4% and 1.4%, respectively. Meanwhile, the stabilized ship traveling wave matches the reference wave pattern well. The above results show that the present viscous CFD simulations with a PID-controlled propeller applying the BFM in the rotational region could effectively simulate the ONRT free-running self-propulsion in calm water.

3.2. Free-Running ONRT Ship Model in Resonance Wave

Referring to the ONRT model test conditions and test results provided by the hydrodynamic CFD working group at the Tokyo 2015 meeting, the model was appended with full appendages and released at six degrees of freedom. The model test result in the resonance head wave is selected as a reference to validate the present direct CFD approach for the free-running simulations in regular waves. The wave length is λ = 1.0Lpp and the wave height is H = 0.02Lpp. The ship model moves forward at an initial speed of VA = 1.11 m/s, with the fixed propeller revolution obtained from the calm water SP point.
Numerical simulations are set up using the same computation domain and turbulence models as described in Section 3.1. The medium mesh refinement strategy is applied, and additional near-free-surface grid refinement is added, resulting in a total grid of 2.74 M. The fifth-order Stokes wave was generated on the inlet boundary and initially propagated in the whole domain. The EOM-based wave forcing conditions are applied in the inlet, side, and outlet boundary to reduce the wave reflection. With the numerical simulation literately processing, the ship’s attitude, forward speed, propulsion torque, and thrust showed a stable periodic change, which indicated that the free-running simulation in the regular wave reached convergence. Figure 7 shows the trend of the advancing speed and attitude variations during the stabilization process and is compared with the model test and reference results. In the abscissa of the coordinate, T and Te represent the simulated time and the stable mean encountering period of each datum, respectively, while in the numerical simulation. In the vertical ordinate, A represents the wave amplitude, k is the wave number, and u/VA is the dimensionless surge velocity.
In Figure 7a, the dimensionless velocity gradually shows stable fluctuations after decreasing at the beginning, consistent with the reference and the speed test curve. The speed curve is between the reference and the model test curve. The stable average values of the present computation, model test, and reference are 0.811, 0.814, and 0.797. The difference in the computation result compared with the two referenced data is 0.3% and 1.7%, respectively. Moreover, the speed stability fluctuation range is 0.793~0.825 and 0.778~0.848, and the difference between the upper and lower fluctuation limits is 1.9% and −2.7%. The results show that the speed variation, fluctuation, and mean value obtained by the present simulation are in good agreement with the model test. In Figure 7b,c, the variation in pitch and heave shows relatively stable fluctuations. The mean dimensionless pitch and heave are 0.48 and 0.55, respectively. Compared with the model test result, the difference in heave is relatively minor. Overall, the simulated result is highly consistent with the model test and the reference data in the periodic fluctuation stage.
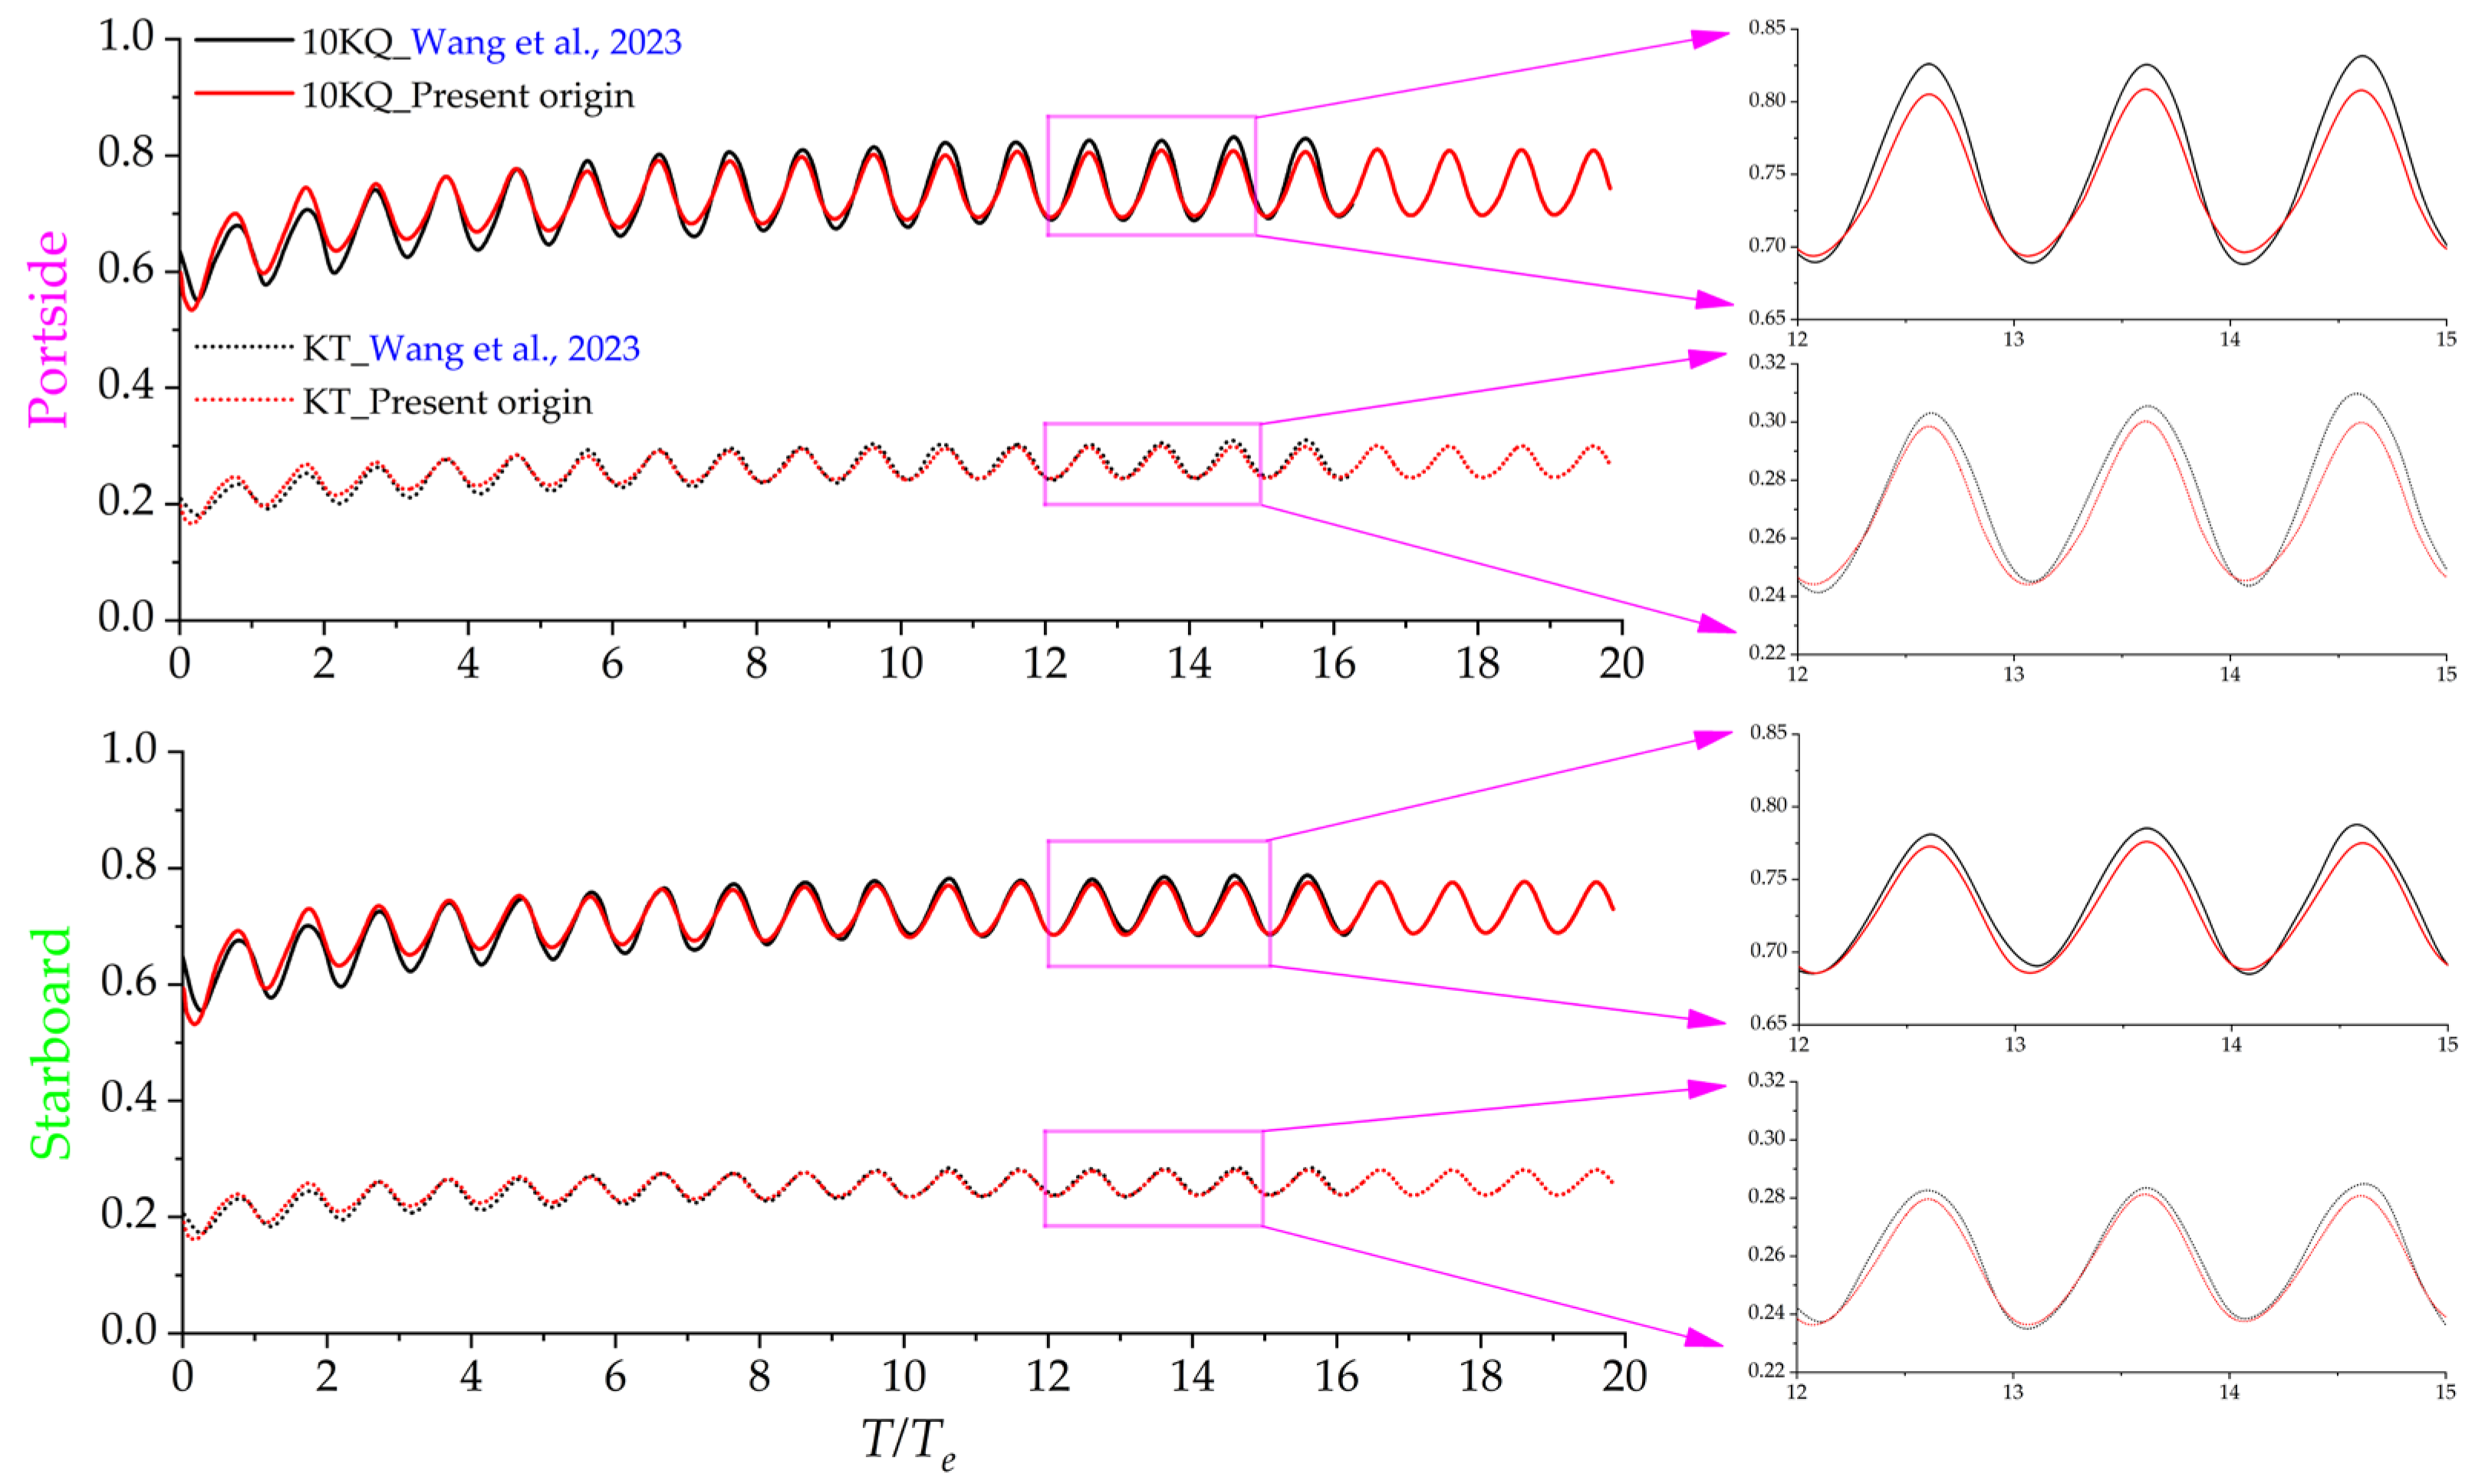
The performance curve of the propellers is shown in Figure 8. The two propellers are rotated inward. It can be seen that the KT and 10 KQ curves of the star propeller are slightly lower than that of the port one, which is due to the original difference between the two open water curves (Figure 3). Thus, the fluctuation range of the port propeller is larger. The simulation results are compared with the calculation curves of Wang’s paper [39] (the x-axis has been transformed from Vt/L to T/Te in this paper), which illustrates that the fluctuation trend and amplitude range of the simulated results are close to the references.
To track the wave generation effects, two elevation gauges, P1 and P2, were set at 0.5 Lpp, beside the bow and 0.64 Lpp, in front of the bow, respectively, and the dimensionless wave elevation time-history curves are displayed in Figure 9. For the experimentally measured value, due to the complex environmental impact in the actual wave generation process, there will be some differences in wave crests and troughs in different wave periods. However, the overall stable mean amplitude distributes at 0.01. The mean dimensionless wave amplitude of the two gauges in the present simulation is 0.01. After 14 periods where the traveling speed reaches stable fluctuation, the generated waves coincide with the model test measured results. The present wave generation effects of the resonance waves obtained the expected simulation results.
The above comparison and analysis of the numerical simulations of the free-running ONRT ship model in calm water and regular waves indicate the reliability of the present CFD free-running simulation approach.

4. Effect of Active-Controlled Stern Flaps on ONRT in Resonance Waves

4.1. Computational Model with Active Stern Flaps

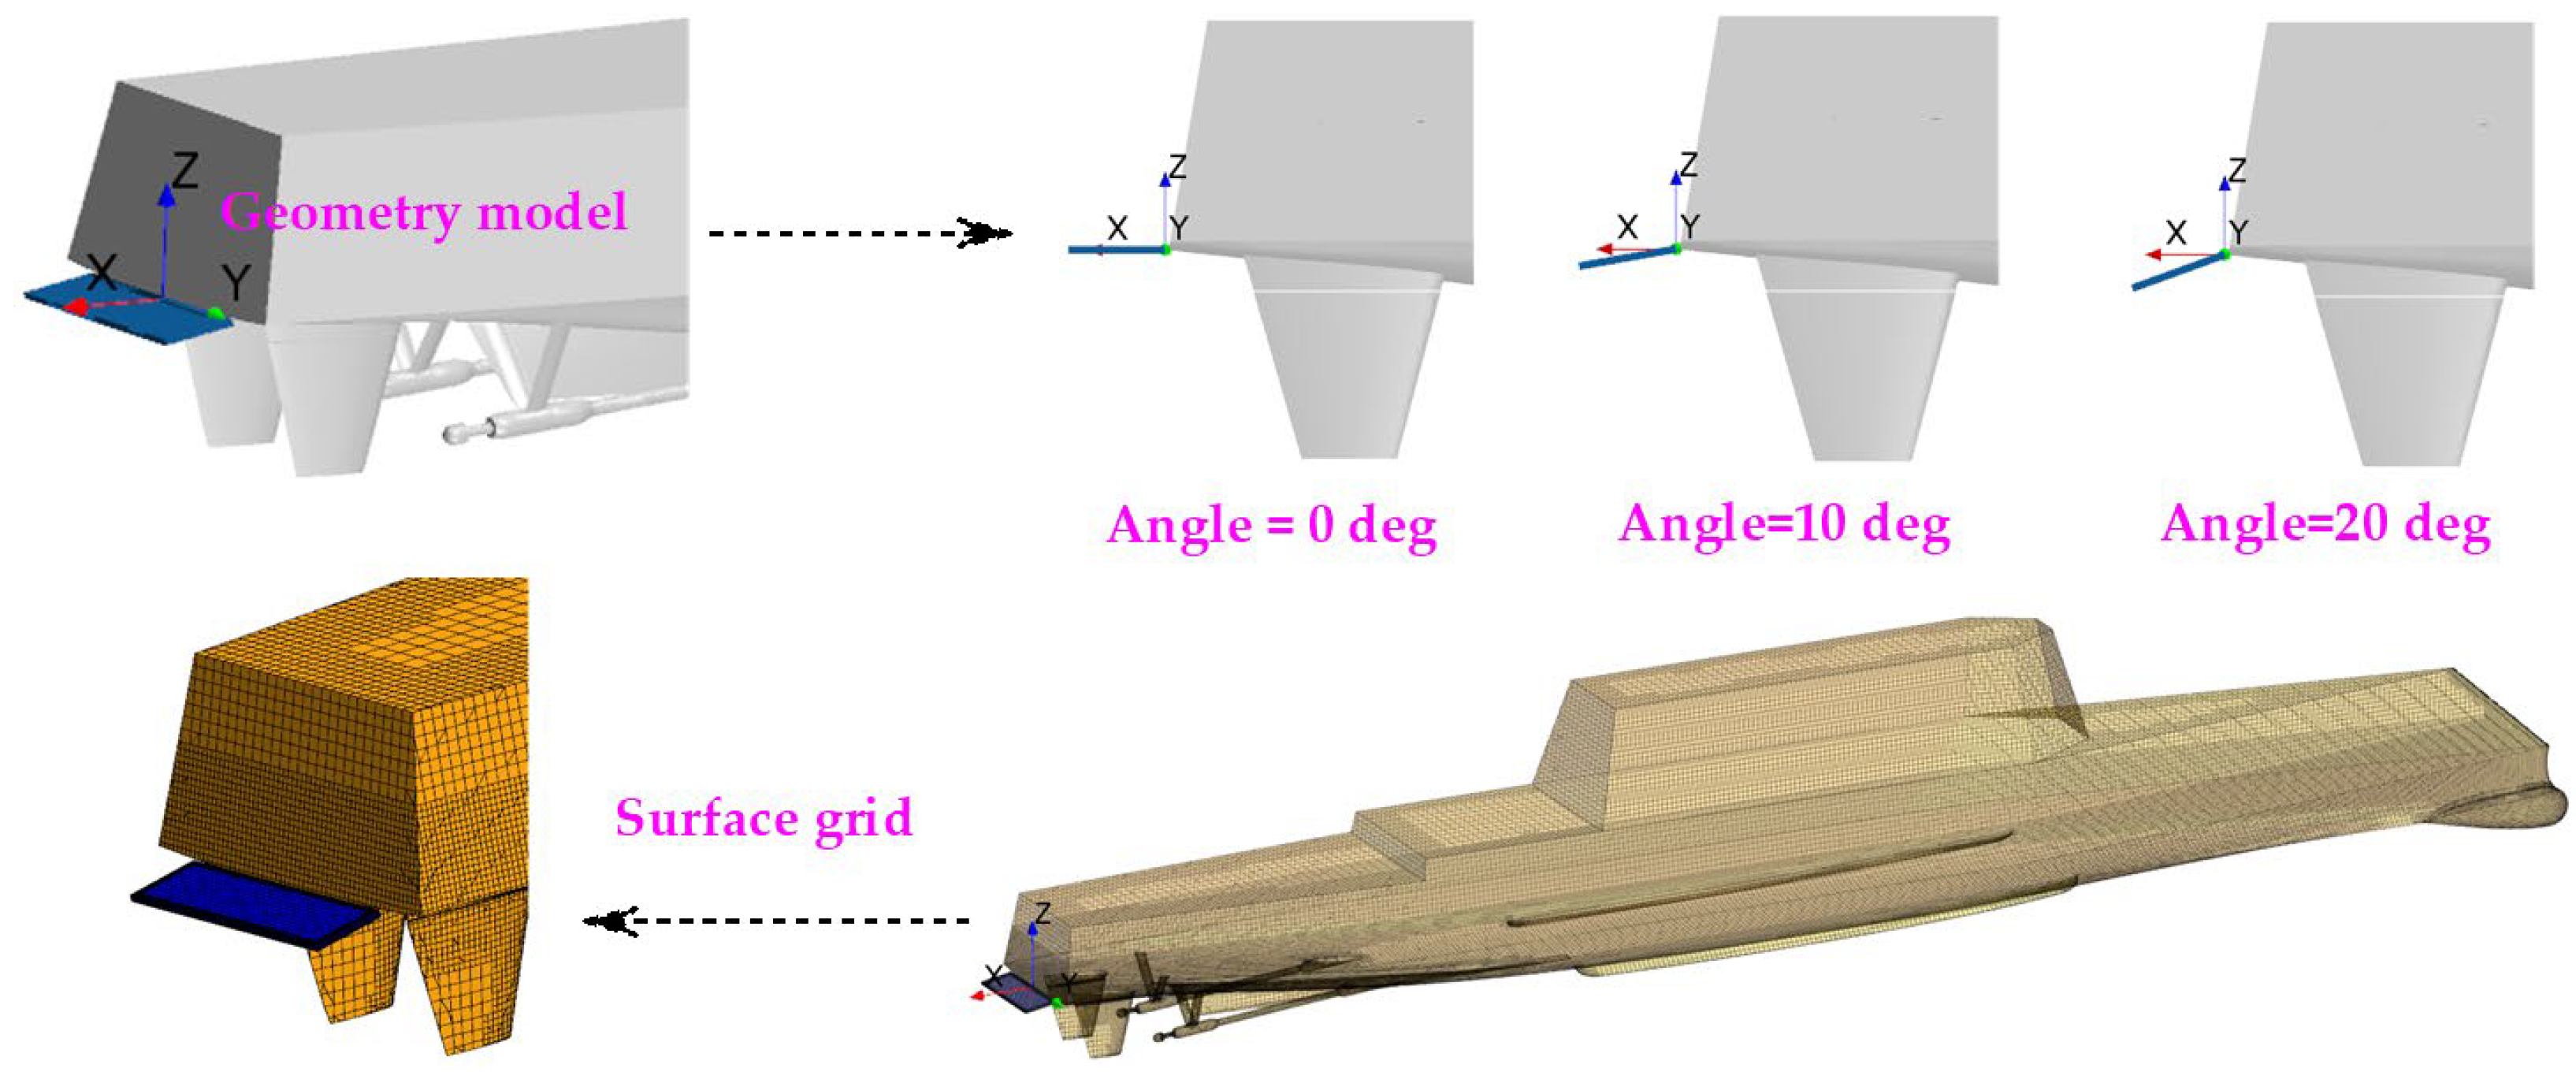
The active stern flap control of the ONRT ship in resonance waves is conducted based on the free-running model described above. The stern flap motion domain is added using the overlapping grid technique, which enables rotation around the lower edge of the main hull transom. Based on our previous research result [15], the 0.02L length stern flap was found to reduce trim and resistance in calm water effectively. Therefore, this length is selected for this study, as illustrated in Figure 10 which displays the model details. The rotation range of the stern flap is set as 0–20 deg, and the initial condition is 10 deg. Using a control algorithm, the added stern flap generates the force and moment that impacts the speed, heave, and pitch. Based on the above CFD free-running model with 2.74 M grids, the added stern flap overset domain brings 0.22 M more grids, resulting in a total of 2.96 M grids. The mesh details of the hull and stern are shown in Figure 10.

4.2. Research Schemes

This paper intends to study the stern flap with different control strategies to improve the navigation and propulsion performance of ONRT ships in the wave. Firstly, the computed results of the ONRT model without the stern flap in resonance waves are used as the benchmark data. Then, the following numerical simulation study with the control of the stern flap is conducted:
  • Effect of different P coefficients of the stern flap controller;
  • Effect of different combinations of PID coefficients of the stern flap controller;
  • Comparison of the fixed stern flap angle and the PID controller.

4.3. Effects of P Coefficients on the Stern Flap Controller

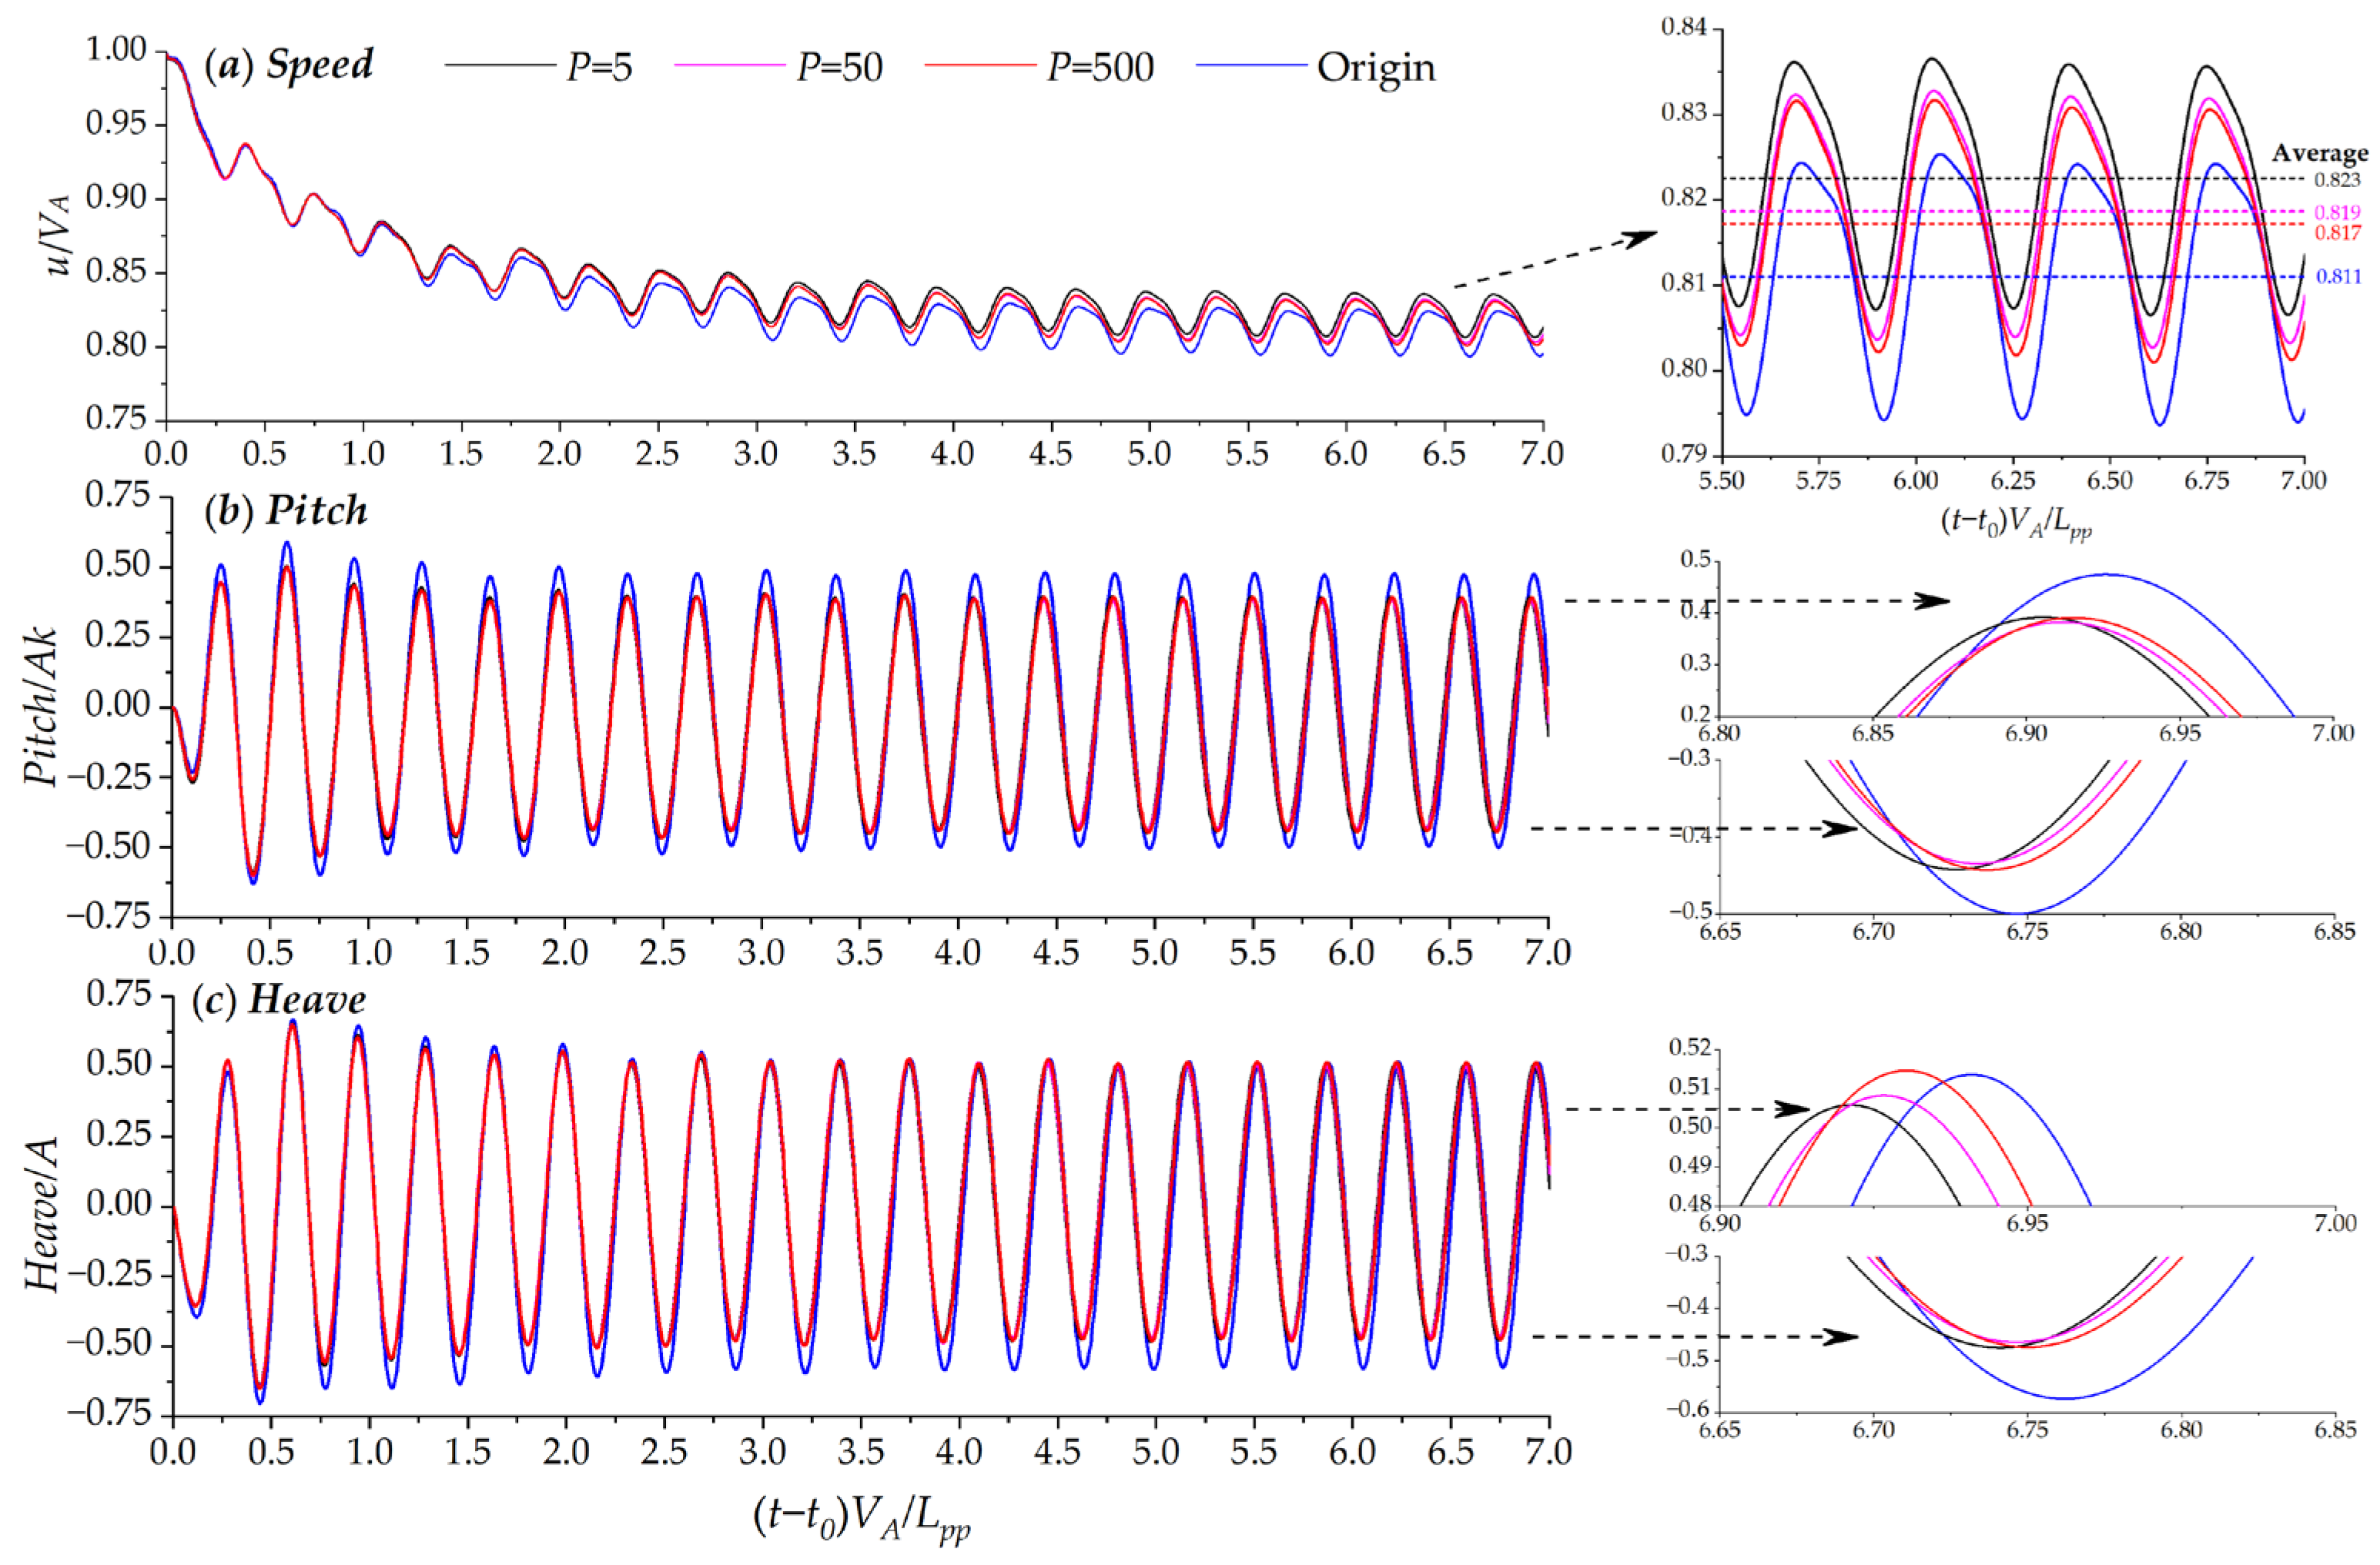
P-values of 5, 50, and 500 were used to study the effects of the P coefficient. Figure 11 shows the contrast curves of the dimensionless speed, pitch, and heave. After the speed curve of the ONRT vessel reaches a stable fluctuation, the mean speed results of P = 5, 50, and 500 are computed as 0.823, 0.819, and 0.817, which increased by about 1.5%, 0.9%, and 0.8% from the initial benchmark value of 0.811 (ONRT without the stern flap). For the full-scale ONRT vessel at Fr = 0.2, the calm water speed is 15.10 kn and the average speed in the resonance wave is 12.24 kn. After the active control of the stern flap with P = 5, 50, and 500 coefficients, the speed can be increased by 0.175 kn, 0.116 kn, and 0.094 kn successively. The result indicates that the P = 5 coefficient can bring reasonable speed gain.
The smaller fluctuation amplitude of pitch and heave under the control of different P coefficients indicates that torque and vertical force generated from the automatically controlled stern flap suppress the hull motion amplitude, effectively reducing it. Specifically, the peak and trough of the pitch under P control are reduced by 16% and 11%, respectively, while the heave is reduced by 2% and 17%, respectively. The above results of the single P control indicate that P = 5 shows advantages in the speed and motion attitude control performance of ONRT.

4.4. Effects of PID Coefficient Combination on the Stern Flap Controller

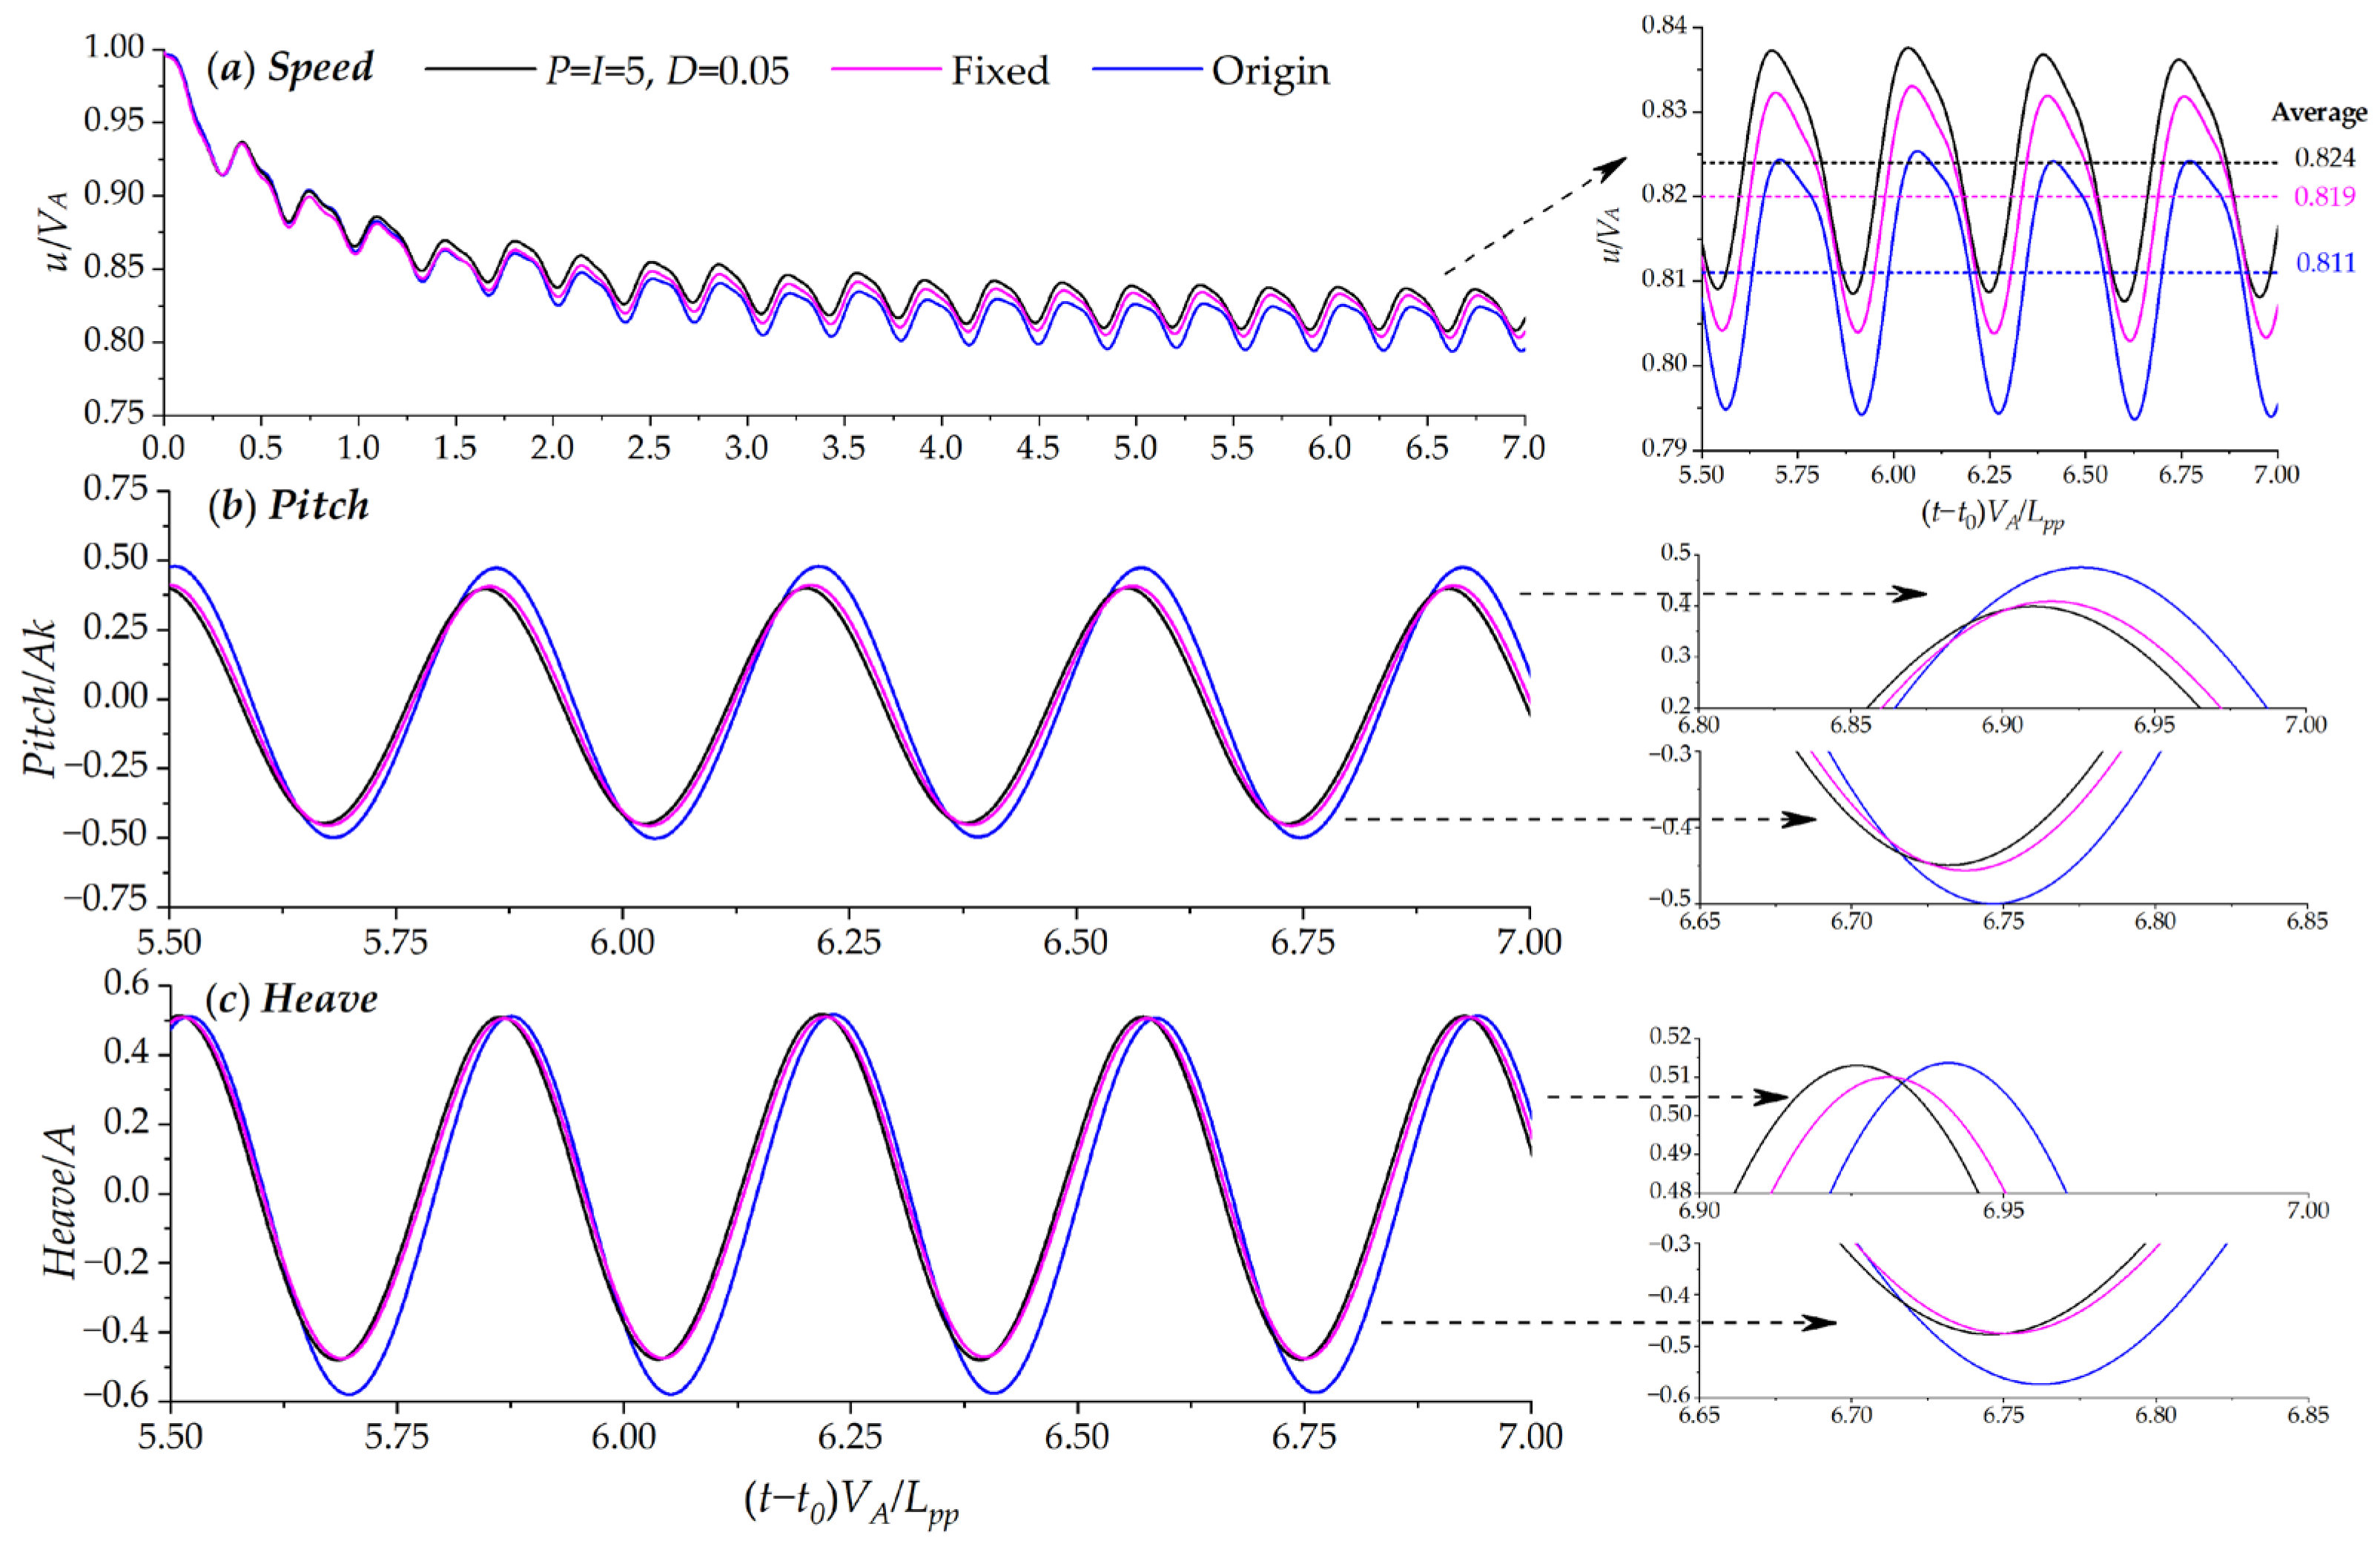
Considering three different combinations of PID control coefficients, P = I = 50, D = 0.05; P = I = 50, D = 0.5; and P = I = 500, D = 5, the influence of the automatic control stern flap on the navigation performance of ONRT vessels in waves is analyzed, as illustrated in Figure 12. The comparison results of speed, pitch, and heave in Figure 12 show that the average stable dimensionless speed of the three cases is 0.824, 0.819, and 0.818, respectively, with the average speed increasing by 1.6%, 1.0%, and 0.9%. For the control coefficients of P = I = 50, D = 0.05, the peak and trough of speed increased by 3.5%, corresponding to the increased average speed of the full-scale vessel by 0.193 kn, which is higher than the increment of a single P control. The pitch and roll amplitude are effectively reduced under the three combinations of the PID coefficients. Specifically, the reduction of pitch and roll reaches 16% and 17%, respectively, for the case of P = I = 50, D = 0.05, which was close to the motion amplitude under a single P = 5 coefficient control.

4.5. Mechanism of the Performance Improving of the Active Stern Flap and Discussions

The results of the above P = I = 5, D = 0.05 control coefficients are compared with a fixed stern flap with 10deg, and the results are shown in Figure 13. The average dimensionless speed of the ONRT vessel with the fixed stern flap is 0.819, which is about 1.0% higher than the referenced base data and slightly lower than that of the PID-controlled stern flap. The fluctuation amplitude range of the pitch and heave for the fixed stern flap is consistent with the results of the PID controller, which are both effectively reduced. The comparison results of the three cases indicate that the active-controlled stern flap improves the overall navigation performance more effectively.
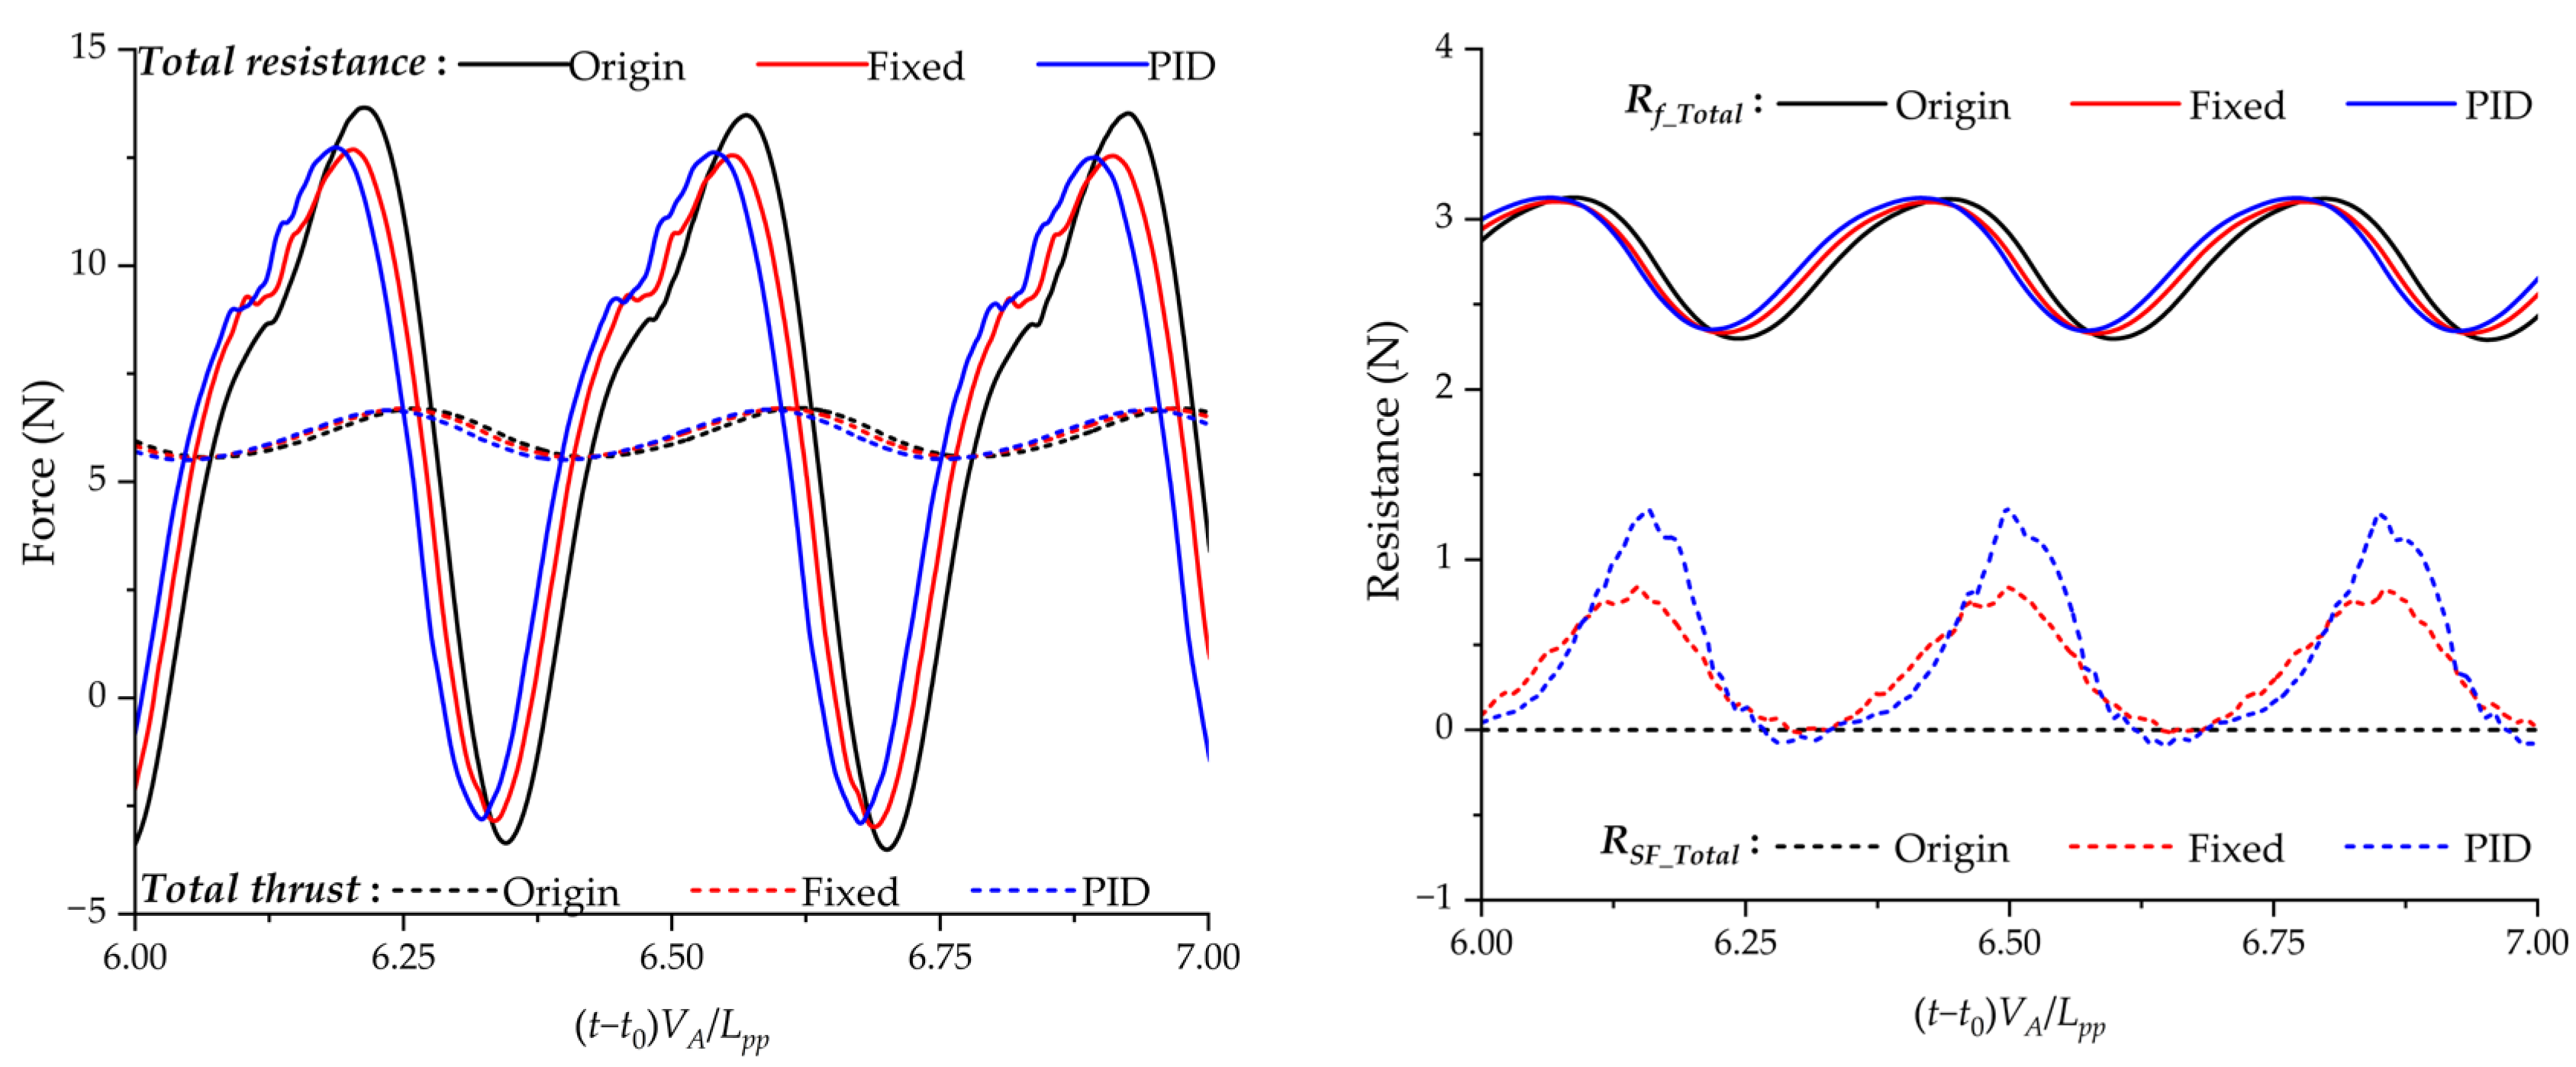
The following discussion focuses on how the two different control modes of fixed and actively controlled stern flaps affect ship resistance and propulsion performance. Figure 14 below shows the change in total resistance and total thrust without a stern flap, with a fixed stern flap, and with a PID active-controlled stern flap. It can be seen that the resistance fluctuation range is nearly ten times larger than the thrust. In the two cases with the stern flap, the resistance peak value is almost the same, smaller than the benchmark resistance. By comparing the overall friction resistance, we can see that the primary difference is not significant, and the peak value of the stern flap itself in the resistance under the active control of PID is slightly larger than that of the fixed one.
After the qualitative analysis of the data curves under the three conditions above, the average results of the speed, resistance, propulsion efficiency, and motion amplitude ranging from the three periodic data after stable fluctuations were selected for analysis and listed in Table 2. The previous study [15] shows that after the installation of the stern flap, the resistance change can be divided into two parts. The main contribution is the so-called “global effect”, where the reduced motion attitude due to the suppression of the stern flap makes the overall hull resistance reduced. On the other hand, the so-called “local effect”, where the stern flap interacts with the propeller and hull stern, increases the resistance due to the blocking effect and the flow field changes. Specifically, for the ONRT vessel in the resonance waves in the present study, regarding the listed results in Table 2, the fixed stern flap reduces the original speed loss by about 4.2%. The primary mechanism of speed loss reduction is the same as above, where the dimensionless pitch and heave are reduced by 0.067 and 0.045. That is, the fixed stern flap reduces the overall resistance by 0.7% under the coupling effect of the global effect and the local effect, and the propulsion efficiency of the two propellers increases by 1.0% on average, resulting in the original speed loss reduction of 4.2%.
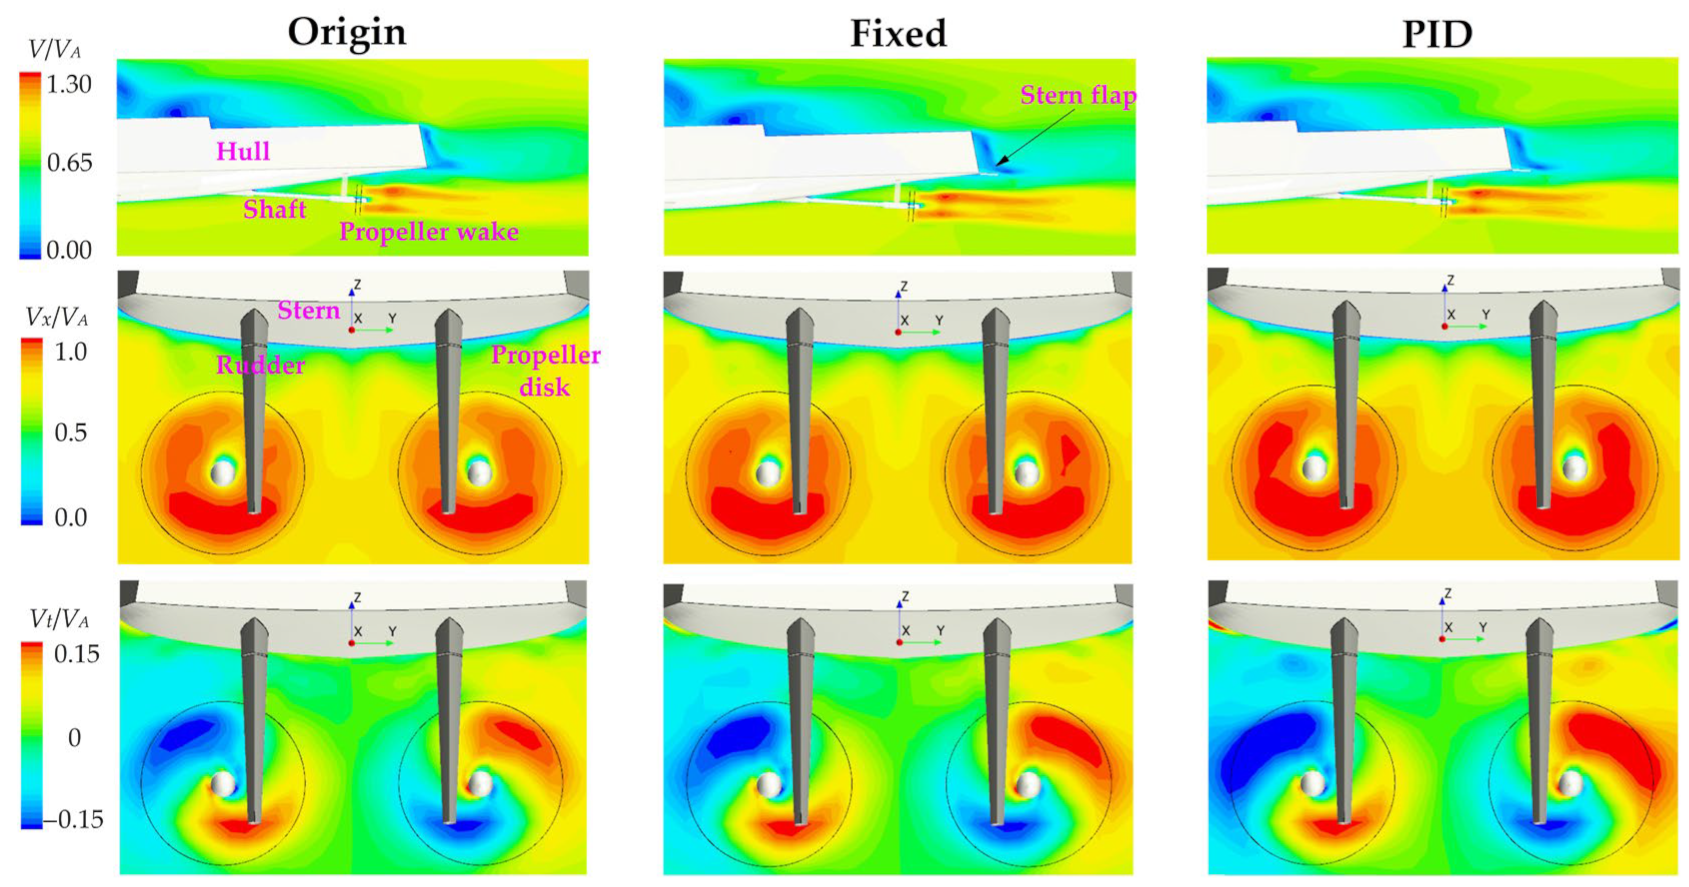
On this basis, the speed of ONRT ships is further increased after adopting the strategy of PID active control, where the reduction reaches 6.9% compared with the original speed loss, and the average efficiency of the two propellers is increased by 1.4%. Notably, the motion attitude amplitude of the two conditions with the stern flap is almost the same, indicating that the drag reduction of the global effect is consistent. The further enhancement of the drag reduction effect and propulsion efficiency is due to the weakening of the local effect brought by the active-controlled stern flap at the stern. That is, from the perspective of the flow field, the active-controlled stern flap improves the flow field generated from the stern flap–propeller–stern interaction, which reduces the resistance caused by the blocking effect, makes the flow field smoother, and improves the propulsion efficiency. Figure 15 illustrates the profile of the velocity distribution at stern. As the traveling speed gradually increases, the high-speed flow wake area after the fixed stern flap and PID control stern flap is longer successively, and the axial and radial velocity distribution at the propeller disk is more extensive successively, indicating that the advance coefficient and propulsion efficiency of the propeller is improved.
The above analysis reveals that the fixed flap installation suppresses the heave and pitch motion variations of the vessel, resulting in a resistance decrease in global effects caused by the reduction in motion amplitude. The local effect of the stern flap, which blocks the stern wave flow, leads to the local increment of resistance. The overall influence of the global and local effects brings an average speed loss reduction of 4.2% and an average propulsive efficiency improvement of 1.0%. On the other hand, the PID-controlled stern flap exhibits average attitudes similar to those of the fixed flap. The difference is that the active-controlled stern flap improves the stern’s local flow and reduces the stern flap’s local effect or block effect. As a result, the additional average speed loss reduction decreases by 2.7%, and the average propulsive efficiency improves by 0.4%.

5. Conclusions

By coupling the speed and active control strategies to the propulsor and stern flap, direct CFD-based research of the speed loss and propulsion efficiency on a free-running ONRT vessel with a stern flap appendage in resonance waves is conducted. The mechanism of the global effect and local effect of different control strategies of the stern flap on the resistance, speed loss reduction, and propulsion performance are discussed. The conclusions are as follows:
(1)
Dimensionless speed and motion attitudes result from different single P coefficients, and PID coefficients show that the control coefficient of P = I = 5, D = 0.05 shows comprehensive advantages, where the speed loss is reduced by 6.9% and propulsion efficiency is promoted by 1.4% compared with the original ONRT vessel without the stern flap.
(2)
The 10 deg fixed flap installation suppress the heave and pitch motion variations of ONRT, resulting in a resistance decrease in global effects caused by the reduction in motion amplitude. The local effects of the stern flap–propeller–stern interaction, which blocks the stern flow field, lead to the local resistance increment. The overall influence of the global and local effects brings an average speed loss reduction of 4.2% and an average propulsive efficiency improvement of 1.0%.
(3)
Furthermore, the stern flap controlled by the PID strategy exhibits similar average attitudes compared to the fixed flap. This indicates that the global effect of attitude on resistance is nearly the same for the two cases. Through further suppressing at the stern trim state and releasing at the bow trim state of the stern flap by the PID controller, the resistance increment of the local effect is weakened. As a result, the average speed loss decreases by an additional 2.7%, and the average propulsive efficiency improves by 0.4% compared with the ONRT vessel with a 10° fixed stern flap.
(4)
The present work preliminary researched the active-controlled stern flap on the navigation performance effect and mechanism on the ONRT vessel in resonance waves and relatively low Fr. However, the numerical results between different models show relatively small differences, which may be related to the ship type, considered model, and traveling condition, especially the speed. Further research on different stern appendages, higher speeds, and wave conditions could be meaningful for the promotion of navigation performance.

Author Contributions

Conceptualization, L.Z., Y.S. and J.Z.; methodology, L.Z. and Y.S.; software, L.Z., Y.S., C.D. and Y.N.; validation, L.Z., Y.S. and C.D.; formal analysis, L.Z. and Y.S.; investigation, L.Z. and Y.S.; resources, L.Z. and J.Z.; data curation, L.Z., C.D. and Y.N.; writing—original draft preparation, L.Z.; writing—review and editing, L.Z., Y.S. and J.Z.; visualization, L.Z., C.D. and Y.N.; supervision, J.Z.; project administration, L.Z. and J.Z.; funding acquisition, L.Z. and J.Z. All authors have read and agreed to the published version of the manuscript.

Funding

This research was funded by the National Key Research and Development Program (2022YFC2805200); China COSCO Shipping Corporation Limited (Numerical and Experimental Technology Research of Ship Navigation Performance in High Sea States, 2023-2-Z001-02-01); the project funded by China Postdoctoral Science Foundation (2023M740466); the Natural Science Foundation of Liaoning Province (2021-MS-138); the Scientific Research Fund of Liaoning Provincial Education Department (LJKZ0042); and the Fundamental Research Funds for the Central Universities (3132023123).

Institutional Review Board Statement

Not applicable.

Informed Consent Statement

Not applicable.

Data Availability Statement

The data are available upon request.

Conflicts of Interest

The authors declare no conflicts of interest.

References

  1. Grigoropopulos, G.J.; Loukakis, T.A. Effect of wedges on the calm water resistance of planing hulls. In Proceedings of the First International Conference on Marine Industry, Varna, Bulgaria, 2–7 June 1996. [Google Scholar]
  2. Grigoropopulos, G.J. The use of spray rails and wedges in fast monohulls. In Proceedings of the 4th International Conference on High Speed Marine Vehicles (HSMV ’97), Naples, Italy, 21–23 March 1997. [Google Scholar]
  3. Cusanelli, D.S.; O’Connell, L. US Coast Guard Island Class 110 WPB: Stern flap evaluation and selection (Model 5526). In Hydromechanics Directorate Report, 1999; NSWCCD: Potomac, MD, USA, 1999. [Google Scholar]
  4. Pogorzelski, D.; Adamos, E.G. Energy saving alternatives for U.S. Coast Guard (USCG) boats. In Hydromechanics Directorate Report, 2001; NSWCCD: Potomac, MD, USA, 2001. [Google Scholar]
  5. Cusanelli, D.S.; Barry, C.D. Stern flap performance on 110 ft patrol boat WPB 1345 STATEN ISLAND. In Hydromechanics Directorate Report, 2002; NSWCCD: Potomac, MD, USA, 2002. [Google Scholar]
  6. Cusanelli, D.S. Hydrodynamic and supportive structure for gated ship sterns: Amphibious ship stern flap. J. Ship Prod. Des. 2012, 28, 182–190. [Google Scholar] [CrossRef]
  7. Blackburn, W.K. Otter: An Optimized Transit Tool and Easy Reference; Naval Postgraduate School: Monterey, CA, USA, 2016. [Google Scholar]
  8. Cusanelli, D.S.; Chesnakas, C.J. Joint High Speed Sealift (JHSS) Baseline Shaft & Strut (BSS) Model 5653-3: Series 2, Propeller Disk LDV Wake Survey; and Series 3, Stock Propeller Powering and Stern Flap Evaluation Experiments; Report; NSWCCD: Potomac, MD, USA, 2007. [Google Scholar]
  9. O’Rourke, R. Navy Ship Propulsion Technologies: Options for Reducing Oil Use-Background for Congress; Report, 2016; University of North Texas Libraries, UNT Digital Library, UNT Libraries Government Documents Department: Washington, DC, USA, 2016; Available online: https://digital.library.unt.edu/ark:/67531/metacrs9419/ (accessed on 11 May 2024).
  10. Maki, A.; Arai, J.; Tsutsumoto, T.; Suzuki, K.; Miyauchi, Y. Fundamental research on resistance reduction of surface combatants due to stern flaps. J. Mar. Sci. Technol. 2016, 21, 344–358. [Google Scholar] [CrossRef]
  11. Jadmiko, E.; Arief, I.S.; Arif, L. Comparison of stern wedge and stern flap on fast monohull vessel resistance. Int. J. Mar. Eng. Innov. Res. 2018, 3, 41–49. [Google Scholar] [CrossRef]
  12. Song, K.W.; Guo, C.Y.; Wang, C.; Sun, C.; Li, P.; Wang, W. Numerical analysis of the effects of stern flaps on ship resistance and propulsion performance. Ocean Eng. 2019, 193, 106621. [Google Scholar] [CrossRef]
  13. Song, K.W.; Guo, C.Y.; Wang, C.; Sun, C.; Li, P.; Zhong, R.F. Experimental and numerical study on the scale effect of stern flap on ship resistance and flow field. Ships Offshore Struct. 2020, 15, 981–997. [Google Scholar]
  14. Zou, J.; Lu, S.; Jiang, Y.; Sun, H.; Li, Z. Experimental and numerical research on the influence of stern flap mounting angle on double-stepped planing hull hydrodynamic performance. J. Mar. Sci. Eng. 2019, 7, 346. [Google Scholar] [CrossRef]
  15. Zhang, L.; Zhang, J.N.; Shang, Y.C. Stern flap–waterjet–hull interactions and mechanism: A case of waterjet-propelled trimaran with stern flap. J. Offshore Mech. Arct. Eng. 2020, 142, 021203. [Google Scholar] [CrossRef]
  16. Li, Y.; Li, A.; Gong, J.; Fu, Z.; Dai, K. Numerical investigation on added resistance and motions of a high-speed trimaran equipped with T-foil and stern flap in regular head and oblique waves for varying wave steepness. J. Braz. Soc. Mech. Sci. Eng. 2021, 43, 451. [Google Scholar] [CrossRef]
  17. Budiarto, U.; Samuel, S.; Wijaya, A.A.; Yulianti, S.; Kiryanto, K.; Iqbal, M. Stern flap application on planing hulls to improve resistance. Int. J. Eng. 2022, 35, 2313–2320. [Google Scholar] [CrossRef]
  18. Tripathi, S.; Vijayakumar, R. Numerical and experimental study of stern flaps impact on resistance and propulsion of high–speed displacement ships. Ocean Eng. 2024, 292, 116483. [Google Scholar] [CrossRef]
  19. Zhang, L.; Chen, H.; Wei, Y.; Zhang, Y.; Shang, Y.; Zhang, J. Active longitudinal motion control of waterjet-propelled trimaran in random waves using direct CFD approach integrated with auto-control algorithm. Ocean Eng. 2023, 286, 115586. [Google Scholar] [CrossRef]
  20. Wang, J.H.; Zhao, W.W.; Wan, D.C. Free maneuvering simulation of ONR tumblehome using overset grid method in naoe-FOAM-SJTU solver. In Proceedings of the 31st Symposium on Naval Hydrodynamics, Monterey, CA, USA, 11–16 September 2016. [Google Scholar]
  21. Zhang, L.; Wei, Y.; Deng, Y.; Yin, H.; Zhang, Y.; Shang, Y.; Zhang, J. A comparative investigation of fixed and free-running CFD self-propulsion models on a waterjet-propelled trimaran. Ocean Eng. 2021, 232, 109081. [Google Scholar] [CrossRef]
  22. Carrica, P.M.; Mofidi, A.; Eloot, K.; Delefortrie, G. Direct simulation and experimental study of zigzag maneuver of KCS in shallow water. Ocean Eng. 2016, 112, 117–133. [Google Scholar] [CrossRef]
  23. Bakica, A.; Vladimir, N.; Malenica, Š.; Im, H. Numerical procedure for Pre-Swirl Stator structural integrity evaluation. Ocean Eng. 2022, 258, 111698. [Google Scholar] [CrossRef]
  24. Obwogi, E.O.; Shen, N.; Su, Y. The design and energy saving effect prediction of rudder-bulb-fin device based on CFD and model test. Appl. Ocean. Res. 2021, 114, 102814. [Google Scholar] [CrossRef]
  25. Bakica, A.; Malenica, Š.; Vladimir, N.; Senjanović, I. Hydroelastic analysis of Pre-Swirl Stator. Mar. Struct. 2022, 85, 103267. [Google Scholar] [CrossRef]
  26. Kim, J.; Choi, J.; Choi, B.; Chung, S.; Seo, H. Development of energy-saving devices for a full slow-speed ship through improving propulsion performance. Int. J. Nav. Archit. Ocean. Eng. 2015, 7, 390–398. [Google Scholar] [CrossRef]
  27. Shang, Y.C.; Horrillo, J.J. Numerical simulation and hydrodynamic performance predicting of 2 two-dimensional hydrofoils in tandem configuration. J. Mar. Sci. Eng. 2021, 9, 462. [Google Scholar] [CrossRef]
  28. Shang, Y.C.; Nikolaos, I.X. Numerical analysis of hydrodynamic performance of FX-83-W hydrofoil current turbine. In Proceedings of the ASME 2017 International Mechanical Engineering Congress and Exposition, Tampa, FL, USA, 3–9 November 2017. [Google Scholar]
  29. Yao, H.L.; Wang, L.J.; Zhang, H.X.; Liu, Y. Wake physics of two-dimensional flapping-hydrofoil turbines. Phys. Fluids 2023, 35, 105104. [Google Scholar] [CrossRef]
  30. Gong, J.; Li, Y.; Jiang, F.; Fu, Z. Prediction of turn and zigzag maneuvers with the hydrodynamic derivatives obtained by SQCM. Ocean Eng. 2024, 304, 117812. [Google Scholar] [CrossRef]
  31. IIHR. ONR tumblehome free-running test data for CFD workshop Tokyo 2015. In Proceedings of the Tokyo 2015 a Workshop on CFD in Ship Hydrodynamics, Tokyo, Japan, 2–4 December 2015. [Google Scholar]
  32. ITTC. ITTC-Recommended Procedures and Guidelines: Practical Guidelines for Ship Self-Propulsion CFD; ITTC: Copenhagen, Denmark, 2014. [Google Scholar]
  33. Feng, D.; Yu, J.; He, R.; Zhang, Z.; Wang, X. Improved body force propulsion model for ship propeller simulation. Appl. Ocean. Res. 2020, 104, 102328. [Google Scholar] [CrossRef]
  34. Kim, D.; Tezdogan, T.; Incecik, A. Hydrodynamic analysis of ship manoeuvrability in shallow water using high-fidelity URANS computations. Appl. Ocean Res. 2022, 123, 103176. [Google Scholar] [CrossRef]
  35. Zhang, L.; Zhang, J.N.; Shang, Y.C. A practical direct URANS CFD approach for the speed loss and propulsion performance evaluation in short-crested irregular head waves. Ocean Eng. 2021, 219, 108287. [Google Scholar] [CrossRef]
  36. Roy, J.; Heintzelman, C.; Roberts, S. Estimation of numerical error for 3D inviscid flows on Cartesian grids. In Proceedings of the 45th AIAA Aerospace Sciences Meeting, Reno, NV, USA, 8–11 January 2007. [Google Scholar]
  37. Hosseini, H.S. CFD Prediction of Ship Capsize: Parametric Rolling, Broaching, Surf-Riding, and Periodic Motions; University of Iowa: Iowa, IA, USA, 2009. [Google Scholar]
  38. Aram, S.; Kim, S.E. A numerical study of added resistance, speed loss and added power of a surface ship in regular head waves using coupled URANS and rigid-body motion equations. In Proceedings of the VII International Conference on Computational Methods in Marine Engineering, CIMNE, Nantes, France, 15–17 May 2017; pp. 960–974. [Google Scholar]
  39. Wang, S.; Kim, B.S.; Zhu, Z.; Kim, Y. Numerical course-keeping tests of ONR tumblehome in waves with different rudder control strategies. Ocean Eng. 2023, 269, 113584. [Google Scholar] [CrossRef]
Figure 1. The main dimensions of the ONRT model.
Jmse 12 00822 g001
Figure 2. The ONRT ship model with a stern flap.
Jmse 12 00822 g002
Figure 3. Experimental open water characteristic performance of the ONRT propellers.
Jmse 12 00822 g003
Figure 4. The computational domain (left) and gird detail (right).
Jmse 12 00822 g004
Figure 5. The convergence process of the RPS (a) and total resistance (b) of the different grid densities.
Jmse 12 00822 g005
Figure 6. The wave pattern of an ONR ship model in calm water at Fr = 0.2.
Jmse 12 00822 g006
Figure 7. The speed and attitude comparison of the present simulation versus the reference results [38].
Jmse 12 00822 g007
Figure 8. The propulsion performance of the twin propellers versus the reference results [39]. The x-axis of the referenced data has been transformed from Vt/L to T/Te.
Jmse 12 00822 g008
Figure 9. Wave elevation comparison with the EFD-measured result and the computed wave pattern under different encountering times (1/4Te, 1/2Te, 3/4Te, and Te).
Jmse 12 00822 g009
Figure 10. The pitch control research model with a stern flap.
Jmse 12 00822 g010
Figure 11. The speed and attitude comparison of different P controllers on the stern flap.
Jmse 12 00822 g011
Figure 12. The speed and attitude comparison of different PID controllers on the stern flap.
Jmse 12 00822 g012
Figure 13. The speed and attitude comparison of ONRT with the fixed and active-controlled stern flap.
Jmse 12 00822 g013
Figure 14. The resistance comparison of the three cases.
Jmse 12 00822 g014
Figure 15. Propeller wake and velocity distribution at the propeller disk of the three conditions.
Jmse 12 00822 g015
Table 1. Grid uncertainty results for RPS and total resistance in calm water.
Grid UncertaintyGrid
Density
Grids
Number
CFDEXPErrorrgRGPGUG
(%D)
Propeller
revolution
(RPS)
Coarse1.0 M9.558.976.47%1.20.727 0.873 4.06
Medium1.8 M9.445.24%
Fine3.1 M9.364.35%
Total resistance (N)Coarse1.0 M4.724.543.96%1.20.7140.923 4.59
Medium1.8 M4.652.42%
Fine3.1 M4.601.32%
Table 2. Speed loss and propulsion efficiency results under different control algorithms.
ControllerSpeedResistance (N)Propulsion EfficiencyMotions
Mean u/VASpeed LossSpeed Loss ReductionMean
Rx
Mean
Rf
Mean
RSF
Rx
Reduction
Eta_PDiffEta_SDiffMax
Heave/A
Max
Pitch/Ak
Origin0.8110.189 -6.13 2.73 0.00 -0.515 -0.504 -0.58 0.50
Fixed0.8190.181 −4.2%6.09 2.72 0.33 −0.7%0.521 1.1%0.509 0.9%0.51 0.45
PID0.8240.176 −6.9%6.07 2.75 0.38 −0.9%0.522 1.4%0.511 1.4%0.51 0.44
Disclaimer/Publisher’s Note: The statements, opinions and data contained in all publications are solely those of the individual author(s) and contributor(s) and not of MDPI and/or the editor(s). MDPI and/or the editor(s) disclaim responsibility for any injury to people or property resulting from any ideas, methods, instructions or products referred to in the content.