
Tidal Datum Changes Induced by Morphological Changes of North Carolina Coastal Inlets

Abstract
:1. Introduction
2. Materials and Methods
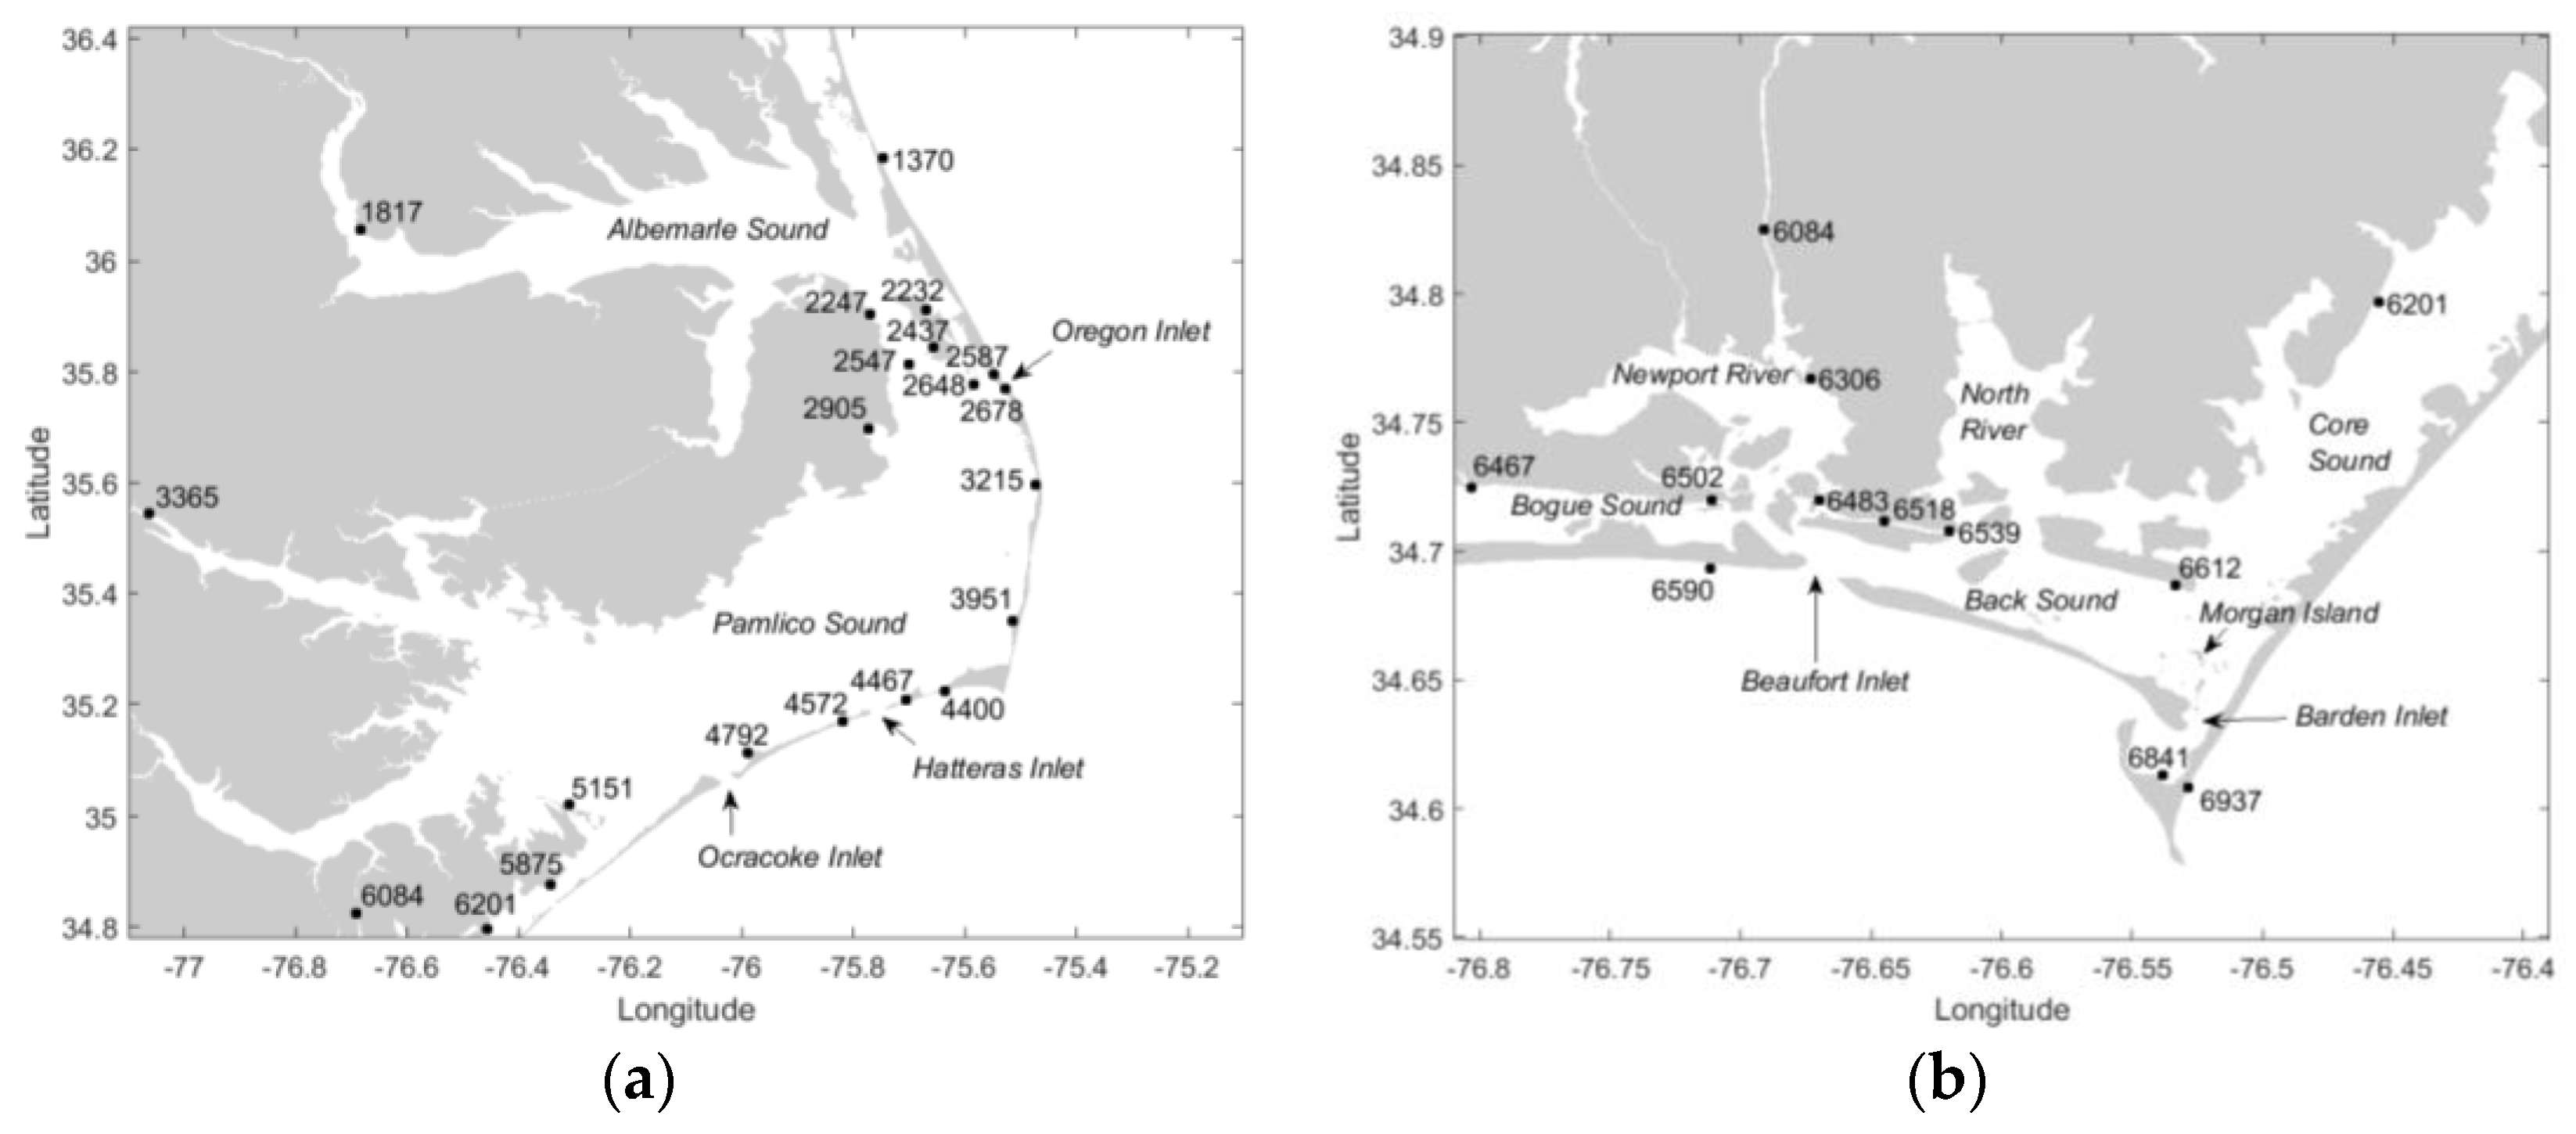
2.1. Data Sources
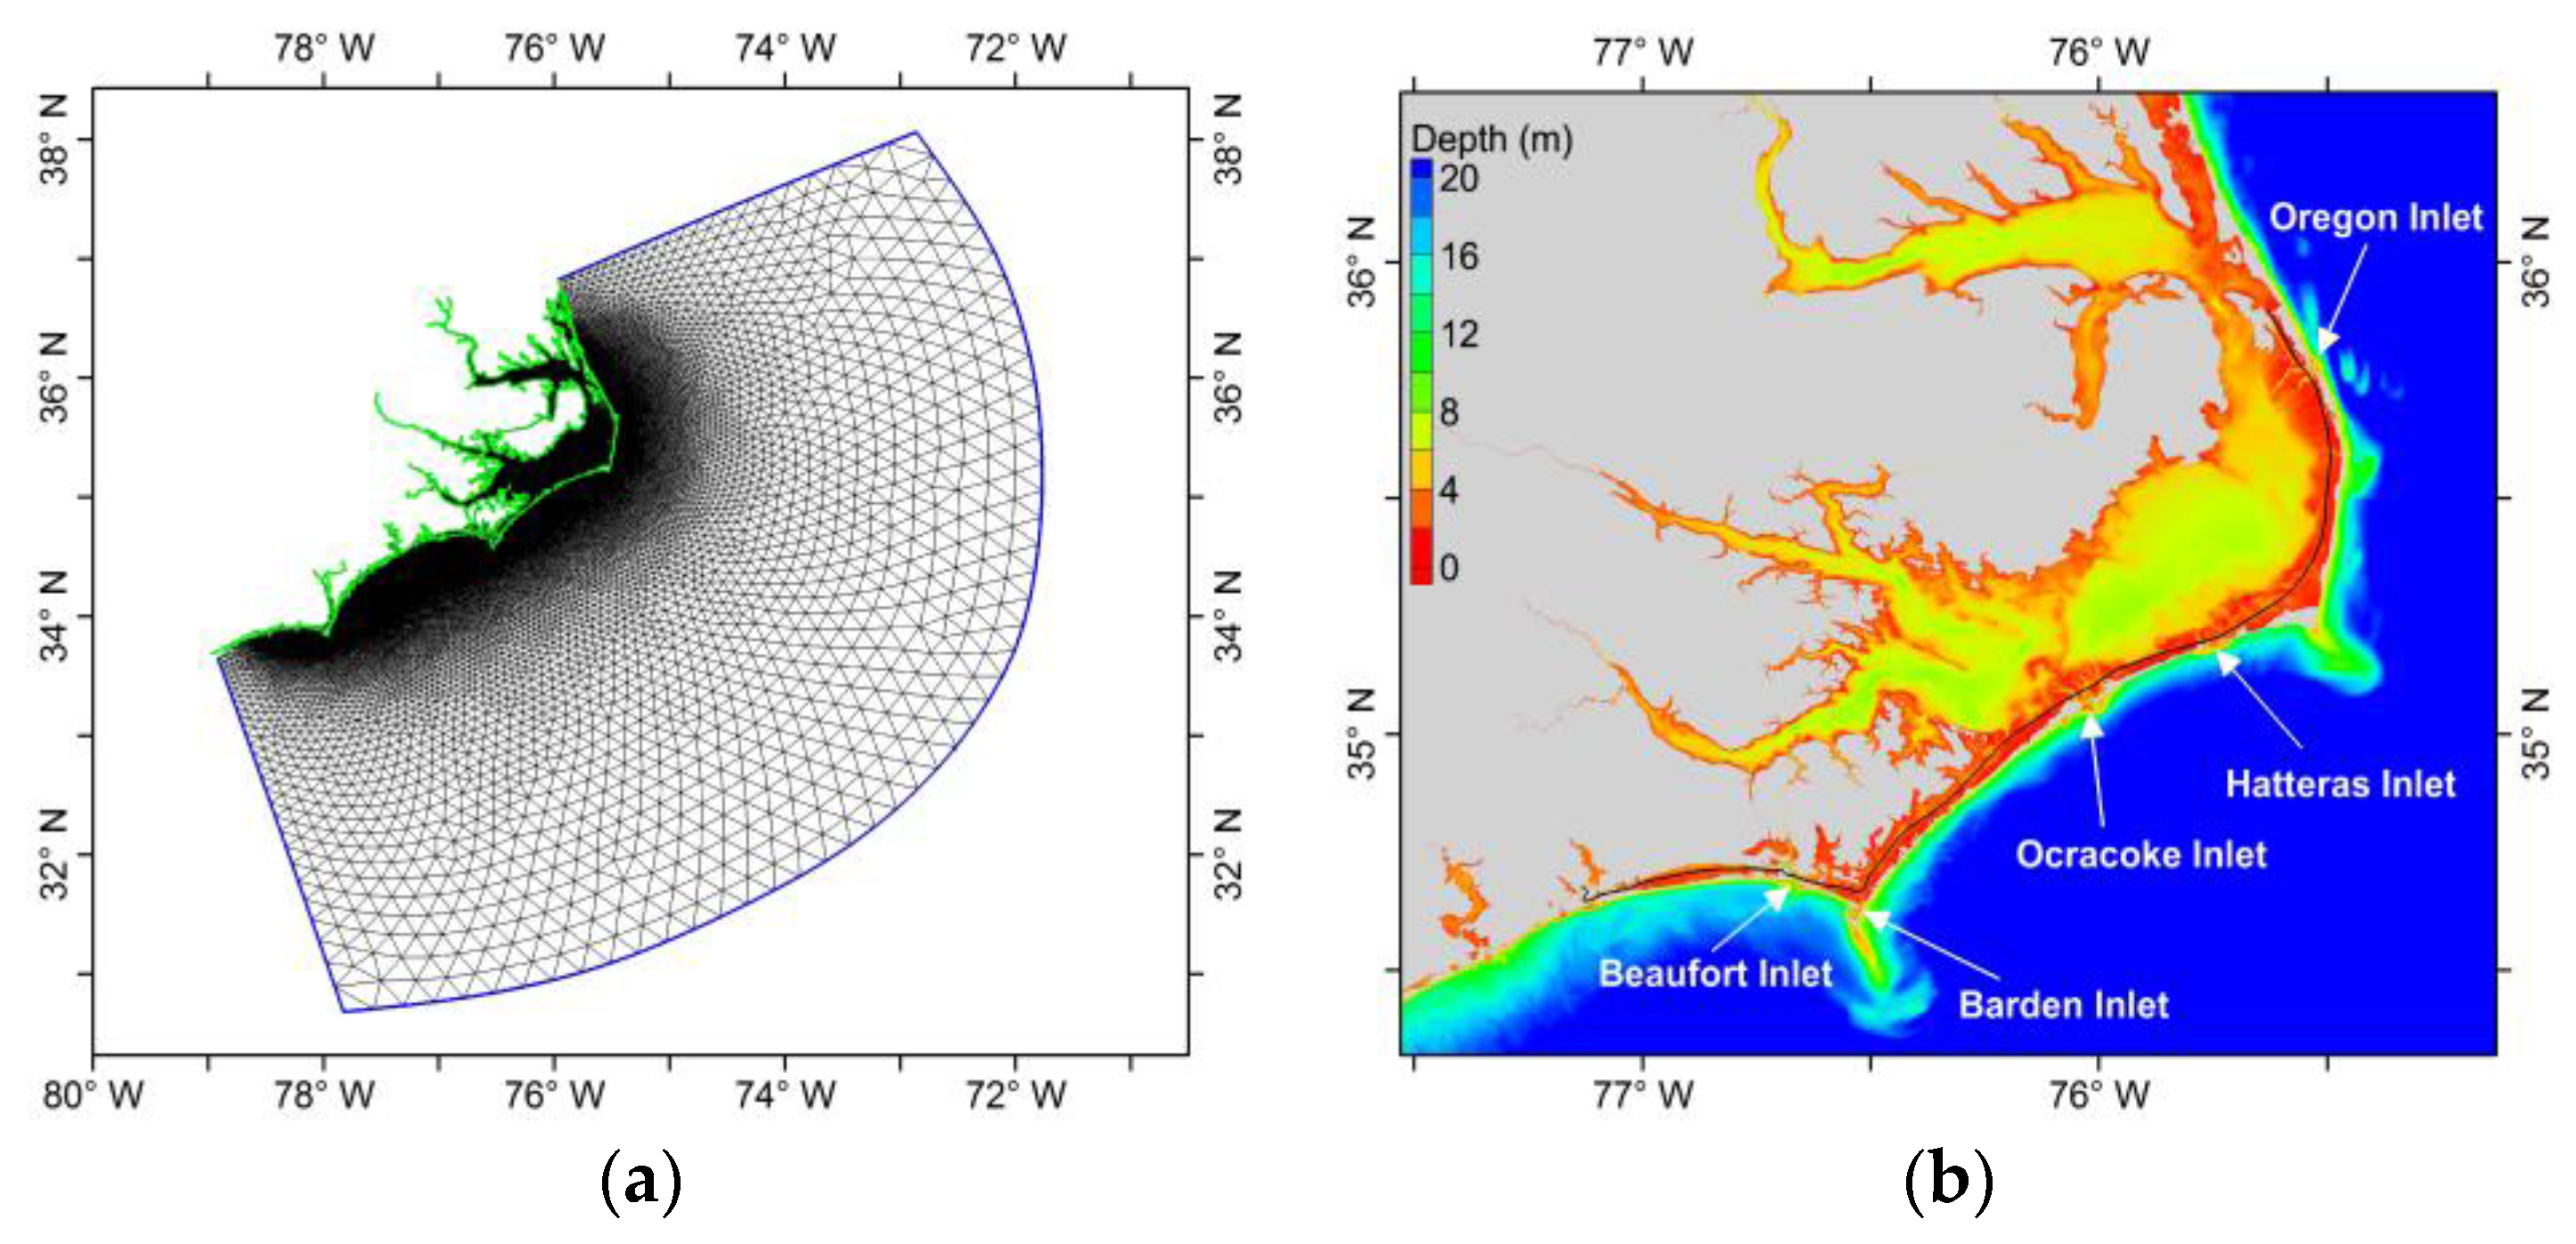
2.2. Model Setup
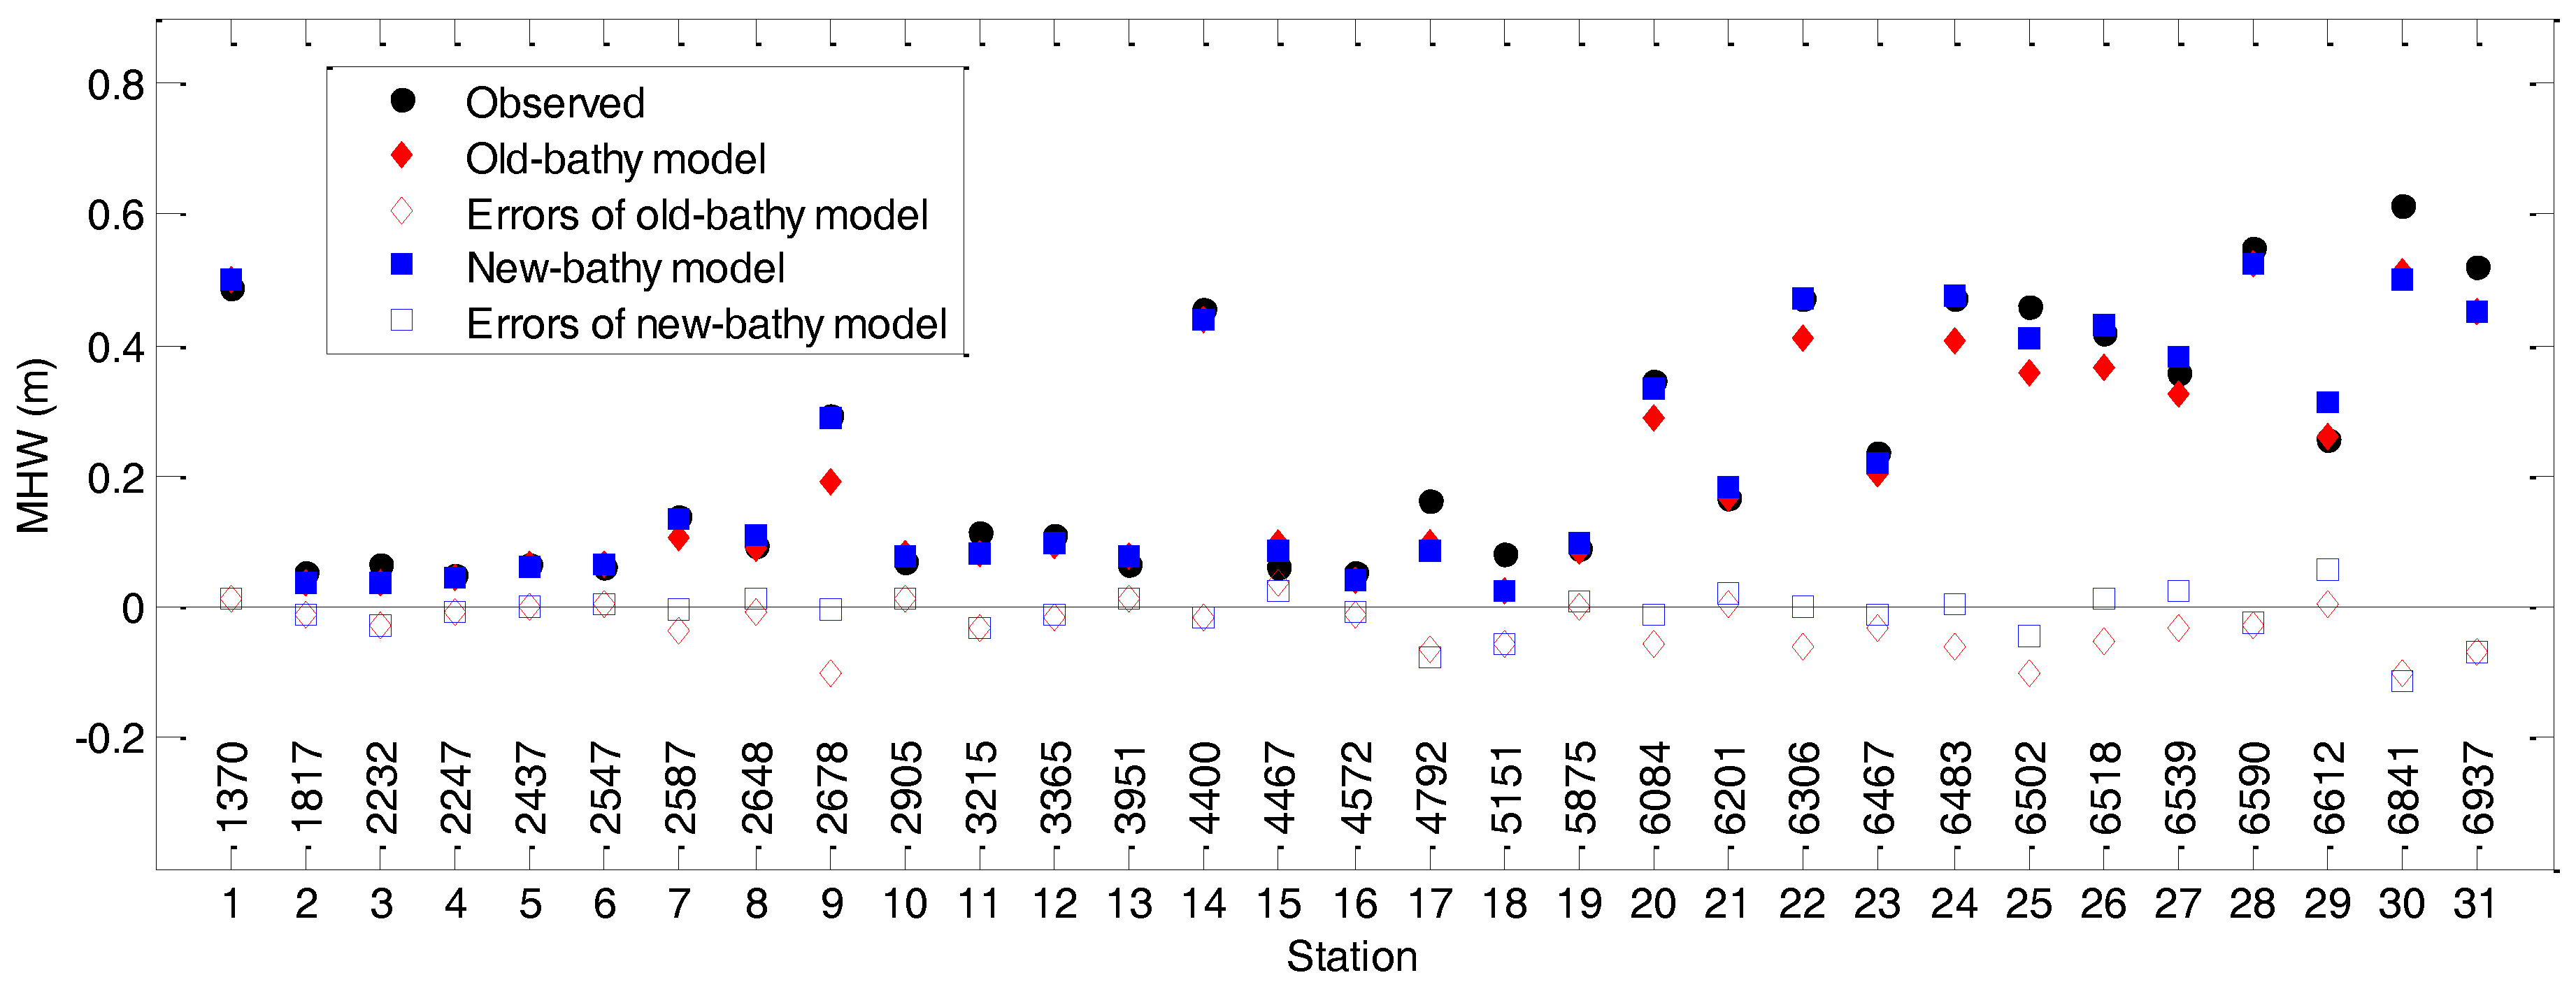
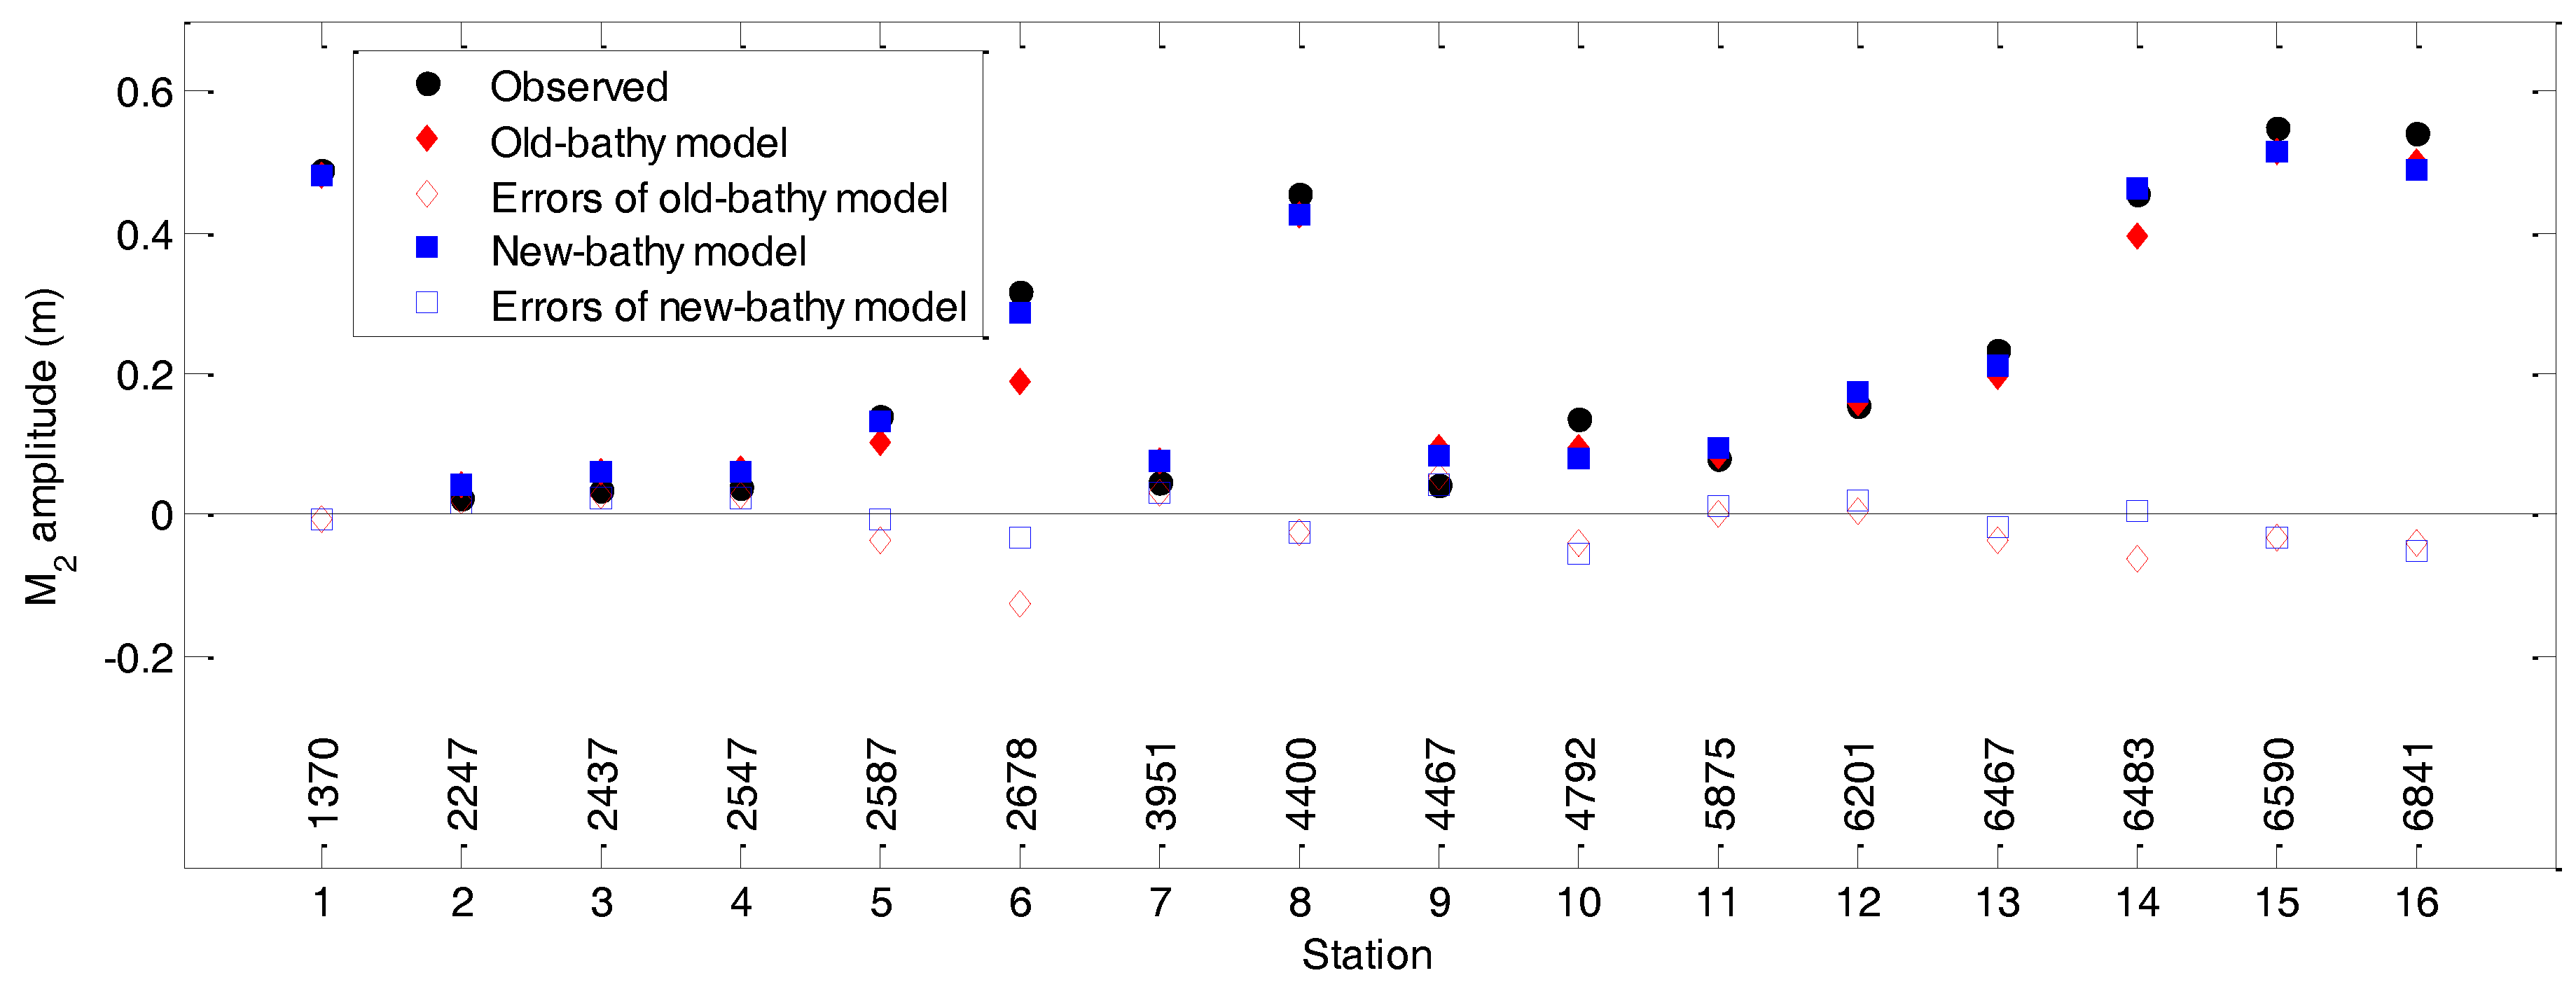
2.3. Model Validation
3. Results
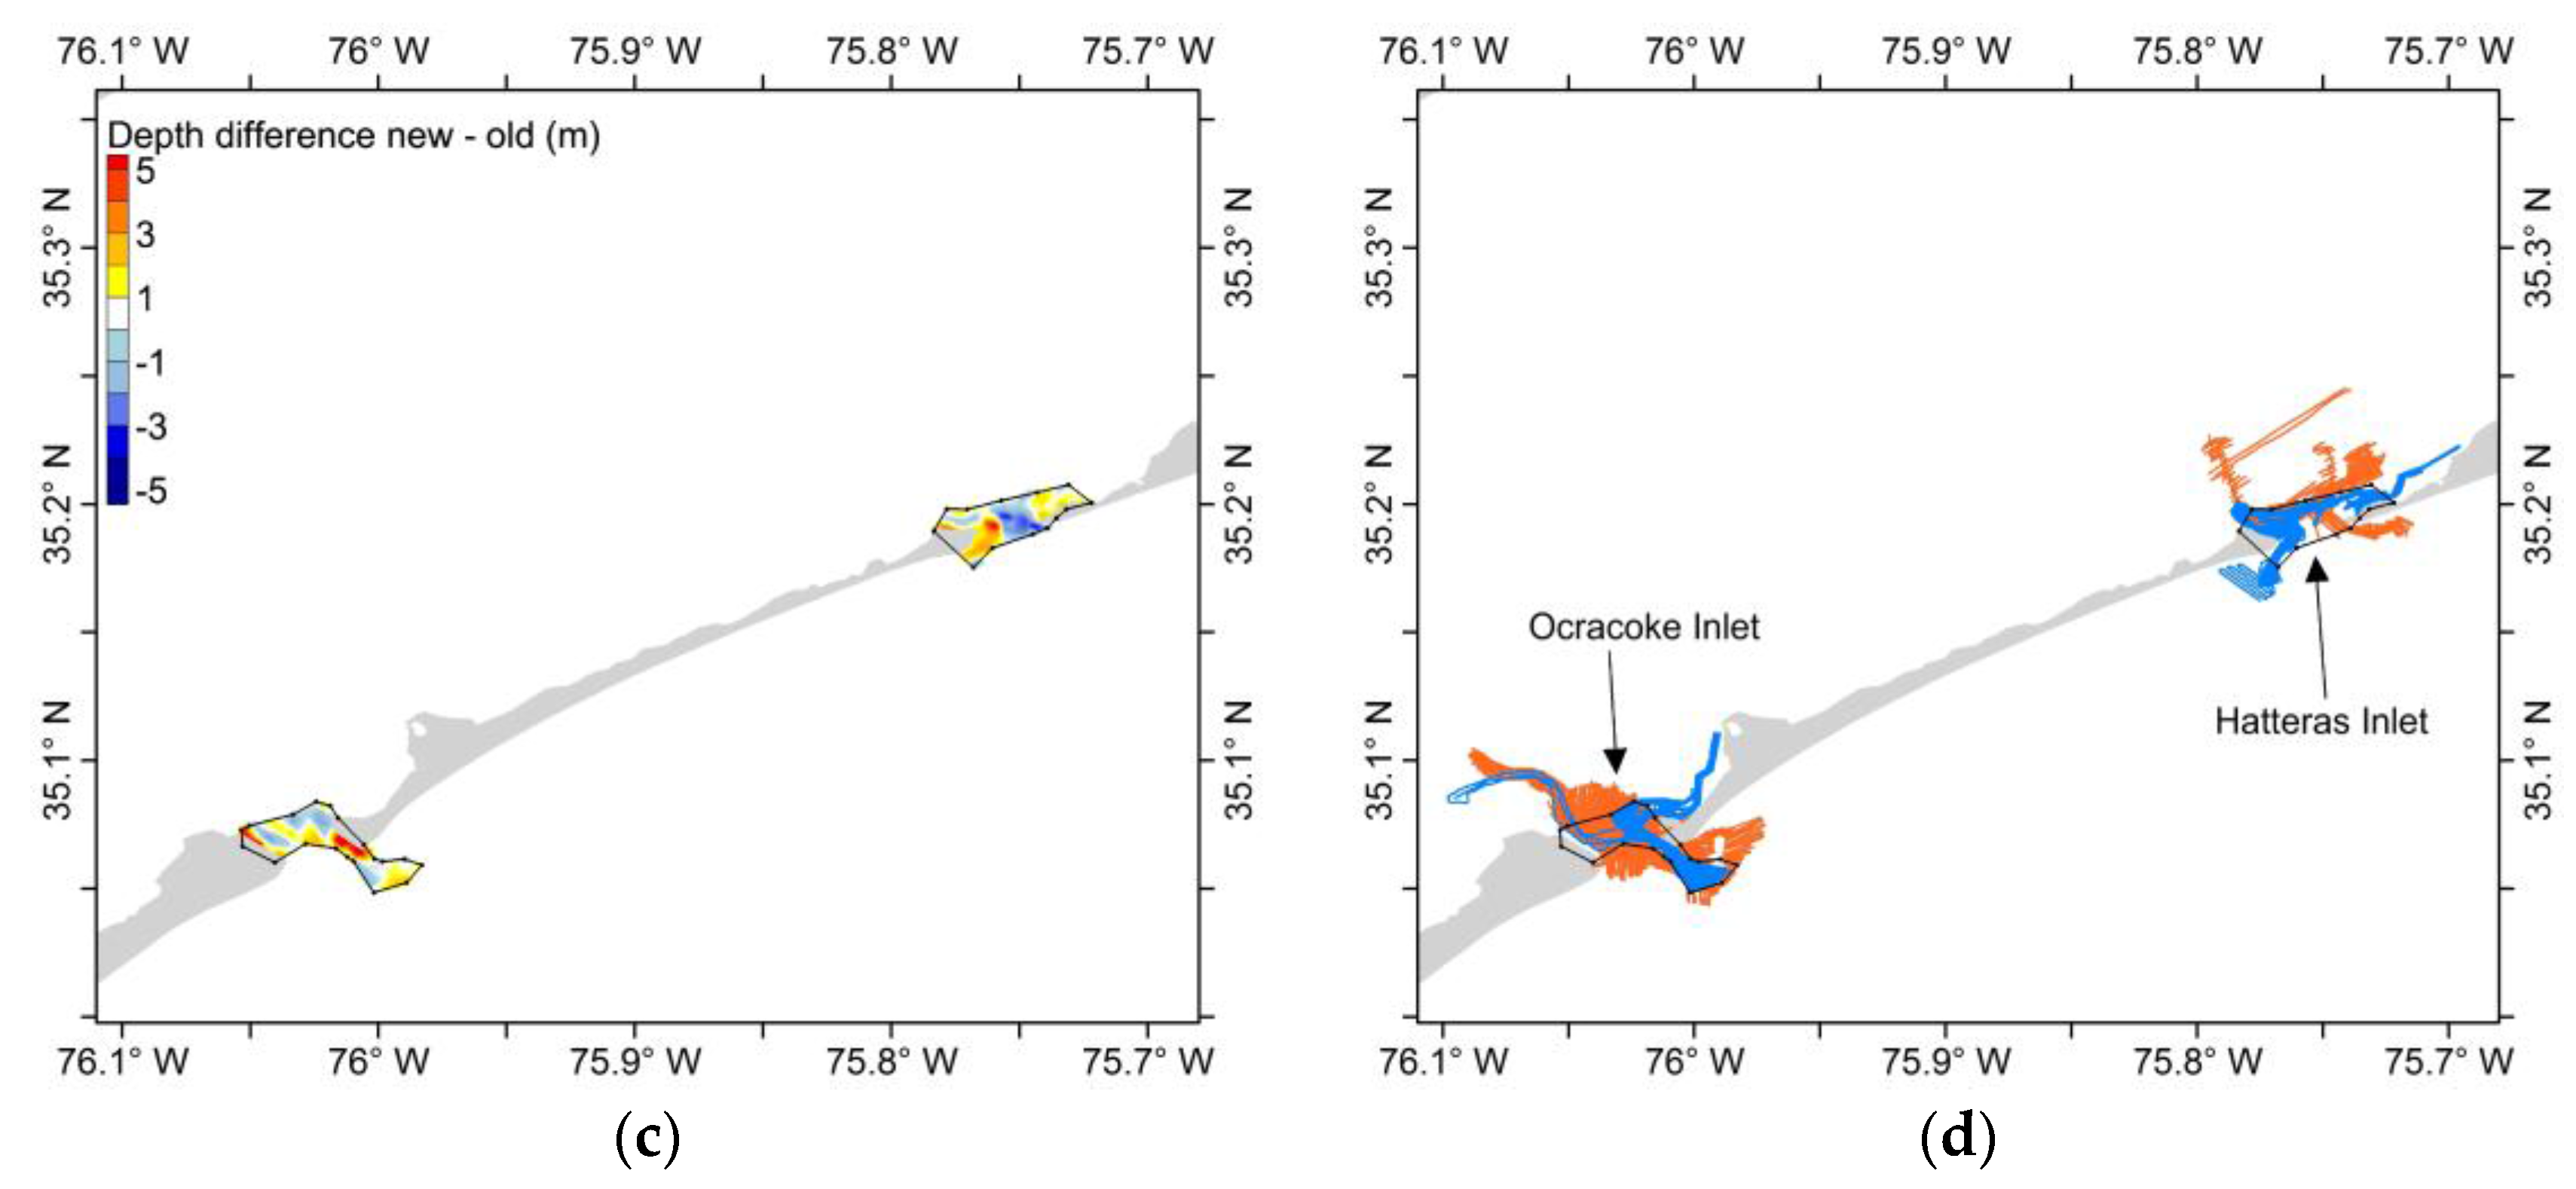
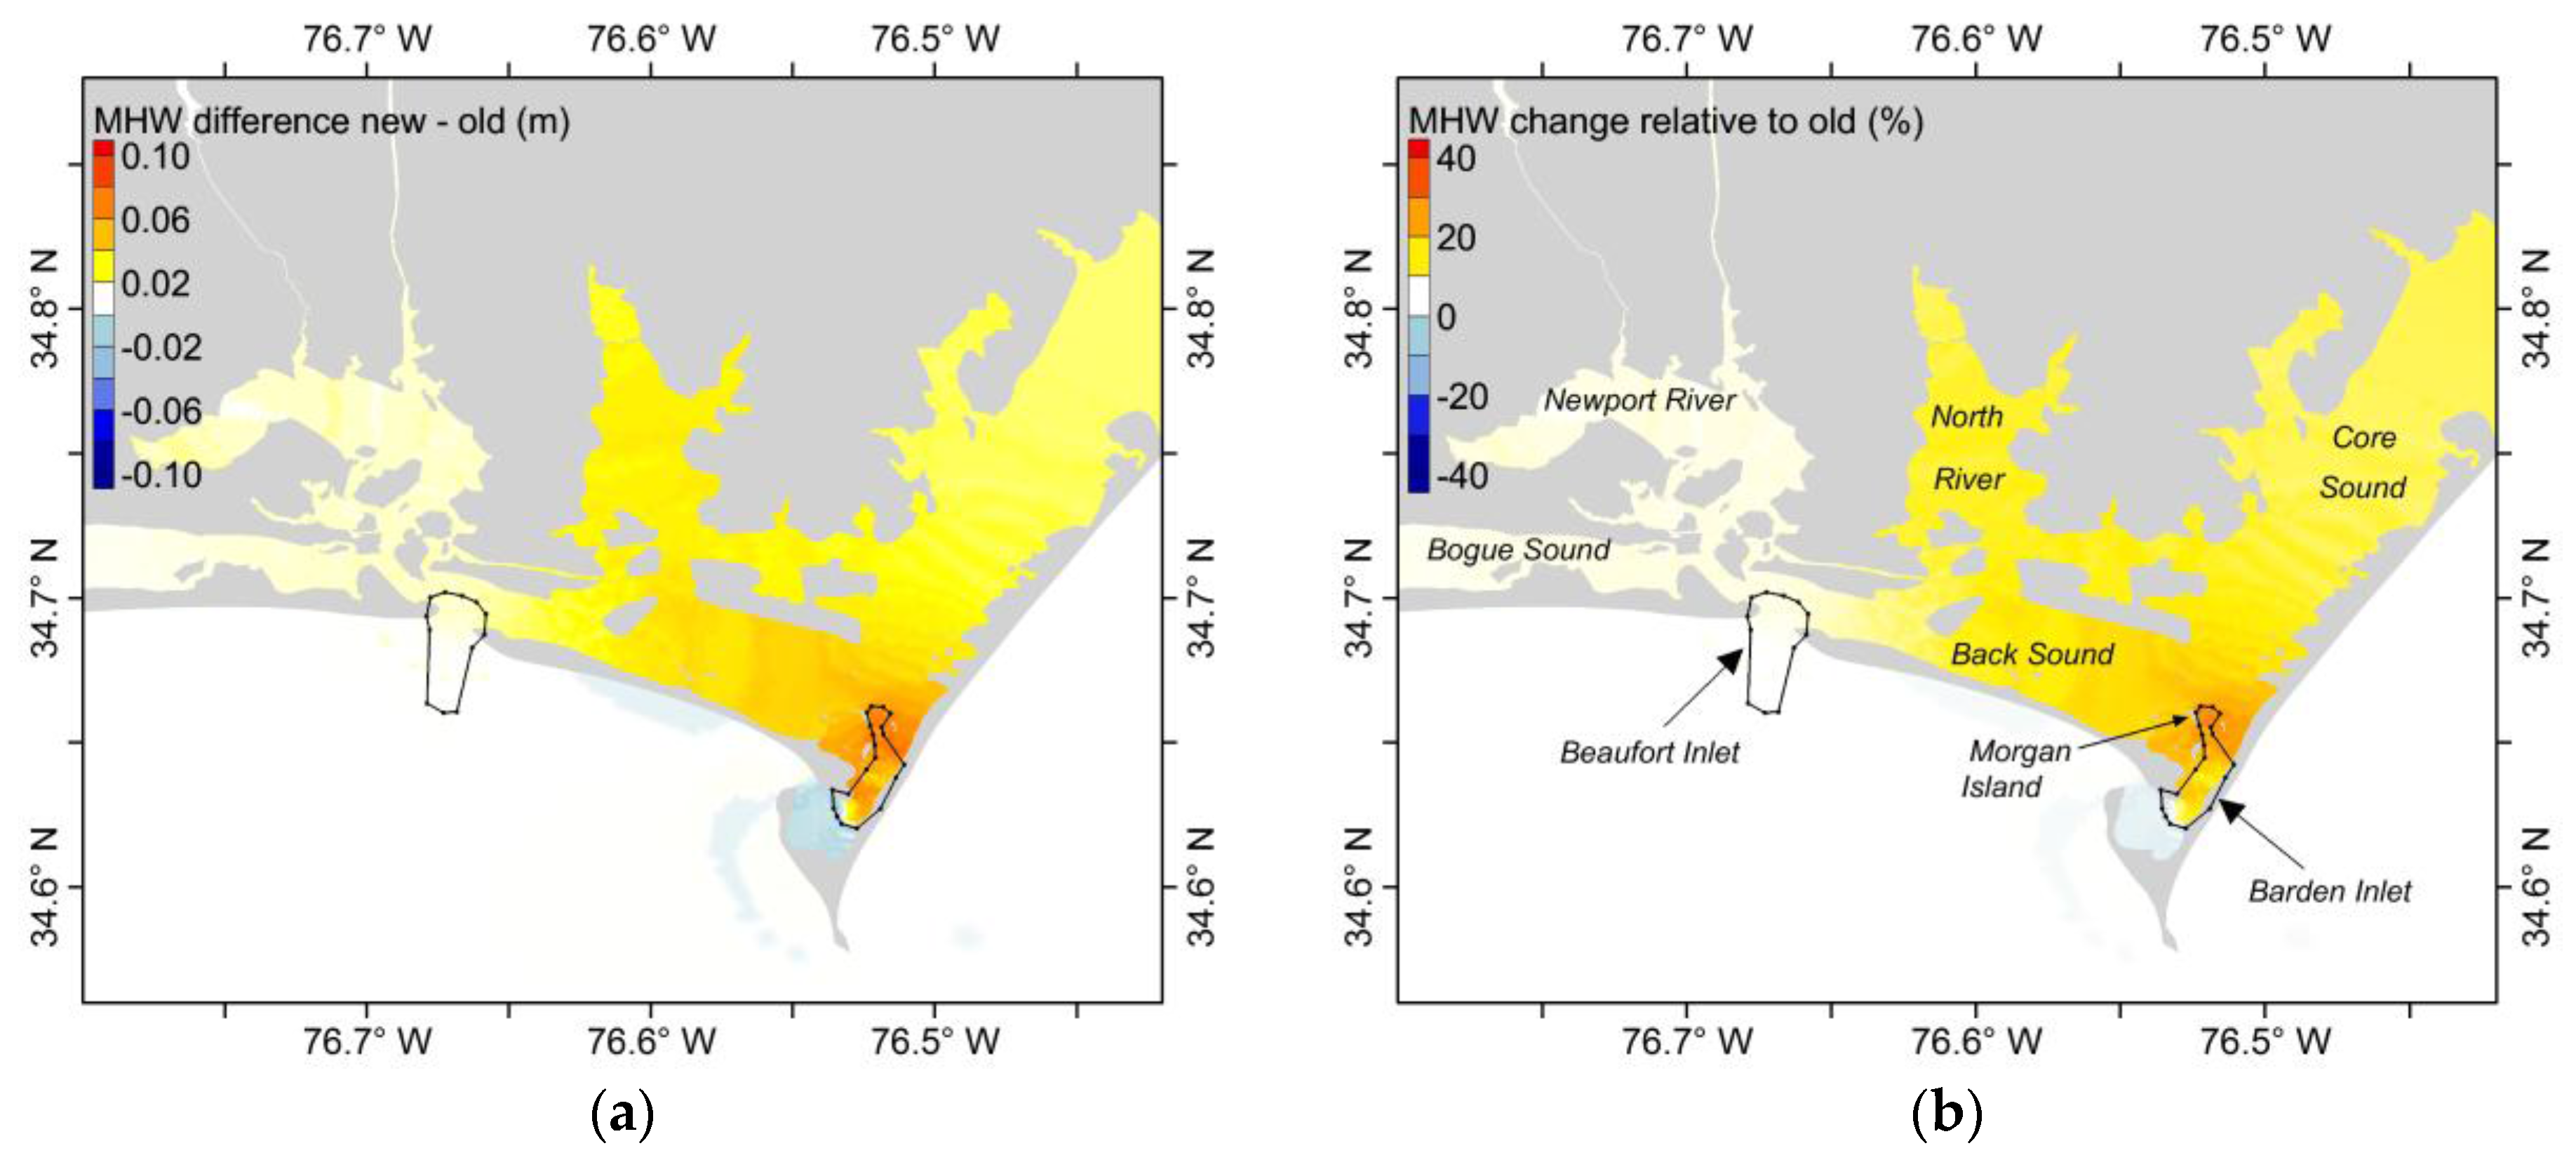
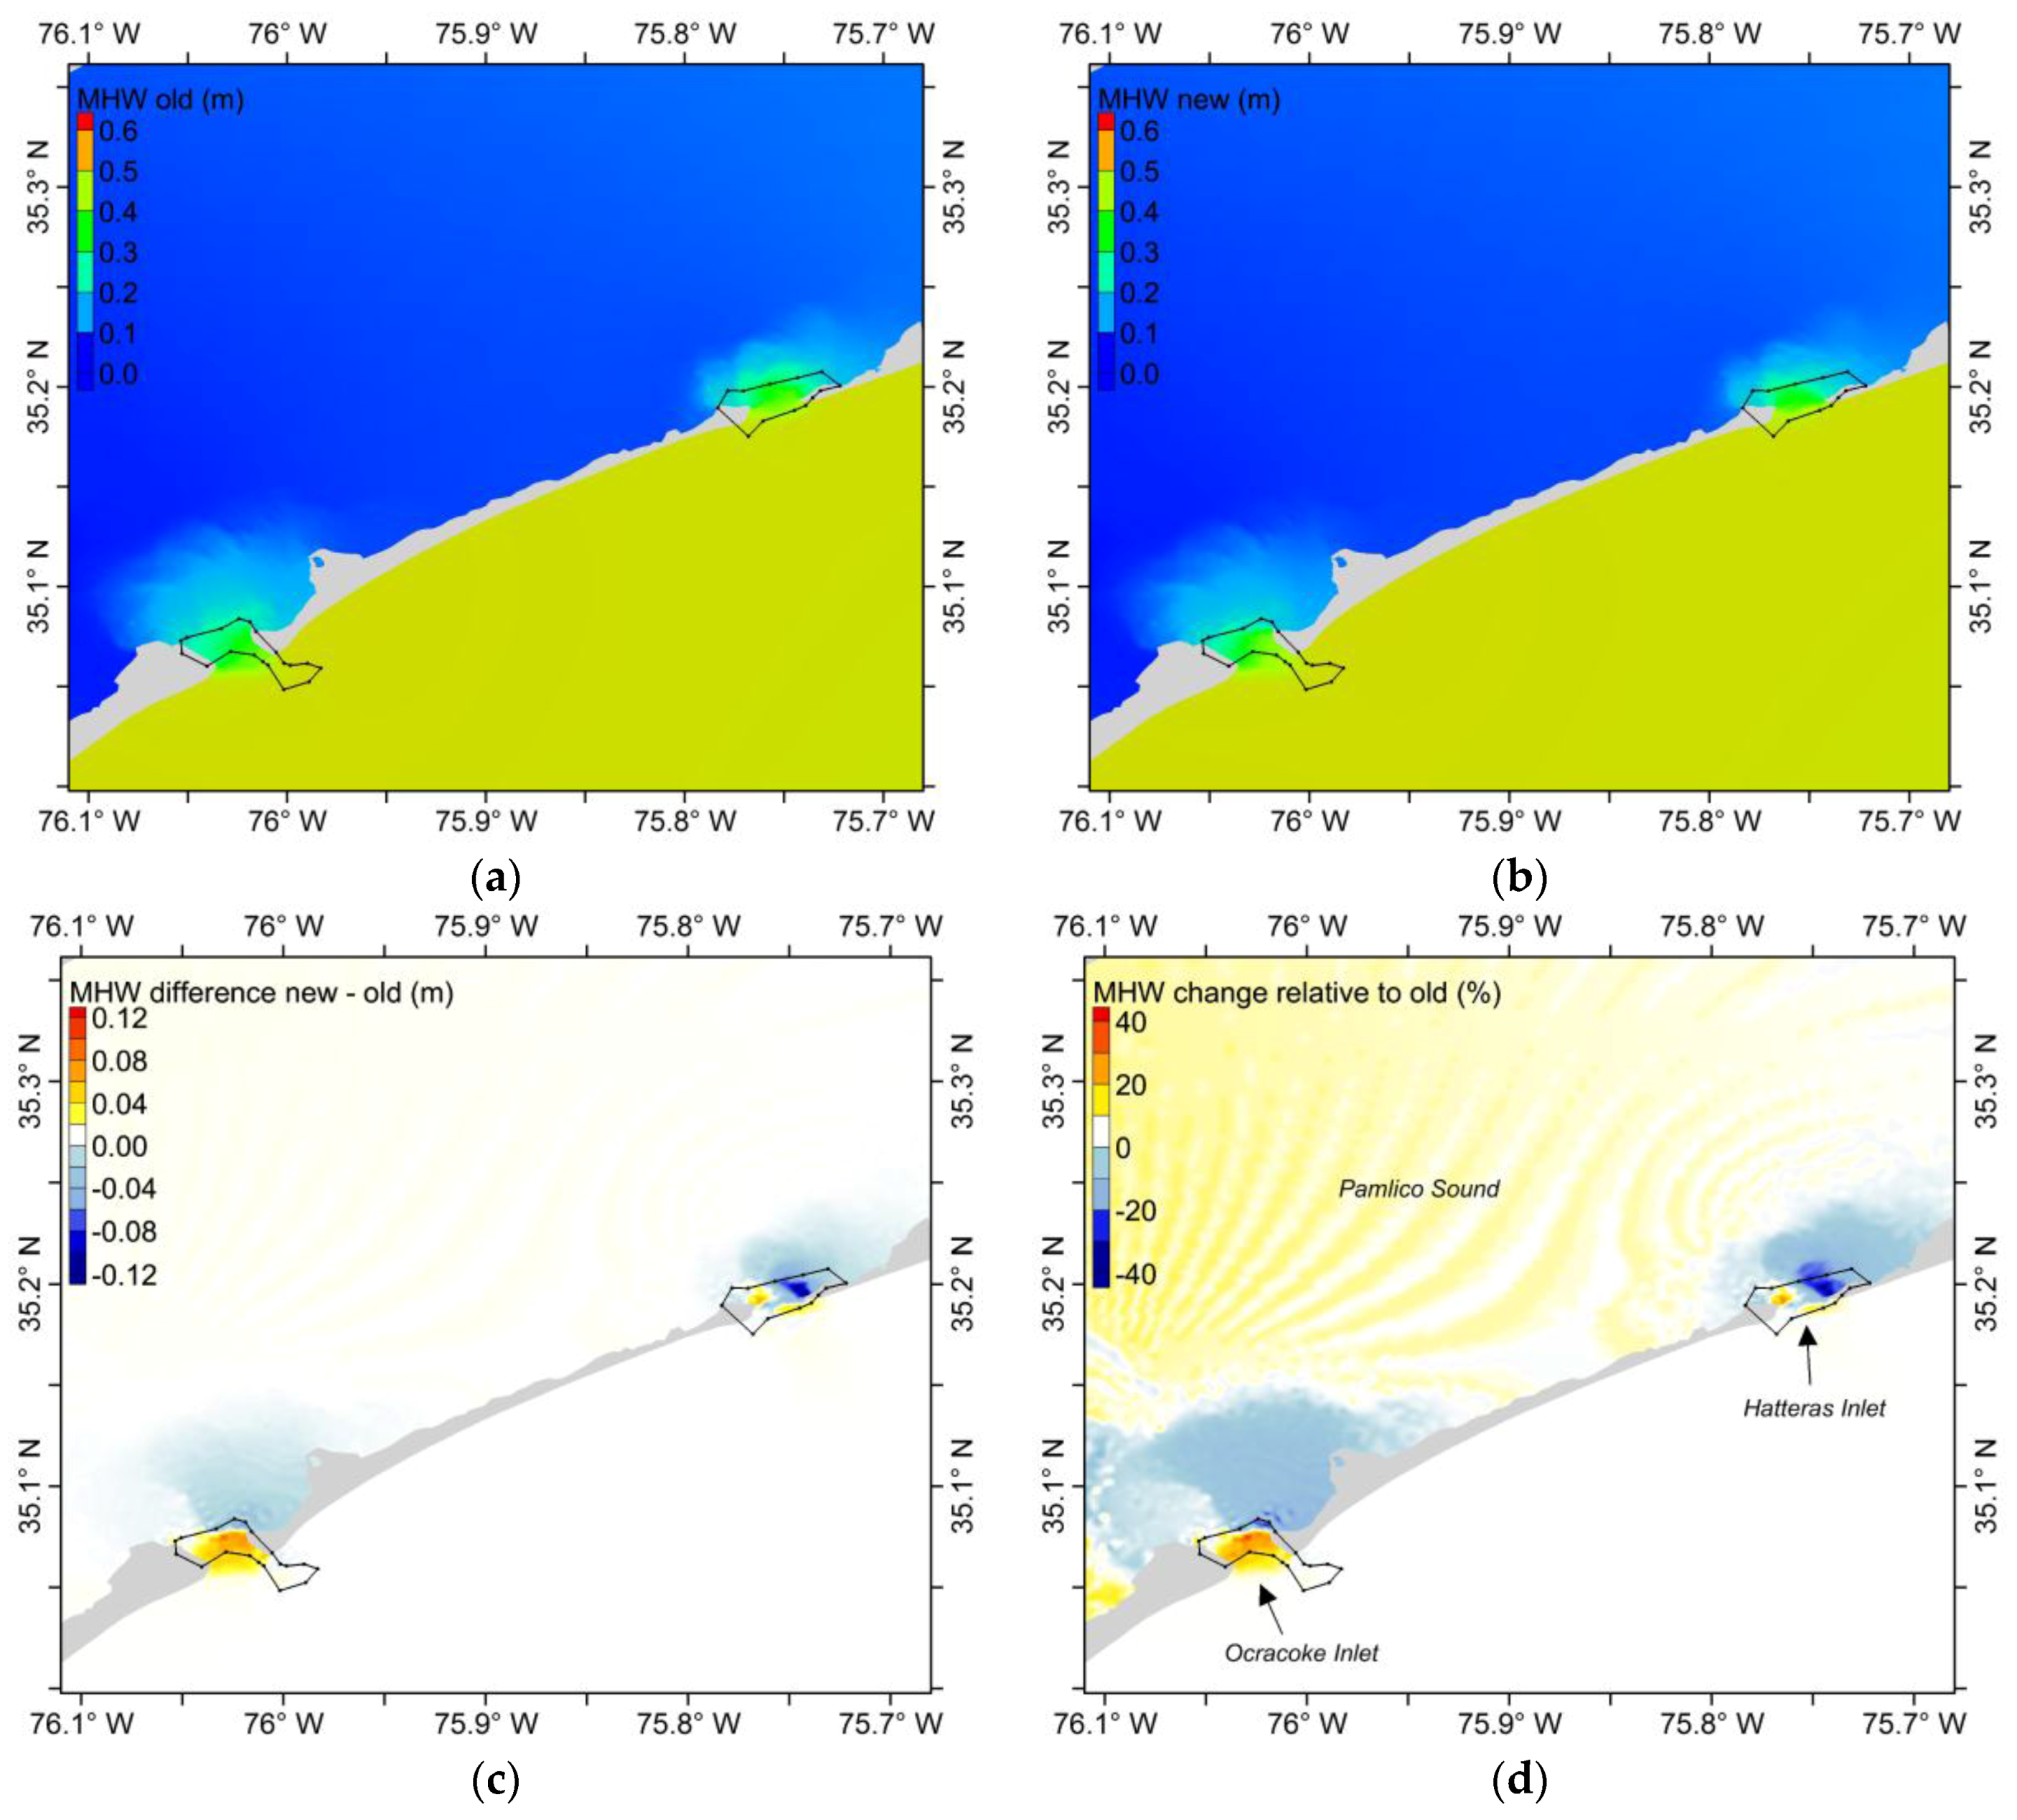
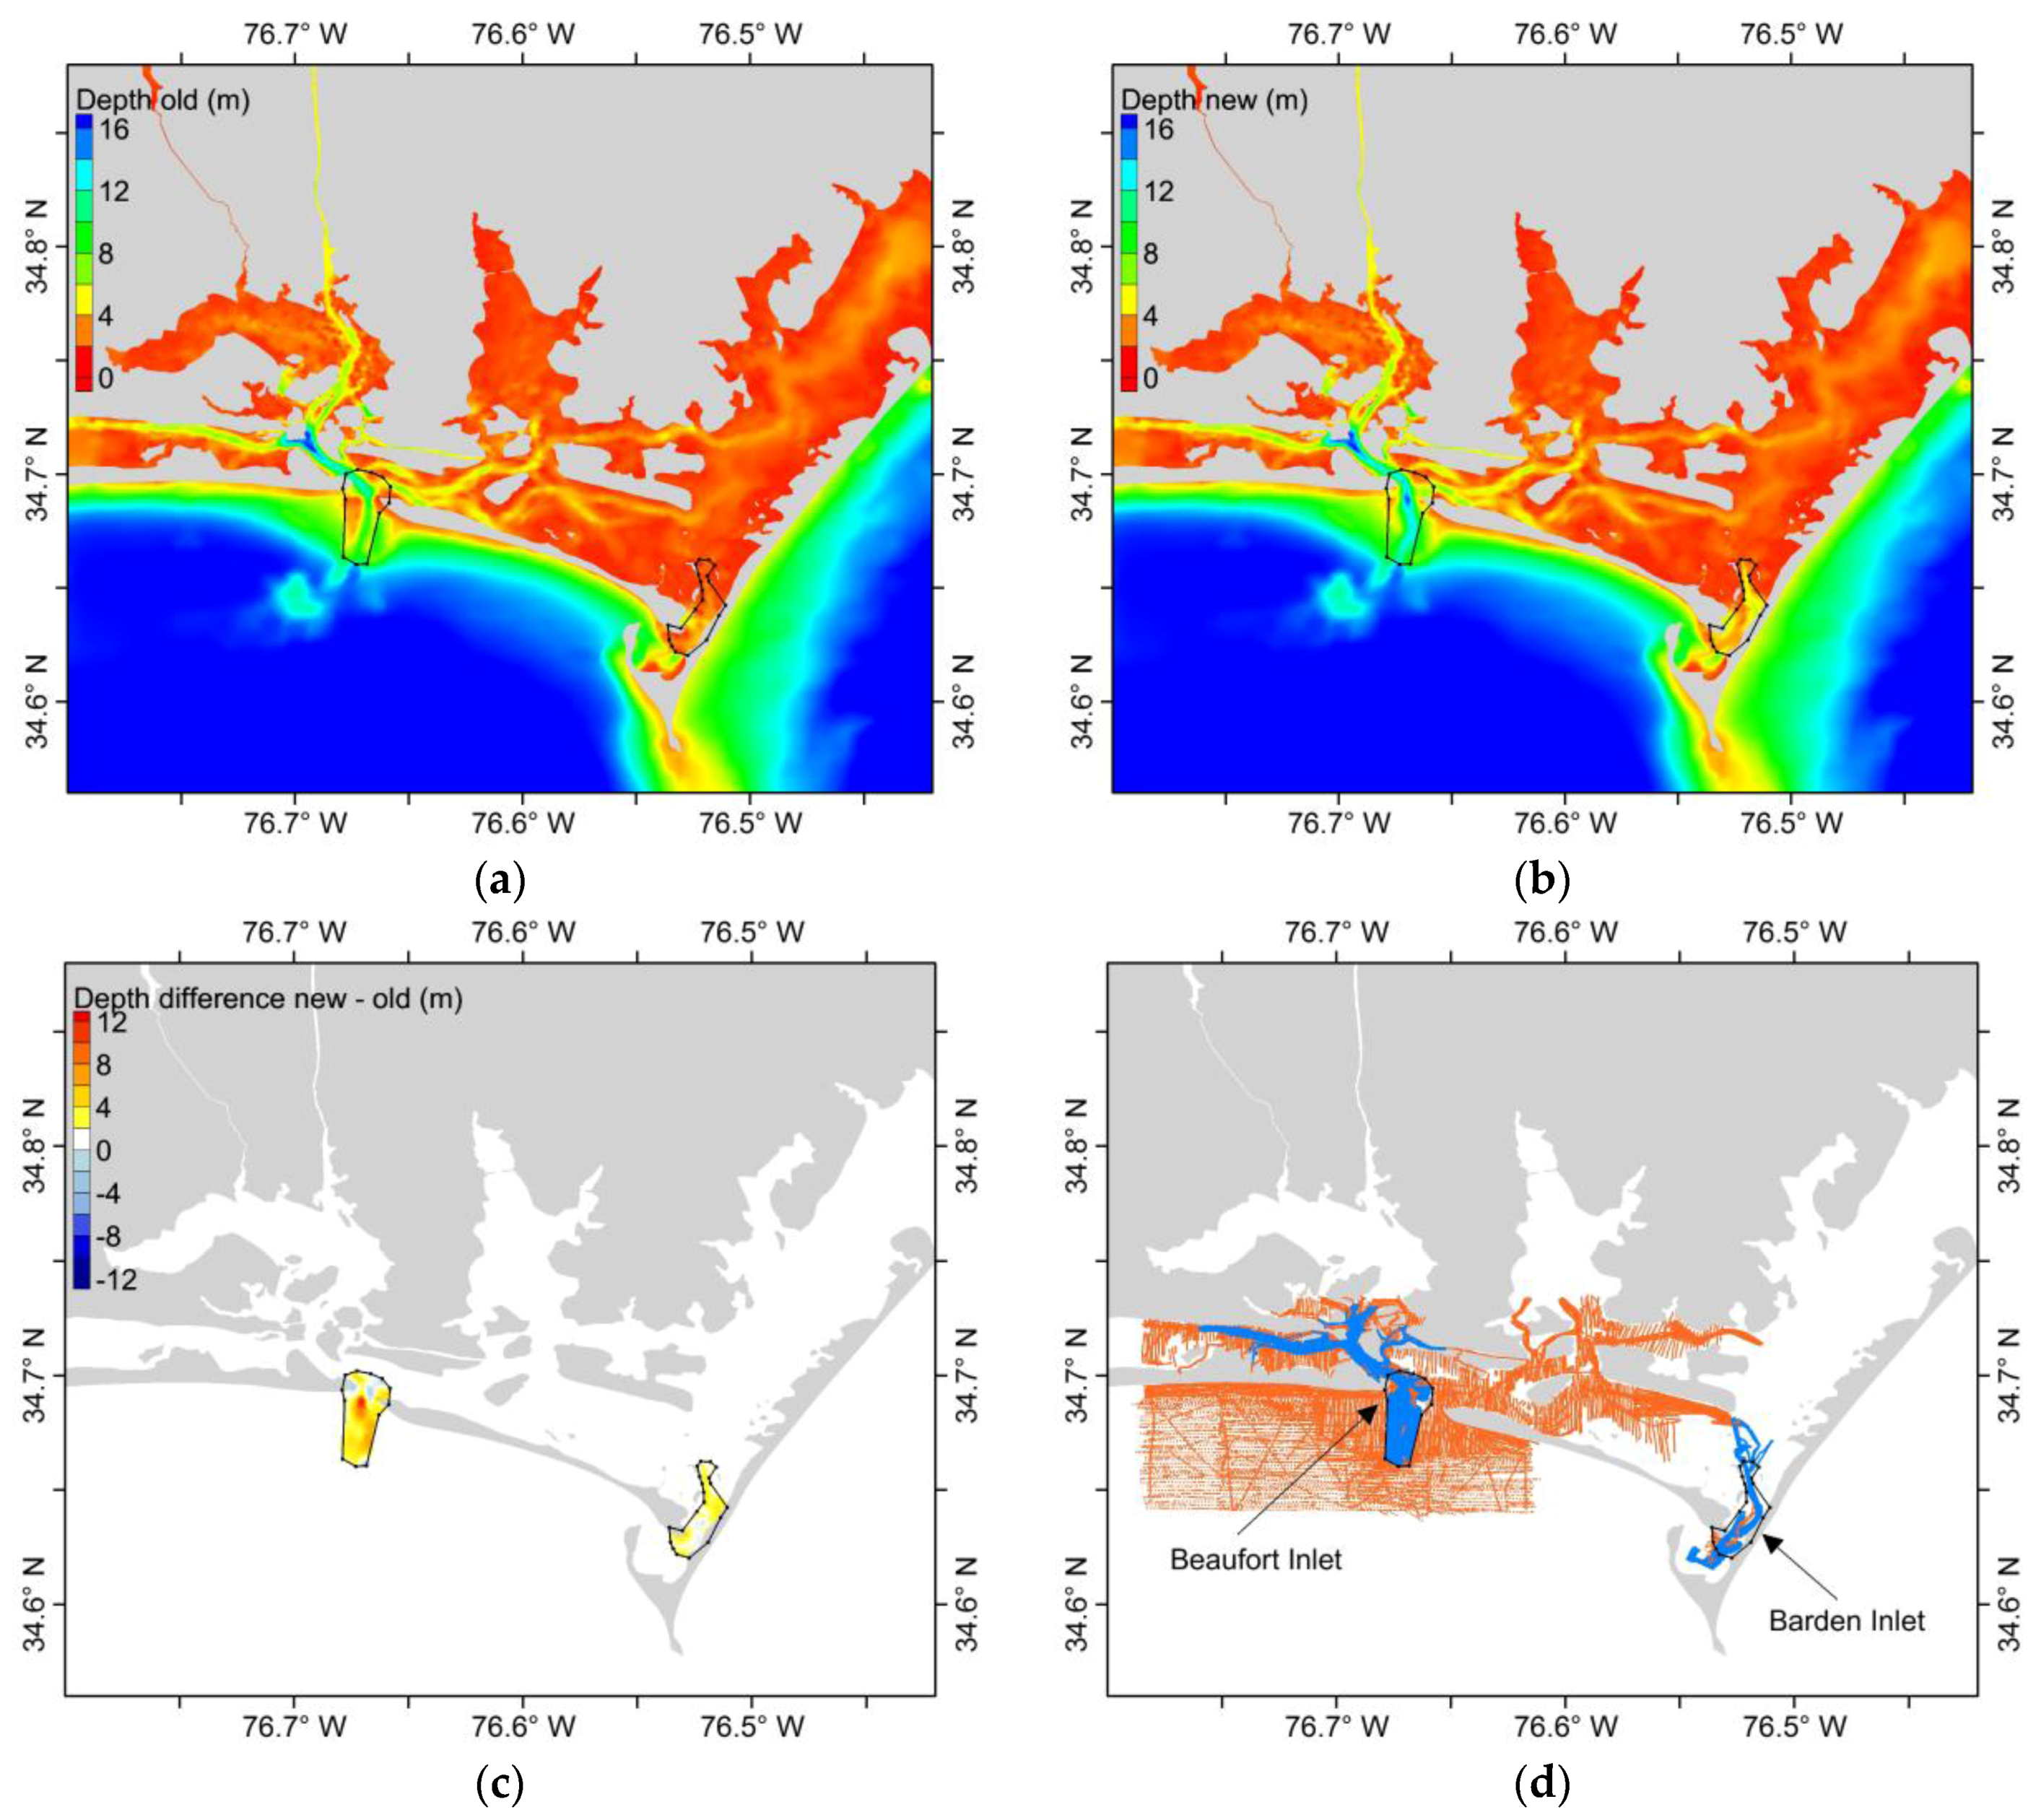
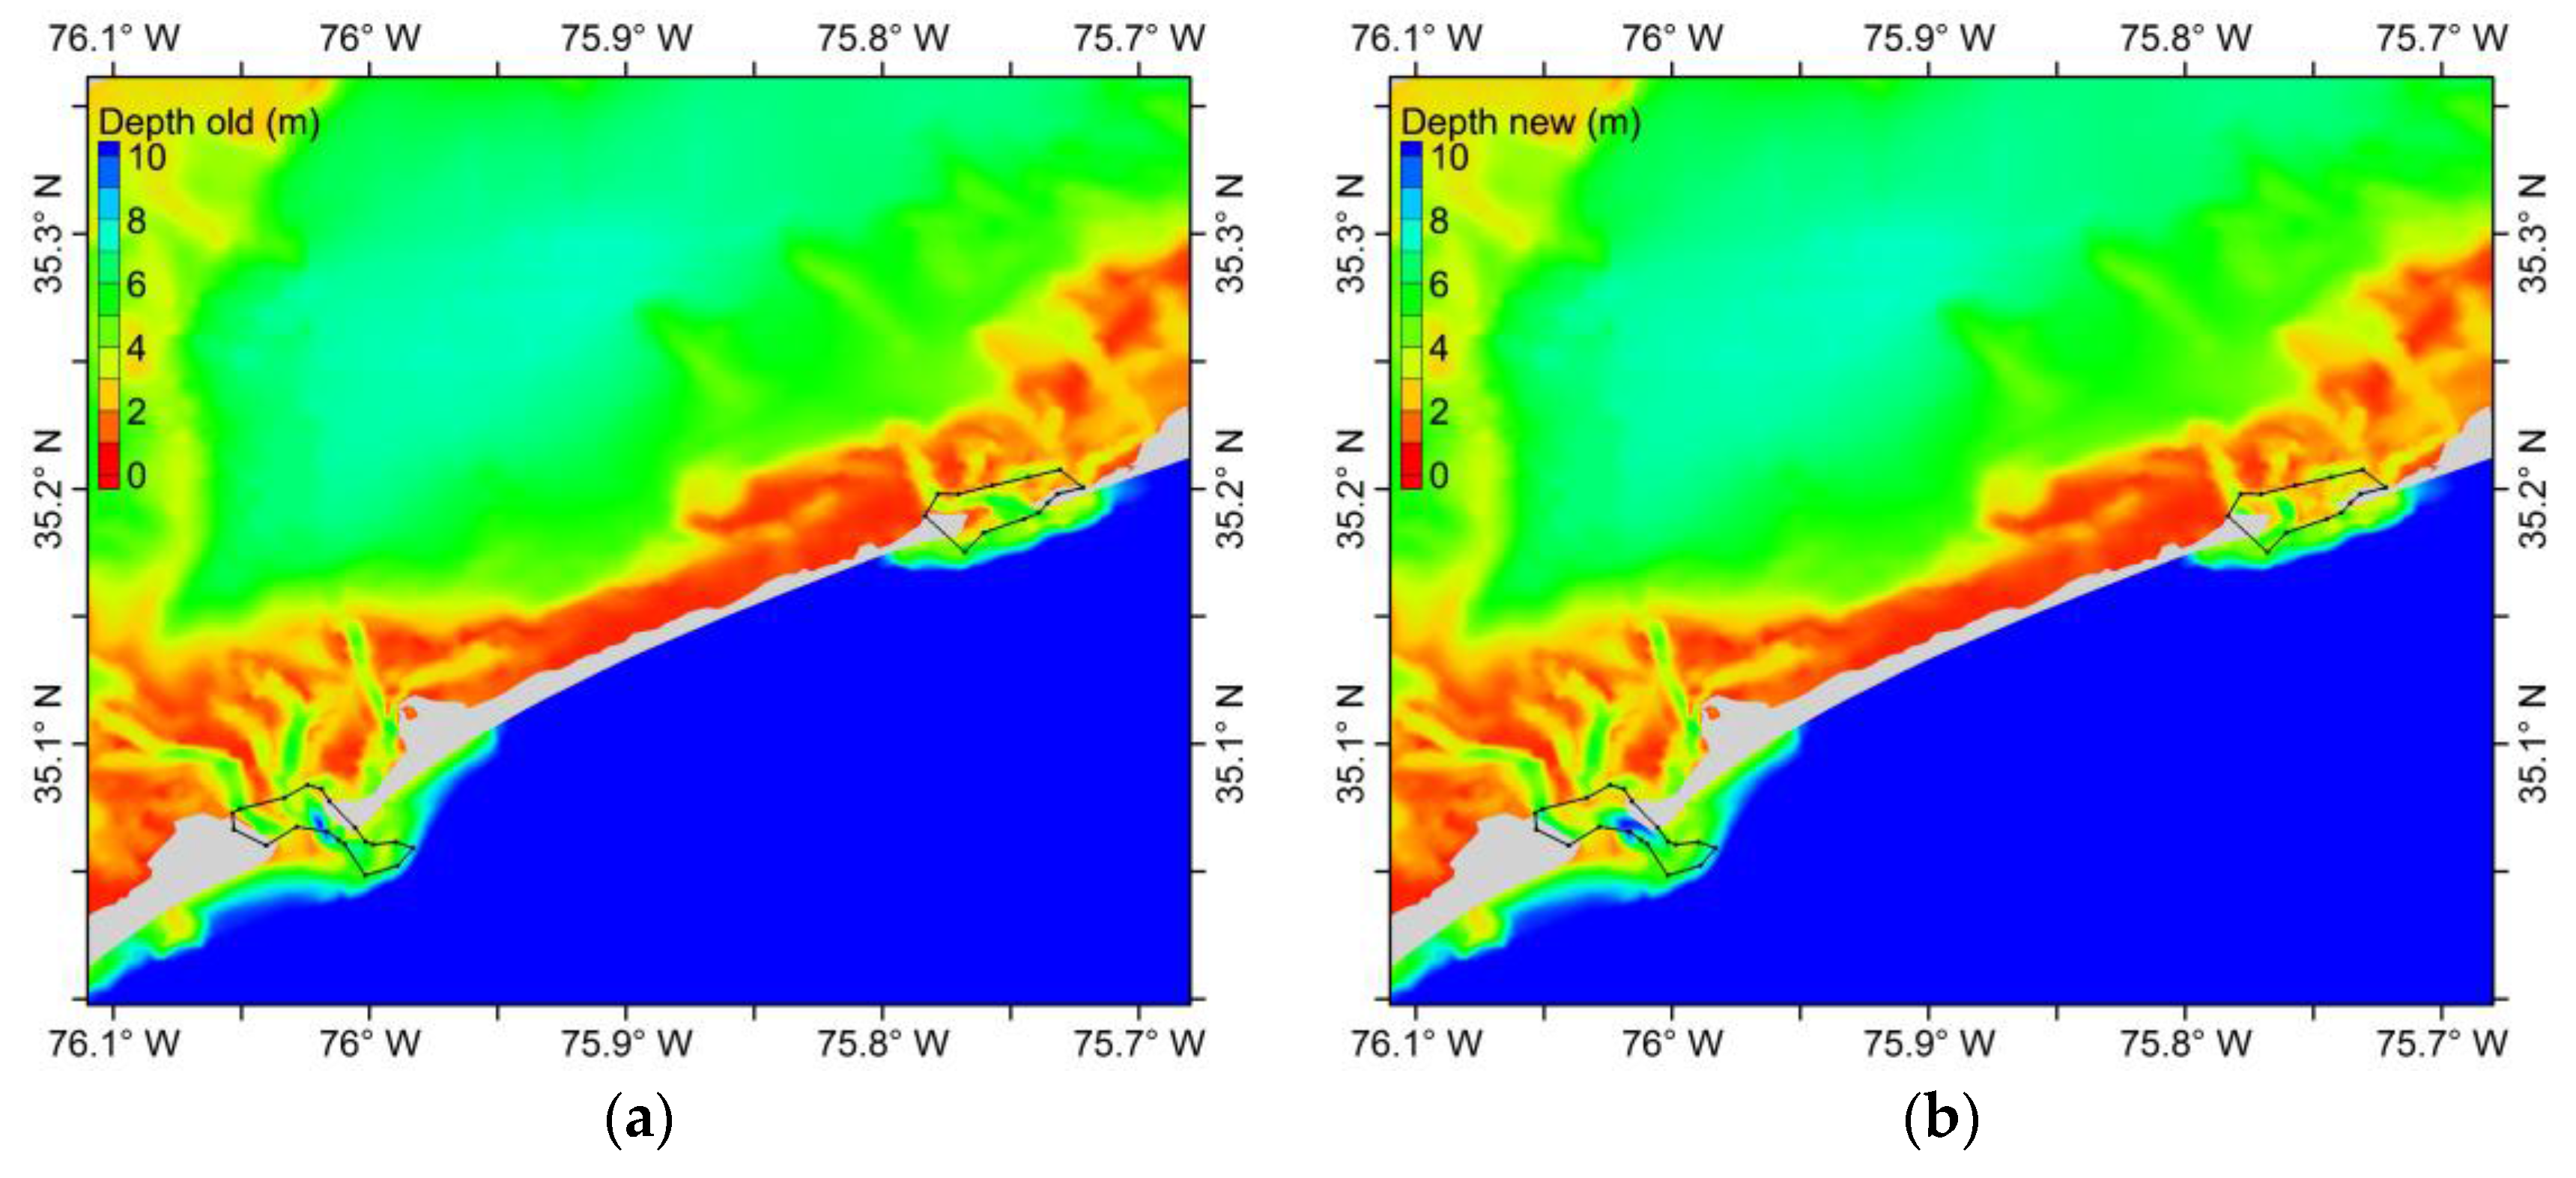
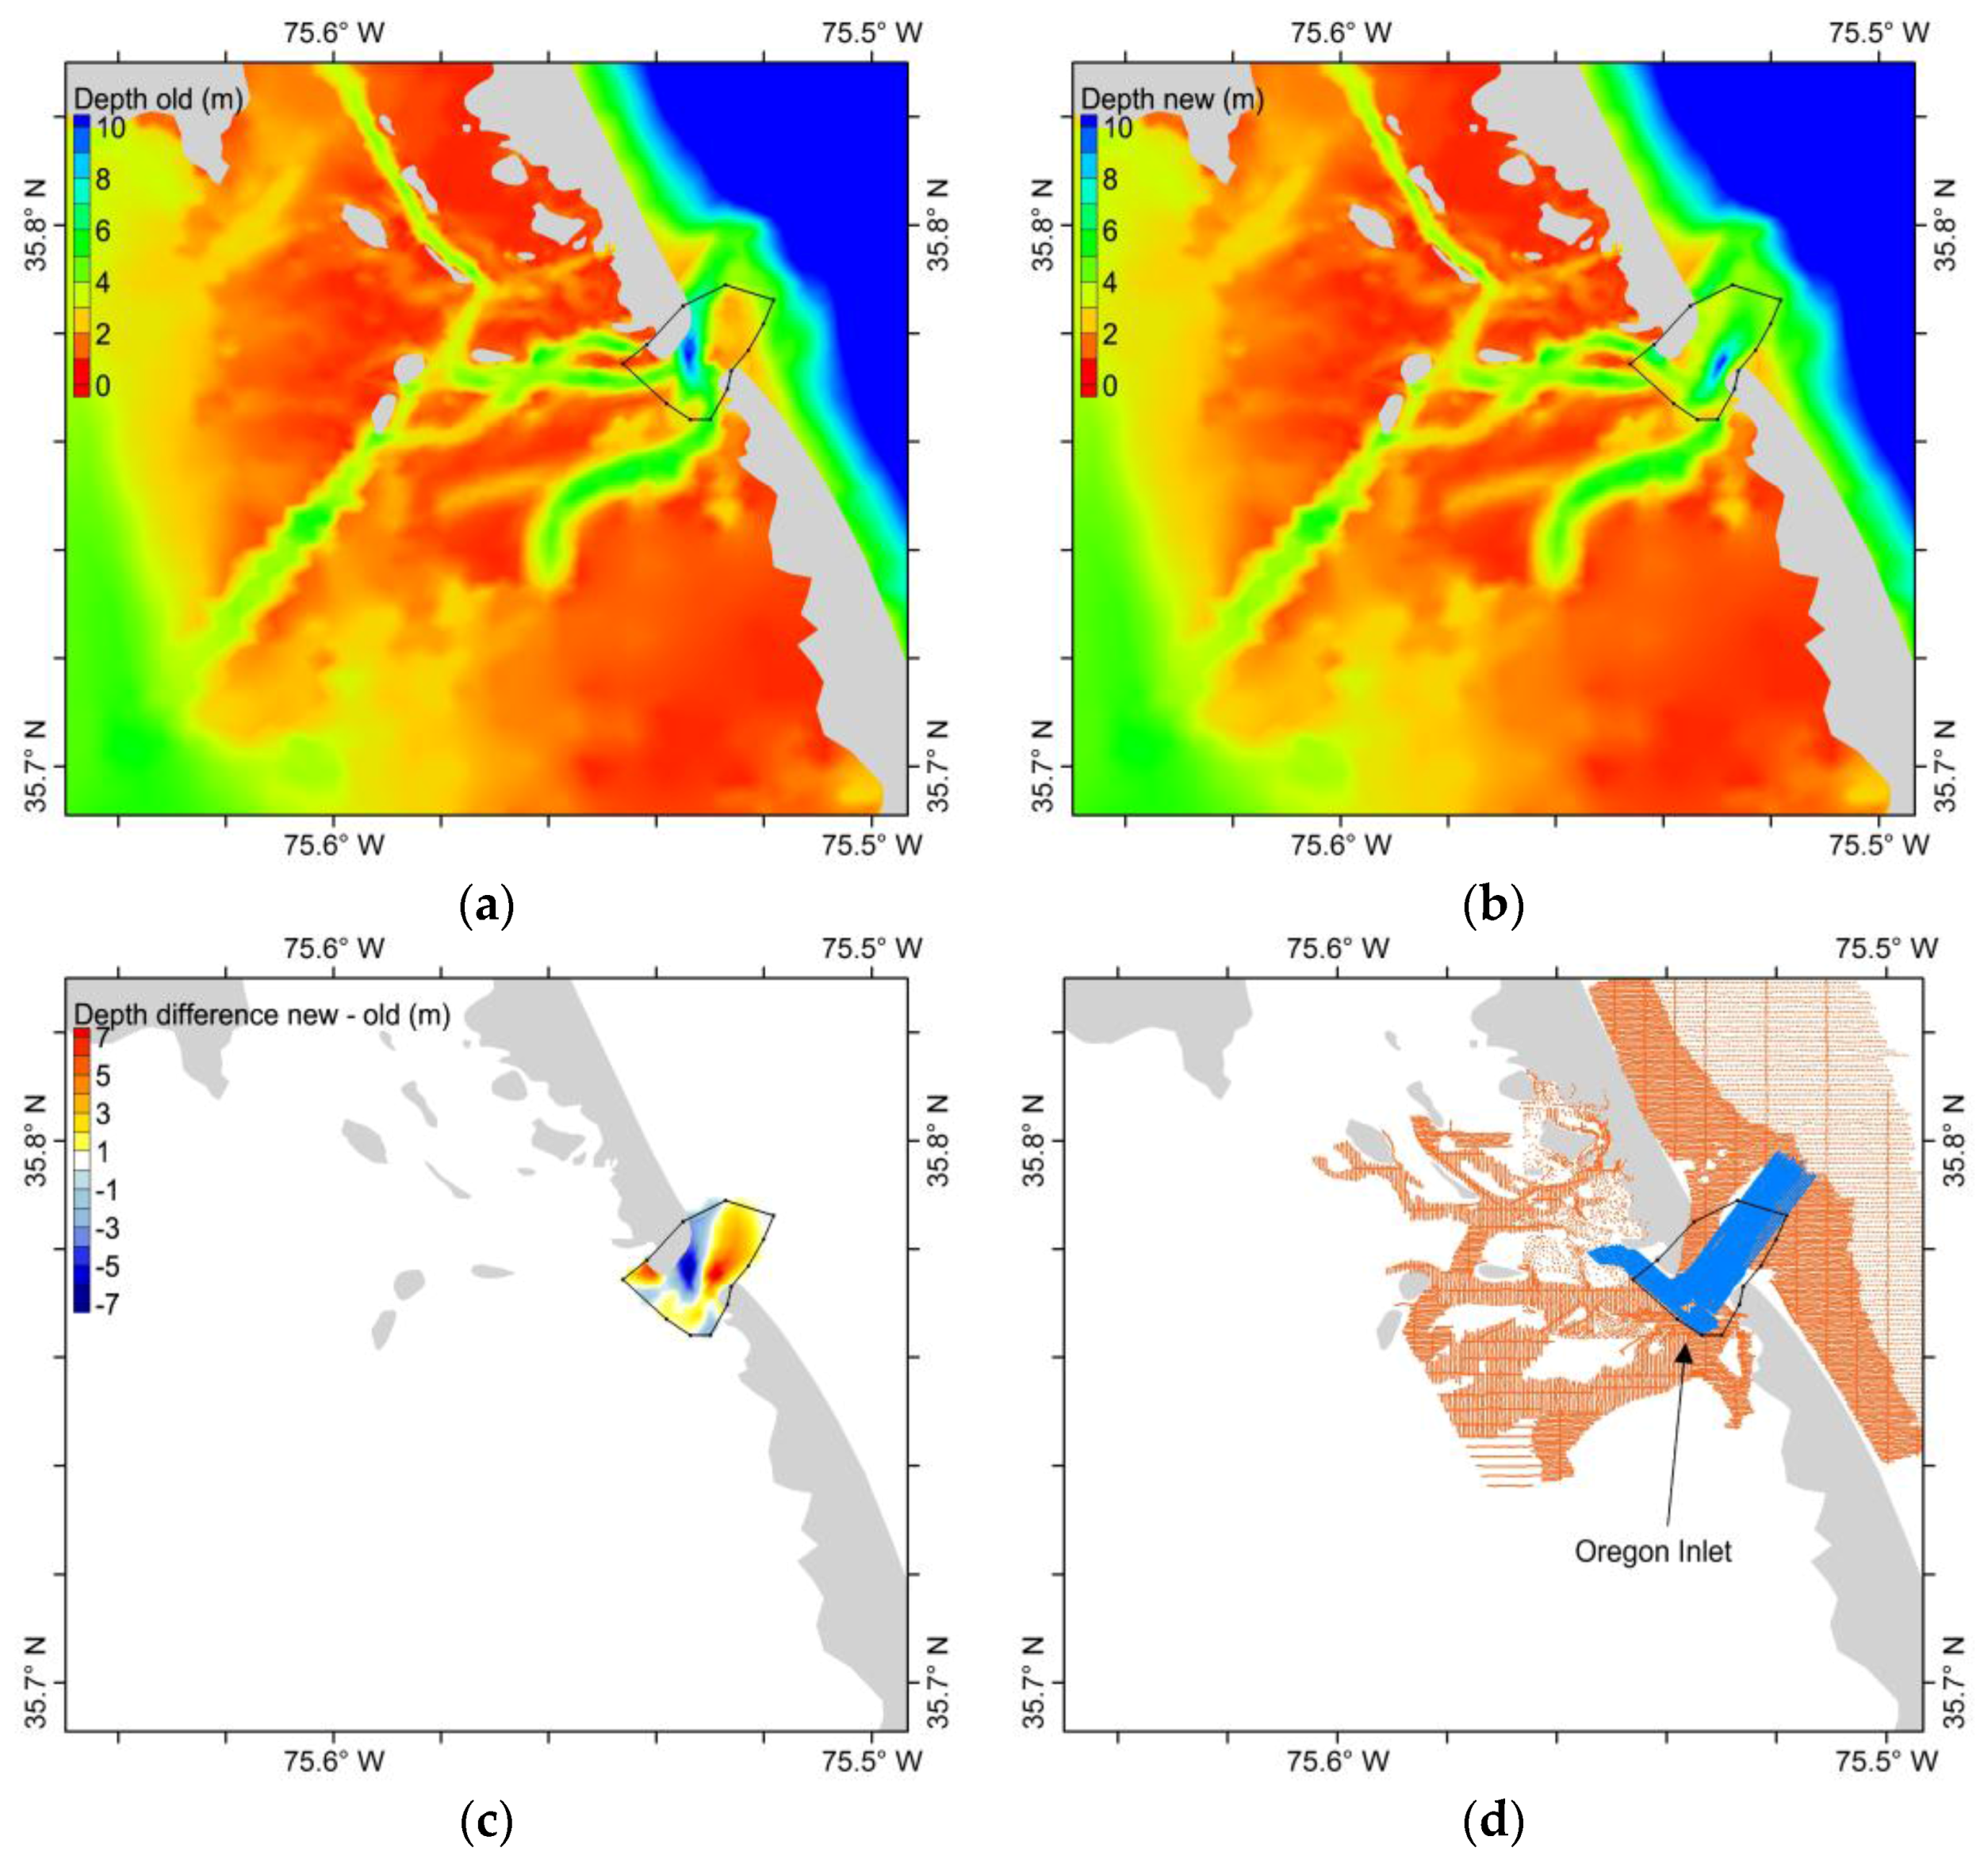
3.1. Tidal Datum Changes Due to Morphological Changes of the Inlets
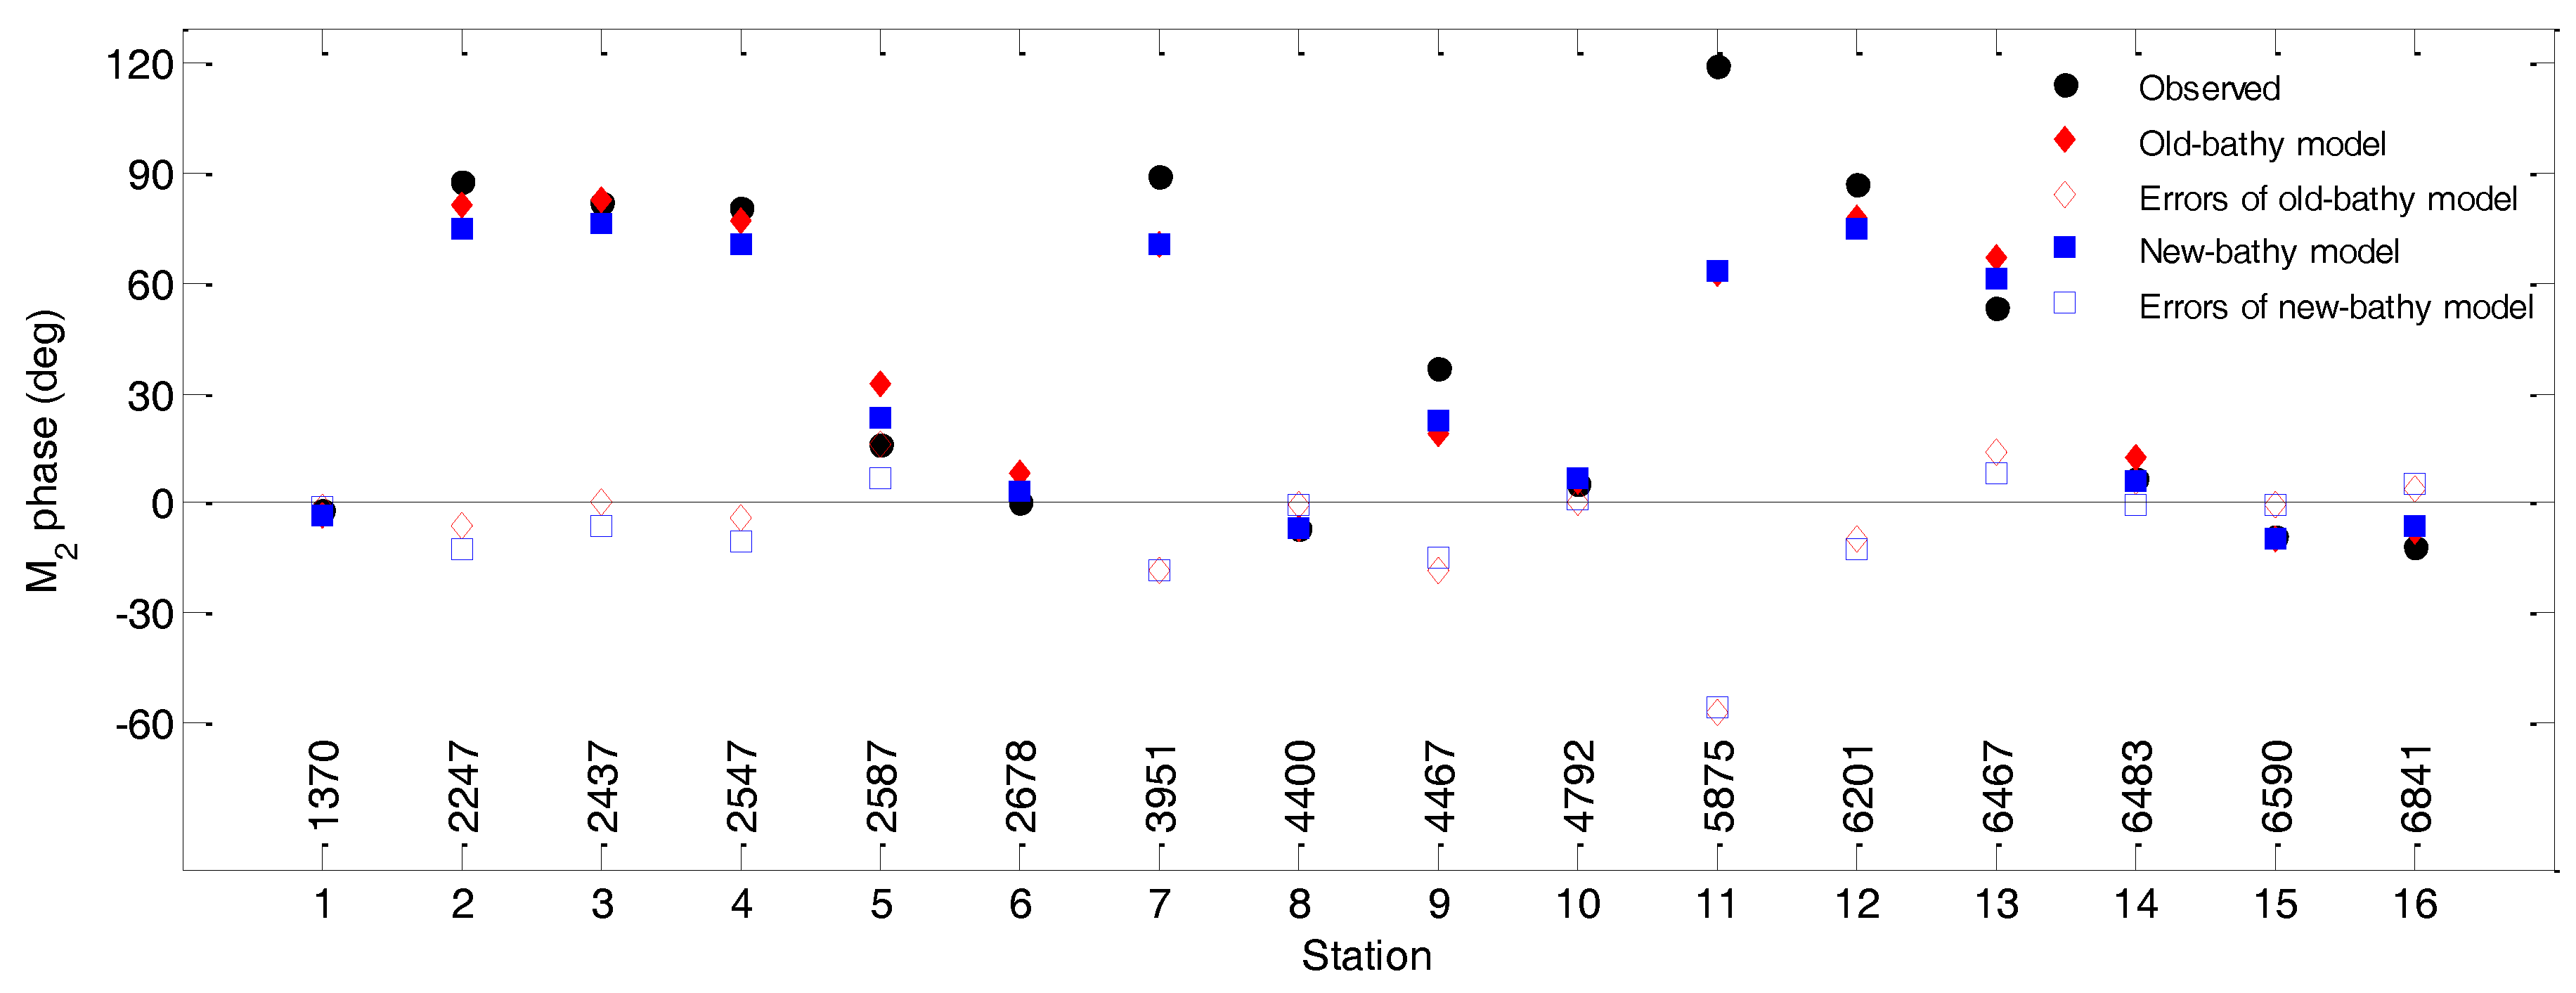
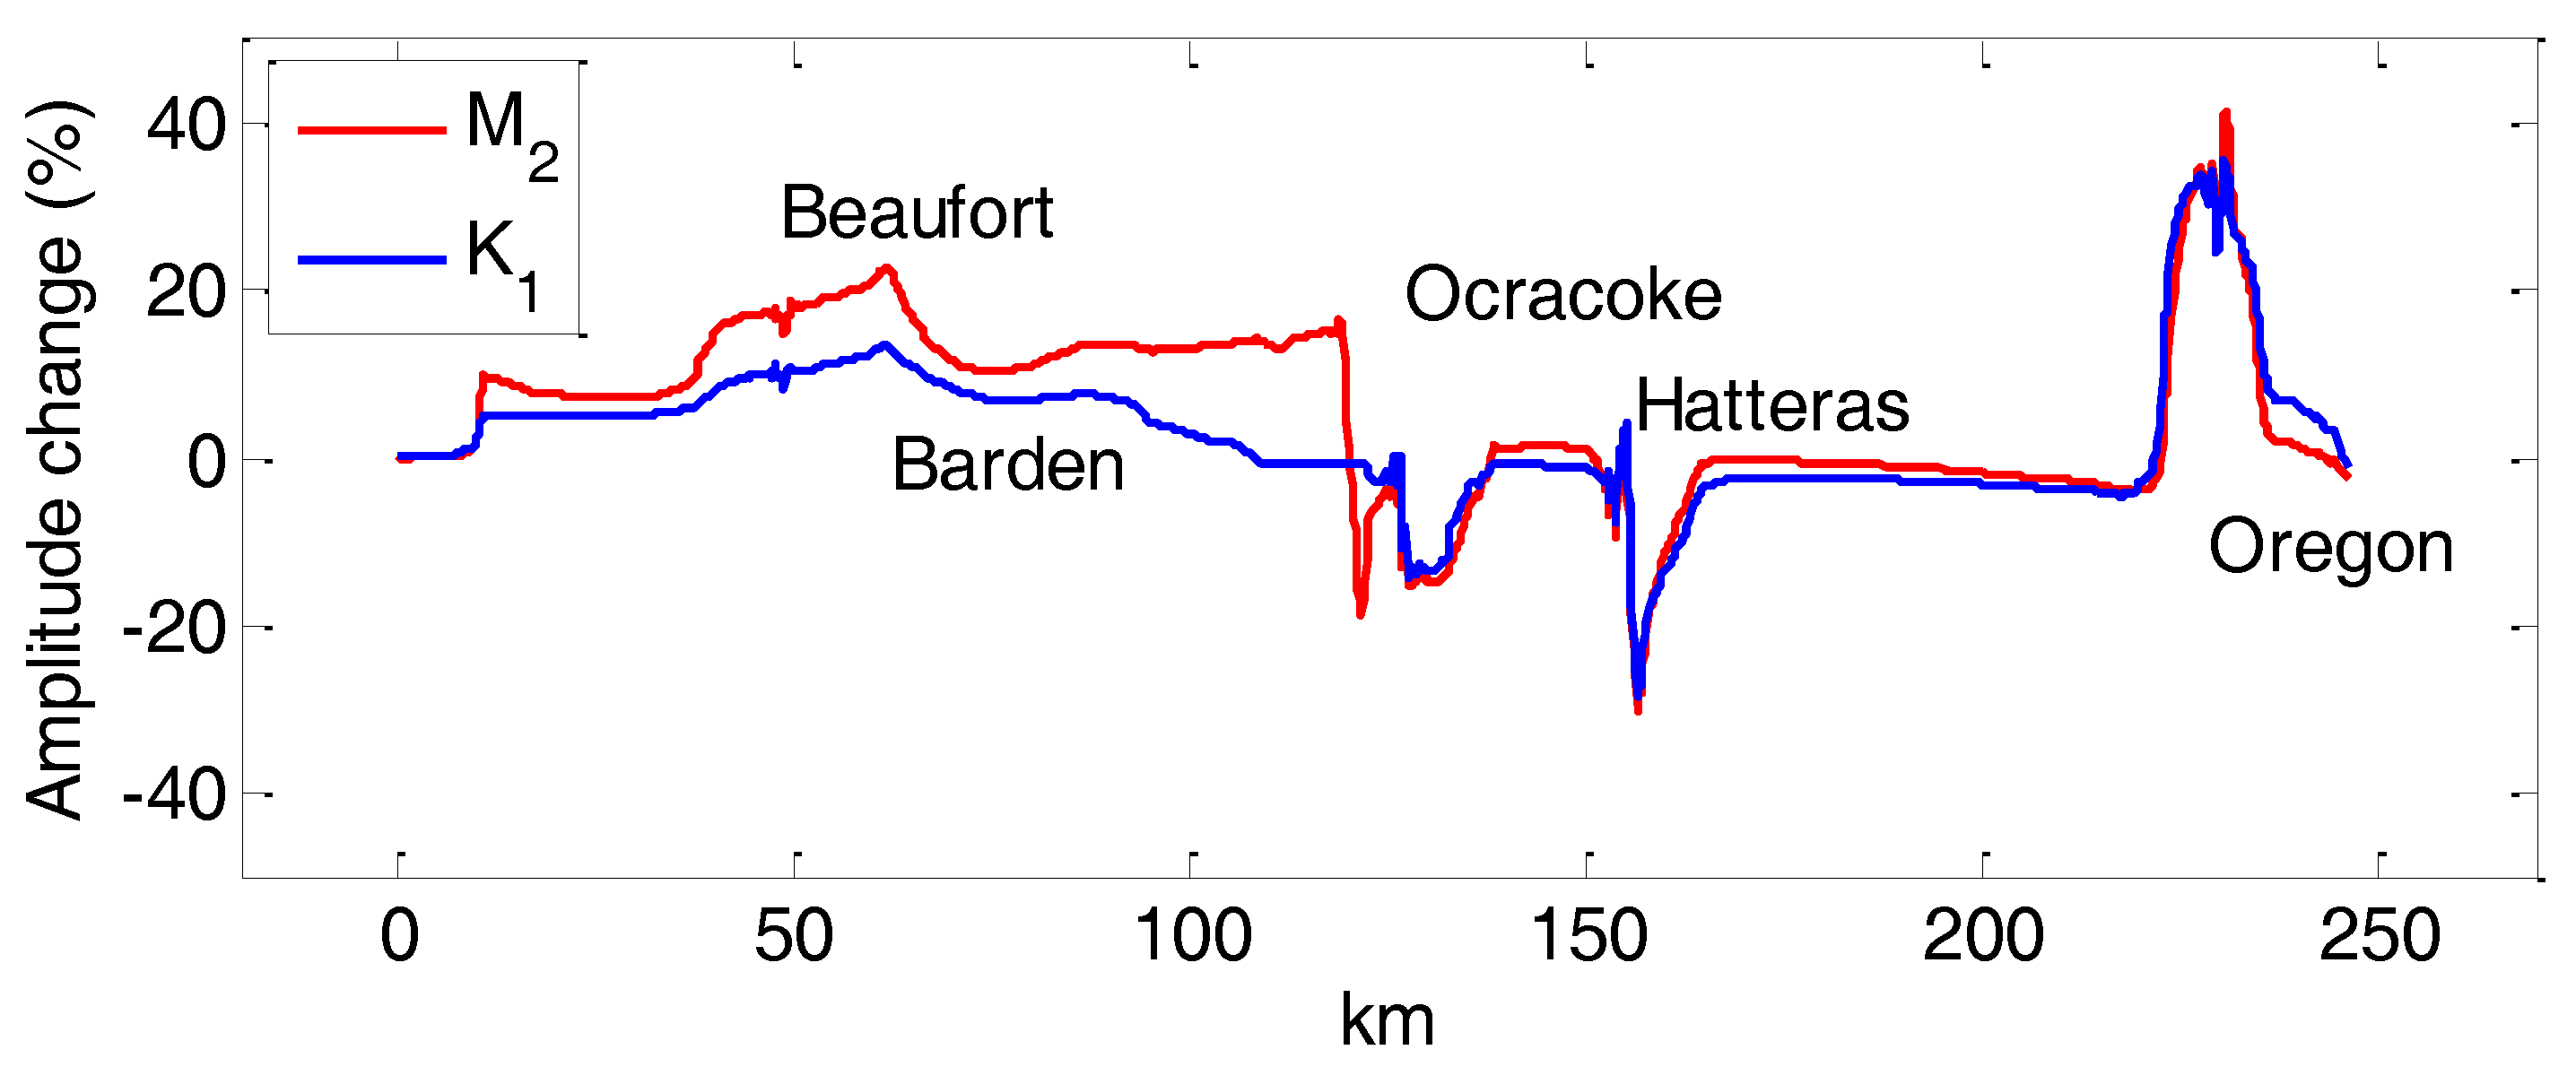
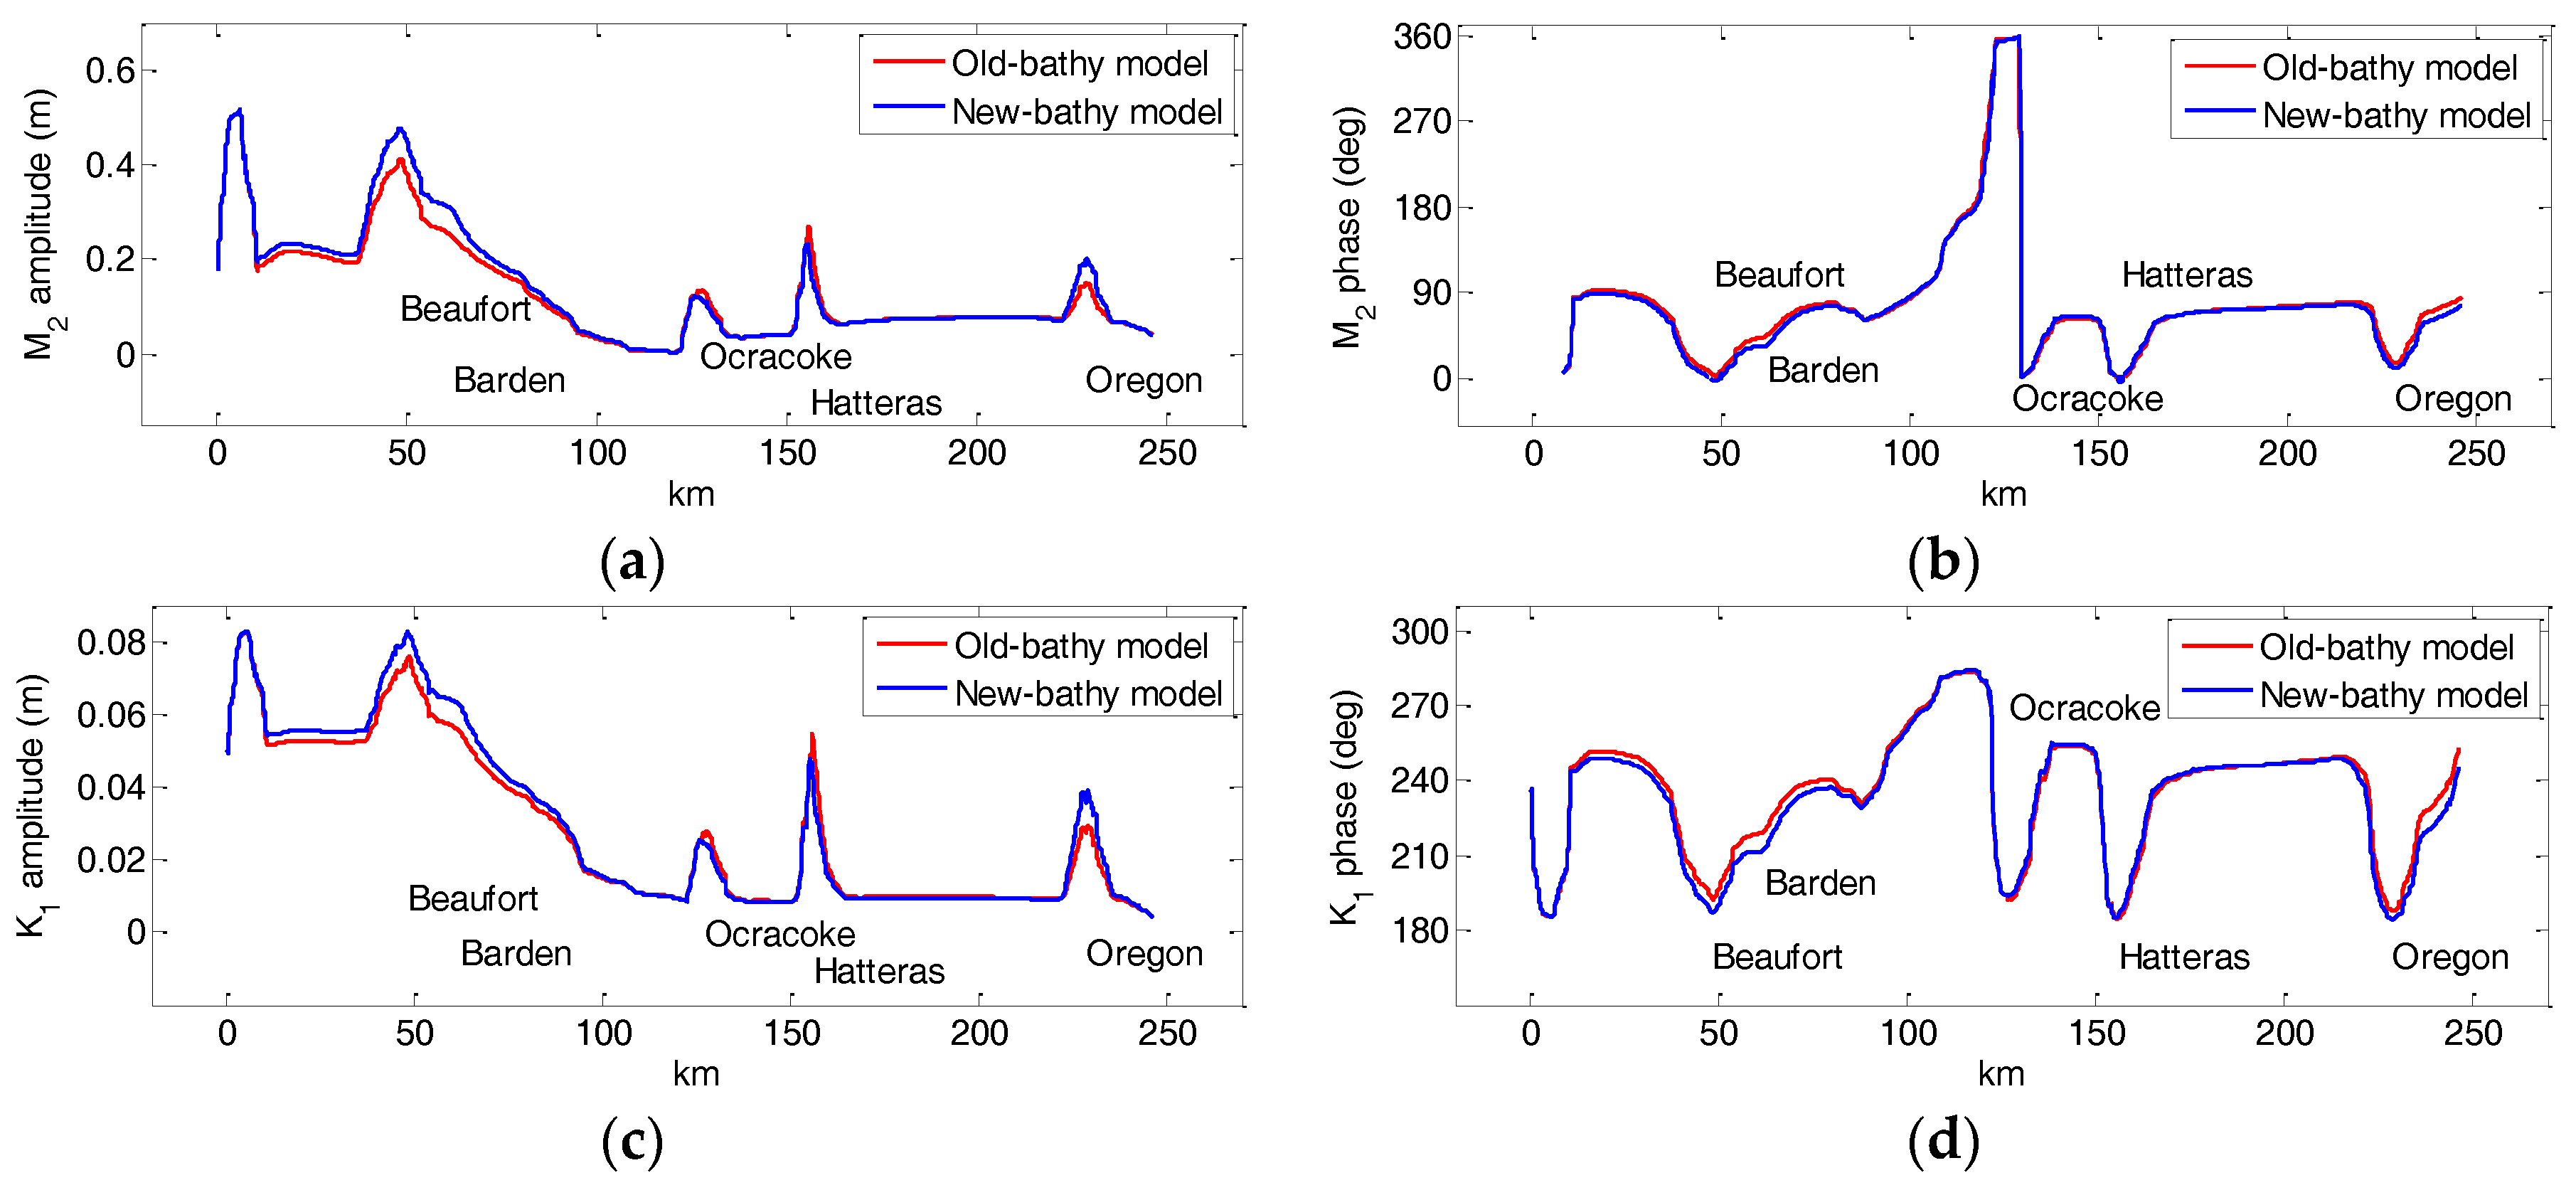
3.2. Tidal Harmonic Changes
4. Discussion and Conclusions
Acknowledgments
Author Contributions
Conflicts of Interest
References
- Parker, B.B.; Hess, K.W.; Milbert, D.G.; Gill, S. A national vertical datum transformation tool. Sea Technol. 2003, 44, 10–15. [Google Scholar]
- Eakins, B.W.; Taylor, L.A. Seamlessly integrating bathymetric and topographic data to support tsunami modeling and forecasting efforts. In Ocean Globe; Bremen, J., Ed.; ESRI Press Academic: Redlands, CA, USA, 2010; pp. 33–86. [Google Scholar]
- National Ocean Service. Tidal Datums and Their Applications; NOAA Technical Report NOS COOPS 1; Center for Operational Oceanographic Products and Services: Silver Spring, MD, USA, 2000; p. 112.
- National Ocean Service. VDatum Manual for Development and Support of NOAA’s Vertical Datum Transformation Tool, VDatum. 2012; p. 119. Available online: http://vdatum.noaa.gov/docs/publication.html (accessed on 20 September 2016). [Google Scholar]
- Luettich, R.A., Jr.; Westerink, J.J.; Scheffner, N.W. ADCIRC: An Advanced Three-Dimensional Circulation Model for Shelves Coasts and Estuaries, Report 1: Theory and Methodology of ADCIRC-2DDI and ADCIRC-3DL; Dredging Research Program Technical Report DRP-92-6; U.S. Army Engineers Waterways Experiment Station: Vicksburg, MS, USA, 1992; p. 137. [Google Scholar]
- Westerink, J.J.; Luettich, R.A.; Muccino, J.C. Modeling tides in the Western North Atlantic using unstructured graded grids. Tellus A 1994, 46, 178–199. [Google Scholar] [CrossRef]
- Mukai, A.Y.; Westerink, J.J.; Luettich, R.A.; Mark, D. Eastcoast 2001: A Tidal Constituent Database for the Western North Atlantic, Gulf of Mexico and Caribbean Sea; Technical Report, ERDC/CHL TR-02-24; US Army Engineer Research and Development Center, Coastal and Hydraulics Laboratory: Vicksburg, MS, USA, 2002; p. 201. [Google Scholar]
- Hench, J.L.; Luettich, R.A.; Westerink, J.J.; Scheffner, N.W. ADCIRC: An Advanced Three-Dimensional Circulation Model for Shelves, Coasts, and Estuaries, Report 6: Development of a Tidal Constituent Database for the Eastern North Pacific; Dredging Research Program Technical Report DRP-92-6; U.S. Army Engineer Waterways Experiment Station: Vicksburg, MS, USA, 1994; p. 21. Available online: http://acwc.sdp.sirsi.net/client/search/asset/1004166 (accessed on 20 September 2016).
- Blain, C.A.; Rogers, E. Coastal Tidal Prediction Using the ADCIRC-2DDI Hydrodynamic Finite Element Model; Formal Report NRL/FR/7322-98-9682; Naval Research Laboratory, Stennis Space Center: Hancock County, MS, USA, 1998; p. 92. Available online: http://www.dtic.mil/dtic/tr/fulltext/u2/a358752.pdf (accessed on 20 June 2016).
- Luettich, R.A., Jr.; Carr, S.D.; Reynolds-Fleming, J.V.; Fulcher, C.W.; McNinch, J.E. Semi-diurnal seiching in a shallow, micro-tidal lagoonal estuary. Cont. Shelf Res. 2001, 22, 1669–1681. [Google Scholar] [CrossRef]
- Burrows, R.; Walkington, I.A.; Yates, N.C.; Hedges, T.S.; Wolf, J.; Holt, J. The tidal range energy potential of the west coast of the United Kingdom. Appl. Ocean Res. 2009, 31, 229–238. [Google Scholar] [CrossRef]
- Hess, K.; Spargo, E.; Wong, A.; White, S.; Gill, S. VDatum for Central Coastal North Carolina: Tidal Datums, Marine Grids, and Sea Surface Topography; NOAA Technical Report NOS CS 21; the National Oceanic and Atmospheric Administration: Silver Spring, MD, USA, 2005; p. 46.
- Hayes, M.O. General morphology and sediment patterns in tidal inlets. Sediment. Geol. 1980, 26, 139–156. [Google Scholar] [CrossRef]
- Hubbard, D.K.; Oertel, G.; Nummedal, D. The role of waves and tidal currents in the development of tidal-inlet sedimentary structures and sand body geometry: Examples from North Carolina, South Carolina, and Georgia. J. Sediment. Petrol. 1979, 49, 1073–1092. [Google Scholar]
- Komar, P.D. Tidal-inlet processes and morphology related to the transport of sediments. J. Coast. Res. 1996, 23–45. [Google Scholar]
- Cayocca, F. Long-term morphological modeling of a tidal inlet: The Arcachon Basin, France. Coast. Eng. 2001, 42, 115–142. [Google Scholar] [CrossRef]
- Militello, A.; Zarillo, G.A. Tidal motion in a complex inlet and bay system, Ponce de Leon Inlet, Florida. J. Coast. Res. 2000, 16, 840–852. [Google Scholar]
- Boon, J.D.; Byrne, R.J. On basin hyposmetry and the morphodynamic response of coastal inlet systems. Mar. Geol. 1981, 40, 27–48. [Google Scholar] [CrossRef]
- Fitzgerald, D.M. Geomorphic variability and morphologic and sedimentologic controls of tidal inlets. J. Coast. Res. 1996, 47–71. [Google Scholar]
- Luettich, R.A., Jr.; Hench, J.L.; Fulcher, C.W.; Werner, F.E.; Blanton, B.O.; Churchill, J.H. Barotropic tidal and wind driven larvae transport in the vicinity of a barrier island inlet. Fish. Oceanogr. 1999, 8, 190–209. [Google Scholar] [CrossRef]
- Churchill, J.H.; Blanton, J.O.; Hench, J.L.; Luettich, R.A., Jr.; Werner, F.E. Flood tide circulation near Beaufort Inlet, North Carolina: Implications for larval recruitment. Estuaries 1999, 22, 1057–1070. [Google Scholar] [CrossRef]
- Inman, D.L.; Dolan, R. The Outer Banks of North Carolina: Budget of sediment and inlet dynamics along a migrating barrier system. J. Coast. Res. 1989, 5, 193–237. [Google Scholar]
- NOAA Tides and Currents Website: Water Levels. Available online: http://tidesandcurrents.noaa.gov/stations.html?type=Water+Levels (accessed on 20 September 2016).
- NOAA Tides and Currents Website: Datums. Available online: http://tidesandcurrents.noaa.gov/stations.html?type=Datums (accessed on 20 September 2016).
- NOAA Tides and Currents Website: Harmonic Constituents. Available online: https://tidesandcurrents.noaa.gov/stations.html?type=Harmonic+Constituents (accessed on 20 September 2016).
- NOAA Shoreline Website. Available online: https://shoreline.noaa.gov (accessed on 20 September 2016).
- National Centers for Environmental Information (NCEI) Bathymetry and Global Relief. Available online: https://www.ngdc.noaa.gov/mgg/bathymetry/relief.html (accessed on 20 September 2016).
- Becker, J.J.; Sandwell, D.T.; Smith, W.H.F.; Braud, J.; Binder, B.; Depner, J.; Fabre, D.; Factor, J.; Ingalls, S.; Kim, S.-H.; et al. Global bathymetry and elevation data at 30 arc seconds resolution: SRTM30_PLUS. Mar. Geod. 2009, 32, 355–371. [Google Scholar] [CrossRef]
- US Army Corps of Engineering Wilmington District Website: Hydrographic Surveys. Available online: http://www.saw.usace.army.mil/Missions/Navigation/Hydrographic-Surveys/ (accessed on 20 September 2016).
- Olsen Associates, Inc. Inlet Dredging and Disposal. In Regional Sand Transport Study: Morehead City Harbor Federal Navigation Project Summary Report; Olsen Associates, Inc.: Jacksonville, FL, USA, 2006. Available online: http://www.carteretcountync.gov/DocumentCenter/View/268 (accessed on 20 June 2016). [Google Scholar]
- NOAA VDatum Website: Estimation of Uncertainties. Available online: http://vdatum.noaa.gov/docs/est_uncertainties.html (accessed on 20 September 2016).


| Inlet | Width (km) | Area with Changed Bathymetry (km2) | Collection Years of Old Bathymetry | Mean Depth of Old-Bathy (m) | Collection Years of New Bathymetry | Mean Depth of New-Bathy (m) |
|---|---|---|---|---|---|---|
| Beaufort | 1.3 | 6.2 | 1953 | 5.0 | 2010 | 7.2 |
| Barden | 0.7 | 4.3 | 1955 | 1.7 | 2015 | 2.9 |
| Ocracoke | 2.4 | 8.8 | 1956, 1962 | 4.0 | 2013 | 4.9 |
| Hatteras | 2.2 | 8.7 | 1935 | 2.6 | 2014, 2015, 2016 | 2.7 |
| Oregon | 1.0 | 3.7 | 1975 | 3.6 | 2014, 2016 | 4.0 |
| Model | Mean Higher High Water (MHHW) (cm) | Mean High Water (MHW) (cm) | Mean Low Water (MLW) (cm) | Mean Lower Low Water (MLLW) (cm) |
|---|---|---|---|---|
| Old-bathy Model | 6.1 | 4.6 | 4.5 | 6.0 |
| New-bathy Model | 4.8 | 3.5 | 3.3 | 4.5 |
| Inlet | Flood Volume (106 m3) | Ebb Volume (106 m3) | Tidal-Cycle Residual (106 m3) | Flood Duration (h) | Ebb Duration (h) |
|---|---|---|---|---|---|
| Beaufort (old) | 111.31 | −113.60 | −2.29 | 5.95 | 6.53 |
| Beaufort (new) | 129.37 | −121.43 | 7.95 | 5.99 | 6.48 |
| Barden (old) | 21.72 | −18.76 | 2.96 | 5.92 | 6.56 |
| Barden (new) | 30.02 | −27.67 | 2.36 | 5.96 | 6.51 |
| Ocracoke (old) | 132.47 | −141.34 | −8.87 | 5.79 | 6.71 |
| Ocracoke (new) | 127.09 | −132.91 | −5.81 | 5.77 | 6.73 |
| Hatteras (old) | 122.12 | −122.90 | −0.78 | 5.80 | 6.70 |
| Hatteras (new) | 114.87 | −113.74 | 1.13 | 5.80 | 6.70 |
| Oregon (old) | 73.07 | −73.63 | −0.56 | 5.82 | 6.67 |
| Oregon (new) | 84.52 | −84.30 | 0.22 | 5.84 | 6.66 |
© 2016 by the authors; licensee MDPI, Basel, Switzerland. This article is an open access article distributed under the terms and conditions of the Creative Commons Attribution license ( http://creativecommons.org/licenses/by/4.0/).
Share and Cite
Wang, J.; Myers, E. Tidal Datum Changes Induced by Morphological Changes of North Carolina Coastal Inlets. J. Mar. Sci. Eng. 2016, 4, 79. https://doi.org/10.3390/jmse4040079
Wang J, Myers E. Tidal Datum Changes Induced by Morphological Changes of North Carolina Coastal Inlets. Journal of Marine Science and Engineering. 2016; 4(4):79. https://doi.org/10.3390/jmse4040079
Chicago/Turabian StyleWang, Jindong, and Edward Myers. 2016. "Tidal Datum Changes Induced by Morphological Changes of North Carolina Coastal Inlets" Journal of Marine Science and Engineering 4, no. 4: 79. https://doi.org/10.3390/jmse4040079
APA StyleWang, J., & Myers, E. (2016). Tidal Datum Changes Induced by Morphological Changes of North Carolina Coastal Inlets. Journal of Marine Science and Engineering, 4(4), 79. https://doi.org/10.3390/jmse4040079