1. Introduction
Climate changes projected for 2100 and beyond could result in a race for adaptation-related construction resources on a scale never seen before. Many adaptation projects will need to utilize the same types of construction resources simultaneously because local adaptation requirements are driven by global phenomena. Calculating potential global demand for several construction resources poses challenges, due to the site-specific nature of adaptation designs. In this research, we created a model to estimate resources required to adapt just one coastal use for the United States (US): major seaports. The US seaport system supports
$4.6 trillion in economic activity annually and 23 million jobs [
1]. As important hubs of commerce, damage to ports can cripple economies both locally and regionally, triggering far-reaching impacts to economic systems and supply chains [
2]. In 2013, Chambers et al. reported that freight vessels transported 53% of US imports and 38% of exports by value [
3]. Infrastructure construction takes years to plan, design, and build. Often outliving its 30–50-year design life, much port infrastructure built today will likely continue to function at the end of the century [
4]. Climate change over the next century could force multiple adaptations in many locations [
5]. To plan in advance, government and port authorities need to implement strategies to protect infrastructure for future environmental conditions [
4] as well as forecast the cost and demand of necessary construction [
5].
The location of coastal ports places them in the path of ocean storms and rising sea levels [
6]. As the impacts of climate change become more evident, port infrastructure is likely to be hit first and hit hardest, unless adaptation is undertaken [
7]. New projects for adaptation could place high demands on construction materials for the protection of major coastal seaports, not only in the US, but worldwide [
8]. A quantitative analysis to aggregate such potential costs to adapt ports has not yet been conducted [
9].
In this paper, we examine the cumulative regional and national costs of adapting 100 Hawaiian, Alaskan, West Coast, Gulf Coast and East Coast US coastal ports to sea level rise (SLR) through one potential adaptation solution: elevating the port footprint and reconstructing associated infrastructure. Scientists report the global SLR to range from 0.6 to 2.0 m by 2100 [
10,
11,
12], with an upper bound rise of 4.3 m by 2200 [
13,
14]. However, even a small amount of SLR can have major impacts on storm surge heights and associated flooding [
15]. Category 3–5 hurricanes in the Atlantic basin may double in frequency by 2100 [
16]. In 2012, Becker et al. found that a two-meter SLR was the threshold at which all seaport managers they surveyed felt that they would be required to act and protect their facilities [
17]. Some measure of coastal infrastructure protection can be achieved through the construction of dikes, relocation, or through elevation of ports [
8]. Each of these strategies will have costs and benefits to be considered by local decision makers. Dikes, for example, will protect some areas, but leave others exposed. Flooding could be worse for those areas just outside the dike, as surge waters that once flooded inland would be now displaced to the areas outside of a new structure. Financial considerations, as well as social and environmental issues, will all need to be considered carefully. Green solutions, such as the Room for the River project in the Netherlands, can also help to offset flooding to infrastructure [
18]. Ultimately, decision makers will implement different strategies for different infrastructure assets, but all strategies will be cost and materials intensive [
19,
20,
21].
Here, we explore only one strategy: elevating the footprint and infrastructure of coastal ports in the United States two meters based on high-end projections for SLR by 2100 [
11]. We do not advocate this as the appropriate or best solution for any specific port and note that elevating a port alone may create additional challenges for multi-modal connections and surrounding areas. For example, if a port is elevated, but critical rail and road connections remain below flood elevations, the port would be rendered inoperable for the movement of cargo during flood events. We also do not assess the risk or probability of sea level rise and surge for individual ports, which have already been addressed [
22,
23,
24]. Rather, we present this estimation as a thought exercise to provoke consideration of the cumulative resource demands of widespread adaptations to maintain functioning seaports and for consideration of design and planning of future port expansion. These calculations can serve as an “upper-bound estimate” of potential investment for one particular strategy. Analyzing the cumulative demands can present a clearer picture of the challenges inherent in any strategy for protection, not only in the procurement of funding, but also in the procurement of materials such as fill.
Researchers have estimated costs to adapt coastal structures at a global scale [
9] and for the US [
25,
26] for a variety of adaptation strategies. Hinkel et al. [
27], for example, calculate costs to protect coastal areas by utilizing a theoretical dike design [
28] at the coastline. The height and cost of the structure increases relative to the asset value and population requiring protection, amounting to an annual investment and maintenance cost of
$12–71 billion in 2100 to protect coastal areas [
27]. Nicholls et al. [
9] calculated that adapting ports worldwide would cost approximately
$0.21 billion per year. By leveraging local information and engineering knowledge, Becker et al. in their “minimum assumption credible design” (MACD) found that in order to protect 221 of the worlds seaports using a dike and berm design, approximately 436 million cubic meters of construction material would be required [
5]. Except for this last example, most studies are not based on detailed design specifications that incorporate materials and costs of various components. In practice, every seaport is different: they handle different cargos, are of different sizes, and face a range of environmental conditions. As an in-depth assessment of each individual port and its infrastructure would take thousands of hours to complete, developing a national estimate requires a simplified method. The method in this paper serves as a pilot for the development of such aggregate estimates; this method could be used in other sectors (e.g., power plants, sewage treatment facilities, and airports) to develop an understanding of the potential cost and resources required for adaptation to climate change.
This study used a generic container port model, “GenPort” to extrapolate aggregate costs using empirical data for 100 coastal port land areas throughout the US. Typically, estimation for such projects is conducted on a case-by-case basis and utilizes estimation tools such as the Construction Specifications Institute [
29]
MasterFormat model which breaks construction costs into divisions of work such as concrete, plumbing and finishes. This approach is too specific for the purposes of creating aggregate estimates. Instead, the GenPort cost estimations were based on ground elevation and a simplified approach that categorizes the major types of port infrastructure requiring reconstruction. Methods on the development of our cost and materials estimates are summarized below (full details and equations may be found in the
Appendix A and
Appendix B).
2. Methodology
We generated aggregate estimates of costs and material requirements to elevate and retrofit US ports by designing a retrofit for a “generic container port” model (GenPort). Using GenPort as a basis to estimate costs of land elevation and infrastructure retrofit to mitigate SLR simplifies what, in practice, would require complex site-specific projected calculations [
6]. GenPort contains the typical components of a container shipping port in the US. It comprises a 0.4 square kilometer (100 acre) two-berth marine container terminal (Pers. comm. T. Ward) such as one that might be retrofitted from an existing functioning port. We calculated the cost of infrastructure reconstruction per square meter of the GenPort as well as the cost to elevate by two meters in order to develop an equation for calculating the full cost to elevate and retrofit GenPort (see
Appendix A). We use RSMeans cost data, allowing for unit-based estimations (e.g., square meter of infrastructure) to estimate costs for administration buildings and warehouses. RSMeans provides cost information used for estimates and projections in the construction industry (see
www.rsmeans.com). Then, we calculated the land area for 100 major coastal commercial ports in the US by region (see
Appendix B). Finally, we combined the costs to reconstruct and elevate GenPort with the aggregate land area of the 100 coastal ports in the US to obtain a national cost estimate. True costs for the retrofit would of course differ for liquid bulk, dry bulk, or general cargo terminals and in many cases would likely be higher than retrofitting a container terminal. However, we used the GenPort design as a proxy, as most major ports are container facilities. The model was run using a two-meter elevation design for this pilot study, but could easily be run with higher or lower elevations. Recent SLR projections suggest two meters as an upper bound projection for SLR by 2100 [
12,
14,
30,
31]. In addition, port operators suggested that a two meter rise would prompt them to take significant measures to adapt their infrastructure [
17].
2.1. GenPort Retrofit Design
The GenPort design assumed that existing port infrastructure is currently at an elevation that protects it from present day storm surge and sea levels. Thus, elevation of the primary and secondary container yard areas increases the level of protection by providing for an additional two meters of rise for future climate-driven projections. Changes in storm surge height are dependent on local bathymetry and the geography of the local coastline [
32]. Therefore, the change in storm surge height could vary significantly along a fairly short distance of coastline [
33,
34]. Though two meters is a global average, local and regional variations would result in different levels of rise and different future storm surge levels for any given port. Some of the projected future impacts will be due to an increase in storm intensity [
35]. Other potential threats are explained by anthropogenic subsidence that can lead to the rapid sinking of ground levels. For example, the Long Beach/Los Angeles port experienced at least two meters of subsidence due to oil pumping in the past century [
36]. These variations remain difficult to accurately project [
37], thus the single SLR value of two meters was used for this pilot study.
We based the technical design of GenPort’s layout on reconstruction plans for the Port of Gulfport (MS) after it was destroyed by a nine meter storm surge during Hurricane Katrina [
38] and on the general plan for container ports outlined by Thoresen in 2003 [
39]. The Port of Gulfport adopted a plan to elevate the entire container port from three to nine meters as a strategy to build the port’s resilience to Katrina-magnitude storms. Their design called for the elevation of the primary and secondary yards, where containers are stored, while leaving the berth and apron at a height suitable for offloading cargo from container ships. Over time, the apron area would also need elevation, but retrofitted incrementally to keep pace with sea level rise. The difference in height between the apron area and main yard areas would be accommodated through a retaining wall and ramps to allow for the movement of containers between the two yards. Though the Port of Gulfport ultimately did not move forward with this plan [
40], it stands as an example of how a port retrofit design could feasibly elevate a portion of the port’s footprint to accommodate storm surges associated with sea level rise. Outside of this plan from the Port of Gulfport, we found no other “real world examples” of designs for elevating an entire port. While the GenPort layout would be appropriate for many terminals and was used as a basis for analysis, large modern terminals would likely require variations in design to facilitate the transport of cargo between the apron and the primary yard. For example, one alternative design would place the retaining wall behind the landward crane rail. This would allow for the transfer of containers between the apron and the yard via the crane, eliminating the need for cargo transport via ramps (though perhaps requiring taller cranes). This design variation would not significantly impact the cost estimate generated in this investigation, but does illustrate that actual designs would vary from port to port based on their needs.
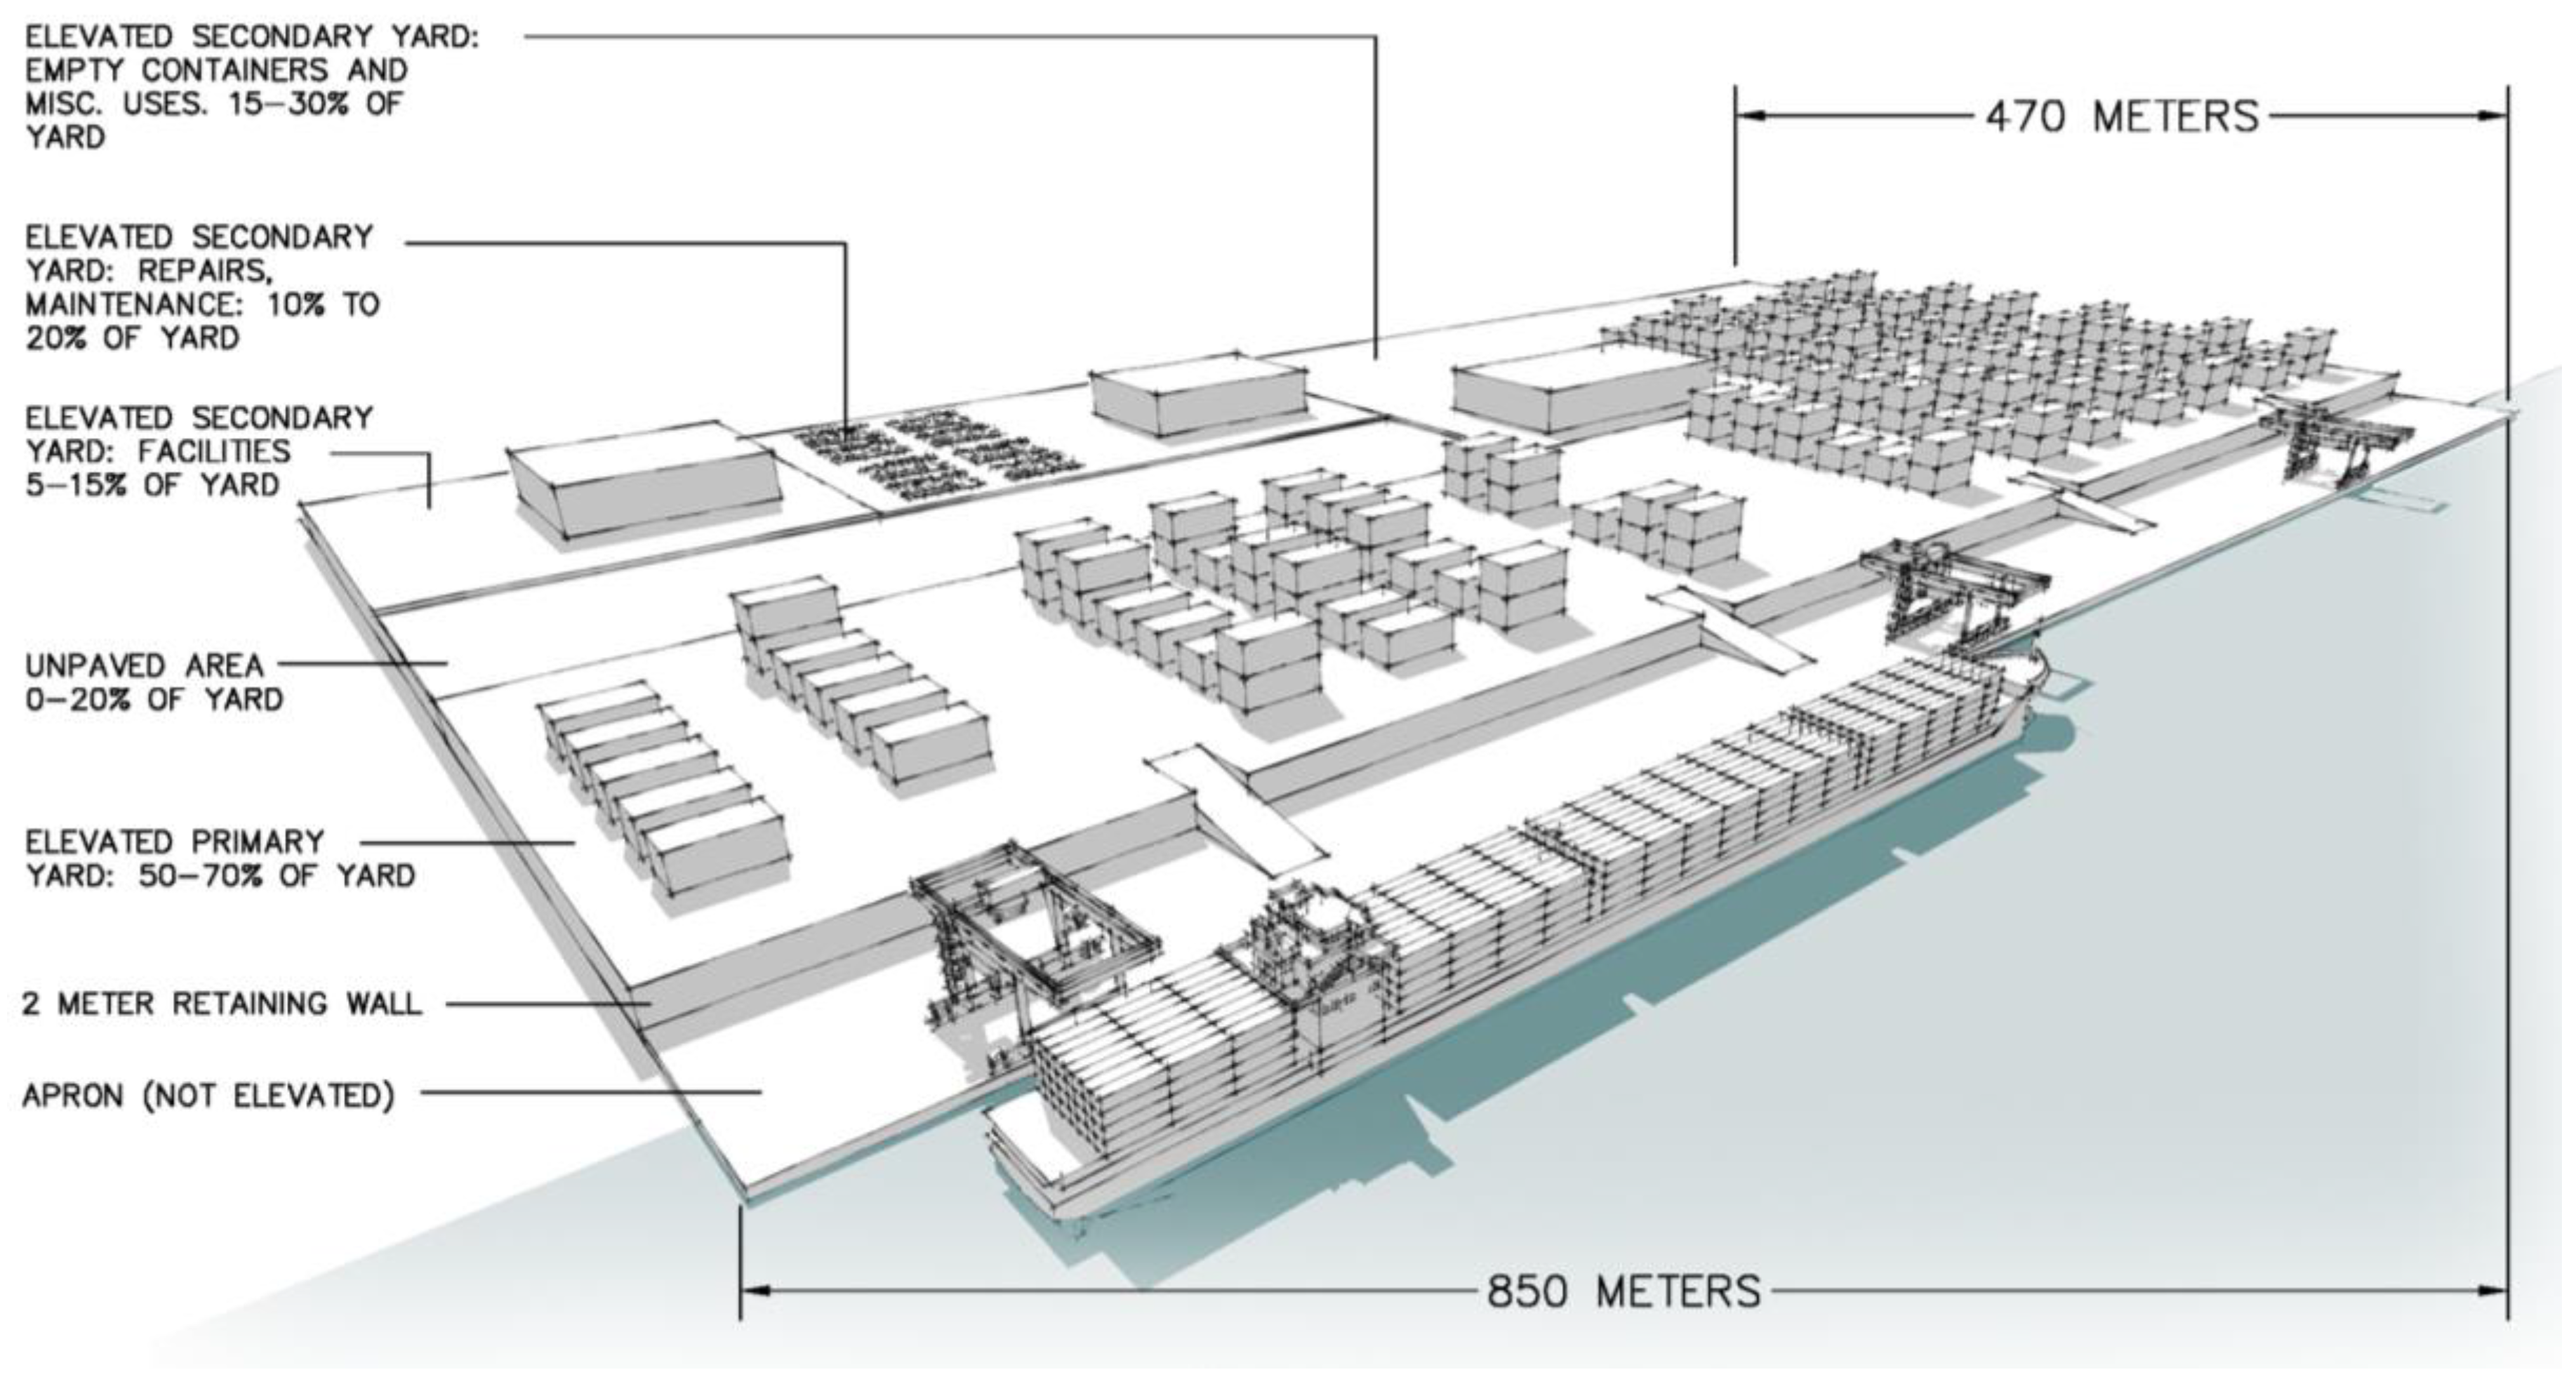
GenPort consists of general use areas and generic building types in order to develop equations to calculate the cost of reconstruction on a square meter basis. The costs to elevate appropriate portions of the terminal and to construct ramps and a retaining wall were also developed into equations. The land use at GenPort was divided into three area components: apron, primary yard and secondary yard (
Figure 1). For the elevated primary and secondary yard areas, we include a range of land use combinations to accommodate a variety of port configurations. Infrastructure costs vary with land use type, and using a range of land use ratios allows for the integration of this variation into the cost estimate.
2.1.1. Apron
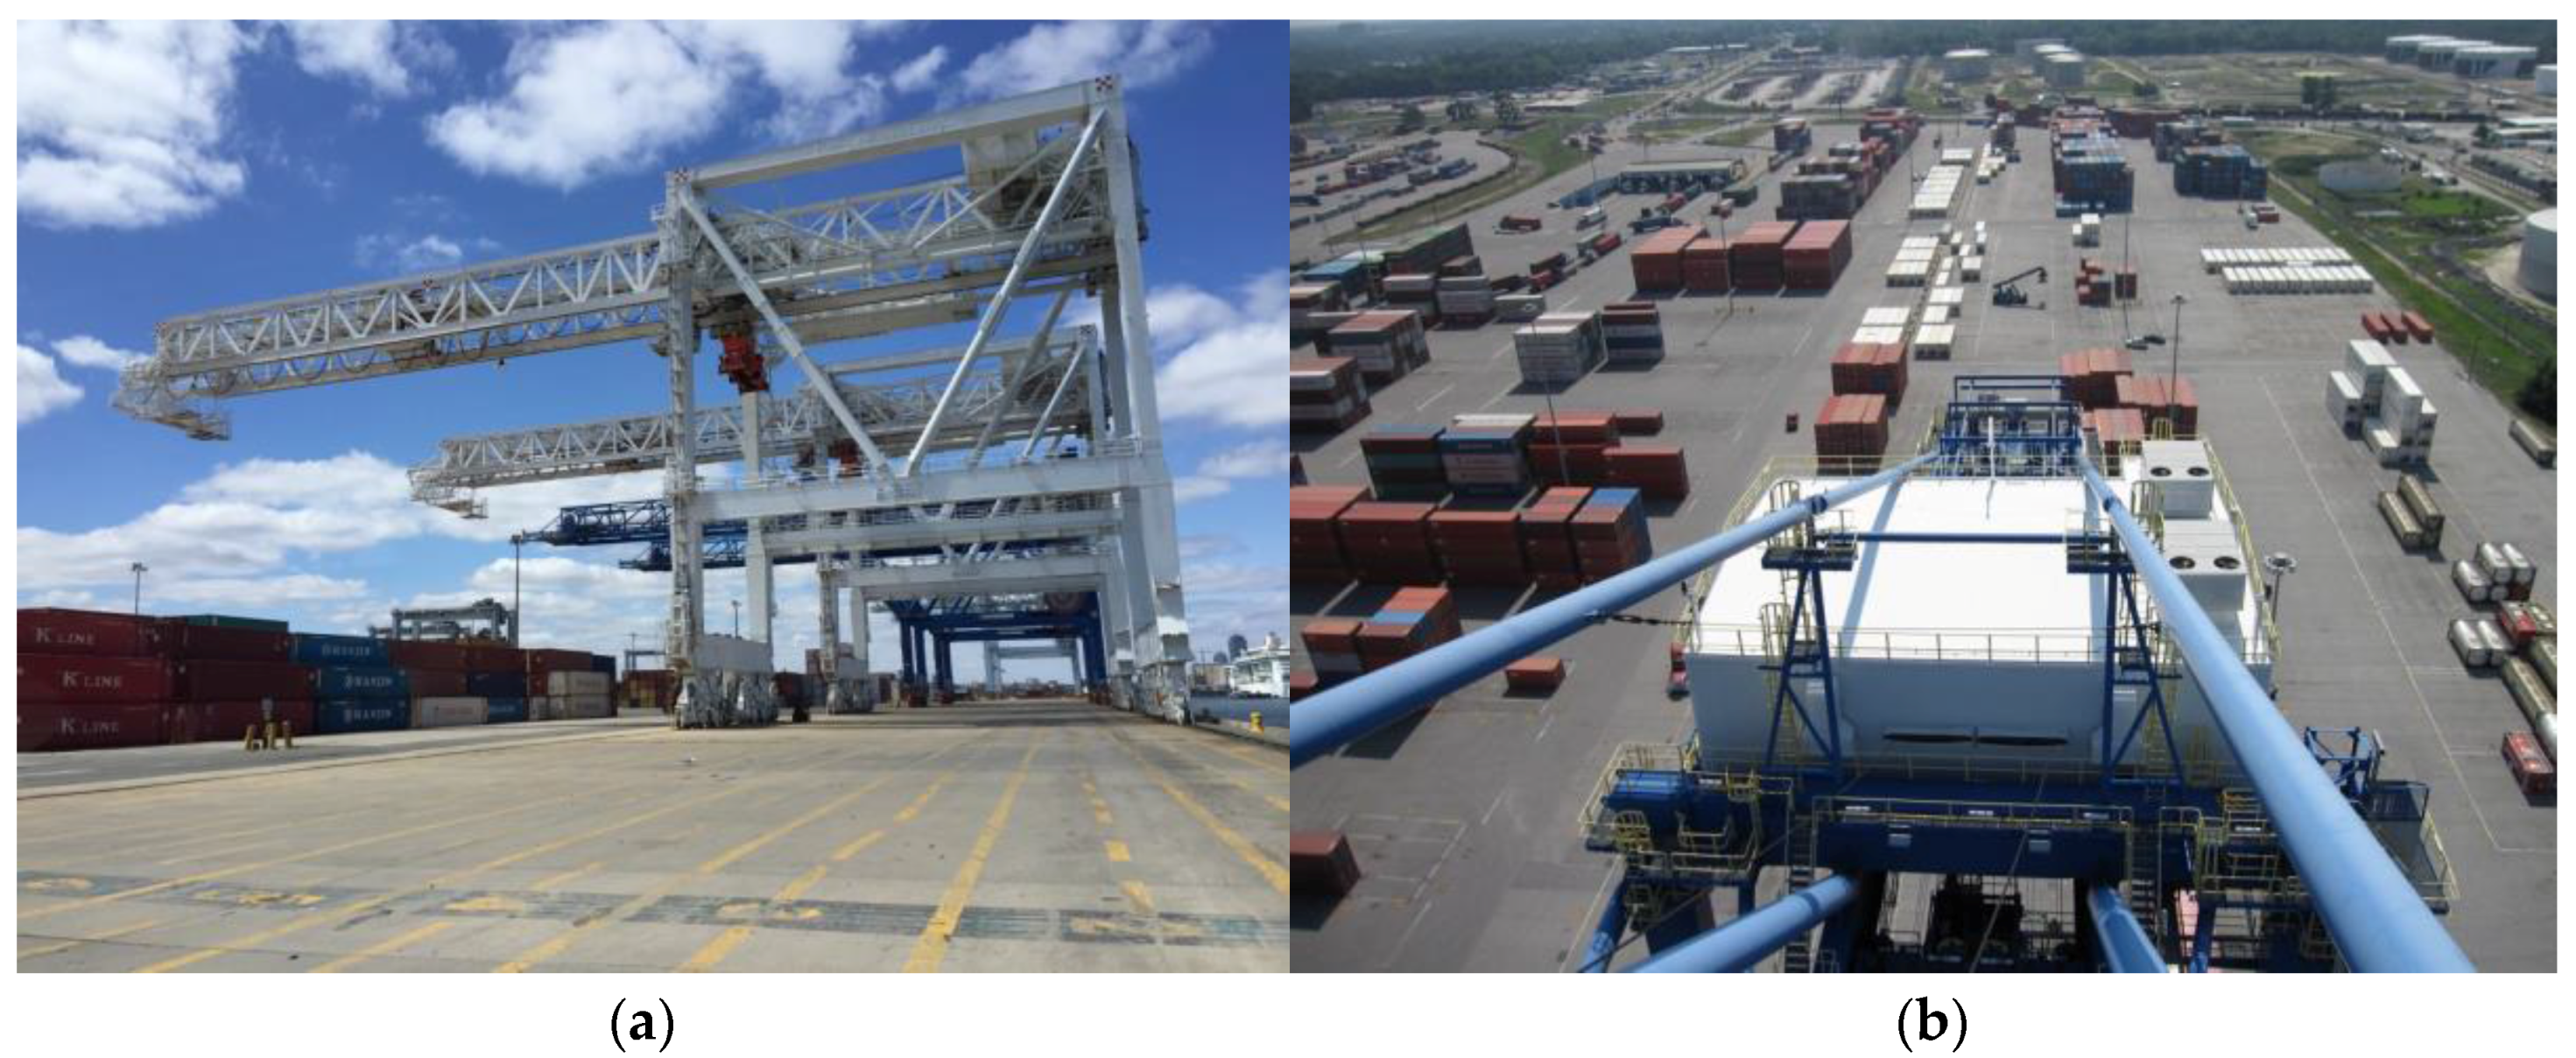
The apron is the area immediately behind the berth where ships tie up and the cargo is loaded and unloaded (
Figure 2a). At a container port, the cranes sit on the apron and lift cargo on or off the ship to or from trucks or rail, which move the containers to other secondary yard locations at the port or to an off-port destination (
Figure 2b). This area typically has a width of 15 to 50 m [
39]. The GenPort layout assumes a width of 35 m. In the GenPort design, the apron remains at its pre-retrofit elevation (generally approximately 2–3 m above mean high tide levels) while the primary and secondary yards are elevated.
2.1.2. Primary and Secondary Yards
The primary yard for container and cargo storage is located behind the apron and takes up 50–70% of the total yard area [
39]. Cargo and facilities on the primary yard are exposed to storm surge impacts at many ports. For this exercise, we elevated the primary yard in the GenPort design by two meters to accommodate future SLR and storm surges. It incorporates the construction of a new retaining wall between the apron and the primary yard.
The secondary yard contains four main sections [
39]: (1) the area for facilities such as office buildings, customs facilities and parking, which takes up 5–15% of the total yard area; (2) an area that holds empty containers and the container freight station which takes up 15–30% of the total yard area; (3) an area for repairs, storage and maintenance, which takes up 10–20% of the total yard area; and (4) an area that is unpaved, which takes up 0–20% percent of the total area (
Figure 2). The secondary yard was also elevated two meters. In the next sections, we use the GenPort model to develop the cost estimate calculations for both elevation (e.g., fill procurement and placement) and reconstruction of GenPort’s major facilities.
2.2. Cost Estimate Calculation to Elevate and Retrofit GenPort
The total cost to elevate one square meter the GenPort was presented as the Total Port Adaptation Cost (TPC). This value resulted from calculating the estimates for the total fill placement costs (FC) combined with retaining wall cost (RWC), ramp cost (RC), yard cost (YC) and geotechnical assessment cost (GC). Here, geotechnical assessment refers to engineering, physical, and environmental surveys of the construction site with a particular focus on soils and foundation conditions. Engineering and administration costs were assumed to be equal to 10% and 8% of the construction costs, respectively. Administration costs include miscellaneous insurance, bonding, construction management, and permitting. We incorporated these costs by applying a 1.18 multiplication factor to the base construction costs (see Equation (A1)).
The fill cost to raise the elevation of the port assumes the availability of clean, soft dredged material from the surrounding area. The unit cost of dredging was taken from the Army Corps of Engineers annual analyses of dredging costs [
41]. Use of dredged material was generally more cost effective than trucking in fill from offsite. Dredging will not always be possible due to lack of suitable dredging material or environmental restrictions. In some locations, contaminated dredge material, rock bottoms requiring blasting, or other circumstances make the use of dredged fill infeasible. The cost of overland fill in these situations is likely to be within the same order of magnitude as the total cost presented in
Table 1. Calculations are based on clean dredge materials.
Fill cost calculations included dredging costs from 2007 through 2012. New work dredging costs were converted to 2012 dollars and averaged to incorporate year-to-year cost fluctuations. A 20% dozing and compaction factor accounted for the cost of placing the fill (
Table 1). The calculations excluded the costs of erosion control or potential environmental protection requirements.
The cost of fill (FC) per square meter for elevated portions of the GenPort utilizes the total fill cost (
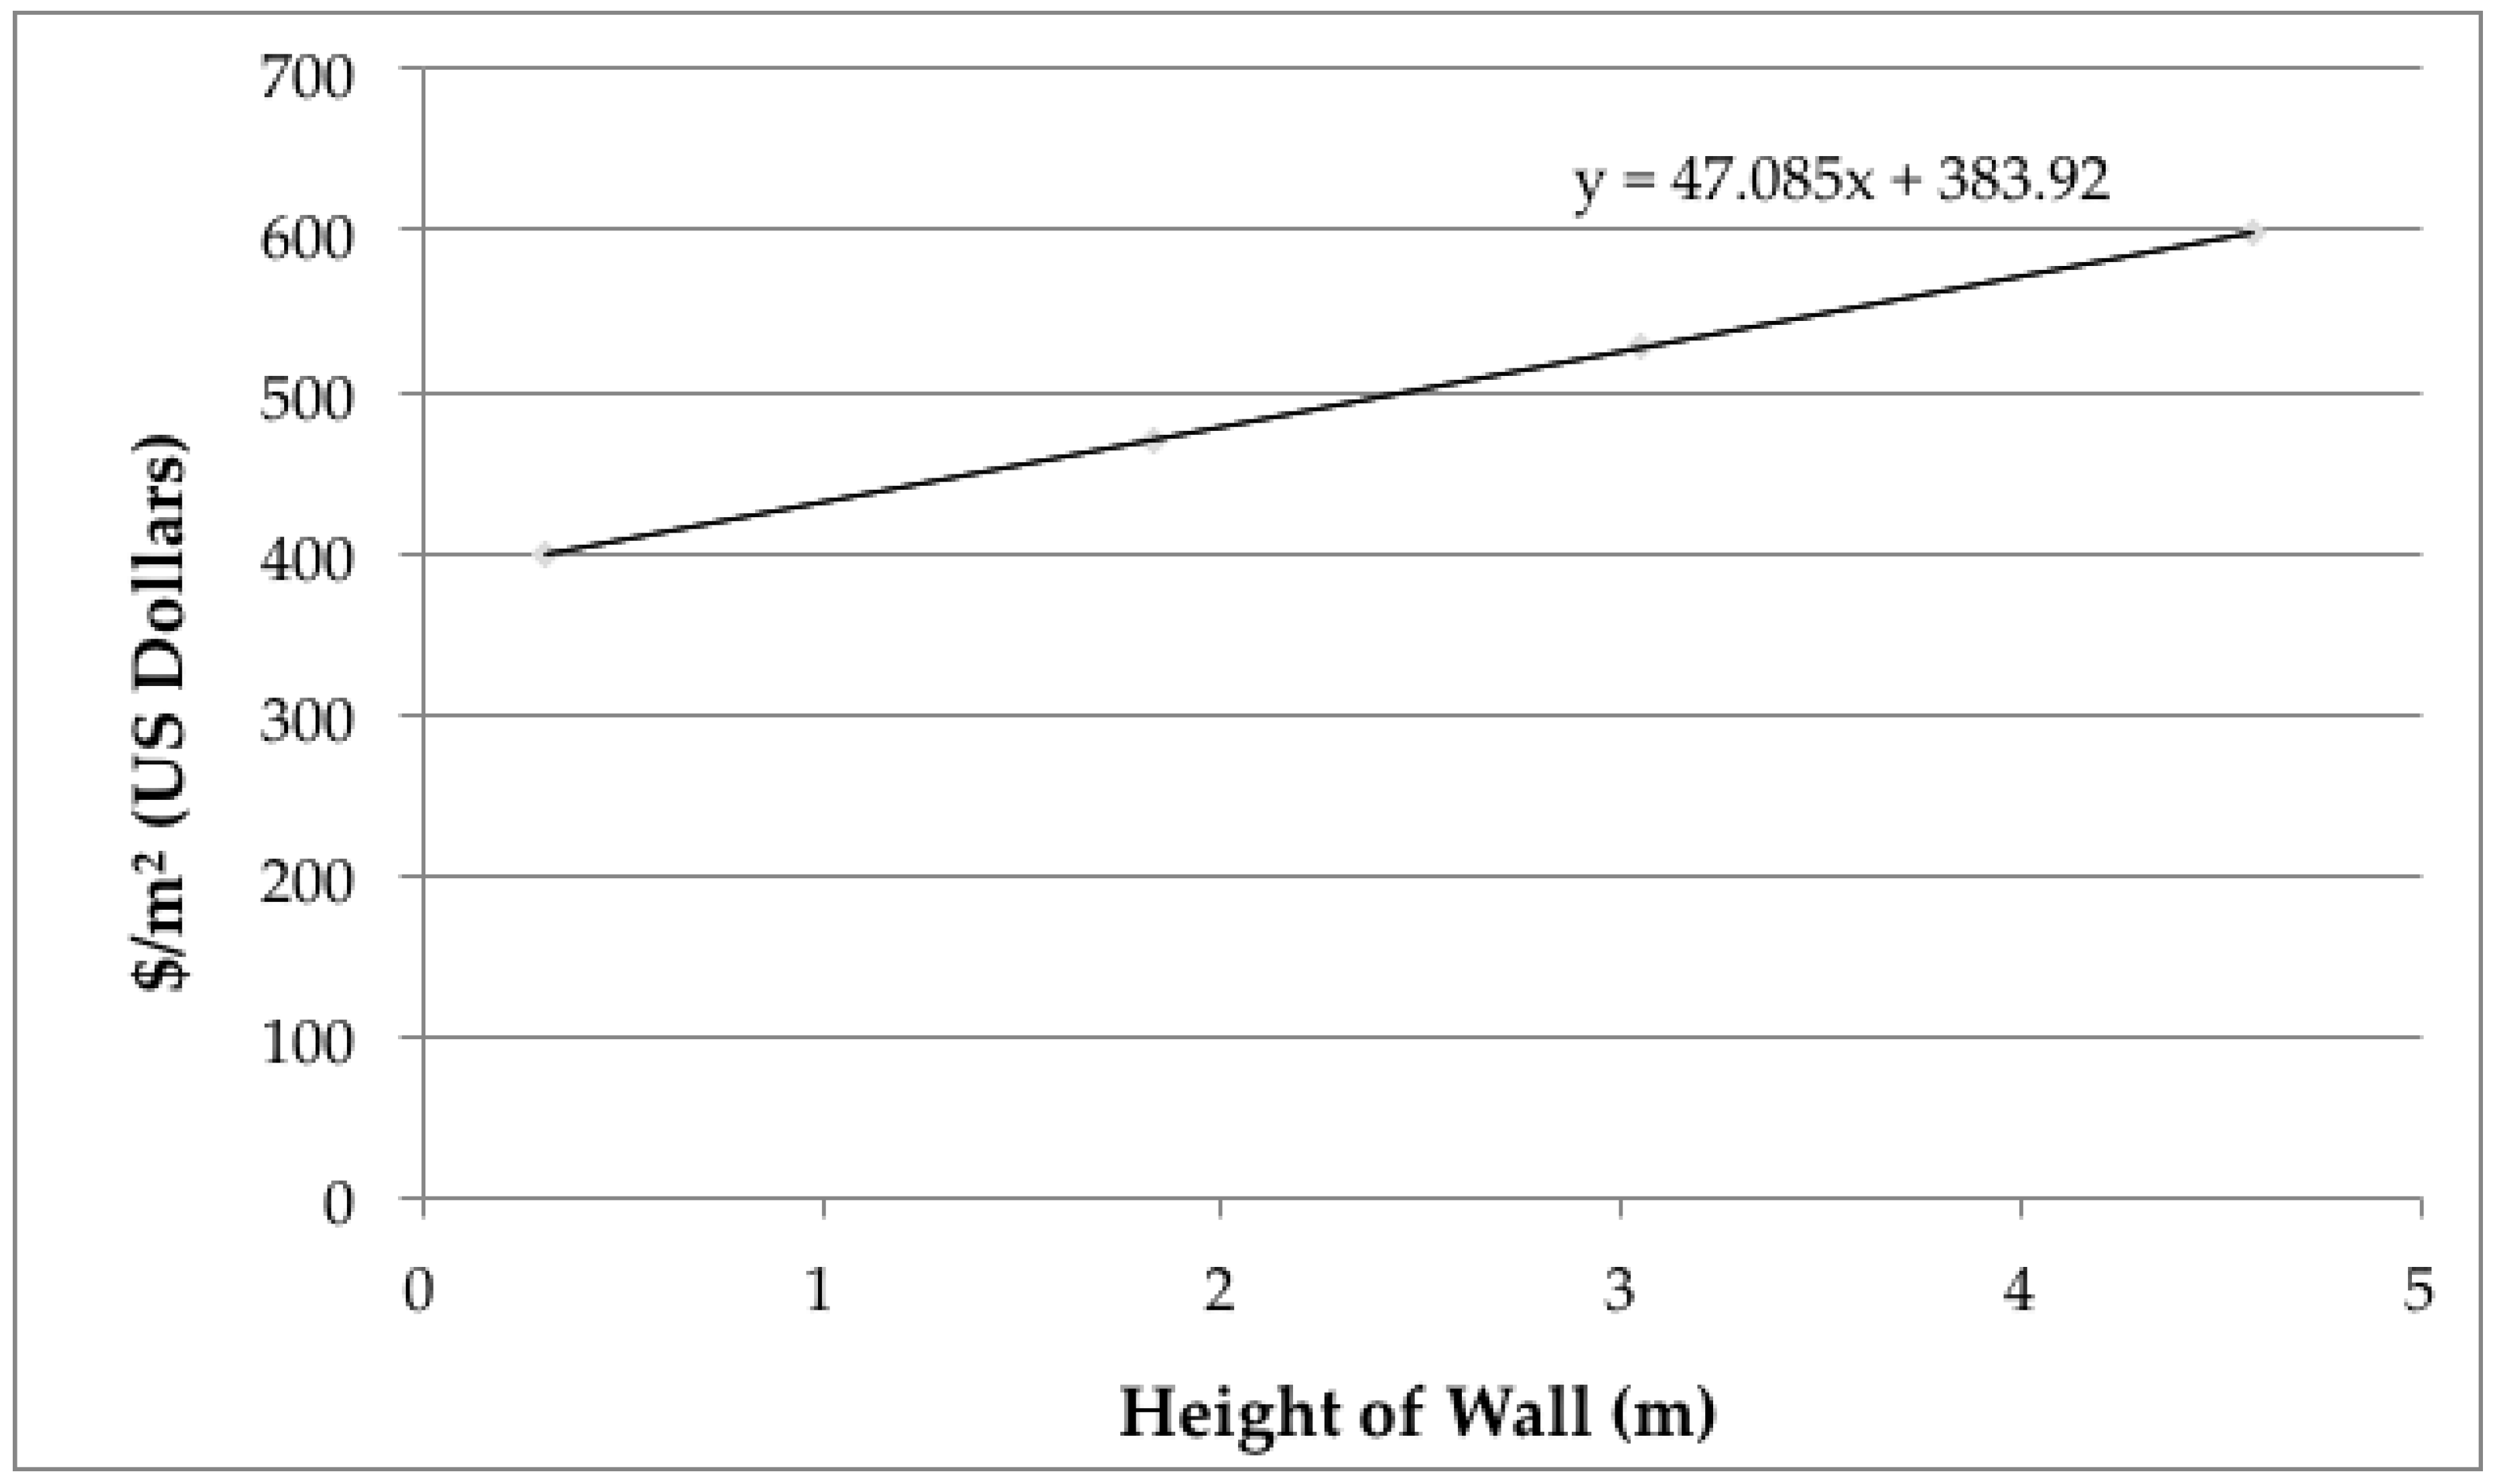
Table 1) (see also Equation (A2)) multiplied by the height of the elevation increase and by the fraction of the port area to be elevated, represented by the variable EA. This was equal to the elevated area of the port divided by the total port area (for the GenPort model, EA equals 0.926 because 92.6% of the total port area is elevated). The GenPort design assumed the construction of a retaining wall at the boundary between the apron and the primary yard as a means of holding back the fill in the elevated port area. To calculate the cost per linear meter of the retaining wall, the cost of a cast-in-place level concrete retaining wall from RSMeans was used. Because the square meter cost of the wall increased with the height of the wall, the height of the wall and the square meter cost of the wall were treated as a linear relationship (
Figure 3). To calculate the retaining wall cost per square meter of port (RWC), the retaining wall square meter cost (see trend line equation in
Figure 3) was multiplied by the elevation increase to calculate the linear cost of the retaining wall and divided by 470 m, the width of the GenPort model (Equation (A3)).
The ramp cost (RC) variable represents the cost of ramp construction per square meter of port. Ramps enable access between the apron and the yard of the port. The ramps used in our calculations are 10 m in width and have a five percent incline. We accounted for the construction of two ramps per berth, totaling four ramps in the GenPort model. We assumed this construction uses the same dredged fill material used to elevate the yard, topped with 15 cm of crushed 2.5–1.3 cm stone base and 20 cm thick concrete paving (
Table 2) [
42,
43]. For these unit costs, the price associated with constructing a single ramp increases as a function of the elevation increase. We calculated the total ramp construction cost per square meter of port by multiplying one ramp cost by four ramps per model port and then dividing by the total GenPort area (see Equation (A4)).
The yard surface and structures costs (YC) incorporate two major components: a primary yard where most container storage and movements on and off the port takes place and a secondary yard that holds empty containers, a container freight station, and space for repairs, storage and maintenance. Facilities such as office buildings, customs facilities and parking are also located on the secondary yard. Unpaved areas may also provide space for freight laydown or storage but do not contribute to the yard cost.
The primary yard, which requires paving, uses concrete block pavers because they function well in areas where heavy equipment is in use. Asphalt has a lower load capacity than concrete and there is a higher possibility of container supports penetrating asphalt, especially when its bearing capacity has been further reduced by warm weather [
39]. For this exercise, no distinction was made between traffic lanes inside the yard and the actual stacking areas, as concrete block pavers were assumed for both. The presented calculations assumed that the subgrade soil condition was good because the new construction would take place on the site of the existing port.
The Port Designer’s Handbook recommends the use of 8–10 cm thick inter-locking concrete pavers or 10–12 cm thick rectangular concrete pavers [
39]. Similar to the Dundalk and Seagirt marine terminal repaving projects [
42], we used concrete pavers on top of a bed of sand, a bituminous-stabilized base course, and a crushed stone subbase (
Table 3).
The secondary yard paving costs were calculated using the 20 cm concrete pavement and 15 cm crushed stone base costs used for the ramps (
Table 2). Pavers were not included in secondary yard costs. For the portion of the secondary yard dedicated to repairs and maintenance, the cost of the maintenance building was calculated using the cost of a concrete block warehouse. The overflow area of the secondary yard dedicated to empty containers, container repair, and freight handling used the same square meter costs for warehouses and concrete paving. The cost of a one story office building with exterior insulation and finish systems on metal studs was used to calculate the cost of office space (
Table 4) [
43].
We consolidated the costs of the primary and secondary yards into a single average square meter cost for reconstructing all yard infrastructure at GenPort (
Table 5).
Table 5 shows the range of expected land use mixes for a typical port. The most expensive percentage mix of uses and the least expensive mix of uses are presented by using an upper bound (UYC), representing the most expensive mix of uses, and a lower bound yard cost (LYC), representing the least expensive mix of uses (Equations (A5) and (A6)). The most expensive mix of uses maximizes the area devoted to facilities (15% of the total yard area) and to repairs and maintenance (20% of the total yard area). The least expensive mix of uses maximizes the unpaved areas (20% of the total yard area) (
Table 5).
Finally, the GenPort adaptation cost estimate assumed that there was sufficient geotechnical stability of the existing port site to accommodate the required additional fill. In some locations, the addition of fill may overload the waterside containment significantly, increasing construction costs. The additional cost required to upgrade waterside containment structures in such cases was not included in the cost estimate. The geotechnical assessment cost (GC) assumes deep boring tests within 50 m of the berth and shallow boring tests in the areas of the port over 50 m from the berth. Geotechnical assessment costs were calculated using the total weighted average cost per square meter of port area (
Table 6).
2.3. Apron and Other Costs Not Included
The GenPort retrofit design assumes that the waterfront portion of the apron remains at the pre-retrofit existing elevation without alteration. This allows for ship accessibility, as significantly raising the apron height over the existing sea level could impede the loading and unloading of cargo. In addition to reducing construction costs, maintaining the existing apron and berth elevation would prevent difficulties in loading and unloading cargo. Ramps allow vehicles access to the apron from the elevated portions of the port in order to transport containers from sea level up to the new raised laydown area [
44]. However, some cranes, utilities and other waterfront port infrastructure would not be protected by this design and would still be subjected to increased threat of flooding due to storm surge. In practical application, the apron area would be elevated incrementally to keep in step with SLR.
Other costs were considered, but ultimately not included in the cost calculations due to their high level of variability between different locations and uses. For example, in some ports, years of port activities may have left traces of fuels and other hazardous materials that would have to be remediated. Likewise, environmental permitting, changes to utilities (e.g., electrical cabling, frames for reefers, lighting posts, and drainage facilities), and the cost of demolition and rubble removal were not included in the estimation.
2.4. Calculation of Port Area for All US Ports
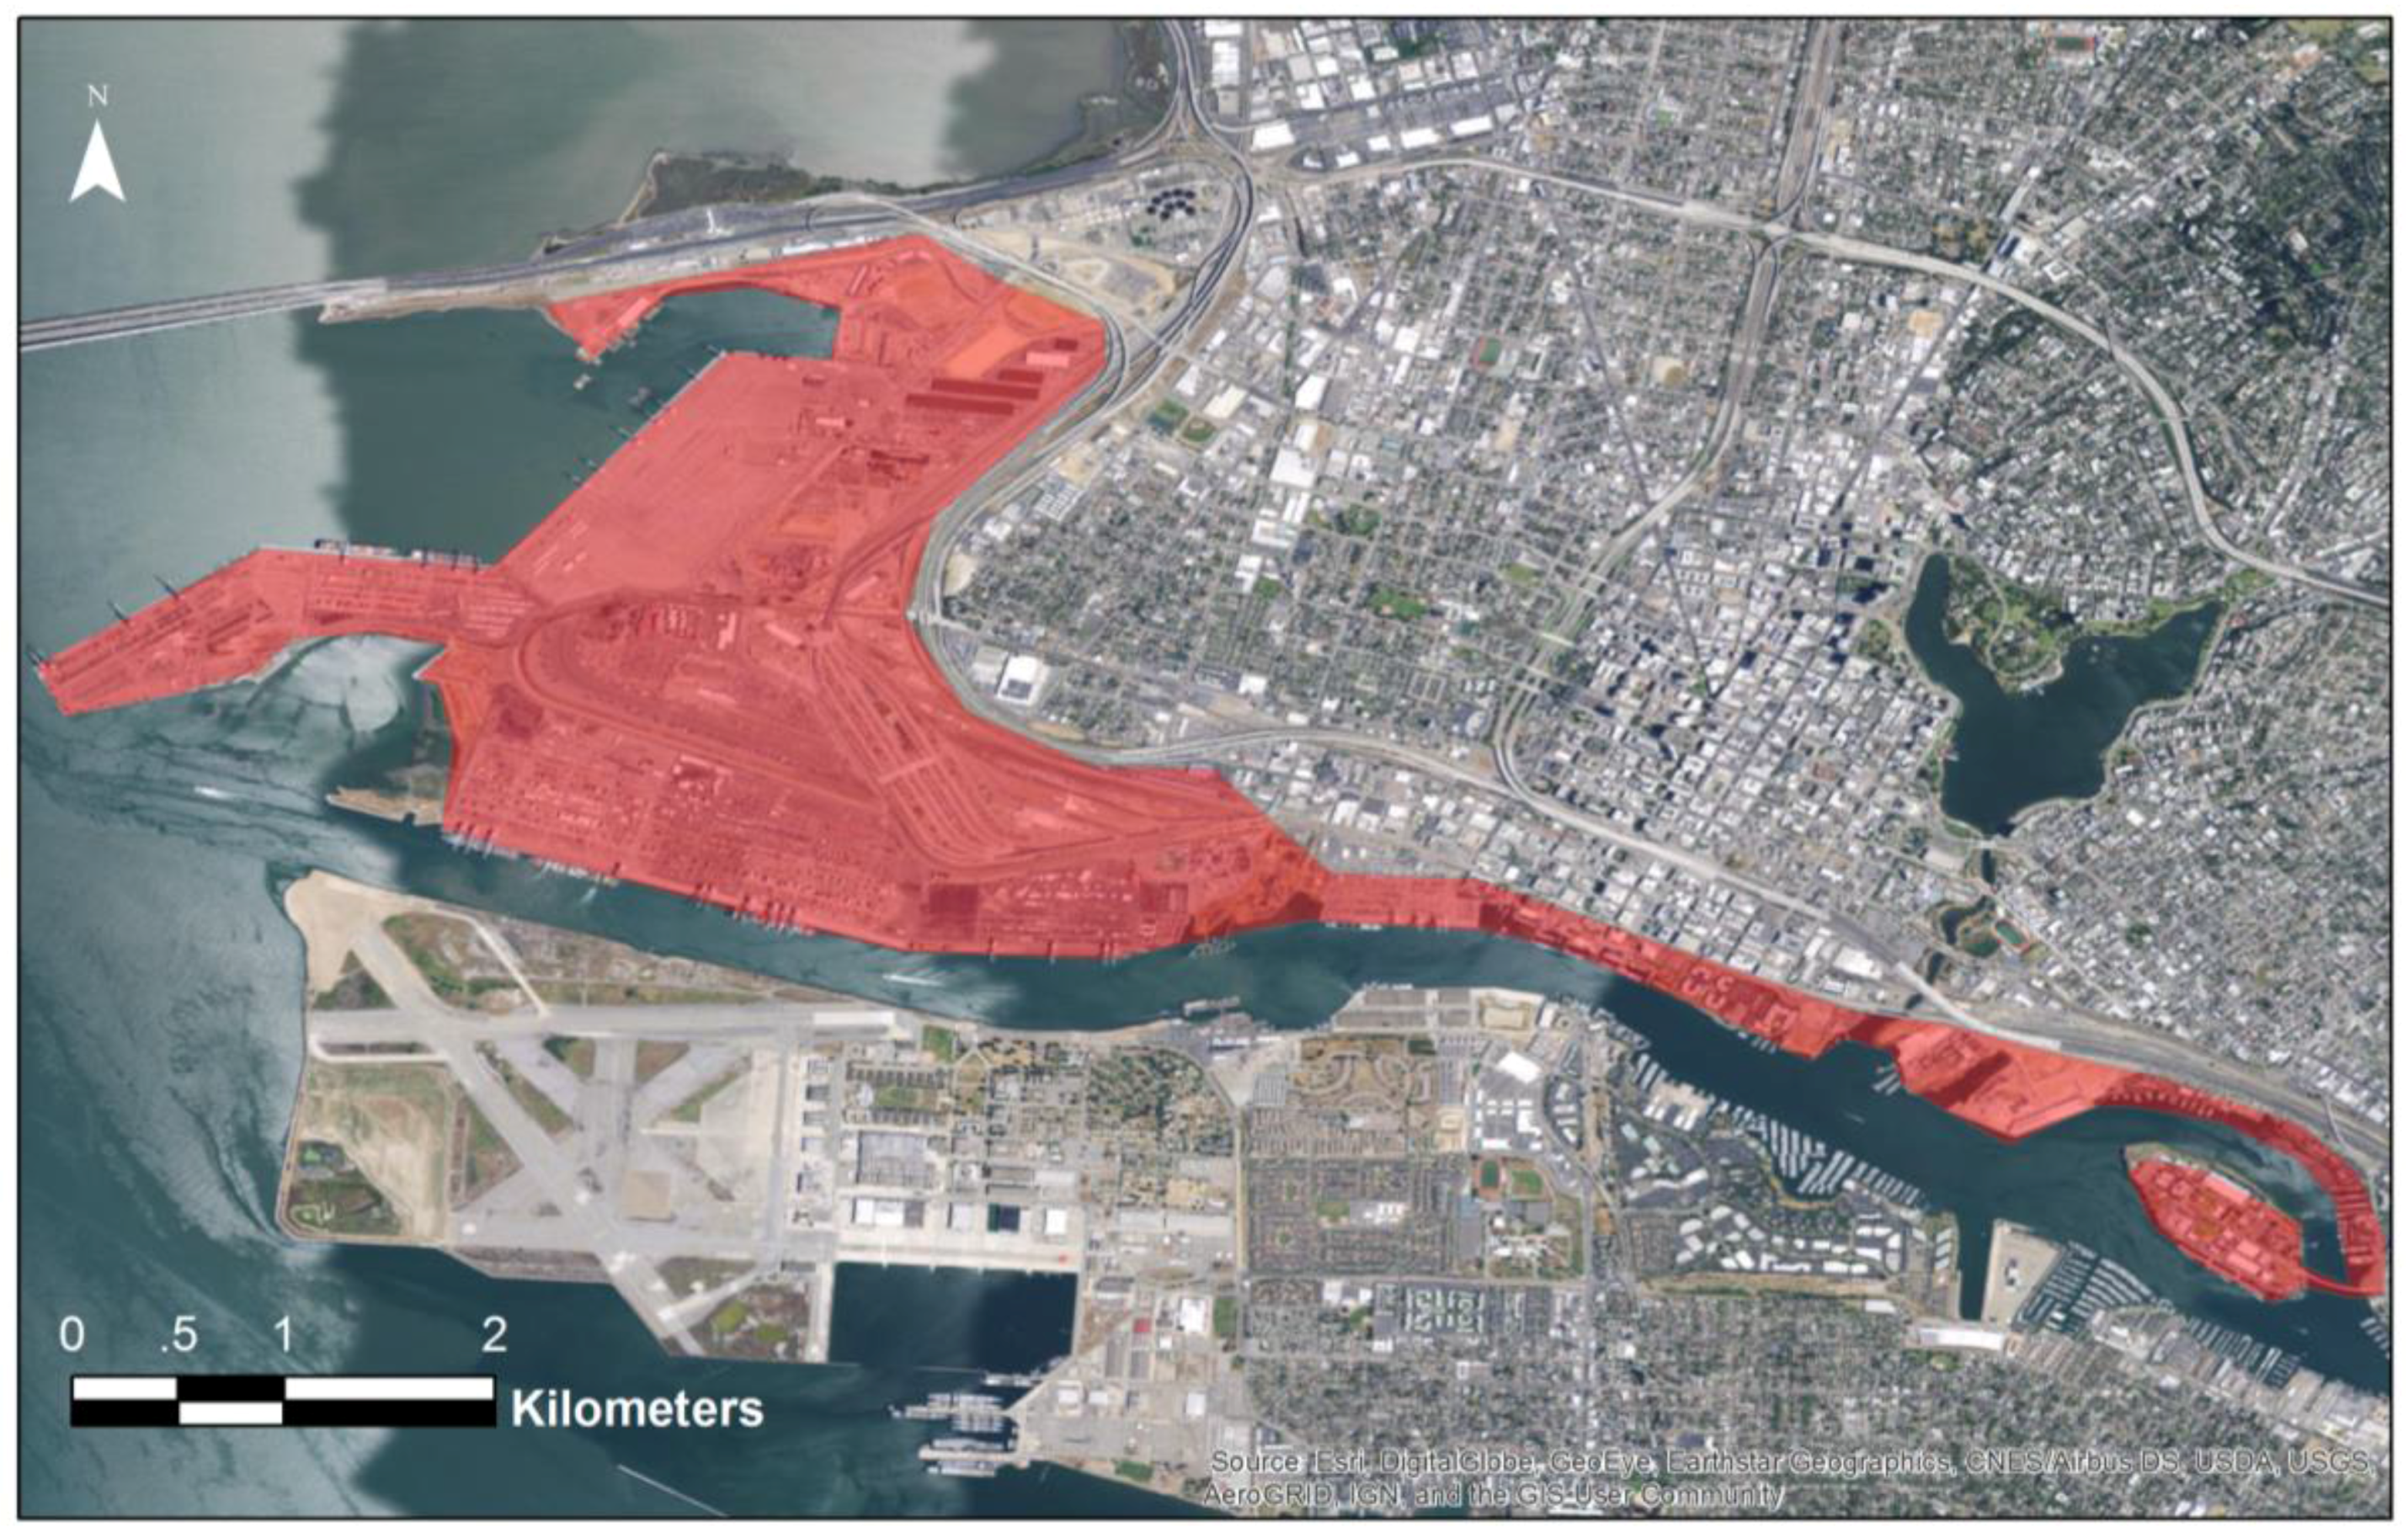
To generate an aggregate estimate for the cost and materials to retrofit US ports using the GenPort design, we manually calculated the port land area values for the 100 major US East Coast, Gulf Coast, West Coast, Hawaiian and Alaskan coastal ports (see
Appendix B). Using satellite imagery available through Google Earth, we traced a polygon around the infrastructure at each port that was clearly associated with port activity, including yard storage areas and associated structures. We included all United States coastal commercial ports that handle freight [
8], excluding marinas, fishing harbors, or other surrounding infrastructure that are not apparently tied directly to port activities. The polygon overlays are exemplified below for Oakland, CA, where area recorded as “coastal port infrastructure” in red was used in the aggregate calculation estimates (
Figure 4). Although not all port areas captured through this process are container operations, the GenPort model is used in this exercise as a proxy for a variety of port operations. The summary of the ports and the total square kilometers of port infrastructure used in this study are presented in
Table 7; see further details in
Appendix B.
4. Discussion
As noted by Nicholls et al. [
9] and others, few assessments of regional port adaptation to climate change have been conducted, largely due to a lack of comprehensive physical data. The use of the GenPort model simplified the estimation process to allow for consideration of regional or national scale costs and material requirements. The GenPort model estimated a cost of
$151 to
$206 million per square kilometer to elevate and reconstruct the 0.4 square kilometer (100 acre) GenPort. This included procurement and placement of two meters of fill, geotechnical assessment, construction of the ramps and retaining walls, and reconstruction of the yard. The estimate also included a standard engineering and administration multiplication factor of 1.18. The use of GenPort enables the creation of an aggregate estimate for the costs and the quantity of fill necessary for this type of design that can be extrapolated to develop an estimate for ports on a regional or national scale, based on current land area occupied by the sample of ports. This pilot study found that elevating and retrofitting 100 major US ports to accommodate a two-meter sea level rise using the GenPort design would result in a total cost of between
$57 and
$78 billion (US). The GenPort model simplifies data requirements for elevation and reconstruction for port operation; actual port elevation and retrofit would involve additional costs, including but not limited to permits and environmental remediation assessments. This cost estimate could be refined in a number of ways, including the development of a variety of GenPort type port designs for large modern ports, bulk and liquid bulk terminals, and general cargo terminals, each of which would have unique requirements for retrofit. This could be accomplished by introducing additional infrastructure and land use types, such as tank farms or rail facilities, to the total yard cost calculations. Further, elevating a port is a large-scale project; environmental impacts are compounded by the immediate proximity of sensitive aquatic habitats for many ports. Environmental permitting and remediation would likely contribute significantly to the final price tag.
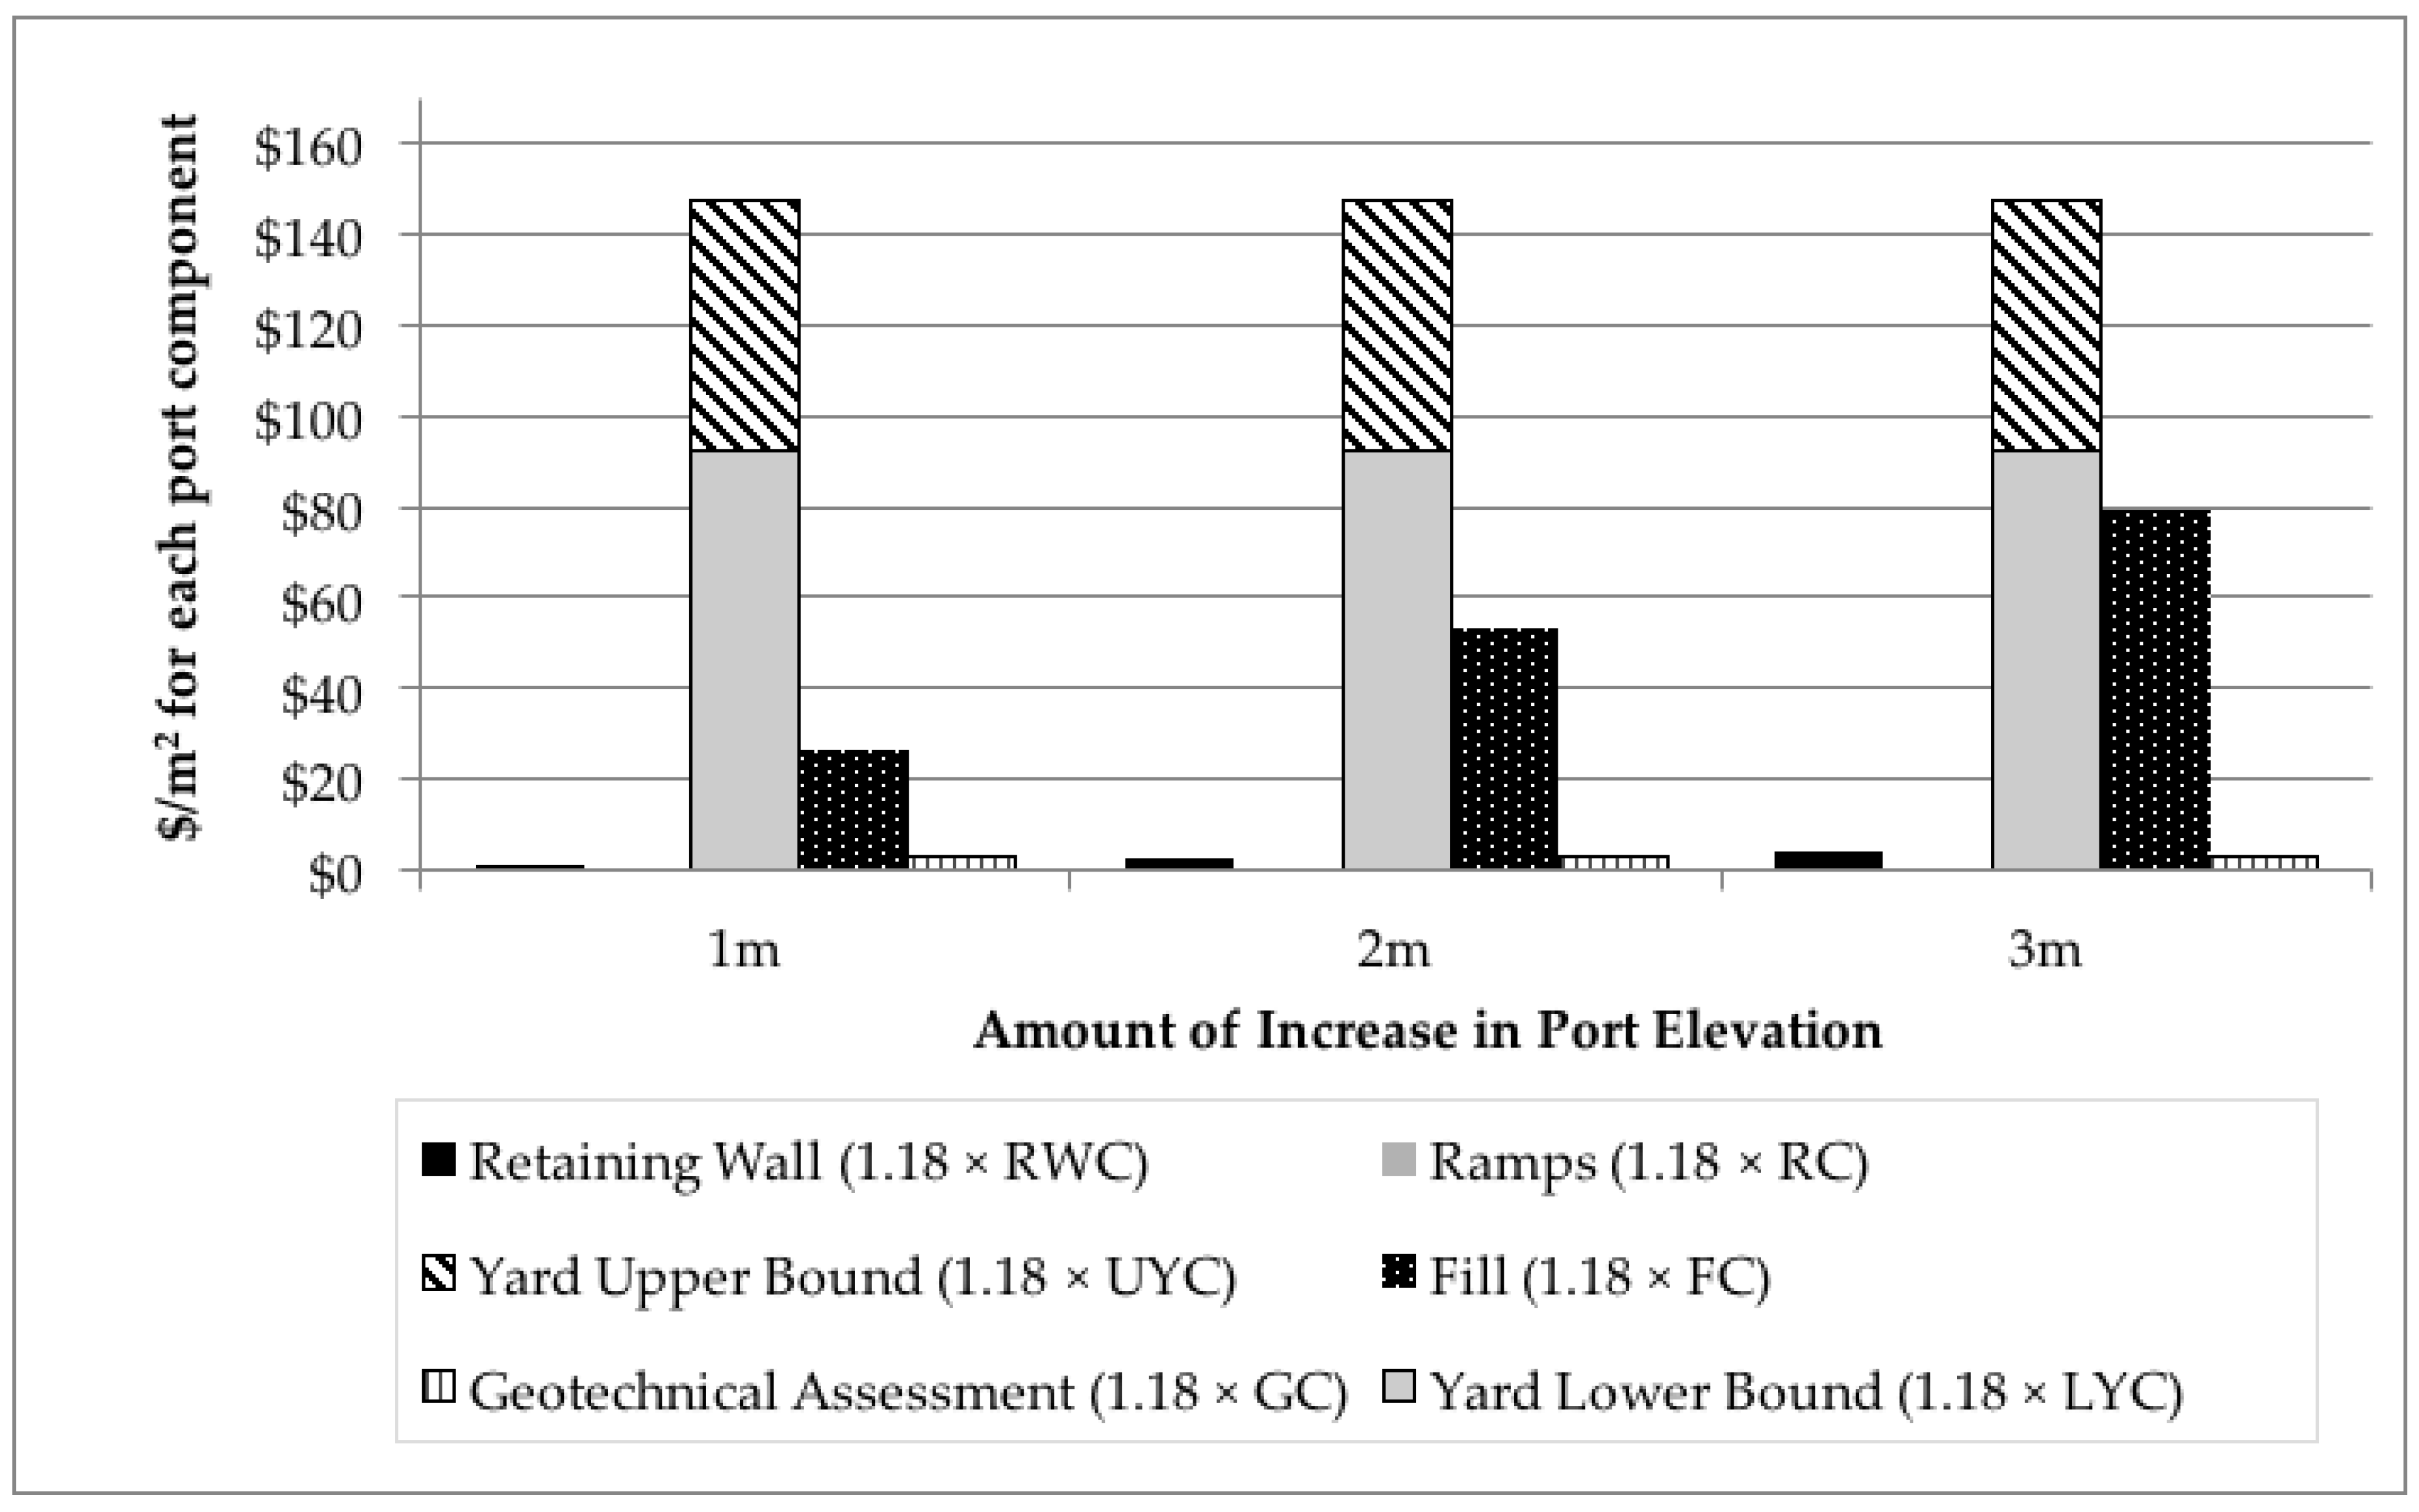
In another analysis of the cost of elevating port ground levels, Nicholls et al. [
9] compensated for a lack of port area data by applying a traffic-to area conversion. In their analysis, they used a cost of
$15 million per square kilometer to raise ground elevation by one meter based on a 1990 IPCC report, which equates to
$26 million (US) in 2012 when adjusted for inflation. This value, “based on Dutch procedures including design, execution, taxes, levies and fees and the assumption that the operation would take place as one event” [
9,
28], excluded the cost of adapting buildings and infrastructure. Comparatively, our calculations estimate
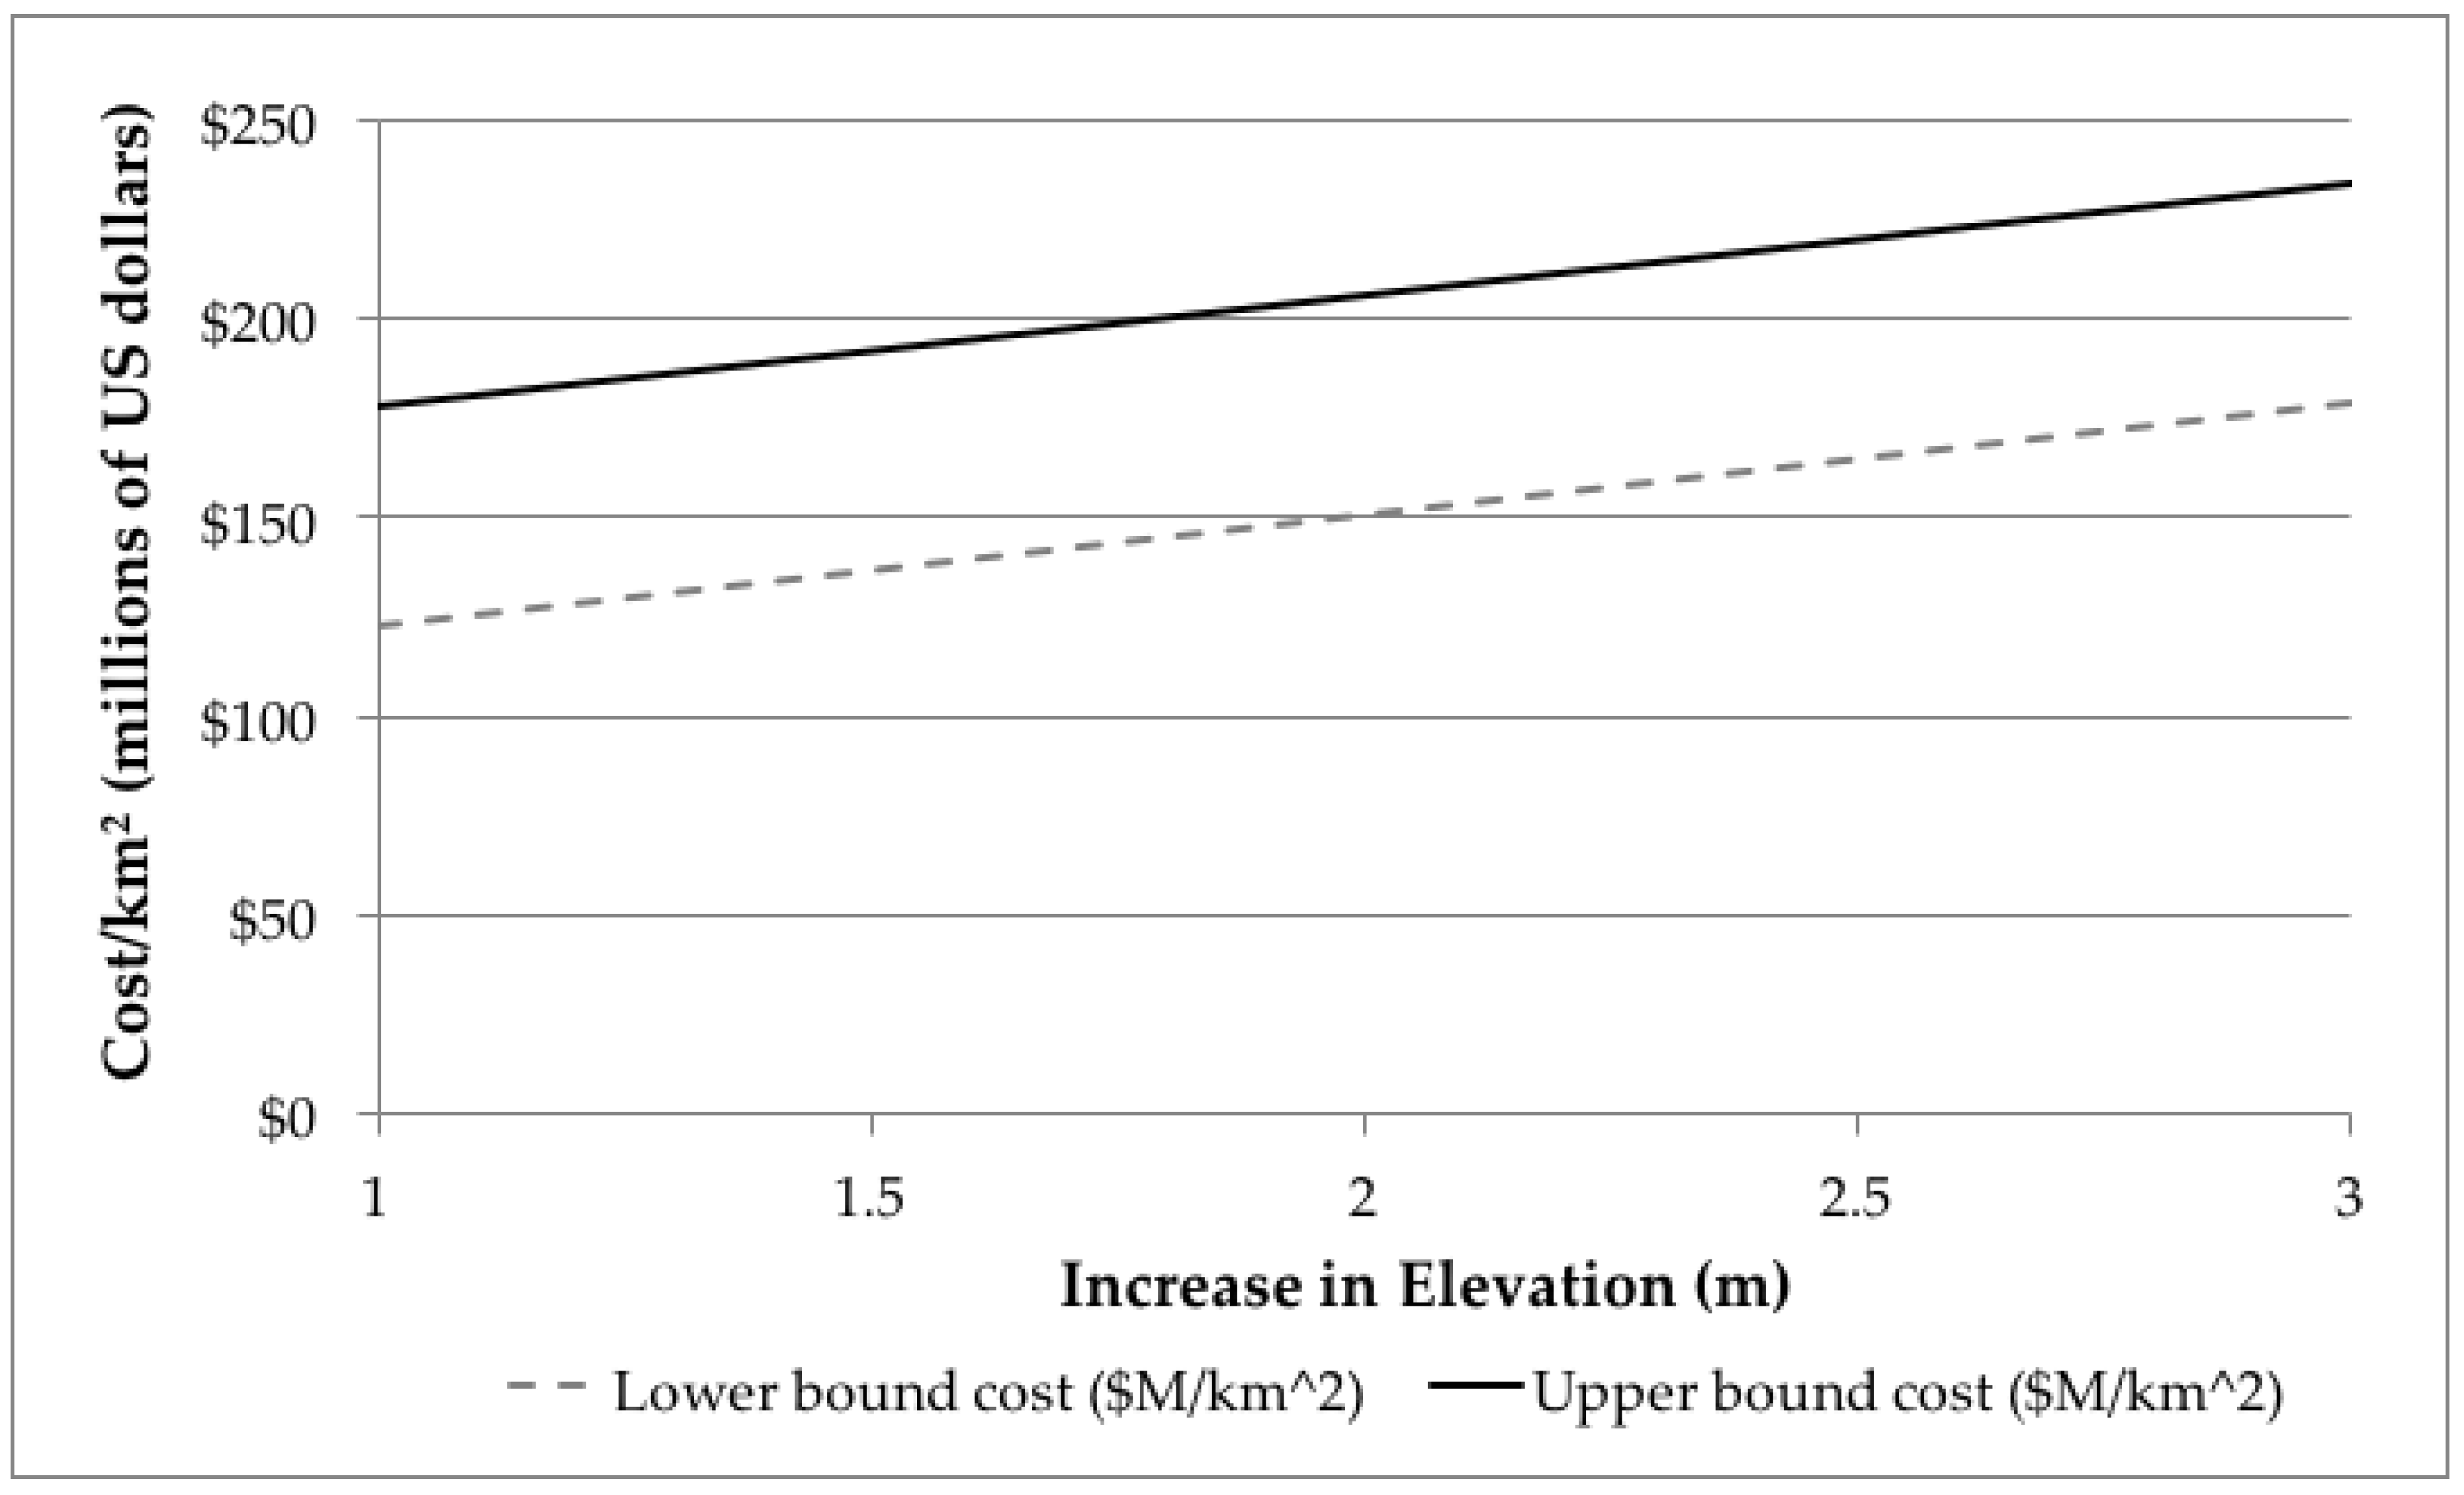
$31 million per square kilometer to raise a port one meter (including geotechnical assessment and retaining wall) and an additional
$92 to
$148 million per square kilometer to reconstruct the yard infrastructure (see
Table 9 and
Figure 6). Our estimate also aligns with the budget developed for an actual elevation project in Gulfport (MS) for which the Mississippi State Port Authority at Gulfport proposed a 4.6 m increase in the elevation of its western pier [
45]. While the scope of that project was ultimately reduced and the elevation component eventually eliminated [
40], the port initially budgeted approximately
$250 million per square kilometer to raise the terminal by 4.6 m [
44]. Our model predicts a
$225 to
$280 million per square kilometer cost for the same elevation increase.
Port elevation represents one of a number of preventative measures that can be taken against the damages associated with climate change, along with construction of seawalls, hardening of structures, or the relocation of the port, though this last option is unlikely to be the most economical adaptation strategy as it requires the acquisition of a large area of land and the restructuring of the surrounding transportation network. Any design to retrofit will also require compromise. GenPort’s ramps, for example, would slow operations both on the apron and between the apron and the elevated container storage area. Individual ports would need to design a retrofit suited to their specific needs. Ports exposed to large storm surges may opt for dikes and sea walls, as opposed elevation of the port infrastructure. Such decisions will of course be made on a case-by-case basis. Many ports are likely to elevate their infrastructure more gradually as old structures need to be replaced. This will allow for a more incremental capital investment strategy that will only be increased to accommodate the marginal costs of filling to increase port elevation, as opposed to the full costs represented in this study. Though the cost to elevate ports would be immense, the cost of doing nothing to protect ports would very likely far exceed the investment in adaptation. Just one storm, Hurricane Katrina in 2005, caused
$100 million in damages to Mississippi’s port infrastructure [
46] and Hurricane Sandy resulted in between
$40 million and
$55 million of damage to the maritime assets of the Port Authority of New York and New Jersey [
47]. Due to the indirect and intangible costs associated with damaged infrastructure, the costs of doing nothing are thought to far exceed the costs of adaptation for coastal infrastructure [
27].
In addition to capital costs, obtaining the necessary fill material to raise infrastructure would likely be a limiting factor. This study shows that elevating these 100 US ports alone would require 704 million cubic meters of dredged fill, roughly 42 times more than the volume of material generated through new work dredging in the United States by the Army Corps of Engineers in 2012 and four times more than all material dredged my the Army Corps of Engineers in 2012, including maintenance and emergency dredging [
48].
Finally, we note that sea level rise does not (at this point) have a fixed end point and the rate of rise will likely only increase over time [
14,
49]. Thus, a single retrofit project to elevate infrastructure does not result in a final solution for sea level rise. Rather, it simply buys time and protects infrastructure for a time until sea levels rise enough to overcome once again. Depending on the rate of rise, a piece of infrastructure may need to be elevated numerous times (along with its surrounding network of road, rail, and utilities). This study did not consider options such as designing a project to accommodate multiple (incremental) elevations over time. However, such ideas could and should be considered.
Ports are only one of many types of coastal infrastructure at risk from SLR and storm surge. We focused on ports for this study, as ports are relatively self-contained and conducive to the use of a generic design. In addition to ports, sewage treatment plans, airports, roads, rail, power plants, and other uses will require protection or relocation. We propose that the methodology described herein could be adapted for other such uses in order to develop a better understanding of costs and materials required to protect such uses on a national, or even global, scale.
5. Conclusions
Few ports have begun to invest in adaptation measures in preparation for the levels of SLR expected by the end of the century [
50]. That said, according to American Association of Port Authorities, US ports currently anticipate spending
$2.1 billion on capital upgrades annually [
1]. Even if most this budget was put toward climate change adaptations, funding is likely to be insufficient to accommodate all US ports efforts to protect against major sea level rise. However, many ports will eventually require major modifications, such as new sea walls and storm gates or elevation, that require significant material and financial resources on a scale not seen in the past. Simultaneous implementation of large scale construction projects can increase resource demand. However, estimating such projected demand on a regional, national, or global scale remains a challenge.
Using the GenPort model to develop square meter equations for elevating and retrofitting a generic container port, we estimate a cost of $57 to 78 billion to elevate all major US seaports by two meters. Naturally, each port would need to determine the cost-effectiveness of raising infrastructure (once) to an anticipated final height against implementing two (or more) such capital improvement projects carried out incrementally as sea level rise. We suggest that using a generic design model, such as GenPort, as an estimation tool can help inform the emerging dialogue about climate adaptation and building coastal resilience. Most designs are generated on a site-specific basis and would not be appropriate to base estimates of demand at a national scale. Decision makers must consider this increase in demand as they weigh the costs and benefits of various adaptation strategies. In order to understand the impact that such projects will have on a national scale, new methods must be developed to estimate the potential aggregate demand as many projects move from concept to design and build. This research suggests the use of a generic port model to aid in the development of such estimates for one particular climate adaptation strategy: elevation of port facilities. Ports represent as little as 5% of coastal land uses that would compete globally for construction resources under this climate scenario. We note that climate change will generate new demands for many resources on both the national and global scales. Our estimation method represents a novel approach to help understand this new level of demand that will be driven by implementation of many preferred adaptation strategies.


