SISI: A New Device for In Situ Incubations at the Ocean Surface


Abstract
:1. Introduction
2. Materials and Methods
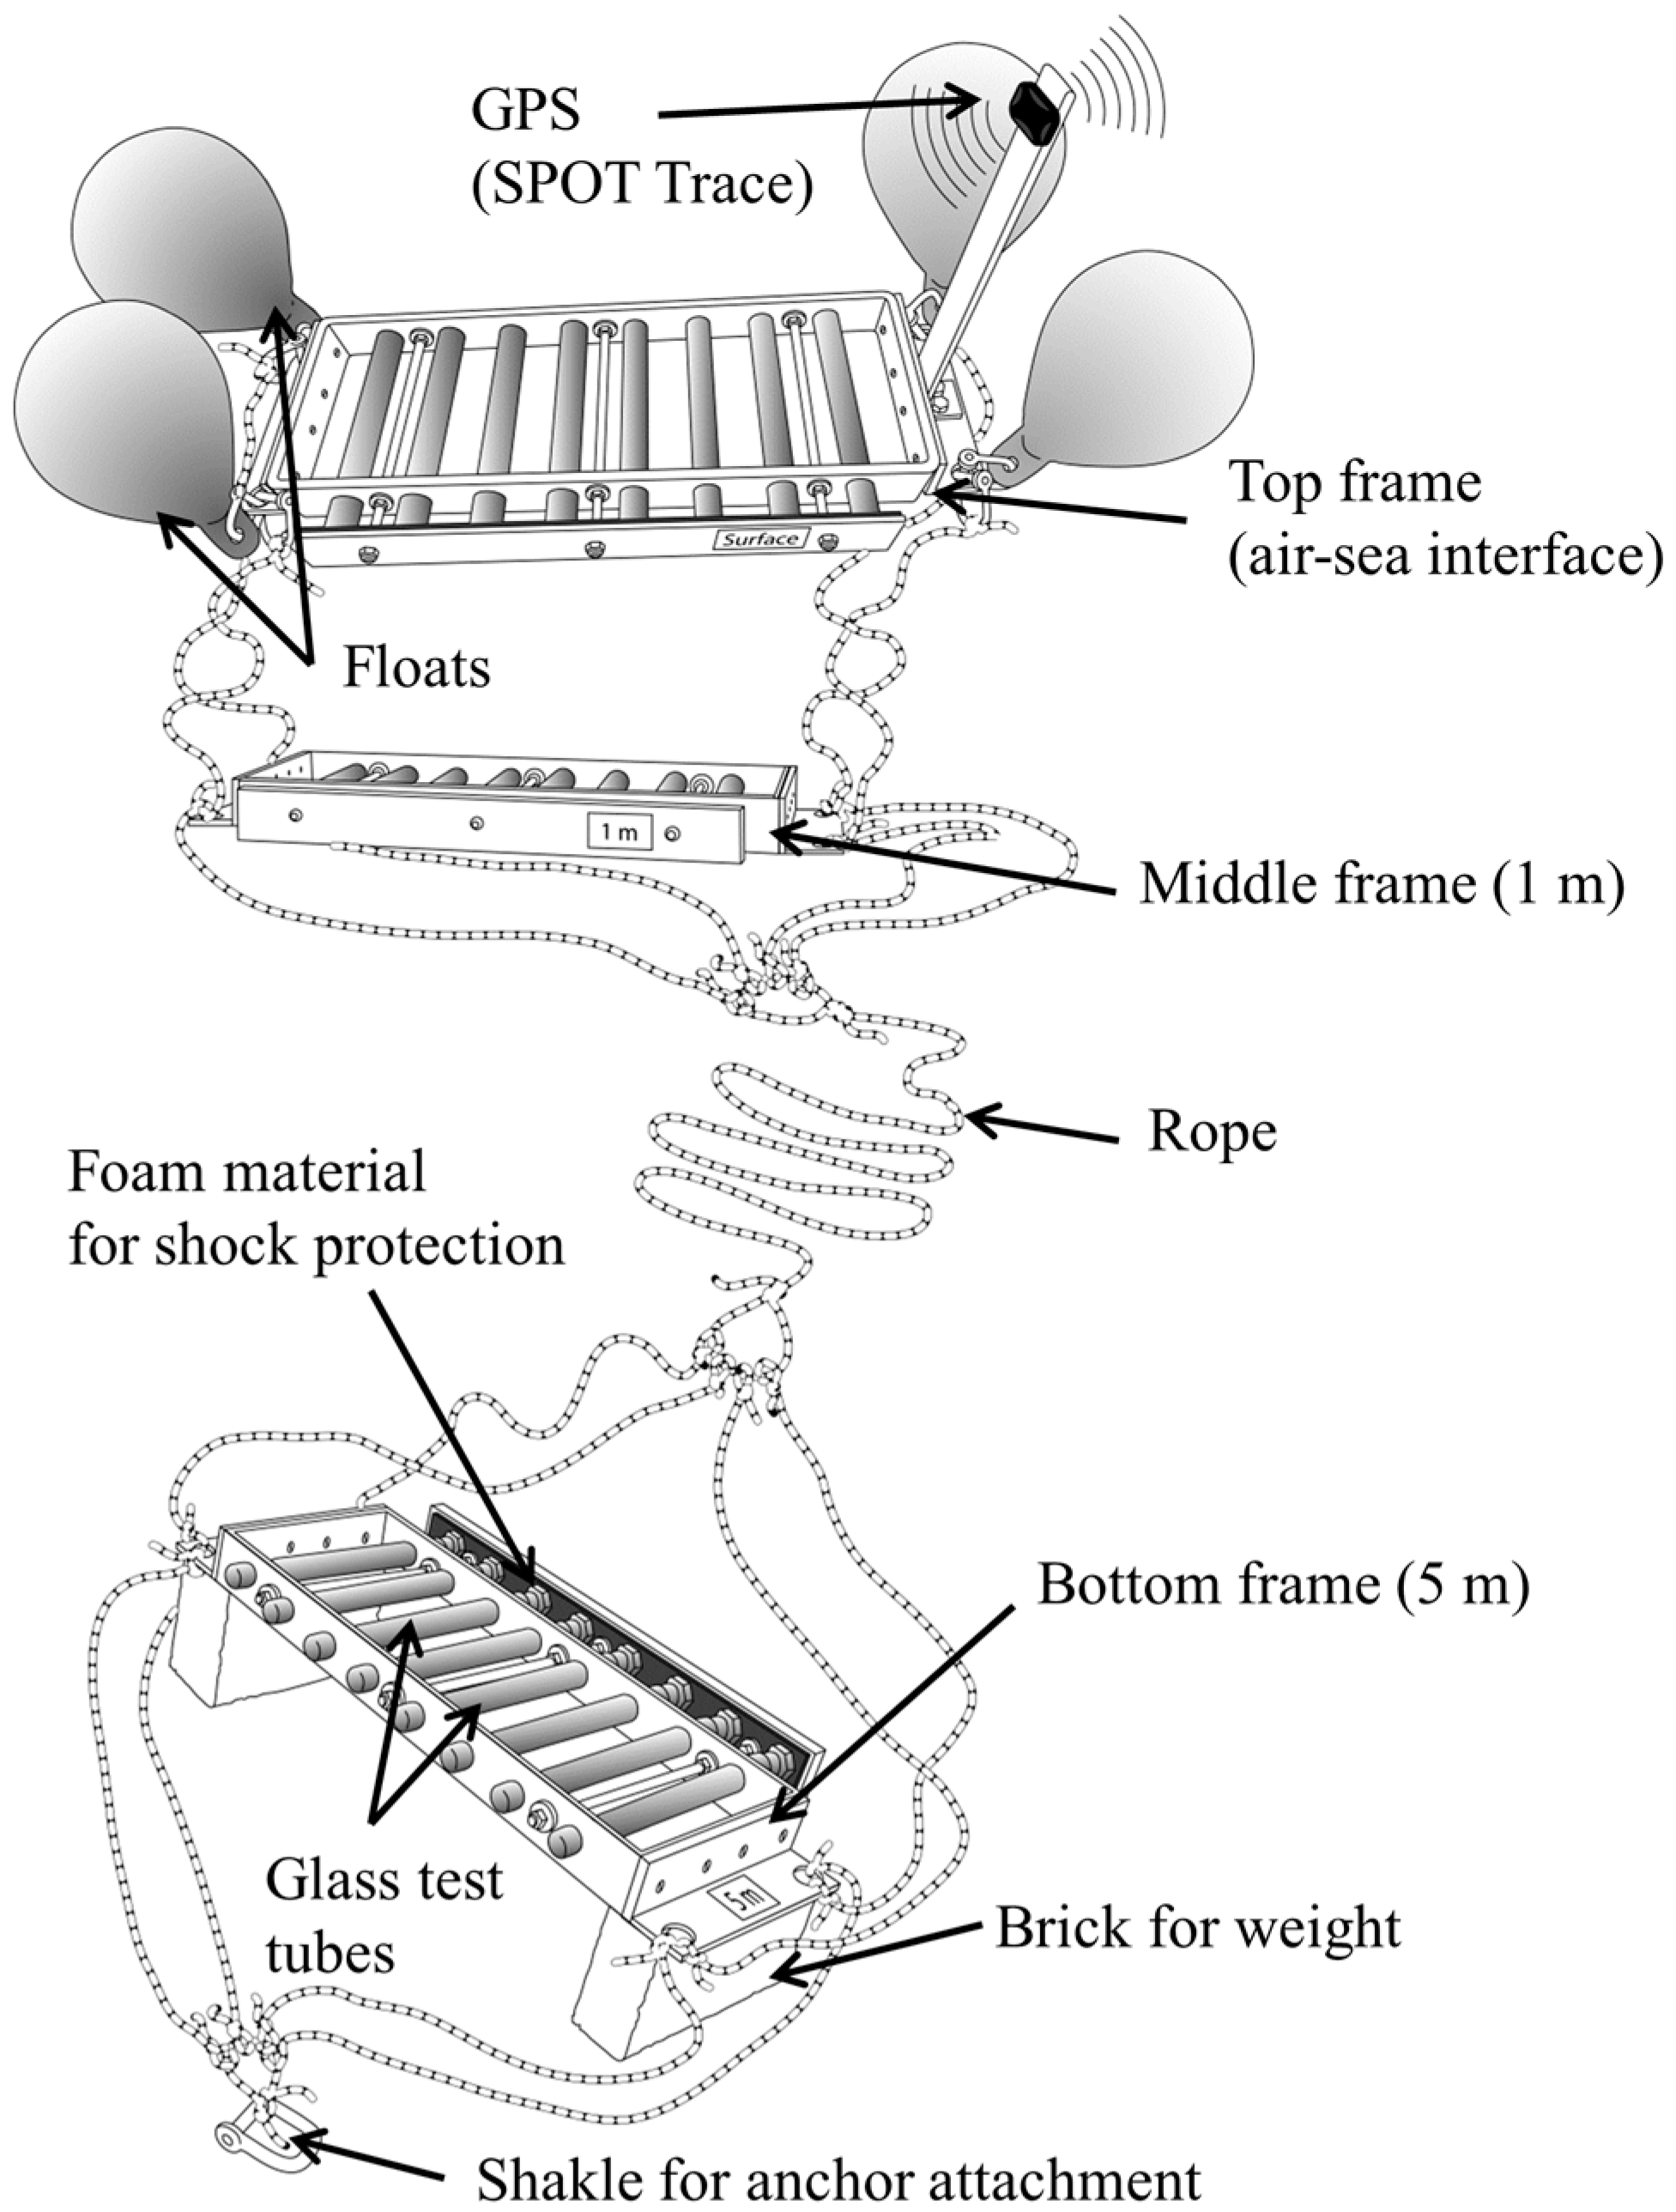
2.1. Description of the Research Tool
2.2. SISI Deployment and Sample Collection
2.3. Oxygen Measurements
2.4. Statistical Analysis
3. Results and Discussion
- (1)
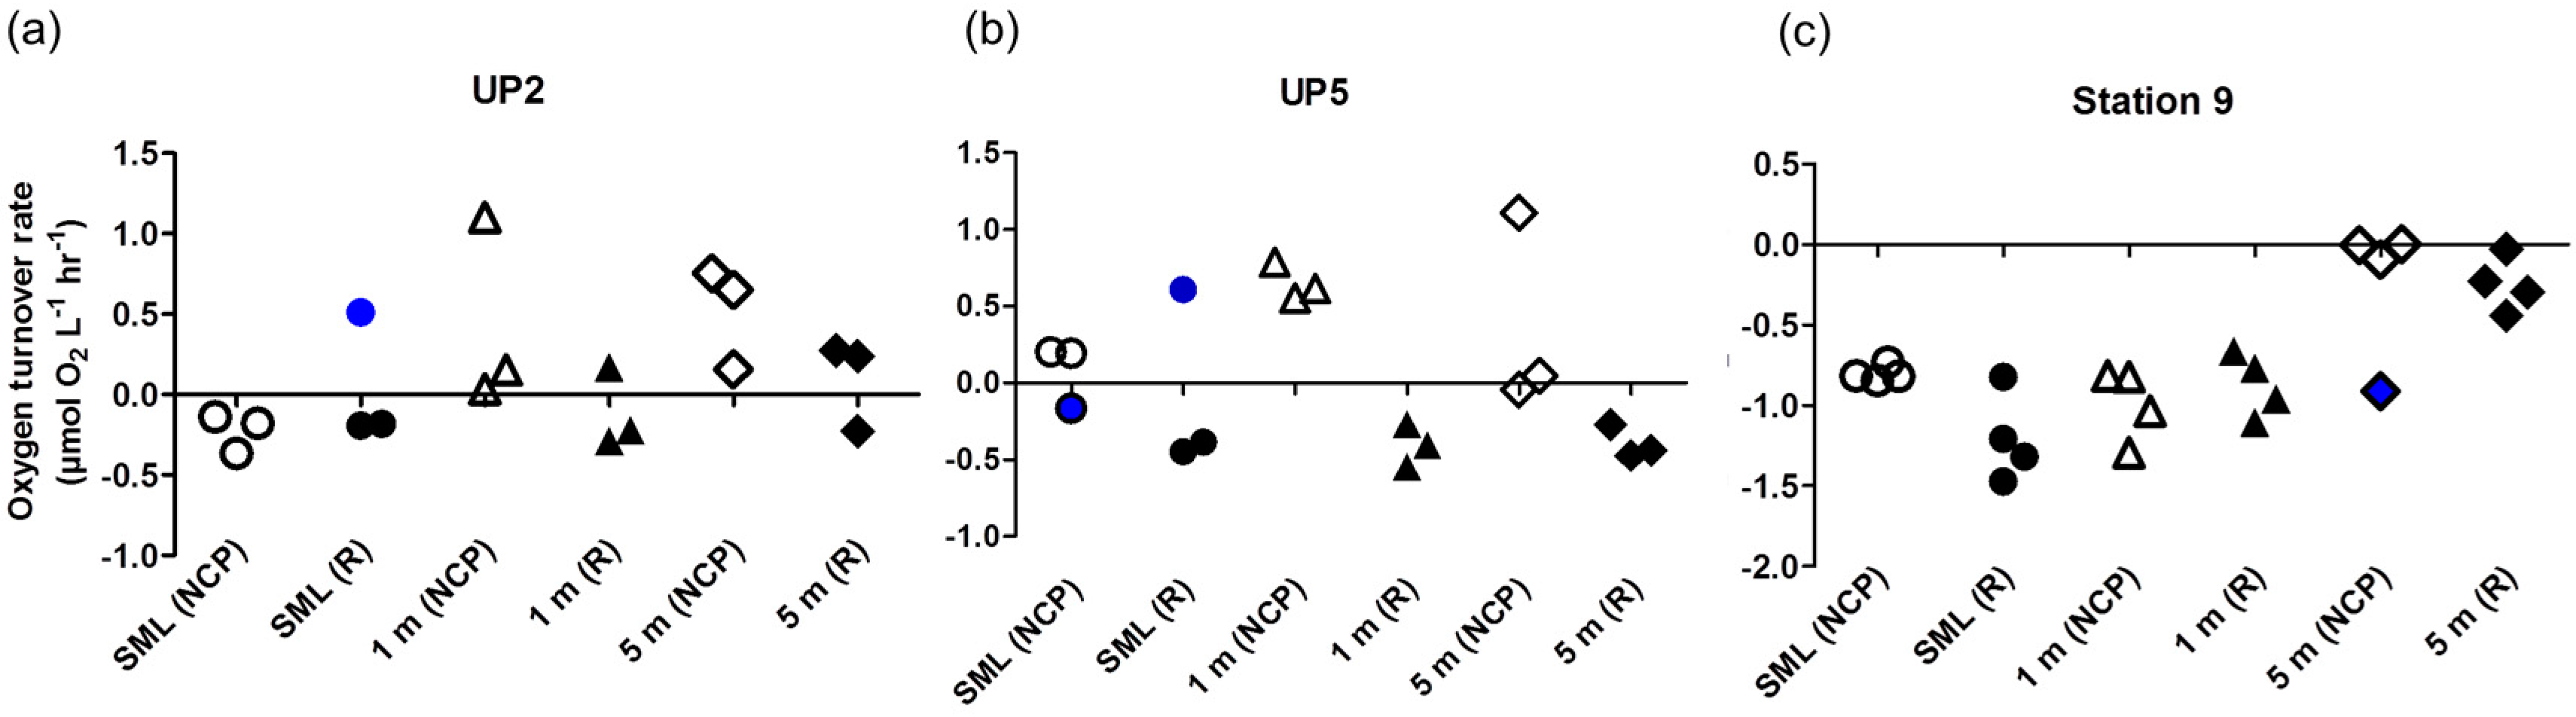
- It leads to reasonable results on O2 turnover rates of plankton communities as reported here.
- (2)
- It allows for in situ bottle incubations close to the SML and in near-surface layers.
- (3)
- Incubation periods up to several days are possible.
- (4)
- The SISI is applicable under typical oceanic conditions (tested and recommended for sea states up to 5 bft), and under these conditions shallow submersion of the upper frame (approximately 5 cm; see Supplement Video S1: Deployment and operation of the SISI) ensures incubation under surface radiation.
- (5)
- It is inexpensive with material costs of approximately $950 USD, which includes 33 test tubes.
- (6)
- It allows applications without environmental impacts.
- (7)
- It can be deployed by being anchored in shallow water, or GPS-tracked in the open ocean, allowing for other operations on the R/V.
Future Research Directions
Supplementary Materials
Acknowledgments
Author Contributions
Conflicts of Interest
References
- Wurl, O.; Ekau, W.; Landing, W.M.; Zappa, C.J. Sea surface microlayer in a changing ocean—A perspective. Elem. Sci. Anth. 2017, 5. [Google Scholar] [CrossRef]
- Engel, A.; Bange, H.W.; Cunliffe, M.; Burrows, S.M.; Friedrichs, G.; Galgani, L.; Herrmann, H.; Hertkorn, N.; Johnson, M.; Liss, P.S.; et al. The ocean’s vital skin: Toward an integrated understanding of the sea surface microlayer. Front. Mar. Sci. 2017, 4. [Google Scholar] [CrossRef]
- Cunliffe, M.; Engel, A.; Frka, S.; Gašparović, B.; Guitart, C.; Murrell, J.C.; Salter, M.; Stolle, C.; Upstill-Goddard, R.; Wurl, O. Sea surface microlayers: A unified physicochemical and biological perspective of the air–ocean interface. Progr. Oceanogr. 2013, 109, 104–116. [Google Scholar] [CrossRef]
- Frew, N. The role of organic films in air-sea gas exchange. In The Sea Surface and Global Change; Liss, P.S., Duce, R.A., Eds.; Cambridge Univ. Press: New York, NY, USA, 1997; pp. 121–171. [Google Scholar]
- Wurl, O.; Miller, L.; Ruttgers, R.; Vagle, S. The distribution and fate of surface-active substances in the sea-surface microlayer and water column. Mar. Chem. 2009, 115, 1–9. [Google Scholar] [CrossRef]
- Wurl, O.; Stolle, C.; Van Thuoc, C.; Thu, P.T.; Mari, X. Biofilm-like properties of the sea surface and predicted effects on air–sea CO2 exchange. Progr. Oceanogr. 2016, 144, 15–24. [Google Scholar] [CrossRef]
- Agogué, H.; Joux, F.; Obernosterer, I.; Lebaron, P. Resistance of marine bacterioneuston to solar radiation. Appl. Environ. Microbiol. 2005, 71, 5282–5289. [Google Scholar] [CrossRef] [PubMed]
- Santos, A.L.; Baptista, I.; Lopes, S.; Henriques, I.; Gomes, N.C.; Almeida, A.; Correia, A.; Cunha, A. The UV responses of bacterioneuston and bacterioplankton isolates depend on the physiological condition and involve a metabolic shift. FEMS Microbiol. Ecol. 2012, 80, 646–658. [Google Scholar] [CrossRef] [PubMed]
- Carlucci, A.; Craven, D.; Henrichs, S. Surface-film microheterotrophs: Amino acid metabolism and solar radiation effects on their activities. Mar. Biol. 1985, 85, 13–22. [Google Scholar] [CrossRef]
- Rahlff, J.; Stolle, C.; Giebel, H.A.; Brinkhoff, T.; Ribas-Ribas, M.; Hodapp, D.; Wurl, O. High wind speeds prevent formation of a distinct bacterioneuston community in the sea-surface microlayer. FEMS Microbiol. Ecol. 2017, 93. [Google Scholar] [CrossRef] [PubMed]
- Stolle, C.; Labrenz, M.; Meeske, C.; Jürgens, K. Bacterioneuston community structure in the southern Baltic Sea and its dependence on meteorological conditions. Appl. Environ. Microbiol. 2011, 77, 3726–3733. [Google Scholar] [CrossRef] [PubMed]
- Wurl, O.; Obbard, J.P. A review of pollutants in the sea-surface microlayer (SML): A unique habitat for marine organisms. Mar. Pollut. Bull. 2004, 48, 1016–1030. [Google Scholar] [CrossRef] [PubMed]
- Cunliffe, M.; Murrell, J.C. Eukarya 18S rRNA gene diversity in the sea surface microlayer: Implications for the structure of the neustonic microbial loop. ISME J. 2010, 4, 455–458. [Google Scholar] [CrossRef] [PubMed]
- Franklin, M.P.; McDonald, I.R.; Bourne, D.G.; Owens, N.J.P.; Upstill-Goddard, R.C.; Murrell, J.C. Bacterial diversity in the bacterioneuston (sea surface microlayer): The bacterioneuston through the looking glass. Environ. Microbiol. 2005, 7, 723–736. [Google Scholar] [CrossRef] [PubMed]
- Hardy, J.T. The sea-surface microlayer: Biology, chemistry and anthropogenic enrichment. Progr. Oceanogr. 1982, 11, 307–328. [Google Scholar] [CrossRef]
- Obernosterer, I.; Catala, P.; Reinthaler, T.; Herndl, G.J.; Lebaron, P. Enhanced heterotrophic activity in the surface microlayer of the Mediterranean Sea. Aquat. Microb. Ecol. 2005, 39, 293–302. [Google Scholar] [CrossRef]
- Reinthaler, T.; Sintes, E.; Herndl, G.J. Dissolved organic matter and bacterial production and respiration in the sea-surface microlayer of the open Atlantic and the western Mediterranean Sea. Limnol. Oceanogr. 2008, 53, 122–136. [Google Scholar] [CrossRef]
- Robinson, C.; Williams, P.L.B. Respiration and its measurement in surface marine waters. Respir. Aquat. Ecosyst. 2005, 147–180. [Google Scholar] [CrossRef]
- Sampou, P.; Kemp, W.M. Factors regulating plankton community respiration in Chesapeake Bay. Mar. Ecol. Prog. Ser. 1994, 110, 249–258. [Google Scholar] [CrossRef]
- Marra, J. Approaches to the measurement of plankton production. In Phytoplankton Productivity: Carbon Assimilation in Marine and Freshwater Ecosystems; Williams, P.J.L.B., Thomas, D.N., Reynolds, C.S., Eds.; Chapter 4; Blackwell Science Ltd.: Oxford, UK, 2002; pp. 78–108. [Google Scholar]
- Biddanda, B.; Opsahl, S.; Benner, R. Plankton respiration and carbon flux through bacterioplankton on the Louisiana shelf. Limnol. Oceanogr. 1994, 39, 1259–1275. [Google Scholar] [CrossRef]
- Williams, P.M.; Carlucci, A.F.; Henrichs, S.; Van Vleet, E.S.; Horrigan, S.G.; Reid, F.M.H.; Robertson, K.J. Chemical and microbiological studies of sea-surface films in the Southern Gulf of California and off the West Coast of Baja California. Mar. Chem. 1986, 19, 17–98. [Google Scholar] [CrossRef]
- Sherr, B.F.; Sherr, E.B. Community respiration/production and bacterial activity in the upper water column of the central Arctic Ocean. Deep Sea Res. I 2003, 50, 529–542. [Google Scholar] [CrossRef]
- Ignatiades, L. Photosynthetic capacity at the surface microlayer during the mixing period. J. Plankton Res. 1990, 12, 851–860. [Google Scholar] [CrossRef]
- Frew, N.M.; Goldman, J.C.; Dennett, M.R.; Johnson, A.S. Impact of phytoplankton-generated surfactants on air-sea gas exchange. J. Geophys. Res. Oceans 1990, 95, 3337–3352. [Google Scholar] [CrossRef]
- Conrad, R.; Seiler, W. Influence of the surface microlayer on the flux of nonconservative trace gases (CO, H2, CH4, N2O) across the ocean-atmosphere interface. J. Atmos. Chem. 1988, 6, 83–94. [Google Scholar] [CrossRef]
- Upstill-Goddard, R.C.; Frost, T.; Henry, G.R.; Franklin, M.; Murrell, J.C.; Owens, N.J.P. Bacterioneuston control of air-water methane exchange determined with a laboratory gas exchange tank. Glob. Biogeochem. Cycles 2003, 17. [Google Scholar] [CrossRef]
- Fitzwater, S.E.; Knauer, G.A.; Martin, J.H. Metal contamination and its effect on primary production measurements. Limnol. Oceanogr. 1982, 27, 544–551. [Google Scholar] [CrossRef]
- Beer, T. Beaufort wind scale. Encycl. Nat. Hazards 2013, 42–45. [Google Scholar] [CrossRef]
- Schlitzer, R. Ocean Data View. Available online: http://odv.awi.de (accessed on 21 September 2017).
- Harvey, G.W.; Burzell, L.A. A simple microlayer method for small samples. Limnol. Oceanogr. 1972, 17, 156–157. [Google Scholar] [CrossRef]
- Carlson, D.J. A field-evaluation of plate and screen microlayer sampling techniques. Mar. Chem. 1982, 11, 189–208. [Google Scholar] [CrossRef]
- Grasshoff, K.; Kremling, K.; Ehrhardt, M. Methods of Seawater Analysis; John Wiley & Sons: Hoboken, NJ, USA, 2009. [Google Scholar]
- Garcia, H.E.; Gordon, L.I. Oxygen solubility in seawater-better fitting equations. Limnol. Oceanogr. 1992, 37, 1307–1312. [Google Scholar] [CrossRef]
- R Development Core Team. R: A Language and Environment for Statistical Computing; R Foundation for Statistical Computing: Vienna, Austria, 2015. [Google Scholar]
- Rahlff, J. Net community production and respiration of oxygen in the sea-surface microlayer, 1 m and 5 m depth during METEOR cruise M117, Baltic Sea and FALKOR cruise FK161010 Pacific Ocean. PANGAEA 2017. [Google Scholar] [CrossRef]
- Hardy, J.T. Phytoneuston ecology of a temperate marine lagoon. Limnol. Oceanogr. 1973, 18, 525–533. [Google Scholar] [CrossRef]
- Hardy, J.T.; Apts, C.W. The sea-surface microlayer-phytoneuston productivity and effects of atmospheric particulate matter. Mar. Biol. 1984, 82, 293–300. [Google Scholar] [CrossRef]
- Del Giorgio, P.A.; Duarte, C.M. Respiration in the open ocean. Nature 2002, 420, 379. [Google Scholar] [CrossRef] [PubMed]
- Pomeroy, L.R.; Sheldon, J.E.; Sheldon, W.M. Changes in bacterial numbers and leucine assimilation during estimations of microbial respiratory rates in seawater by the precision Winkler method. Appl. Environ. Microbiol. 1994, 60, 328–332. [Google Scholar] [PubMed]
- Lorenzen, C.J. Extinction of light in the ocean by phytoplankton. ICES J. Mar. Sci. 1972, 34, 262–267. [Google Scholar] [CrossRef]
- Famielec, S.; Malinowski, M.; Brzychczyk, B.; Salamon, J. Present used methods for measuring dissolved oxygen concentration at wastewater treatment plants. Infrastrukt. Ekol. Teren. Wiej. 2015, 431–440. [Google Scholar] [CrossRef]
- Carpenter, J.H. The accuracy of the Winkler method for dissolved oxygen analysis. Limnol. Oceanogr. 1965, 10, 135–140. [Google Scholar] [CrossRef]
- Markfort, C.D.; Hondzo, M. Dissolved oxygen measurements in aquatic environments: The effects of changing temperature and pressure on three sensor technologies. J. Environ. Qual. 2009, 38, 1766–1774. [Google Scholar] [CrossRef] [PubMed]
- Ziervogel, K.; D’Souza, N.; Sweet, J.; Yan, B.; Passow, U. Natural oil slicks fuel surface water microbial activities in the northern Gulf of Mexico. Front. Microbiol. 2014, 5, 188. [Google Scholar] [CrossRef] [PubMed]
- Daly, K.L.; Passow, U.; Chanton, J.; Hollande, D. Assessing the impacts of oil-associated marine snow formation and sedimentation during and after the Deepwater Horizon oil spill. Anthropocene 2016, 13, 18–33. [Google Scholar] [CrossRef]
- Song, Y.K.; Hong, S.H.; Jang, M.; Kang, J.H.; Kwon, O.Y.; Han, G.M.; Shim, W.J. Large accumulation of micro-sized synthetic polymer particles in the sea surface microlayer. Environ. Sci. Technol. 2014, 48, 9014–9021. [Google Scholar] [CrossRef] [PubMed]
- Oberbeckmann, S.; Löder, M.G.J.; Labrenz, M. Marine microplastic- associated biofilms—A review. Environ. Chem. 2015, 12, 551–562. [Google Scholar] [CrossRef]
- Sudhakar, M.; Doble, M.; Murthy, P.S.; Venkatesan, R. Marine microbe-mediated biodegradation of low- and high-density polyethylenes. Int. Biodeter. Biodegr. 2008, 61, 203–213. [Google Scholar] [CrossRef]
- Tranvik, L.J.; Olofsson, H.; Bertilsson, S. Photochemical Effects on Bacterial Degradation of Dissolved Organic Matter in Lake Water. In Microbial Systems: New Frontiers, Proceedings of the 8th International Symposium on Microbial Ecology, Halifax, NS, Canada, 9–14 August 1998; Bell, C., Brylinsky, M., Johnson-Green, P., Eds.; Atlantic Canada Society for Microbial Ecology: Halifax, NS, Canada, 1999; pp. 193–200. [Google Scholar]
- Wetzel, R.G.; Hatcher, P.G.; Bianchi, T.S. Natural photolysis by ultraviolet irradiance of recalcitrant dissolved organic matter to simple substrates for rapidbacterial metabolism. Limnol. Oceanogr. 1995, 40, 1369–1380. [Google Scholar] [CrossRef]
- Lee, E.; Noh, Y.; Hirose, N. A new method to produce sea surface temperature using satellite data assimilation into an atmosphere-ocean mixed layer coupled model. J. Atmos. Ocean. Tech. 2013, 30, 2926–2943. [Google Scholar] [CrossRef]
- Williamson, C.E.; Zepp, R.G.; Lucas, R.M.; Madronich, S.; Austin, A.T.; Ballare, C.L.; Norval, M.; Sulzberger, B.; Bais, A.F.; McKenzie, R.L.; et al. Solar ultraviolet radiation in a changing climate. Nat. Clim. Change 2014, 4, 434–441. [Google Scholar] [CrossRef]


| Location | Position (Decimal) | Date (UTC) Incubation Start | Station Name | Method of O2 Measurement | Incubation Period (h) | Mean Wind Speed (m s−1) | Mean Beaufort | Max. Wind Speed (m s−1) | Max. Beaufort | Station Feature | |
|---|---|---|---|---|---|---|---|---|---|---|---|
| Latitude (East) | Longitude (North) | ||||||||||
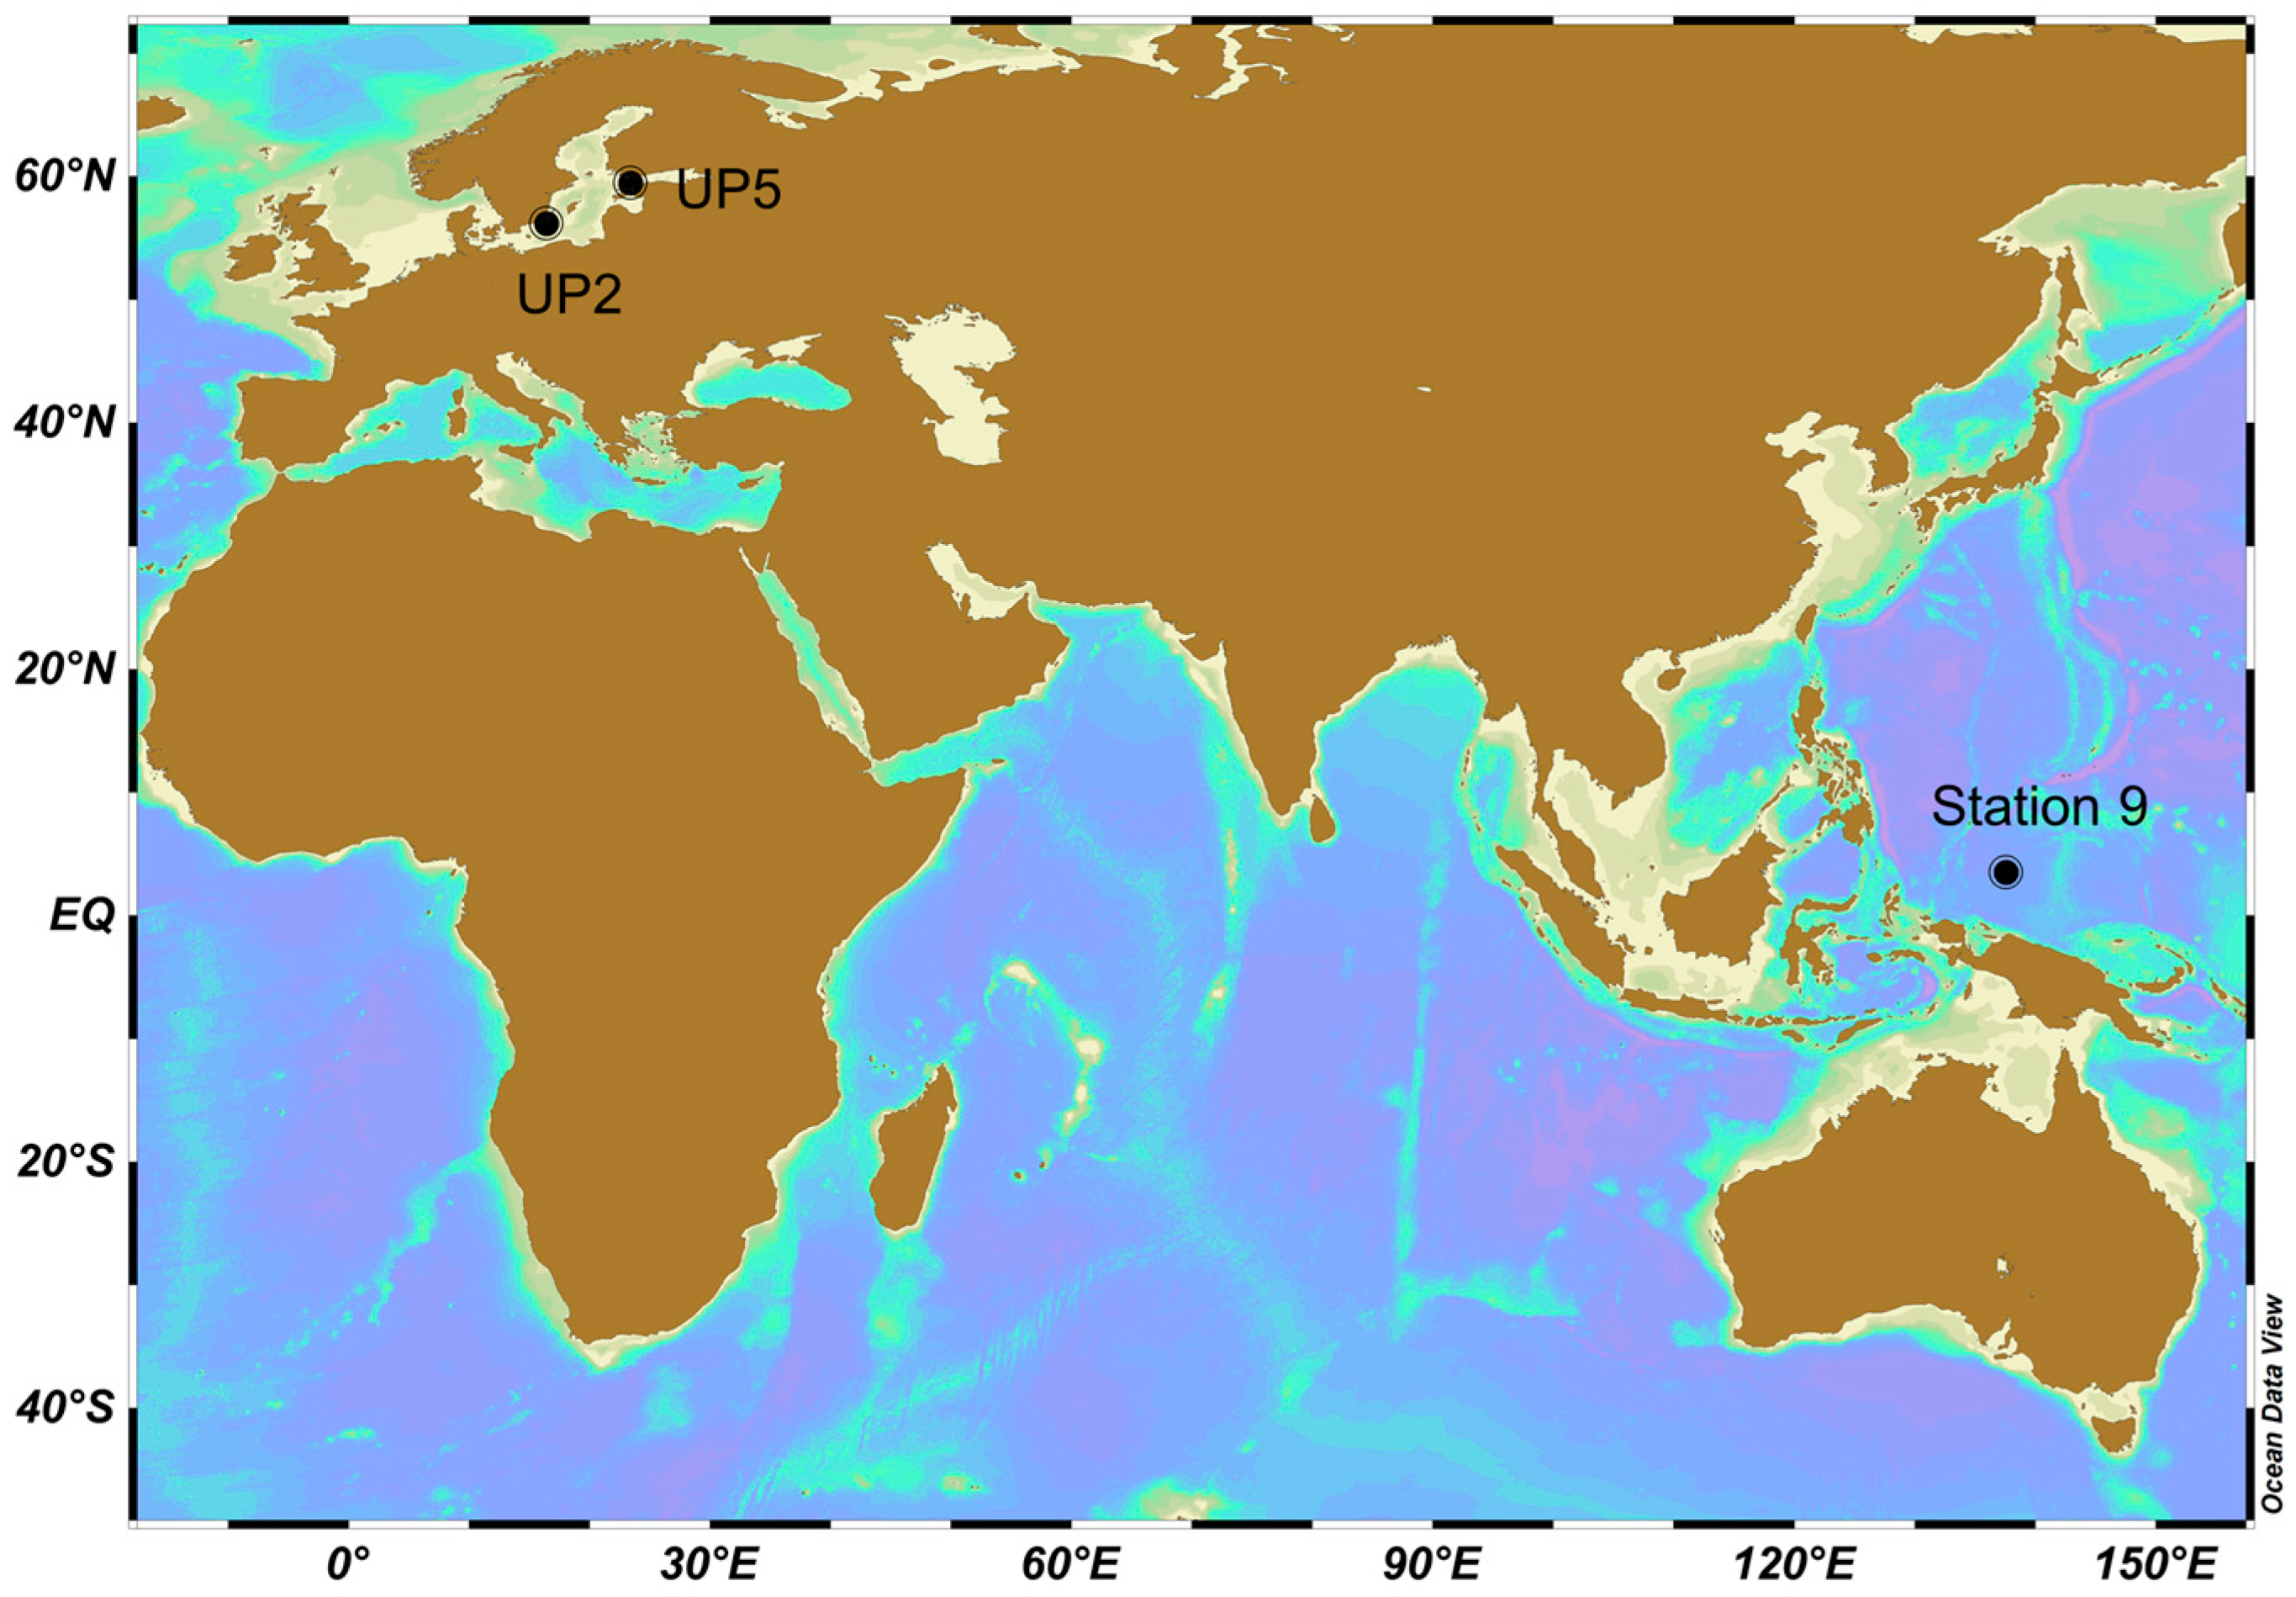
| Baltic Sea | 56.1709 | 16.4275 | 03/Aug/2015 11:15 | UP2 | Winkler | 12 | 4.3 | 3 | 5.4 | 3 | Coastal, Upwelling |
| Baltic Sea | 59.4609 | 23.3726 | 08/Aug/2015 10:30 | UP5 | Winkler | 10.7 | 6.1 | 4 | 8.3 | 5 | Coastal |
| Pacific Ocean | 3.5109 | 137.5965 | 28/Oct/2016 00:34 | Station 9 | Microelectrode | 29.5–35.5 | 8.1 | 5 | 16.6 | 7 | Open ocean |
© 2017 by the authors. Licensee MDPI, Basel, Switzerland. This article is an open access article distributed under the terms and conditions of the Creative Commons Attribution (CC BY) license (http://creativecommons.org/licenses/by/4.0/).
Share and Cite
Rahlff, J.; Stolle, C.; Wurl, O. SISI: A New Device for In Situ Incubations at the Ocean Surface. J. Mar. Sci. Eng. 2017, 5, 46. https://doi.org/10.3390/jmse5040046
Rahlff J, Stolle C, Wurl O. SISI: A New Device for In Situ Incubations at the Ocean Surface. Journal of Marine Science and Engineering. 2017; 5(4):46. https://doi.org/10.3390/jmse5040046
Chicago/Turabian StyleRahlff, Janina, Christian Stolle, and Oliver Wurl. 2017. "SISI: A New Device for In Situ Incubations at the Ocean Surface" Journal of Marine Science and Engineering 5, no. 4: 46. https://doi.org/10.3390/jmse5040046