Scour Effects on the Lateral Behavior of a Large-Diameter Monopile in Soft Clay: Role of Stress History

1
Power China Huadong Engineering Limited Corporation, Hangzhou 310058, China
2
Key Laboratory of Offshore Geotechnics and Material of Zhejiang Province, College of Civil Engineering and Architecture, Zhejiang University, Hangzhou 310058, China
3
Ming Yang Smart Energy Group Co. LTD, Guangzhou 510000, China
*
Author to whom correspondence should be addressed.
J. Mar. Sci. Eng. 2019, 7(6), 170; https://doi.org/10.3390/jmse7060170
Submission received: 23 March 2019
/
Revised: 27 May 2019
/
Accepted: 27 May 2019
/
Published: 1 June 2019
(This article belongs to the Special Issue Coastal Geohazard and Offshore Geotechnics)
Abstract
:Scouring of soil around large-diameter monopile will alter the stress history, and therefore the stiffness and strength of the soil at shallow depth, with important consequence to the lateral behavior of piles. The existing study is mainly focused on small-diameter piles under scouring, where the soil around a pile is analyzed with two simplified approaches: (I) simply removing the scour layers without changing the strength and stiffness of the remaining soils, or (II) solely considering the effects of stress history on the soil strength. This study aims to investigate and quantify the scour effect on the lateral behavior of monopile, based on an advanced hypoplastic model considering the influence of stress history on both soil stiffness and strength. It is revealed that ignorance about the stress history effect (due to scouring) underestimates the extent of the soil failure wedge around the monopile, while overestimates soil stiffness and strength. As a result, a large-diameter pile (diameter D = 5 m) in soft clay subjected to a souring depth of 0.5 D has experienced reductions in ultimate soil resistance and initial stiffness of the p-y curves by 40% and 26%, and thus an increase of pile head deflection by 49%. Due to the inadequacy to consider the stress history effects revealed above, the existing approach (I) has led to non-conservative estimation, while the approach (II) has resulted in an over-conservative prediction.
1. Introduction
Scour is a process of soil erosion and can often occur around the foundations of offshore structures [1,2,3,4,5]. Currently, monopiles are the most widely employed foundation for offshore wind turbines, and its slenderness ratio of embedded pile length to pile diameter (L/D) are relatively small (typically in the range of 4–8). Scour reduces the pile embedded length and changes the stress history of the remaining soils, which significantly influences pile responses and the natural frequency of wind turbines [5]. Thus, scour should be well considered during the design of wind turbines.
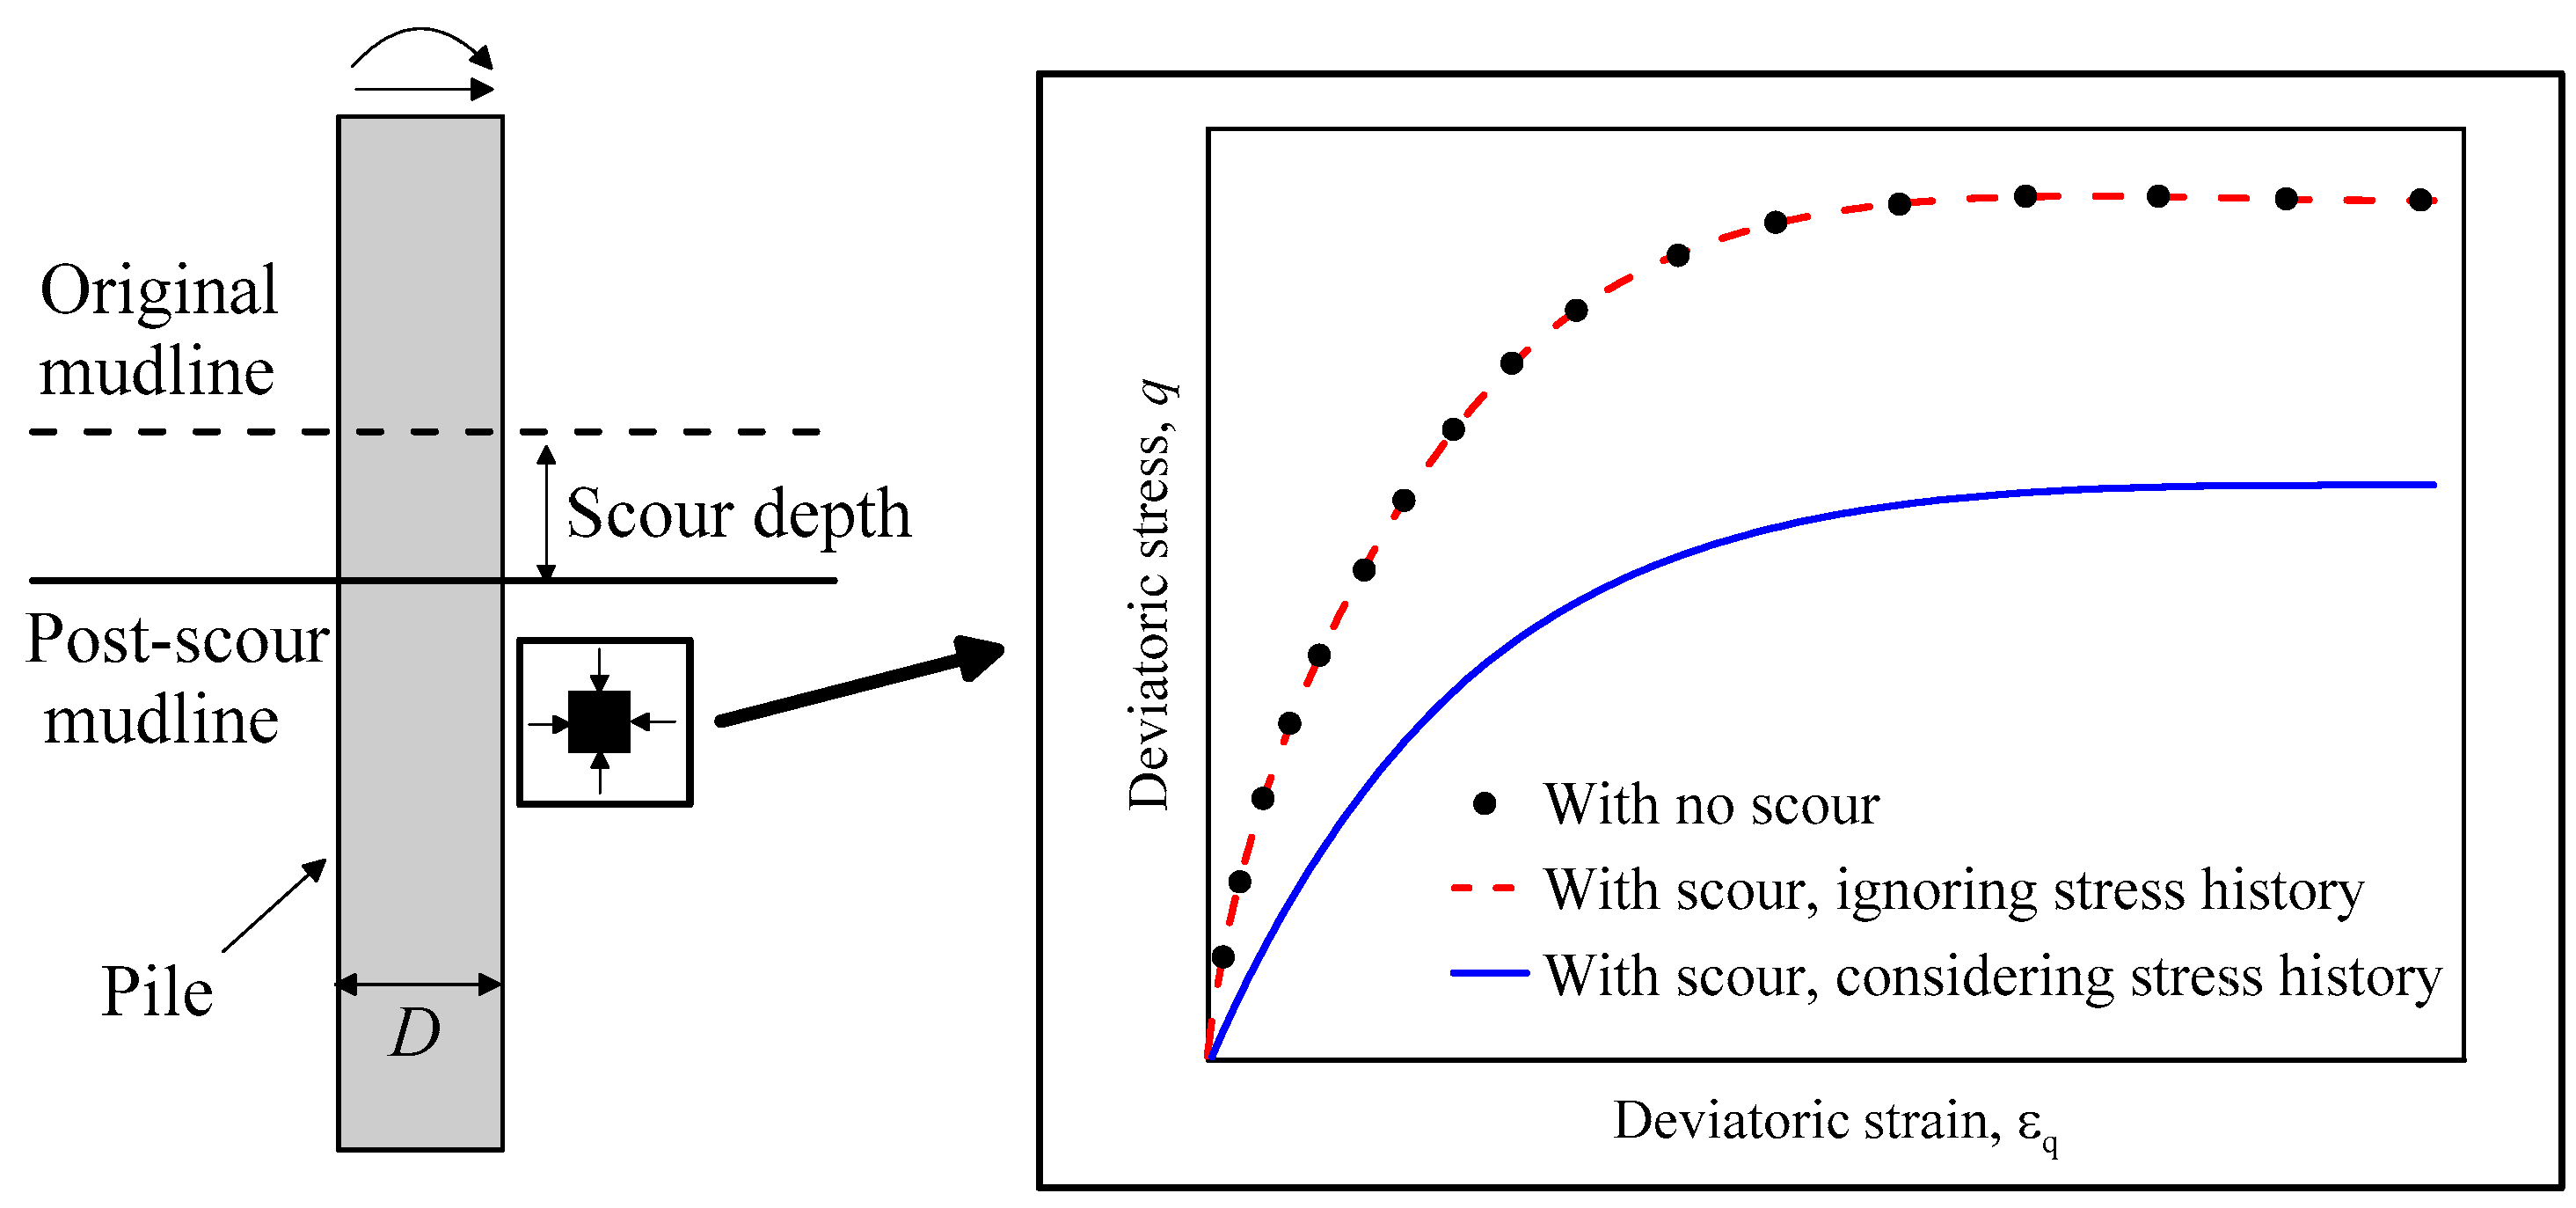
Although extensive research efforts have been paid on sour effect on pile lateral responses [6,7,8,9], most of these studies have been largely limited to small-diameter piles, with ignorance of the stress history effect under scour conditions. The response of the laterally loaded pile under scouring is usually analyzed by two simplified approaches (I): simply removing the scour layers without changing the strength and stiffness of the remaining soils [7,8], or (II) solely considering the effects of stress history on the soil strength [10,11,12]. The approach (I) ignores the stress history effect due to scouring, which overestimates the undrained shear strength of the remaining soils (as shown in Figure 1), and thus leads to a non-conservative estimation of monopile response. The influence of altering the stress history by scouring on the stiffness of soil, which governs the natural frequency and fatigue of monopile supported wind turbine, has not been taken into account in both approaches (I) and (II).
At present, the p-y method is widely used for the analysis of laterally loaded piles. In this method, the pile is considered as an elastic beam and the soil is represented by a series of discrete p-y springs. The most widely used p-y curves were proposed by Matlock [13], which had been adopted in design codes. The Matlock p-y curves are formulated as follows:
where p is lateral soil resistance per unit length of a pile; y is lateral pile deflection; yc is the lateral displacement at half the maximum soil stress, which can be determined by:
where ε50 is the strain at one-half the maximum stress.
pu is the ultimate soil resistance per length, which is equal to the smaller value of pu1 and pu2 calculated by:
where is the effective unit weight; su is the soil undrained shear strength; J is a constant value; z is the depth below the post-scour mudline.
Lin et al. [10] modified Matlock p-y curves to consider the stress history effect. This was achieved by modifying the ultimate soil resistance, pu. The modification of pu depends on the change of the undrained shear strength and the effective unit weight of the remaining soils after scour, as follows [14]:
where and are the soil undrained shear strength before and after scour, respectively; and are the vertical effective stress before and after scour, respectively; OCR is the overconsolidated ratio of soil; ᴧ is a parameter (approximately 0.8); and are the effective unit weight before and after scour, respectively; eint is soil void ratio before scour; Sd is scour depth; Cc and Cur denote the compression and swelling indexes obtained from the oedometer tests.
By substituting Equations (5) and (6) into Equations (3) and (4), the equations for pu considering the stress history effect can be rewritten as follows:
Lin’s method [10] offered novel insights into the stress history effects due to scouring. Subsequently, Zhang et al. [12] and Liang et al. [13] further developed Lin’s [10] p-y method to consider not only the stress history effect, but also scour-hole dimension and vertical load effect, respectively. However, the above-mentioned methods for considering the stress history effect are all based on Matlock p-y curves. It is well known that Matlock p-y curves were developed from a full-scale field lateral loading test on long, and flexible pile with a diameter of 0.324 m and the ratio of pile embedded length to diameter of 39.5. Its validity for large diameter (typically 4–6 m) monopiles of offshore wind turbines has been questioned by many researchers [15,16,17,18]. Thus, DNVGL [19] recommends that any proposed design method for large diameter monopiles should be validated by other means, such as by finite element calculations [18]. In addition, due to the stress–dependent behavior of soil, scour-induced stress loss decreases the soil stiffness of the remaining soils, which directly affects the initial stiffness of p-y curves. However, those methods for considering the stress history effect are based on the Matlock p-y curves, which make use of a parabolic curve shape, and thus the initial tangent modulus is infinite. In other words, those methods for considering the stress history effect are unable to reflect the influence on the initial stiffness of p-y curves.
The objective of this paper is to present a three-dimensional finite element method to investigate the stress history effect on the response of a monopile supported offshore wind turbine under scour conditions in soft clay. In this study, a full-scale offshore wind turbine was chosen as the reference structure. An advanced hypoplastic clay model that considers dependency of soil stiffness and strength on stress history was adopted. The three-dimensional model was validated with a published centrifuge test, and then analyses were performed to examine the stress history effect on monopile lateral responses at two different scour depths under the ultimate limit state (ULS) condition. Suitability of the p-y method, proposed by Lin et al. [10] for considering stress history was also assessed.
2. Three-Dimensional Finite Element Analyses
2.1. Three-Dimensional Finite Element Model
A three-dimensional finite element model of a full-scale monopile-supported wind turbine in clay was developed using the software ABAQUS. The properties of the wind turbine and monopile were taken from Ma et al. [20] and Shirzadeh et al. [21]. A schematic diagram of the overall structure is shown in Figure 2a. The monopile has a diameter of 5 m, a wall thickness of 0.07 m and an embedded length of 30 m. The diameter of the tower at the top and bottom are 3.4 and 4.4 m, respectively.
Figure 2b shows an isometric view of the finite element mesh and the boundary conditions adopted in this study. The lateral boundary of the finite element mesh was constrained by roller supports, while the bottom boundary was fixed against translation in all directions. The lateral boundary was 10 D (D is the pile diameter) from the center of the pile, which is sufficient to eliminate the boundary effect [22].
The soil and the whole wind turbine structure were modeled using Eight-node brick with pore pressure (C3D8P) elements and Eight-node brick (C3D8) elements, respectively. The monopile foundation was assumed to be linear elastic with typical properties of Young’s modulus of Ep = 210 GPa and Poisson’s ratio of νp = 0.3. An advanced hypoplastic clay model (to be presented in the following subsection) was used to represent the soil behavior. The interaction between the pile and the soil was simulated based on the Coulomb friction law. The frictional coefficient μ = 0.31 was adopted in this study based on the equation proposed by Randolph and Wroth [23]. The detachment between the pile and the clay was allowed [24].
The tower stiffness, which could have a potential impact on the simulation, was properly considered by adopting the geometry and material of the tower of a 3 MW offshore wind turbine [20,21]. The referred wind turbine was founded on a monopile with a diameter of 5 m, being identical to the pile diameter adopted in this numerical investigation.
2.2. An Advanced Hypoplastic Model for Clay Considering Stress History Effect
An advanced hypoplastic clay model proposed by Masin [25] with considering stress history effect and small-strain stiffness was selected in this study to represent the soil constitutive model. A general formulation of the hypoplastic model can be written as [26,27,28]:
where and D represent the objective stress rate and the Euler stretching tensor, respectively.
The hypoelastic tensor L is
where I is a fourth-order identity tensor; a, c1, and c2 are the three parameters, and can be calculated by
where φ’c is a model parameter that denotes critical friction angle; ν is a model parameter that controls the soil shear stiffness at large strain; Parameter α can be calculated by
where λ* and κ* are model parameters defining the slope of the isotropic virgin compression and unloading line in the ln(1 + e) versus ln (p’) plane, respectively. (e and p’ denote void ratio and mean effective stress, respectively).
The N is a second-order constitutive tensor and can be expressed as
where Y and m denote the degree of non-linearity and tensorial quantity, respectively, and have the following equations
with factor F given by
where
where pr = 1 kPa is a reference stress; N is a model parameter defining the position of the isotropic virgin compression line in the ln(1 + e) versus ln (p’) plane.
The model is formulated based on incremental equations, which is distinctively different from the conventional elastoplastic framework, i.e., decomposing strains into elastic and plastic parts. The stress rate varies nonlinearly with the strain rate D due to the nonlinear form given by the Euclidian norm , and thus there is no need to define yield surface when predicting nonlinear behavior.
In summary, the basic hypoplastic clay model requires five parameters, i.e., φ’c, N, λ*, κ*, and ν. The parameters are equivalent to those defined in the modified Cam clay model.
The basic hypoplastic clay model can predict the monotonic behavior of clay in the medium to large strain range. In order to consider the small-strain stiffness and stress history effect of clay, the so-called intergranular strain concept [29] is combined in the enhancement of the basic model. The intergranular strain δ is used as a new tensorial state variable and the normalized magnitude of δ is:
where R is a model parameter that denotes the size of the elastic range.
The direction of the intergranular strain δ is:
The general stress-strain relation can be re-written as:
where u is a fourth-order tensor that represents stiffness, and can be calculated using the following equation:
where χ is a model parameter that controls the rate of stiffness degradation; mrat is a model parameter that can be quantified by the ratio between initial small-strain stiffness upon a 90° strain path reversal and the initial stiffness upon a 180° strain reversal; mR represent the initial small-strain stiffness upon a 180° strain path reversal. mR can be calibrated to fit the initial stiffness G0, which is formulated by Wroth and Houlsby [30], as follows:
where Ag and ng are model parameters that reflect the stress dependency of small-strain stiffness.
The evolution equation for the δ is:
where βr is a model parameter that controls the rate of stiffness degradation.
In summary, the advanced hypoplastic clay model adopted in this study consists of 11 model parameters in total. Five out of the 11 parameters, i.e., φ’c, N, λ*, κ* and ν are for the basic model. The six other parameters, i.e., R, mrat, βr, χ, Ag, and ng are for the intergranular concept.
2.3. Parameter Calibration and Model Validation
The basic model parameters of kaolin clay, i.e., φ’c, N, λ*, and κ* were obtained from Powrie [31] and Al-Tabbaa [32]. The parameters R, mrat, βr, and χ were calibrated against data reported by Benz [33] on small-strain stiffness of kaolin clay, as shown in Figure 3a. In order to calibrate the remaining parameters ν, Ag, and ng, an undrained cyclic triaxial test was carried out. The kaolin clay sample was consolidated under an isotropic confining stress of 200 kPa, followed by 100 cycles of undrained cyclic compression. More details about the triaxial test can be found in He [34]. The confining stresses in the afore-mentioned elemental tests (for calibrating model parameters) generally do not exceed 200 kPa, except one case of 300 kPa in Benz [33]’s tests. This range of effective confining stress (i.e., p’ ≤ 200 kPa) is relevant to that considered in the numerical investigation reported herein, i.e., p’ value of the soil (γ’ = 8 kN/m3, K0 = 0.625, where K0 is the coefficient of lateral earth pressure) along the 30 m deep monopile fall within 180 kPa. It is worth noting that the Kaolin clay can differ a lot depending on the manufacture. The aforementioned databases for the calibration of the model parameters and the trixial test were all based on the same type of Kaolin, i.e., Speswhite Kaolin clay.
Results of the cyclic triaxial test and calibration are shown in Figure 3b for comparison. It can be found that the hypoplastic model can reasonably capture the soil behavior. All of the 11 model parameters used in this study are summarized in Table 1.
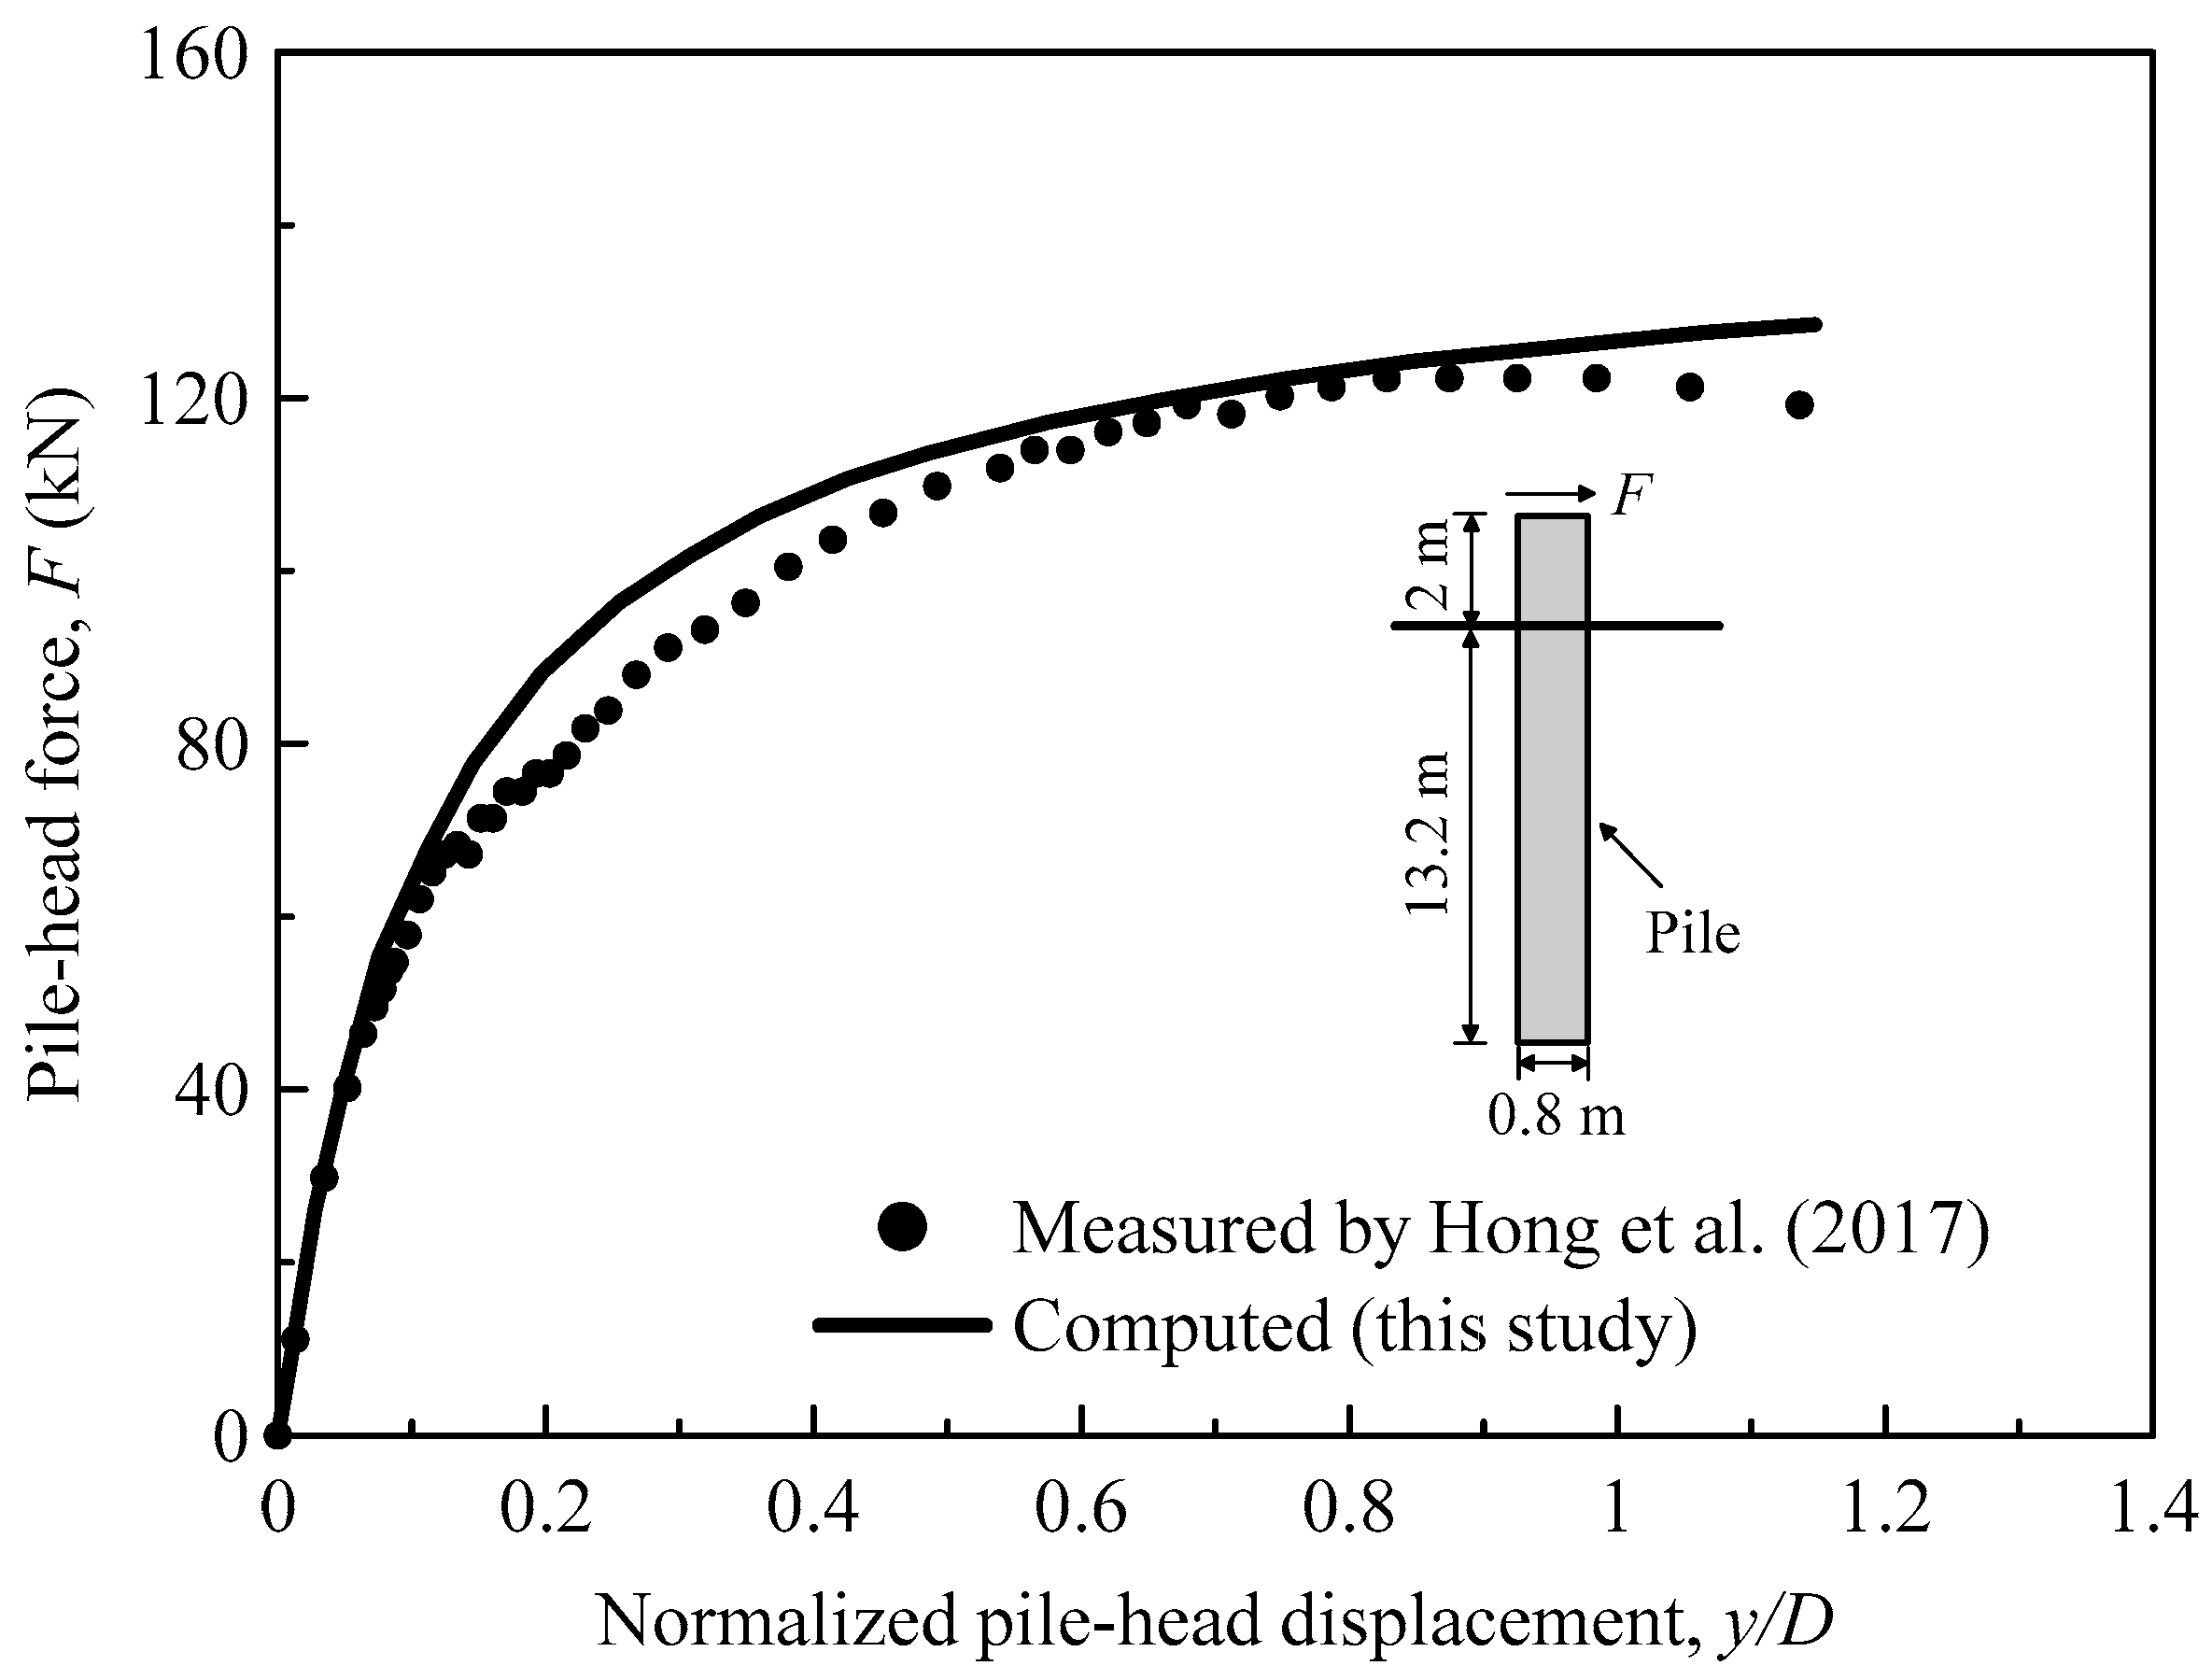
Given the scarcity of published experimental results on large diameter rigid piles (e.g., D = 5 m, as simulated in this study), the hypoplastic clay model was verified against centrifuge test results on a semi-rigid pile in soft clay (Hong et al. [35]). The model pile has a diameter of D = 0.8 m in prototype. Its embedded length (L) and load eccentricity (h) are 13.2 and 2 m in prototype, respectively. The slenderness ratio (L/D) of the model pile is therefore 16.5. A three-dimensional finite element model was established to simulate the centrifuge model. Figure 4 shows the computed and measured monotonic lateral load-deflection relationship at the pile head. A good agreement can be found between the computed and measured results. Hence, it can be concluded that the three dimensional finite element model adopted in this study is capable of modelling the pile-soil interaction. Although the hypoplastic model has reasonably predicted the lateral behavior of the semi-rigid pile, it is desirable to perform tests on large diameter rigid piles in the future for further verifying the predictive capability of the model against such piles.
2.4. Load Case
An ultimate design load case, i.e., the Extreme Turbulence Model (ETM) wind load at rated wind speed combined with the 50-year Extreme Wave Height (EWH) [36], was considered in this study. The environmental site conditions adopted in this study are summarized in Table 2 [20].
The wind load acting on the hub Fhub was estimated as [37,38]:
where ρa is the density of air; AR is the rotor swept area; CT is the thrust coefficient, and U is the wind speed.
The wind load acting on the tower of height z was calculated as [36]:
where is the wind pressure area on the tower of height z; Cs is shape coefficient which equals to 0.5 for the tubular tower; Vz denotes the average wind speed as a function of height z. The normal wind speed profile is given by the power law [36]:
where Vhub is the wind speed at the height of the hub zhub; α is the power law exponent, which is assumed to be 0.2.
Wave forces on the structure were calculated using the Morison’s equation based on the linear Airy wave theory [36]:
where is the horizontal wave load on a vertical element dz of the monopile at level z; CM is the inertia coefficient; CD is the drag coefficient; ρ is the mass density of the sea water; Dt is the diameter of each section; and are the wave-induced velocity and acceleration in the horizontal direction. Since current force is relatively small compared to wind and wave force, thus loads due to current are not considered for analysis.
2.5. Numerical Modelling Procedure
The validated 3D model was then developed to investigate the stress history effect on the lateral response of the monopile under scour conditions. The clay was assumed to be normally consolidated before scour. For the purpose of the case studies considered in this paper, two scour depths similar to Lin et al. [10], i.e., Sd = 0.2 D (1 m) and Sd = 0.5 D (2.5 m) were examined. The detailed procedures are as follows:
Procedures of modelling scour ignoring stress history:
- (1)
- (2)
- Initial K0 stress of the soil was generated by a spatial calculation method available in ABAQUS in a Geostatic step. In this step, an equivalent pressure that equals the vertical stress of the scour layer was then applied on the soil surface. Due to the equivalent pressure, the soil stress of the remaining soil after scour keep remained unchanged. Therefore, the soil shear strength and other soil properties of the remaining soil after scour were assumed to be the same with those before scour. This operation can model scour ignoring the stress history effect, which is similar to the method often used in practice, i.e., just simply removing the scour layer while keeping the soil properties of the remaining soil unchanged.
- (3)
- Wished-in-place pile installation was achieved by changing appropriate elements to a linear elastic material of the pile. Pile installation effect was not considered for a reasonable simplification.
- (4)
- The loads described in Section 2.4 were applied on the structure.
Procedures of modelling scour considering the stress history effect:
- (1)
- A model without scour was first developed, and then the initial K0 soil stress was achieved.
- (2)
- Defining a special step for forming scour. In this step, the scour layer was removed by adding keywords in the ABAQUS input file, i.e., Model change, remove, as shown in Figure 5c. This operation models the unloading process when scouring, and thus takes accout of the stress history effect.
- (3)
- Changing appropriate elements to a linear elastic material of the pile, and the loads described in Section 2.4 were applied on the structure.
3. Numerical Results
3.1. Undrained Shear Strength after Scour
The distributions of the overconsolidation ratio (OCR) of the clay at two different scour depths are shown in Figure 6a. After scour, the normally consolidated clay becomes overconsolidated. The OCR increases with increasing scour depth and decreases with soil depth and gradually approaches a normally consolidated condition at a greater depth.
The properties and stresses of the soil elements at different depths after scour were extracted from the model to calculate the undrained shear strength. Figure 6b shows the undrained shear strength (su) of the remaining clay after scour. When the stress history effect is ignored, the soil vertical stress and the OCR of the remaining soil keep unchanged. Therefore, the undrained shear strength of the remaining soil is almost the same as that in the condition of no scour, and could be fitted by a linear line, i.e., su = 1.66 z. However, the undrained shear strength of the remaining soil which considers the stress history effect is found to be decreased when compared with that of ignoring the stress history. In this study, ᴧ = 0.78 in Equation (5) provides the best agreement with the computed results, as shown in Figure 6b.
3.2. Lateral Load-Deflection Response
Figure 7a,b show the computed load-deflection response at pile-head at the scour depth of Sd = 0.2 D and Sd = 0.5 D, respectively. The results of the case of no scour are also presented in the figures. All the detailed values are summarized in Table 3. It should be noted that, at any given scour depth, the percentage increases in pile head deflection presented in Table 3 are relative to the values of that with ignoring the stress history effects.
Under the scour conditions, considering the stress history effect results in 13% (Sd = 0.2 D) and 49% (Sd = 0.5 D) higher pile-head deflection compared with the case in which the stress history effect is ignored. The percentage increase in pile-head deflection between considering and ignoring the stress history effect is found to increase with increasing scour depth. Therefore, ignoring the stress history of the remaining soil is likely to cause an unconservative analysis of the laterally loaded pile under scour conditions. A similar conclusion is also made by Lin et al. [10] and Zhang et al. [12]. In addition, compared to the result of no scour, considering scour and the resulted stress history effect leads to a 16% (Sd = 0.2 D) and 64% (Sd = 0.5 D) increase in lateral pile-head deflection. It is recommended that scour and the accompanying stress history effect should be well treated when designing the monopile-supported wind turbines in clay.
For comparison, the calculated lateral load-deflection relationships at pile head by using the modified p-y curves proposed by Lin et al. [10] (see Equations (1), (2) and (5)–(8)) at scour depth of Sd = 0.2 D and Sd = 0.5 D are also included in the Figure 7a and Figure 7b, respectively. Since scour has an insignificant effect on the change of the effective unit weight of the remaining soil [10,12], thus it was ignored in this study.
As shown in the figures, at any given lateral pile-head displacement, the calculated force at the pile head based on Lin’s [10] p-y method is lower than those computed. The difference is likely attributed to the factor that Lin’s [10] p-y curves is developed based on Matlock’s p-y method [11]. It has been well recognized that Matlock’s p-y method [11] is mainly applicable to small-diameter flexible piles, but could significantly underestimate the lateral resistance of a large-diameter rigid pile, due to the ignorance of resistances from base shear force, base moment and skin friction [15,16,17,18]. On the other hand, all these factors have been implicitly considered in the 3D finite element analyses reported herein. Nevertheless, the percentage difference between ignoring and considering the stress history effect are comparable. As can be seen in Table 3, by using Lin’s [10] p-y method, the calculated pile-head deflection when considering stress history effect increases by 25% (Sd = 0.2 D) and 75% (Sd = 0.5 D) compared with that of ignoring stress history effect. The differences are higher than those computed by 3D FE analysis, i.e., 13% for Sd = 0.2 D and 49% for Sd = 0.5 D. The comparison shows that Lin’s [10] p-y method overestimates the percentage difference in pile-head deflection between ignoring and considering stress history effect.
It would be not possible to model lateral behavior of piles under unsymmetrical and irregularly shaped scour with p-y curves. Instead, finite element method, as adopted in this study, has an advantage to account for these effects.
3.3. Profiles of the Bending Moment
Figure 8 shows the bending moment profiles at different scour depths. Generally speaking, the computed maximum bending moments in the pile are slightly lower than that calculated by Lin’s [10] p-y method. This difference may be due to the inherent difference between the 3D FE analysis and the p-y method. When considering the stress history effect, the location of maximum bending moment shifts toward to a greater depth and results in 1% (Sd = 0.2 D) and 2% (Sd = 0.5 D) higher maximum bending moment compared with the case in which stress history is neglected. It can also be found that the percentage difference in the maximum bending moment, between considering and ignoring stress history effect increases insignificantly with increasing scour depth. The results indicate that the stress history effect may have a minor influence on the maximum bending moment in the pile. Besides, when the scour depth increases to 0.2 D and 0.5 D, the maximum bending moment increases by approximately 2% and 5%, respectively, compared with that under no scour condition. To some extent, the scour and the stress history effect on the maximum bending moment in the pile can also be ignored.
3.4. Soil Displacement Field
The computed soil displacement fields, as well as displacement vectors are shown in Figure 9 and Figure 10 at the scour depth of Sd = 0.2 D and Sd = 0.5 D, respectively. Two distinct soil flow mechanisms can be clearly identified for the large diameter monopile, namely a wedge mechanism near the ground surface and rotational soil flow near the pile toe. Similar failure mechanisms were also observed by Hong et al. [35] and Schroeder et al. [39]. When considering the stress history effect, the width of the wedge failure zone on the ground surface extends from 1.6 D to 1.8 D (Sd = 0.2 D) and 1.7 D to 2.5 D (Sd = 0.5 D). Meanwhile, the wedge failure zone is observed to extend to a greater depth, i.e., from 0.53 L (L = pile embedded length before scour) to 0.57 L (Sd = 0.2 D) and 5.7 L to 6.7 L (Sd = 0.5 D). As expected, the differences in the width and depth of the wedge failure zone between considering and ignoring stress history effect increase with increasing scour depth. As for the rotation center of the plane rotation zone, when considering stress history, it moves downward from 0.76 L to 0.78 L (Sd = 0.2 D) and 0.78 L to 0.82 L (Sd = 0.5 D). As a conclusion, soil failure mechanism of the large diameter monopile consists of two parts, namely wedge failure at shallow and rational soil flow at depth. Ignoring the stress history effect underestimates the width and depth of the wedge failure zone, while overestimates the location of the rotational soil flow zone.
3.5. p-y Curves Derived from Finite Element Simulation Results
To investigate the stress history effect on p-y curves and to assess the suitability of the modified p-y curves proposed by Lin et al. [10] for considering the stress history effect. The pile-soil contact force and the corresponding lateral pile displacement were extracted from the numerical results to deduce the p-y curves.
Figure 11a,b show the extracted typical p-y curves of the remaining soil after scour at the depth of 0.5 and 1.5 m (measured from the post-scour mudline), respectively. The p-y curves proposed by Lin et al. [10] are also presented in the figure for comparison. It can be seen that both computed and calculated p-y curves reflect a similar trend that is at any given lateral displacement, the p-y curves of considering the stress history effect have much lower lateral soil resistance than that of ignoring the stress history effect. The reduction in lateral soil resistance increases the pile-head deflection and the maximum bending moment in the pile.
It should be noted that at any given depth, the p-y curves proposed by Lin et al. [10] show much lower soil resistance than the computed p-y curves. This is because the p-y curves proposed by Lin et al. [10] are based on Matlock p-y curves which underestimate the ultimate lateral soil resistance. The underestimation has been identified by many researchers based on pile tests and numerical modelling [17,18,40,41]. It should also be noted that the soil resistance of the p-y curves proposed by Lin et al., [10] presented in the figure is far from reaching the ultimate soil resistance. In other words, the p-y curves proposed by Lin et al. [10] significantly overestimate the required lateral displacement to reach the ultimate soil resistance. Due to the much softer p-y curves, the calculated pile-head deflections are much larger than that computed by 3D FE analysis (see Table 3).
The limited number of three-dimensional analyses reported herein (see Figure 11 for example), which aim to illustrate the typical influences of changing stress history (by sour) on soil-pile interaction, are still not sufficient for rigorously formulating a modification of the p-y method. It will be the authors’ future pursuit to propose modified p-y method considering different pile diameters, sour depths and geometries, by performing several series of comprehensive numerical parametric study.
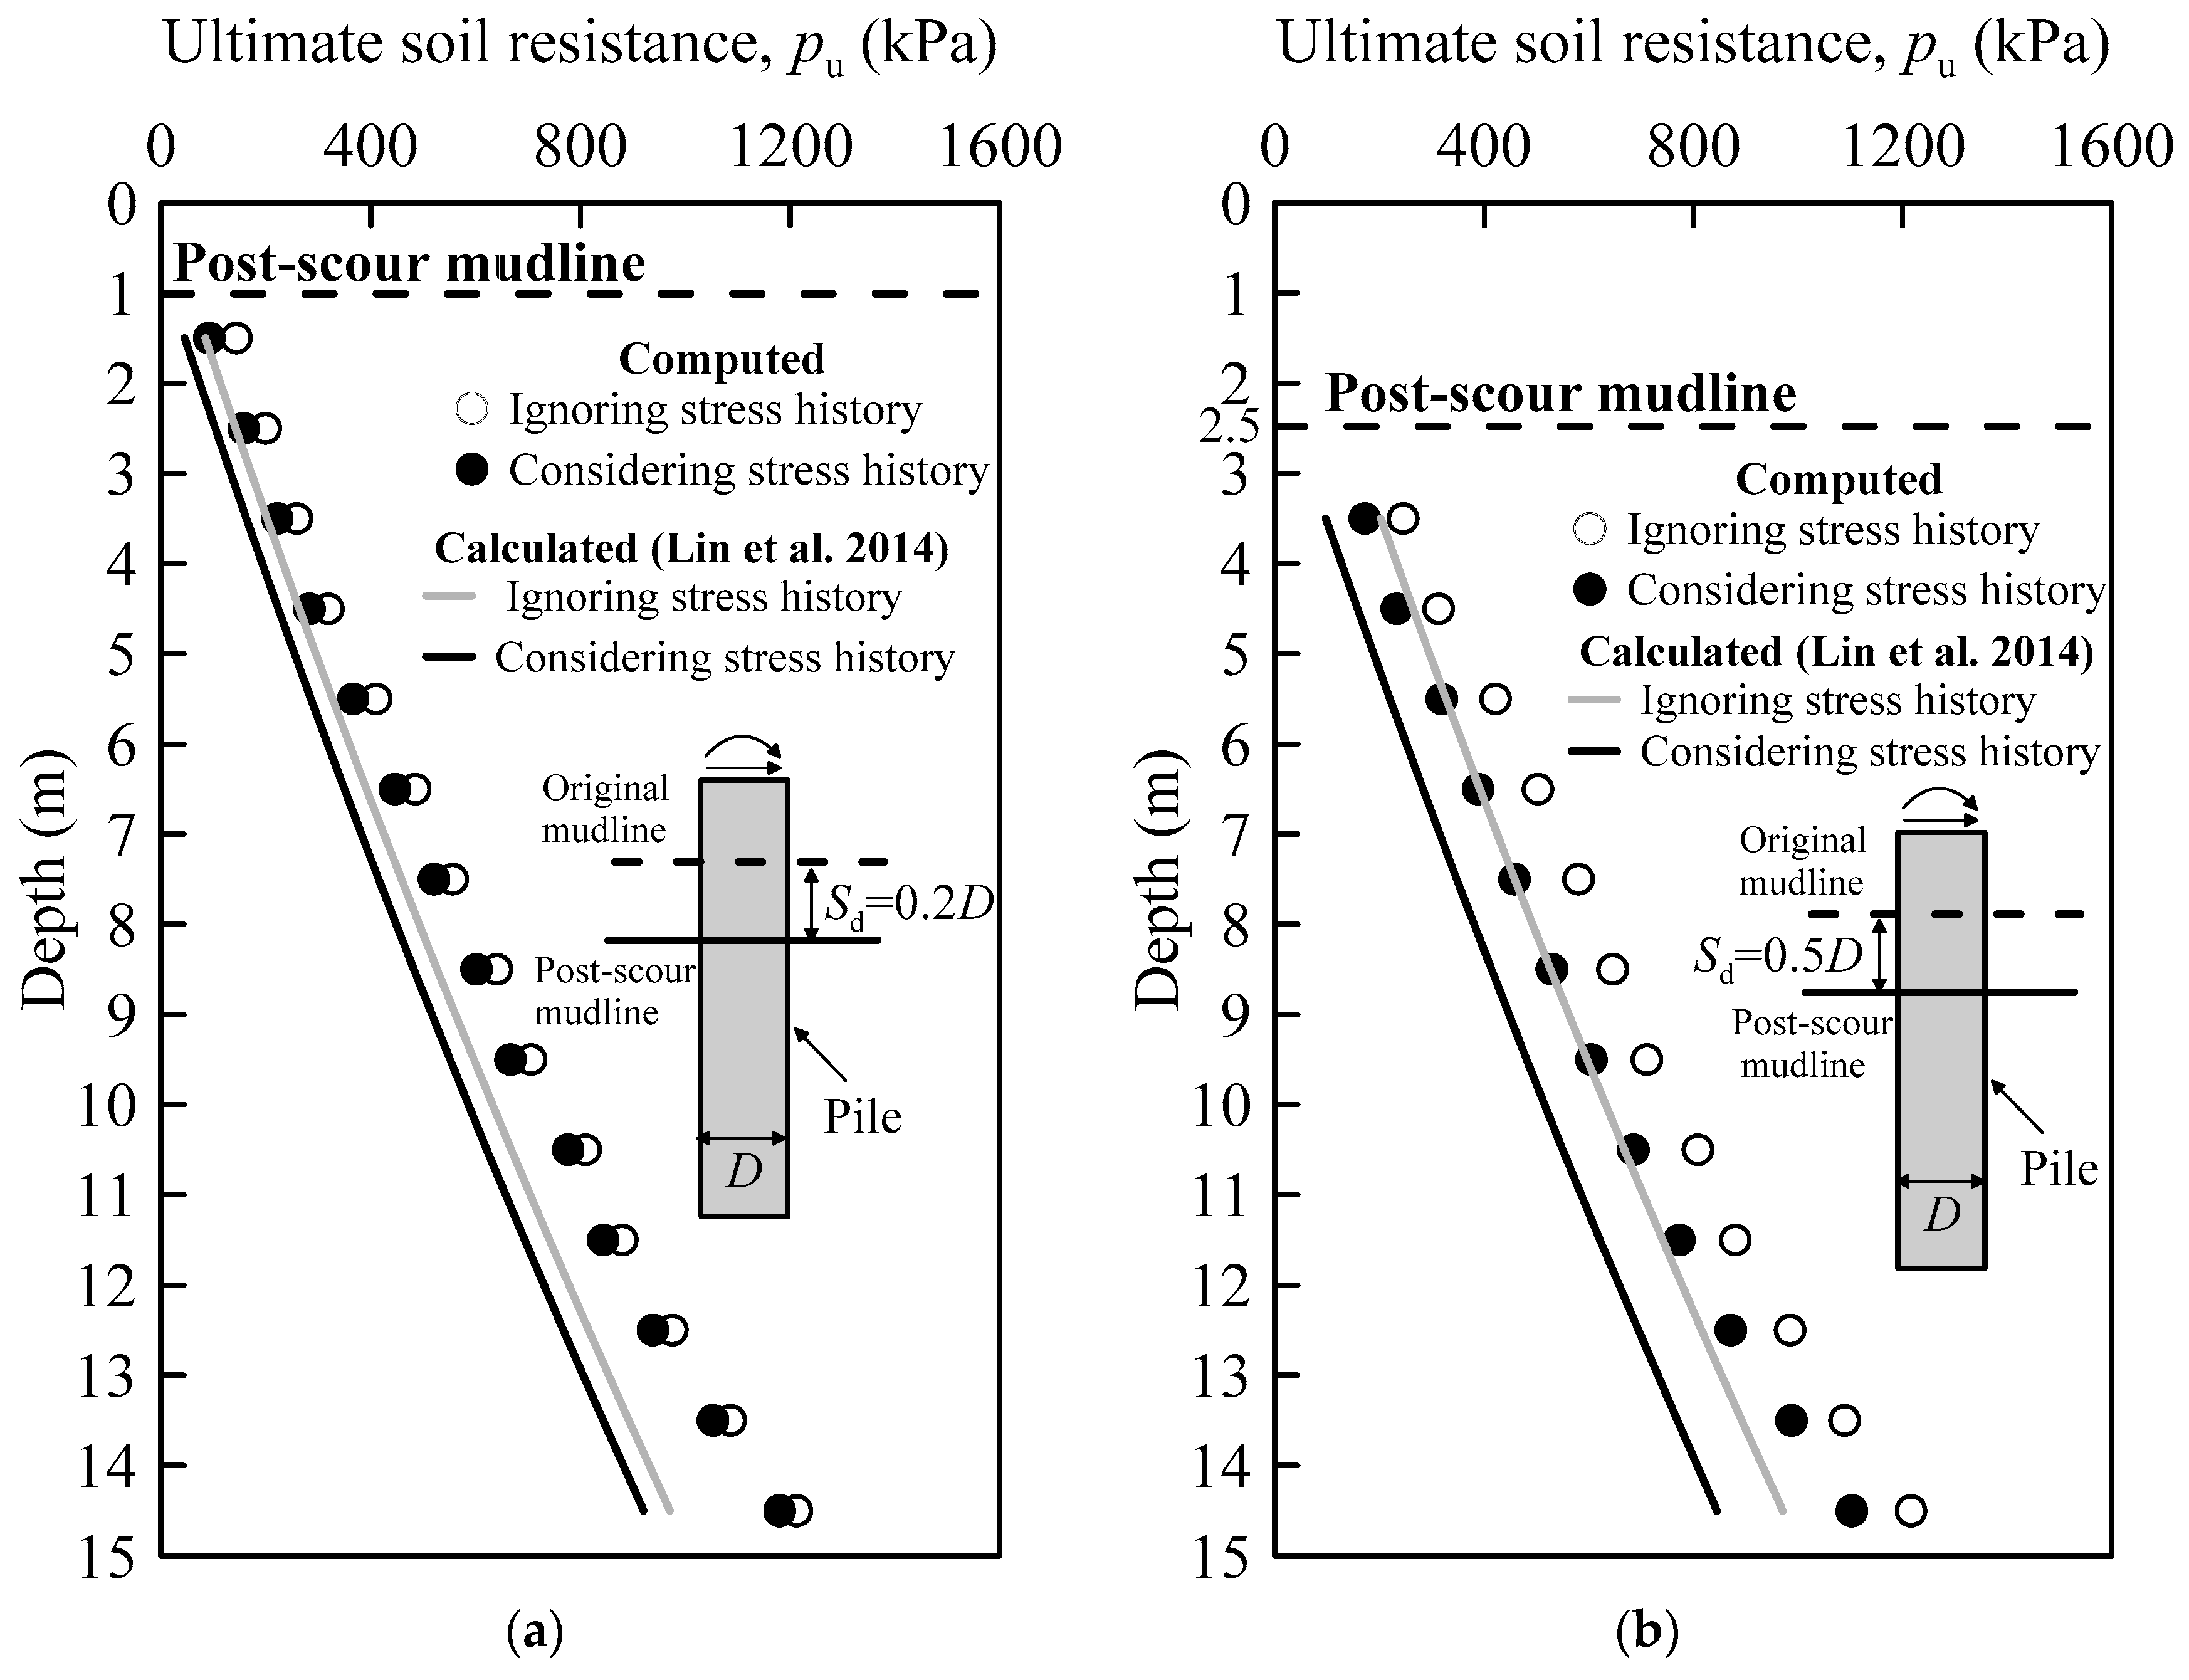
Figure 12a,b present the distributions of the ultimate soil resistance along pile length at scour depth of 0.2 D and 0.5 D, respectively. The ultimate soil resistance calculated based on Lin’s [10] p-y curves is also included in the figure. It should be pointed out that for 3D FE analysis, the soil resistance at deep depth may not be fully mobilized as the lateral displacement was quite small. Thus, those p-y curves were fitted by a hyperbolic function to obtain the ultimate soil resistance [42,43]. As expected, consideration of the stress history of the remaining soil results in a decrease in the ultimate soil resistance when compared with the results obtained when ignoring the stress history effect. A comparison between Figure 12a,b shows that, the difference in the ultimate soil resistance between considering and ignoring the stress history effect increases with increasing the scour depth.
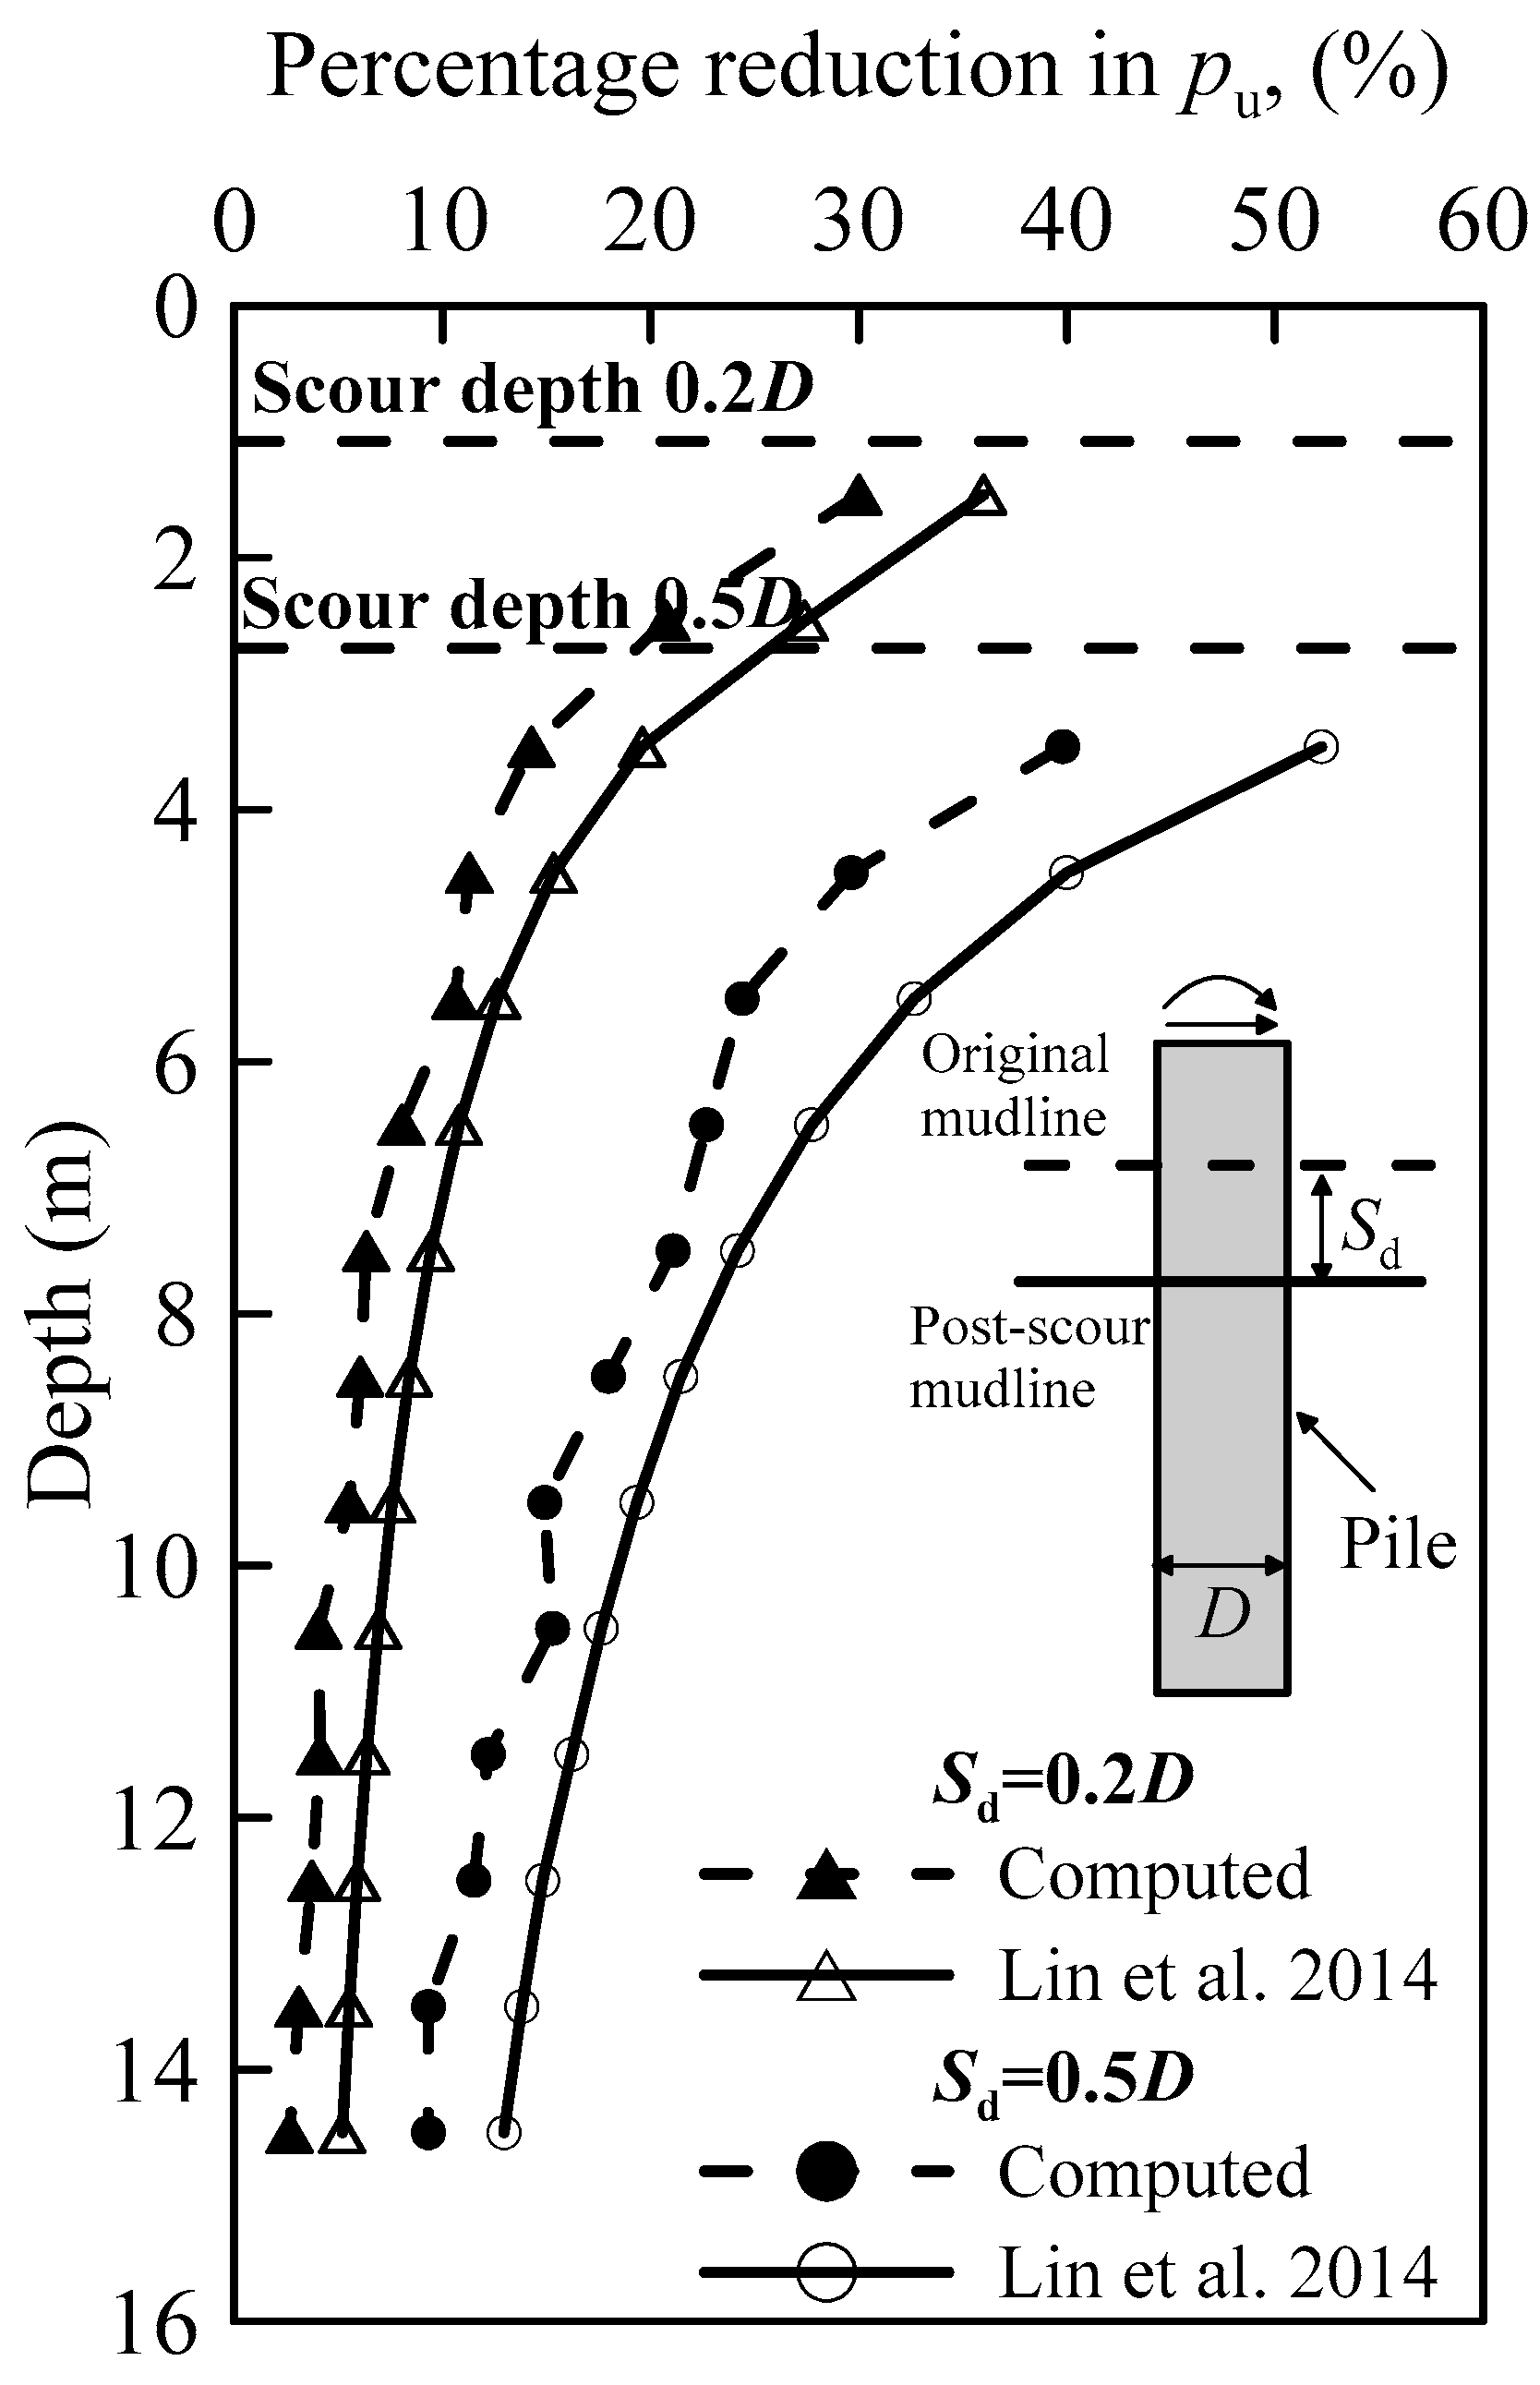
To quantitatively evaluate the effect of stress history on ultimate soil resistance, the percentage reduction in ultimate soil resistance between considering stress history and ignoring stress history is plotted in Figure 13. At any given scour depth, the percentage reductions in ultimate soil resistance in Figure 13 are relative to the values of that with ignoring the stress history effects. As presented in the figure, the percentage reduction decreases when the soil depth increases. Based on the computed results, the percentage reduction in ultimate soil resistance near ground surface between considering stress history and ignoring stress history can be up to 30.1% (Sd = 0.2 D) and 39.8% (Sd = 0.5 D), which is lower than that when using the p-y curves proposed by Lin et al. [10], i.e., the percentage reduction is 36.2% (Sd = 0.2 D) and 52.3% (Sd = 0.2 D). The comparison demonstrates that Lin’s [10] p-y method overestimates the percentage reduction in ultimate soil resistance between considering and ignoring the stress history effect. The overestimation leads to a larger percentage difference in pile-head deflection when compared with that obtained from 3D FE analysis (see Table 3).
Due to the stress dependency of soil behavior, the loss of the overburden stress caused by scour decreases the stiffness of the remaining soil, and finally results in a lower initial stiffness of the p-y curves. The p-y curves proposed by Lin et al. [10] are based on Matlock p-y curves, and thus adopt the same parabolic curve shape, making the initial stiffness of the p-y curves infinite. Therefore, the p-y curves proposed by Lin et al. [10] cannot reflect the stress history effect on the initial stiffness of the p-y curves which has a significant influence on natural frequency and fatigue life of wind turbine structure [44].
Since the initial stiffness of the p-y curves proposed by Lin et al. [10] are infinite, only the distributions of the initial stiffness of the computed p-y curves at scour depth of Sd = 0.2 D and Sd = 0.5 D are presented in Figure 14a,b, respectively. In this study, the secant modulus at a small displacement, i.e., y = D/1000, of the p-y curves were regarded as initial stiffness [44]. It can be clearly seen in the figure that considering stress history effect leads to a decrease in the initial stiffness of the p-y curves when compared with the results that ignoring the stress history. The percentage reduction in initial stiffness between considering and ignoring stress history effect is further examined in Figure 15. At any given scour depth, the percentage reductions in the initial stiffness of p-y curves in Figure 15 are relative to the values of that with ignoring the stress history effects. The figure reveals that the percentage reduction gradually decreases when the soil depth increases. On the other hand, the percentage reduction in the initial stiffness of p-y curves is found to increase with increasing scour depth. When the scour depth is 0.2 D and 0.5 D, the percentage reduction in the initial stiffness of the p-y curves can be up to 20.7% and 25.8%, respectively. The initial stiffness of p-y curves can affect the natural frequency of an offshore wind turbine directly. It was founded by Wang et al. [45] that 10–50% decrease in the initial stiffness of p-y curves could lead to a 4.6–6.6% drop in the natural frequency of the wind turbine, which has a dramatic effect on the wind turbine fatigue life [46]. Thus, it is recommended that the initial stiffness of p-y curves should be well evaluated.
It is worth noting that the soil properties and thus sour geometries generally vary spatially even within a homogeneous layer [47,48]. It will be the authors’ future pursuit to integrate numerical modelling and spatial variability into the analysis of lateral behavior of piles under irregularly shaped scour.
4. Conclusions
This paper presents a numerical investigation for studying the scour effect on the lateral behavior of monopile, based on an advanced hypoplastic model considering the influence of stress history on both soil stiffness and strength. Suitability of the p-y method proposed by Lin et al. [10] that considers the stress history effect was also assessed. Based on this study, the following conclusions can be drawn:
- Scour significantly increases the overconsolidation ratio and reduces the undrained shear strength of the remaining soil, which contributes to the significant difference in pile behavior between considering and ignoring the stress history effect.
- When the scour depth is increased from 0.2 D to 0.5 D, consideration of the stress history effect is found to result in a maximum 30.1–39.8% and 20.7–25.8% reduction in the ultimate soil resistance and the initial stiffness of the p-y curves, respectively. These reductions lead to a 13–49% increase in lateral pile-head deflection and 1–2% increases in maximum bending moments in the pile. Ignoring the stress history effect leads to an unconservative analysis of laterally loaded piles under scour conditions.
- Soil failure mechanism of the large diameter monopile consists of two parts, namely wedge failure at shallow and rational soil flow at depth. Ignoring the stress history effect underestimates the width and depth of the wedge failure zone, while overestimates the location of the rotational soil flow zone.
- Modified p-y curves proposed by Lin et al. [10] for considering the stress history effect overestimate the percentage reduction in ultimate soil resistance. Consequently, Lin’s [10] p-y method will likely overestimate the percentage difference in pile-head deflection between considering and ignoring the stress history effect.
Author Contributions
B.H. and Y.L. guided this research and performed the numerical studies. L.W. and Y.H. drawn the main conclusions. R.Z. processed the results and plot some figures. All of the authors have participated in the writing of the paper. The final manuscript has been approved by all the authors.
Funding
This research was funded by National Key Research and Development Program, grant number 2016YFC0800200; National Natural Science Foundation of China, grant number 51779221; Key Research and Development Program of Zhejiang Province, grant number 51779221; Natural Science Foundation of Zhejiang Province, grant number Q19E090001 and Qianjiang Talent Plan Research Fund of Zhejiang Province, grant number QJD1602028.
Acknowledgments
The authors would like to acknowledge the supports from National Key Research and Development Program (2016YFC0800200), National Natural Science Foundation of China (51779221), Key Research and Development Program of Zhejiang Province (51779221), Natural Science Foundation of Zhejiang Province (Q19E090001) and Qianjiang Talent Plan Research Fund of Zhejiang Province (QJD1602028).
Conflicts of Interest
The authors declare no conflicts of interest.
Nomenclature
| L | embedded pile length |
| D | pile diameter |
| p | soil resistance per length |
| y | lateral pile deflection |
| yc | lateral deflection at half the maximum soil stress |
| ε50 | strain at one-half the maximum stress |
| pu | ultimate soil resistance per length |
| γ′ | volume of the pore fluid |
| su | undrained shear strength |
| z | depth below the post-scour mudline |
| σ′ | vertical effective stress |
| OCR | overconsolidated ratio |
| e | soil void ratio |
| p‘ | mean effective stress |
| Sd | scour depth |
| Cc, Cur | compression and swelling indexes, respectively |
| Ep | Young’s modulus of pile |
| νp | Poisson’s ratio of soil |
| μ | friction coefficient |
| objective stress rate | |
| D | Euler stretching tensor |
| L | hypoelastic tensor |
| I | fourth-order identity tensor |
| N | second-order constitutive tensor |
| Y, m | degree of non-linearity and tentorial quantity, respectively |
| N | position of the isotropic virgin compression line in the ln(1 + e) versus ln (p’) plane |
| λ*, κ* | slope of the isotropic virgin compression and unloading line in the ln(1 + e) versus ln (p’) plane, respectively |
| φ’c | critical state friction angle |
| ν | parameter controlling the shear stiffness |
| δ | intergranular strain |
| R | size of the elastic range |
| direction of the intergranular strain | |
| u | fourth-order tensor |
| mrat | path-dependent parameter |
| βr, χ | strain-dependent parameters |
| Ag, ng | stress-dependent parameters |
| G0 | soil initial stiffness |
| Fhub | wind load acting on the hub |
| ρa, ρ | density of air and sea water, respectively |
| AR | rotor swept area |
| CT, Cs | thrust and shape coefficient, respectively |
| Ftower | wind load acting on tower |
| Atower | wind pressure area on the tower |
| Vz | average wind speed |
| Vhub | wind speed at the height of the hub |
| α | power law exponent |
| φ | soil porosity |
| Fwave | wave load |
| cm, cd | inertia and drag coefficient, respectively |
| , | wave-induced velocity and acceleration |
| K0 | coefficient of lateral earth pressure |
| k | initial stiffness of p-y curves |
References
- Bateni, H.; Jeng, D.S. Estimation of pile group scour using adaptive neuro-fuzzy approach. Ocean Eng. 2007, 34, 1344–1354. [Google Scholar] [CrossRef]
- Guo, Z.; Zhou, W.J.; Zhu, C.B.; Yuan, F.; Rui, S.J. Numerical simulations of wave-induced soil erosion in silty sand seabeds. J. Mar. Sci. Eng. 2019, 7, 52. [Google Scholar] [CrossRef]
- Lin, C.; Han, J.; Bennett, C.; Parsons, R.L. Analysis of laterally loaded piles in sand considering scour hole dimensions. J. Geotech. Geoenviron. Eng. 2014, 140, 04014024. [Google Scholar] [CrossRef]
- Ma, L.L.; Wang, L.Z.; Guo, Z.; Gao, Y.Y. Time development of scour depth around pile group in tidal current. Ocean Eng. 2018, 163, 400–418. [Google Scholar] [CrossRef]
- Yi, J.-H.; Kim, S.-B.; Yoon, G.-L.; Andersen, L.V. Natural frequency of bottom-fixed offshore wind turbines considering pile-soil-interaction with material uncertainties and scouring depth. Wind Struct. Int. J. 2015, 21, 625–639. [Google Scholar] [CrossRef]
- Kishore, Y.N.; Rao, S.N.; Mani, J.S. The behaviour of laterally loaded piles subjected to scour in marine environment. J. Civ. Eng. 2009, 13, 403–406. [Google Scholar]
- Li, F.; Han, J.; Lin, C. Effect of scour on the behavior of laterally loaded single piles in marine clay. Mar. Georesour. Geotechnol. 2013, 31, 271–289. [Google Scholar] [CrossRef]
- Li, H.; Ong, M.C.; Leira, B.J.; Myrhaug, D. Effects of soil profile variation and scour on structural response of an offshore monopile wind turbine. J. Offshore Mech. Arct. Eng. 2018, 140, 042001. [Google Scholar] [CrossRef]
- Ma, H.W.; Yang, J.; Chen, L.Z. Effect of scour on the structural response of an offshore wind turbine supported on tripod foundation. Appl. Ocean Res. 2018, 73, 179–189. [Google Scholar] [CrossRef]
- Lin, C.; Han, J.; Bennett, C.; Parsons, R. Behavior of laterally loaded piles under scour conditions considering the stress history of undrained soft clay. J. Geotech. Geoenviron. Eng. 2014, 140, 06014005. [Google Scholar] [CrossRef]
- Zhang, H.; Chen, S.L.; Liang, F.Y. Effects of scour-hole dimensions and soil stress history on the behavior of laterally loaded piles in soft clay under scour conditions. Comput. Geotech. 2017, 84, 198–209. [Google Scholar] [CrossRef]
- Liang, F.Y.; Zhang, H.; Chen, S.L. Effect of vertical load on the lateral response of offshore piles considering scour-hole geometry and stress history in marine clay. Ocean Eng. 2018, 158, 64–77. [Google Scholar] [CrossRef]
- Matlock, H. Correlations for design of laterally loaded piles in clay. In Proceedings of the Offshore Technology Conference, Houston, TX, USA, 22–24 April 1970; pp. 577–588. [Google Scholar]
- Muir Wood, D. Soil Behavior and Critical State Soil Mechanics; Cambridge University Press: Cambridge, UK, 1990. [Google Scholar]
- Stevens, J.B.; Audibert, J.M.E. Re-examination of p-y curve formulations. In Proceedings of the 11th Annual Offshore Technology Conference, Houston, TX, USA, 22–24 April 1970; pp. 397–403. [Google Scholar]
- Lam, I.P.O. Diameter Effects on p–y Curves; Deep Foundations Institute: Hawthorne, CA, USA, 2009; pp. 1–15. [Google Scholar]
- Lau, B.H. Cyclic Behaviour of Monopile Foundations for Offshore Wind Turbines in Clay. Ph.D. Thesis, University of Cambridge, Cambridge, UK, 2015. [Google Scholar]
- Byrne, B.W.; McAdam, R.A.; Burd, H.; Houlsby, G.T.; Martin, C.M.; Beuckelaers, W.J.A.P.; Zdravkovic, L.; Taborda, D.M.G.; Potts, D.M.; Jardine, R.J.; et al. PISA: New design methods for offshore wind turbine monopiles. In Proceedings of the Society for Underwater Technology Offshore Site Investigation and Geotechnics 8th International Conference, London, UK, 14–17 September 2017. [Google Scholar]
- DNVGL. DNVGL-ST-0126-Support Structure for Wind Turbines; Det Norske Veritas: Oslo, Norway, 2016. [Google Scholar]
- Ma, H.W.; Yang, J.; Chen, L.Z. Numerical analysis of the long-term performance of offshore wind turbines supported by monopiles. Ocean Eng. 2017, 136, 94–105. [Google Scholar] [CrossRef]
- Shirzadeh, R.; Weijtjens, W.; Guillaume, P.; Devriendt, C. The dynamics of an offshore wind turbine in parked conditions: A comparison between simulations and measurements. Wind Energy 2015, 18, 1685–1702. [Google Scholar] [CrossRef]
- Chen, L.; Poulos, H.G. Analysis of pile-soil interaction under lateral loading using infinite and finite elements. Comput. Geotech. 1993, 15, 189–220. [Google Scholar] [CrossRef]
- Randolph, M.F.; Wroth, C.P. Application of the failure state in undrained simple shear to the shaft capacity of driven piles. Geotechnique 1981, 31, 143–157. [Google Scholar] [CrossRef]
- Bhowmik, D.; Baidya, D.K.; Dasgupta, S.P. A numerical and experimental study of hollow steel pile in layered soil subjected to lateral dynamic loading. Soil Dyn. Earthq. Eng. 2013, 53, 119–129. [Google Scholar] [CrossRef]
- Mašín, D. A hypoplastic constitutive model for clays. Int. J. Numer. Anal. Methods Geomech. 2005, 29, 311–336. [Google Scholar] [CrossRef]
- Wu, W.; Kolymbas, D. Numerical testing of the stability criterion for hypoplastic constitutive equations. Mech. Mater. 1990, 9, 245–253. [Google Scholar] [CrossRef]
- Wu, W.; Bauer, E.; Kolymbas, D. Hypoplastic constitutive model with critical state for granular materials. Mech. Mater. 1996, 23, 45–69. [Google Scholar] [CrossRef]
- Gudehus, G. A comprehensive constitutive equation for granular materials. Soils Found. 1996, 36, 1–12. [Google Scholar] [CrossRef]
- Niemunis, A.; Herle, I. Hypoplastic model for cohesionless soils with elastic strain range. Mech. Cohesive-frict. Mater. 1997, 2, 279–299. [Google Scholar] [CrossRef]
- Wroth, C.; Houlsby, G. Soil mechanics-property characterization, and analysis procedures. In Proceedings of the 11th international conference on soil mechanics and foundation engineering, San Francisco, CA, USA, 12–16 August 1985; Volume 1, pp. 1–55. [Google Scholar]
- Powrie, W. The Behavior of Diaphragm Walls in Clay. Ph.D. Thesis, University of Cambridge, Cambridge, UK, 1986. [Google Scholar]
- Al-Tabbaa, A. Permeability and Stress-Strain Response of Speswhite Kaolin. Ph.D. Thesis, University of Cambridge, Cambridge, UK, 1987. [Google Scholar]
- Benz, T. Small-Strain Stiffness and Its Numerical Consequences. Ph.D. Thesis, Universitat Stuttgart, Stuttgart, Germany, 2007. [Google Scholar]
- He, B. Lateral Behaviour of Single Pile and Composite Pile in Soft Clay. Ph.D. Thesis, Zhejiang University, Hangzhou, China, 2016. [Google Scholar]
- Hong, Y.; He, B.; Wang, L.Z.; Wang, Z.; Ng, W.W.C.; Masin, D. Cyclic lateral response and failure mechanisms of semi-rigid pile in soft clay: Centrifuge tests and numerical modelling. Can. Geotech. J. 2017, 54, 806–824. [Google Scholar] [CrossRef]
- IEC. International Standard IEC-61400-1 Wind Turbines–Part 1: Design Requirements, 3rd ed.; International Electrotechnical Commission: Geneva, Switzerland, 2015. [Google Scholar]
- Arany, L.; Bhattacharya, S.; Maconald, J.; Hogan, S.J. Design of monopiles for offshore wind turbines in 10 steps. Soil Dyn. Earthq. Eng. 2017, 92, 126–152. [Google Scholar] [CrossRef] [Green Version]
- Bisoi, S.; Haldar, S. Dynamic analysis of offshore wind turbine in clay considering soil–monopile–tower interaction. Soil Dyn. Earthq. Eng. 2014, 63, 19–35. [Google Scholar] [CrossRef]
- Schroeder, F.C.; Merritt, A.S.; Sørensen, K.W.; Muir Wood, A.; Thilsted, C.L.; Potts, D.M. Predicting monopile behaviour for the Gode Wind offshore wind farm. In Frontiers in Offshore Geotechnics III, Proceedings of the Third International Symposium on Frontiers in Offshore Geotechnics, Oslo, Norway, 10–12 June 2015; CRC Press: Boca Raton, FL, USA, 2015. [Google Scholar]
- Wang, L.Z.; He, B.; Hong, Y.; Guo, Z.; Li, L.L. Field tests of the lateral monotonic and cyclic performance of jet-grouting-reinforced cast-in-place piles. J. Geotech. Geoenviron. Eng. 2015, 141, 06015001. [Google Scholar] [CrossRef]
- Jeanjean, P. Re-assessment of p-y curves for soft clays from centrifuge testing and finite element modeling. In Proceedings of the Offshore Technology Conference, Houston, TX, USA, 4–7 May 2009. [Google Scholar]
- Zhu, B.; Li, T.; Xiong, G.; Liu, J.C. Centrifuge model tests on laterally loaded piles in sand. Int. J. Phys. Model. Geotech. 2016, 16, 160–172. [Google Scholar] [CrossRef]
- Kim, B.T.; Kim, N.K.; Lee, W.J. Experimental load–transfer curves of laterally loaded piles in Nak-Dong River sand. J. Geotech. Geoenviron. Eng. 2004, 130, 416–425. [Google Scholar]
- Jeanjean, P.; Zhang, Y.H.; Zakeri, A.; Gilbert, R.; Senanayake, A.I.M.J. A framework for monotonic p-y curves in clays. In Proceedings of the Society for Underwater Technology Offshore Site Investigation and Geotechnics 8th International Conference, London, UK, 12–14 September 2017. [Google Scholar]
- Wang, M.Y.; Liao, W.M.; Zhang, J.J. A dynamic winkler model to analyze offshore monopile in clayey foundation under cyclic load. Electron. J. Geotech. Eng. 2016, 21, 2029–2041. [Google Scholar]
- Malhotra, S. Selection, design and construction guidelines for offshore wind turbine foundations. In PB Research & Innovation Report; IntechOpen: New York, NY, USA, 2007. [Google Scholar]
- Griffiths, D.V.; Fenton, G.A. Bearing capacity of spatially random soil: The undrained clay Prandtl problem revisited. Géotechnique 2001, 51, 351–359. [Google Scholar] [CrossRef]
- Gong, W.; Juang, C.H.; Martin, J.R. A new framework for probabilistic analysis of the performance of a supported excavation in clay considering spatial variability. Géotechnique 2017, 67, 546–552. [Google Scholar] [CrossRef]
Figure 1.
Schematic diagram of the stress-strain curve of the remaining soil after scour.

Figure 2.
Diagram of: (a) the offshore wind turbine supported on a monopile foundation modelled in this study; (b) three-dimensional finite element mesh and boundary conditions.
Figure 2.
Diagram of: (a) the offshore wind turbine supported on a monopile foundation modelled in this study; (b) three-dimensional finite element mesh and boundary conditions.

Figure 3.
Comparison between measured and computed of: (a) small-strain stiffness; (b) stress-strain relationship of soil element subjected to cyclic triaxial shearing.
Figure 3.
Comparison between measured and computed of: (a) small-strain stiffness; (b) stress-strain relationship of soil element subjected to cyclic triaxial shearing.

Figure 4.
Validation of the numerical model against the centrifuge test reported by Hong et al. [35].
Figure 4.
Validation of the numerical model against the centrifuge test reported by Hong et al. [35].

Figure 5.
Schematic diagram of numerical modelling procedures of: (a) no scour; (b) scour ignoring the stress history effect; (c) scour considering stress history effect. Note: Sd denotes scour depth; γ’ denotes soil effective weight.
Figure 5.
Schematic diagram of numerical modelling procedures of: (a) no scour; (b) scour ignoring the stress history effect; (c) scour considering stress history effect. Note: Sd denotes scour depth; γ’ denotes soil effective weight.

Figure 6.
Distribution of: (a) overconsolidation ratio; (b) undrained shear strength with depth.

Figure 7.
Comparison between the computed and calculated lateral load-deflection relationships at the scour depth of: (a) Sd = 0.2 D; (b) Sd = 0.5 D.
Figure 7.
Comparison between the computed and calculated lateral load-deflection relationships at the scour depth of: (a) Sd = 0.2 D; (b) Sd = 0.5 D.


Figure 8.
Profiles of the bending moment at the scour depth of: (a) Sd = 0.2 D; (b) Sd = 0.5 D.

Figure 9.
Computed soil displacement field and displacement vectors at the scour depth of Sd = 0.2 D: (a) ignoring the stress history effect; (b) considering the stress history effect.
Figure 9.
Computed soil displacement field and displacement vectors at the scour depth of Sd = 0.2 D: (a) ignoring the stress history effect; (b) considering the stress history effect.

Figure 10.
Computed soil displacement field and displacement vectors at the scour depth of Sd = 0.5 D: (a) ignoring the stress history effect; (b) considering the stress history effect.
Figure 10.
Computed soil displacement field and displacement vectors at the scour depth of Sd = 0.5 D: (a) ignoring the stress history effect; (b) considering the stress history effect.

Figure 11.
Comparison of the p-y curves at the scour depth of: (a) Sd = 0.2 D; (b) Sd = 0.5 D. Note: The depth of the p-y curve, z, was measured from the post-scour mudline.
Figure 11.
Comparison of the p-y curves at the scour depth of: (a) Sd = 0.2 D; (b) Sd = 0.5 D. Note: The depth of the p-y curve, z, was measured from the post-scour mudline.

Figure 12.
Distributions of ultimate soil resistance at the scour depth of: (a) Sd = 0.2 D; (b) Sd = 0.5 D.
Figure 12.
Distributions of ultimate soil resistance at the scour depth of: (a) Sd = 0.2 D; (b) Sd = 0.5 D.

Figure 13.
Percentage reduction in ultimate soil resistance.

Figure 14.
Distributions of the initial stiffness of the p-y curves at scour depth of: (a) Sd = 0.2 D; (b) Sd = 0.5 D.
Figure 14.
Distributions of the initial stiffness of the p-y curves at scour depth of: (a) Sd = 0.2 D; (b) Sd = 0.5 D.

Figure 15.
Percentage reduction in the initial stiffness of the p-y curves.


Table 1.
Hypoplastic clay model parameters of kaolin clay.
| Parameter | Value | Remark | ||
|---|---|---|---|---|
| Monotonic response at medium to large strain levels | Critical state friction angle | φ′c | 22° | Powrie [31] |
| Slope of the isotropic NCL in the ln(1 + e)-lnp’ space | λ* | 0.11 | Al-Tabbaa [32] | |
| Slope of the isotropic unloading line in the ln(1 + e)-lnp’ space | κ* | 0.026 | ||
| Position of the isotropic NCL in the ln(1 + e)-lnp’ space | N | 1.36 | ||
| Parameter controlling the proportion of bulk and shear stiffness | ν | 0.1 | Calibrated against cyclic triaxial test | |
| Small-strain stiffness upon various strain reversal | Strain range of soil elasticity | R | 10−4 | Calibrated against Benz’s [33] small-strain stiffness data |
| Path-dependent parameter | mrat | 0.7 | ||
| Strain-dependent parameter 1 | βr | 0.12 | ||
| Strain-dependent parameter 2 | χ | 5 | ||
| Stress-dependent parameter 1 | Ag | 650 | Calibrated against cyclic triaxial test | |
| Stress-dependent parameter 2 | ng | 0.65 | ||
Table 2.
Environmental site conditions [20].
Table 2.
Environmental site conditions [20].
| Parameter | Value |
|---|---|
| Wind speed Weibull distribution shape parameter | 1.8 |
| Wind speed Weibull distribution scale parameter | 8 m/s |
| Reference integral length scale | 18% |
| Turbulence integral length scale | 340.2 m |
| Density of air | 1.225 kg/m3 |
| Significant wave height with 50-year return period | 8.5 s |
| Peak wave height | 6.1 m |
| Water depth | 10 m |
| Density of sea water | 1030 kg/m3 |
Table 3.
Lateral deflection at pile head (m).
| Method | Condition | With No Scour | With Scour (Sd = 0.2 D) | With Scour (Sd = 0.5 D) |
|---|---|---|---|---|
| 3D FE analysis | Ignoring stress history | 0.081 | 0.083 | 0.089 |
| Considering stress history | 0.081 | 0.094 | 0.133 | |
| Percentage increase | - | 13% | 49% | |
| p-y method proposed by Lin et al. [10] | Ignoring stress history | 0.882 | 0.896 | 0.971 |
| Considering stress history | 0.882 | 1.121 | 1.695 | |
| Percentage increase | - | 25% | 75% |
© 2019 by the authors. Licensee MDPI, Basel, Switzerland. This article is an open access article distributed under the terms and conditions of the Creative Commons Attribution (CC BY) license (http://creativecommons.org/licenses/by/4.0/).
Share and Cite
MDPI and ACS Style
He, B.; Lai, Y.; Wang, L.; Hong, Y.; Zhu, R. Scour Effects on the Lateral Behavior of a Large-Diameter Monopile in Soft Clay: Role of Stress History. J. Mar. Sci. Eng. 2019, 7, 170. https://doi.org/10.3390/jmse7060170
AMA Style
He B, Lai Y, Wang L, Hong Y, Zhu R. Scour Effects on the Lateral Behavior of a Large-Diameter Monopile in Soft Clay: Role of Stress History. Journal of Marine Science and Engineering. 2019; 7(6):170. https://doi.org/10.3390/jmse7060170
Chicago/Turabian StyleHe, Ben, Yongqing Lai, Lizhong Wang, Yi Hong, and Ronghua Zhu. 2019. "Scour Effects on the Lateral Behavior of a Large-Diameter Monopile in Soft Clay: Role of Stress History" Journal of Marine Science and Engineering 7, no. 6: 170. https://doi.org/10.3390/jmse7060170
Note that from the first issue of 2016, this journal uses article numbers instead of page numbers. See further details here.