Interdecadal Foredune Changes along the Southeast Australian Coastline: 1942–2014


1
Natural Systems, MidCoast Council, NSW Government, Forster, NSW 2428, Australia
2
School of Earth, Atmosphere and Life Sciences, Faculty of Science, Medicine and Health, University of Wollongong, Wollongong, NSW 2500, Australia
3
School of Geosciences, Faculty of Science, The University of Sydney, Sydney, NSW 2006, Australia
4
College of Earth, Ocean, and Atmospheric Sciences, Oregon State University, Corvallis, OR 97331, USA
*
Author to whom correspondence should be addressed.
J. Mar. Sci. Eng. 2019, 7(6), 177; https://doi.org/10.3390/jmse7060177
Submission received: 31 March 2019
/
Revised: 19 May 2019
/
Accepted: 21 May 2019
/
Published: 4 June 2019
(This article belongs to the Special Issue Coastal Dune Dynamics and Management)
Abstract
:Foredunes are important features within coastal landscapes, yet there are relatively few medium to long-term studies on how they evolve and change over time. This study of Australia’s New South Wales (NSW) foredunes has used 70 years of aerial photographs (or photogrammetry) and recent Light Detection and Ranging (LiDAR) datasets to assess multi-decadal fluctuations in foredune morphology. It was shown that over the past 70 years NSW foredunes have exhibited considerable spatial variation, ranging from accretion/aggradation to recession. Those sites that accreted predominantly extended seaward as new incipient dunes, gaining a maximum of 235 m3 m−1 in sand volume over the study period (for the entire dune system). These sites were commonly found in the north of the state, within closed sediment compartments, and with strong onshore (and alongshore) wind climates present (increasing the potential for aeolian sand transport). Stable foredunes were those that remained within +/− 50 m3 m−1 of their initial volume and managed to recover from the various storm impacts over the study period. The majority of these sites were found within the central to southern half of the state, behind embayed beaches, and within leaky sediment compartments, or those that have estuarine sinks. Finally, those foredunes in recession have retreated landwards and/or have reduced in height or width, and lost up to 437 m3 m−1 of sand volume over the study period. There was no clear spatial trend for these sites; however, generally they were found in compartments that had unusual orientations, had disruptions in longshore drift/cross shore sand delivery (i.e., rocky reefs), or were being impacted by humans (i.e., the installation of river training walls, sand bypassing systems, or coastal management programs). This study has shown that NSW foredunes have undergone substantial recent changes and, by understanding their past history, will provide better insight into how they can be managed into the future.
1. Introduction
Many shorelines around the world have been in a state of continual change over the past century. There are those that have experienced persistent erosion, causing the shoreline to recede [1,2], whereas others that have accreted sand and prograded seaward [2,3,4]. Causes for these behaviours vary with location, but can be related to both short-term impacts (such as storms) and longer-term processes. Longer-term processes include the following: Changes in sea level [5]; onshore transport of offshore reserves of sand [4,6]; changes in modal wave direction and altered efficiency and direction of longshore sediment transport [2,7]; changing supply of sediment from river sources [2,8]; all of which can also be exacerbated by human impact and management (i.e., river mouth groynes/jetties). Effective coastal management requires in-depth understanding and knowledge about both the short-term changes and medium to longer-term trends of local shorelines, in order to assess the risks facing current development and those in the future [9,10].
Sandy shorelines make up approximately 61% of the NSW coastline [11], much of which is backed by dunes and/or foredunes. Foredunes offer a natural buffer to coastal ecosystems and backshore infrastructure, sheltering them from storm impact [12,13]. Foredunes also act as an effective medium to long-term indicator for shoreline behaviour and evolution [9,14]. Previous research on the NSW coast has provided detailed frameworks for understanding the morphological differences between coastal compartments and their evolution on geologic (especially Pleistocene–Holocene) timescales (e.g., Roy et al. [15]; Cowell et al. [16]; Kinsela et al. [17]; and Oliver et al. [18]). These studies have differentiated whether a foredune is part of a prograded, stationary, or receded barrier system. In the case of prograded systems in NSW, the characteristic morpho-stratigraphic features include a sequence of foredune ridges that have regressed seawards over thousands of years. Stationary (or aggradational) barriers have developed vertically and, generally, have formed a single large dune feature. Receded barriers, on the other hand, are smaller sand complexes that are reworked over mud or peat when backed by lagoons, or sand/beach deposits, and can retreat landwards over geologic timescales [15]. Coastal behaviour at intermediate or engineering timescales (1–100 year timescale) is less well understood (especially on larger spatial scales, e.g., entire coastlines) [19], as there is limited time series data that covers this scale [2,20,21]. It is the intermediate scale, however, that is most relevant to coastal planning and management, so uncertainties surrounding shoreline stability at these timescales need to be further examined [20].
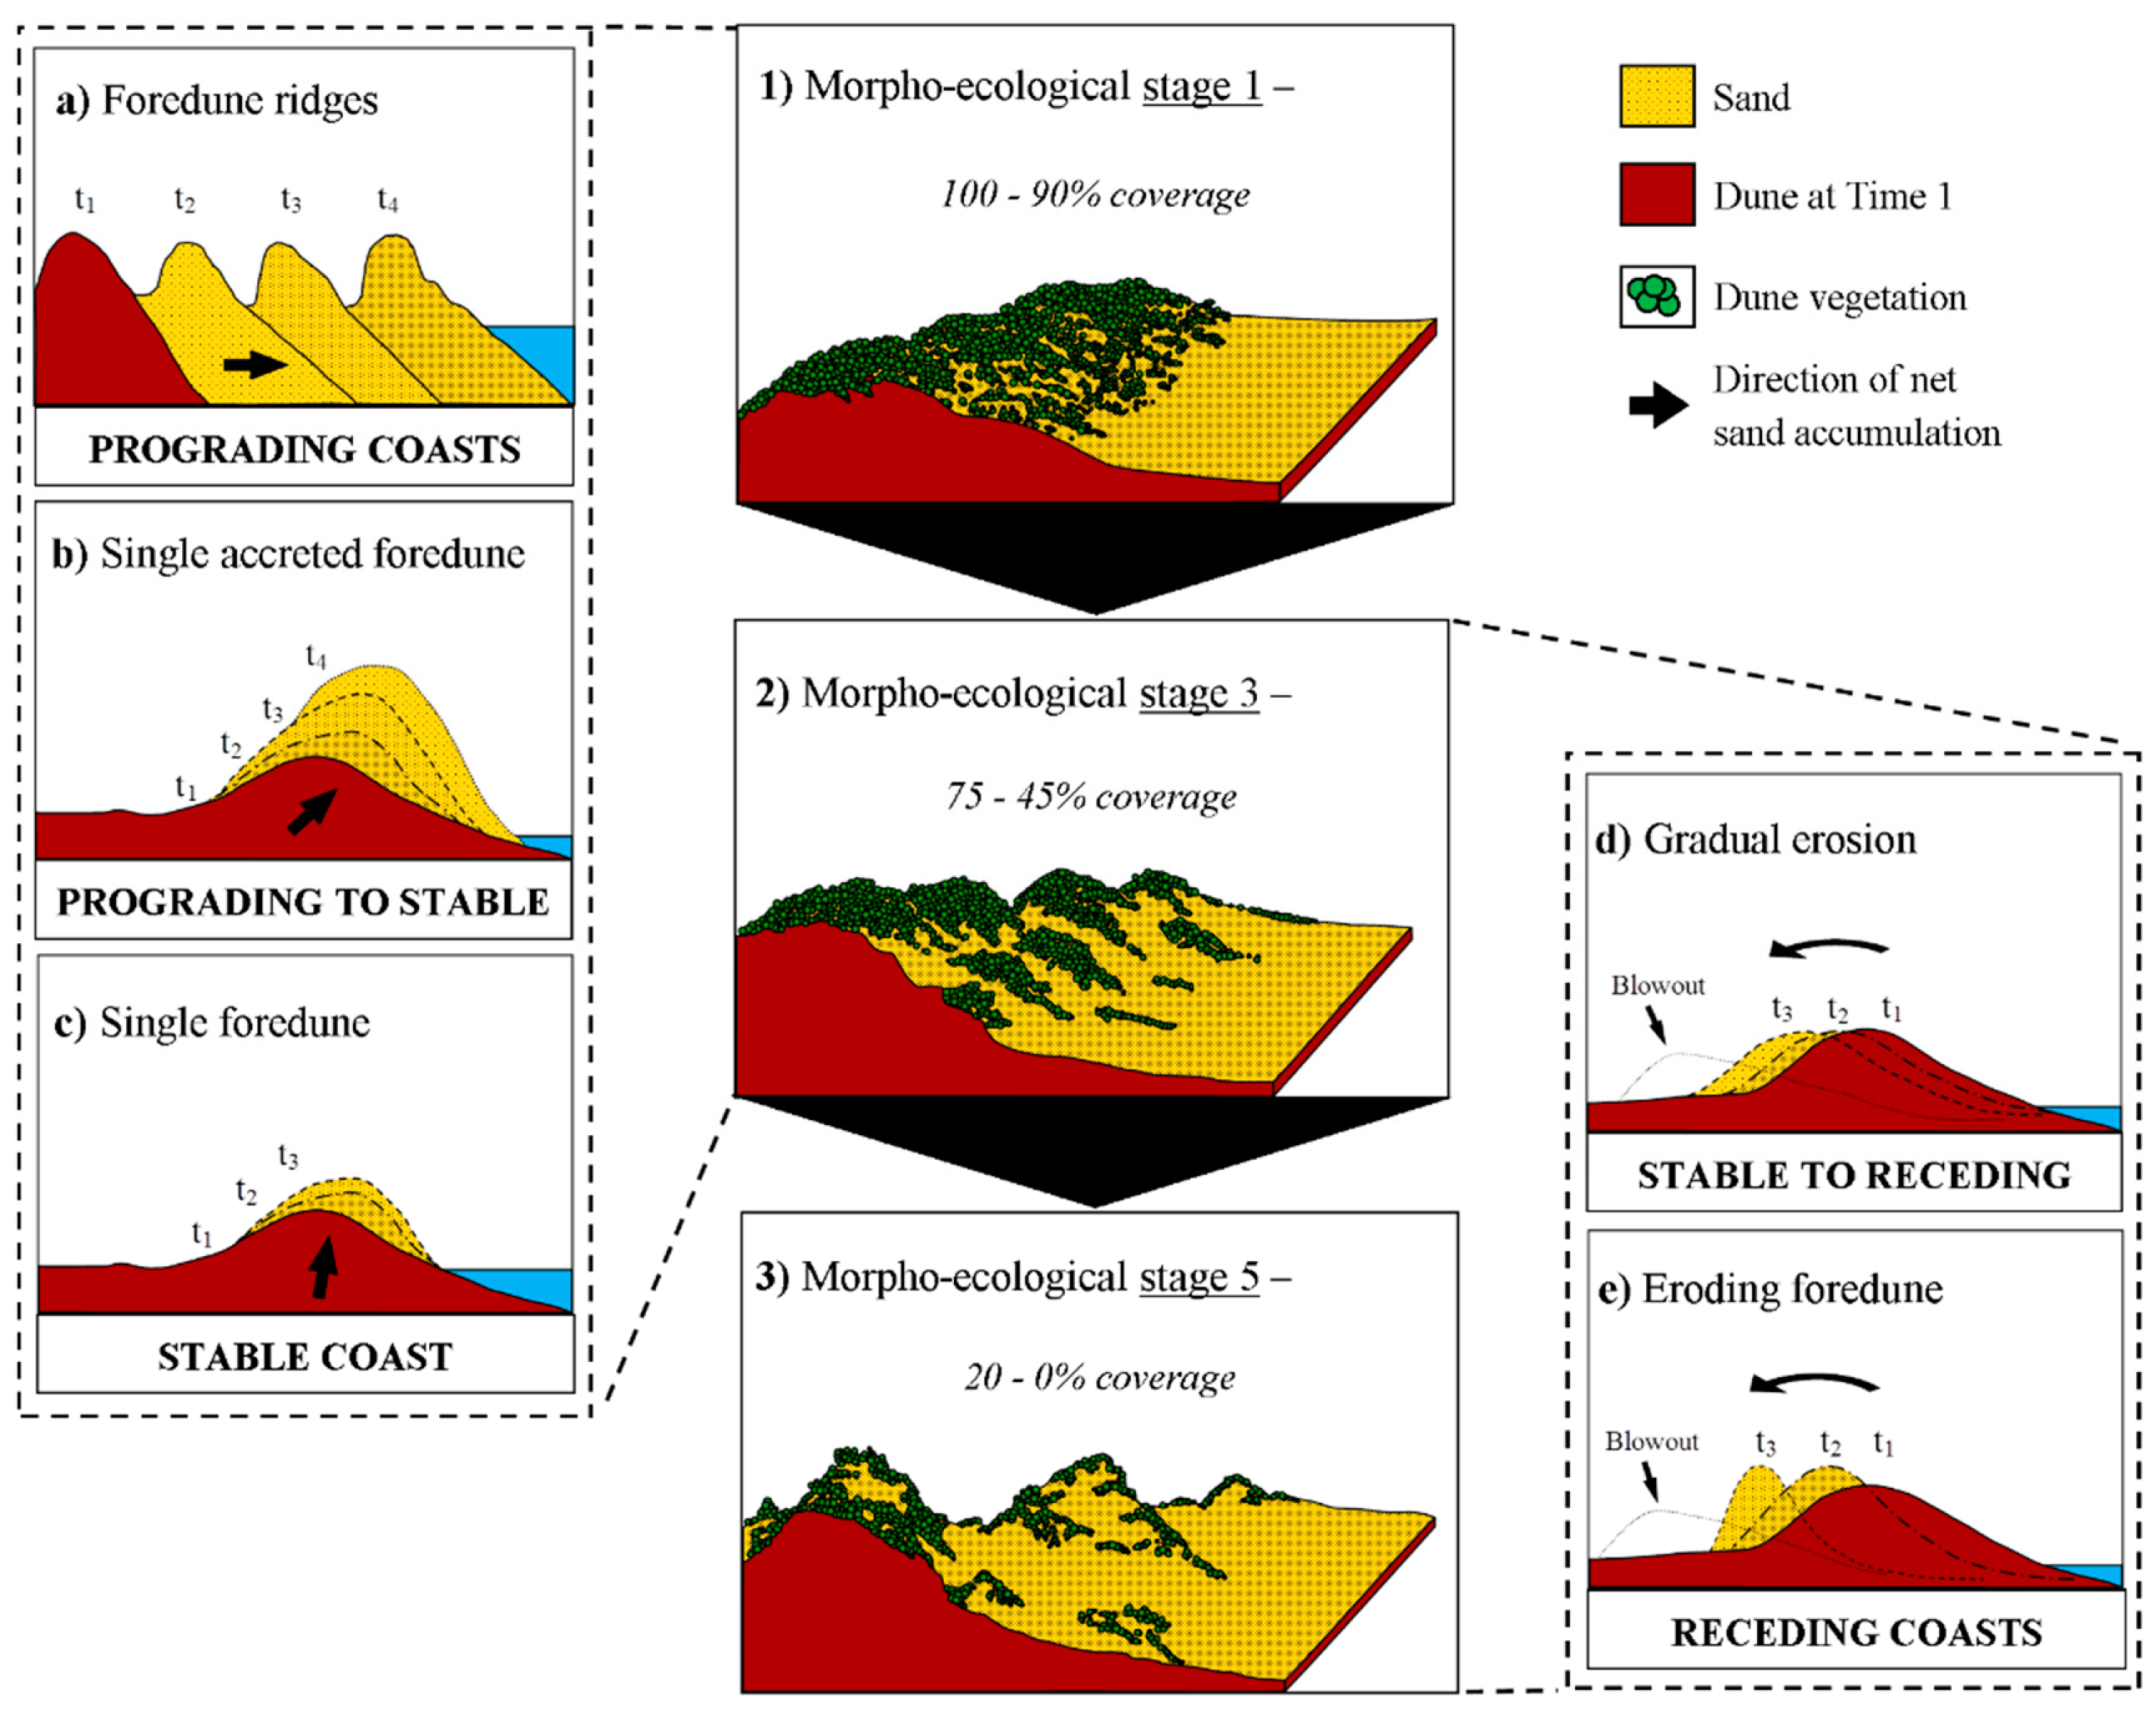
In a review of foredune morphodynamics, Hesp [14] provided a general conceptual model that anticipates the medium to long-term (intermediate timescale) evolution of a shoreline dominated by foredunes (Figure 1). In this model, and illustrated in Figure 1, foredunes may form as several different morph-ecological types, ranging from stage 1 to 5; where stage 1 are those dunes that have 0–100% vegetation cover, to stage 5 which generally have 0–20% vegetation cover (Figure 1, 1–3). In Figure 1, panels 1–3 illustrate the two end extremes for this model, as well as the intermediate stage. Foredunes may remain in one of these stages for most of their existence, or can progress through the “stages” as an evolutionary sequence both temporally and spatially. Sand deposition and re-vegetation can take place (e.g., stage 2 grading to stage 1), or alternatively, aeolian erosion, human impact and modification, reduction in vegetation cover, or wave erosion can occur (e.g., transition from Stage 3 to 4 to 5) [14].
Foredunes that are stage 1, 2, or 3 (Figure 1, 1–2) can either continue to slowly build vertically, build seaward, or both (i.e., aggrading) (Figure 1b–c) or have new foredunes form seaward of them as shoreline progradation takes place (Figure 1a). Stage 3 foredunes can also be found on shorelines experiencing long-term stability, where they fluctuate and experience both erosion and accretion (Figure 1c,d). Finally, stage 3–5 dunes are commonly found on more recessional shorelines, where the foredune may erode gradually, transgress landward, or destabilise and become a blowout (Figure 1d,e) [14,22,23,24,25]. With the exception of one site in central NSW [26], the evolutionary pathways proposed by Hesp [14] are based principally on sediment budget and sea-level scenarios found elsewhere around the world. The focus of this study is on how foredunes have evolved in NSW over interannual to multi-decadal timescales and to test whether they conform to Hesp’s conceptual model (as outlined in Figure 1).
On a global scale, there are only a handful of studies that have looked at regional scale foredune evolution, especially over the intermediate (or engineering) timescale, which include the following: Areas of the USA, Canada, The Netherlands, and Italy [8,23,27,28,29,30]. In NSW, there have been several localised investigations that have looked at foredune (or shoreline) evolution at this timescale, for example, at Bengello Beach (found in the far-south of NSW), a 45-year beach-foredune monitoring program is still being conducted, which has documented how those foredunes have eroded as a result of major storm events (especially 1974/1978) and their subsequent recovery (Thom et al. [31]; McLean et al. [32], Figure 2). Overall, the foredunes at Bengello have recovered to the volume they were prior to the major storm events of 1974–1978, and have remained relatively stable since.
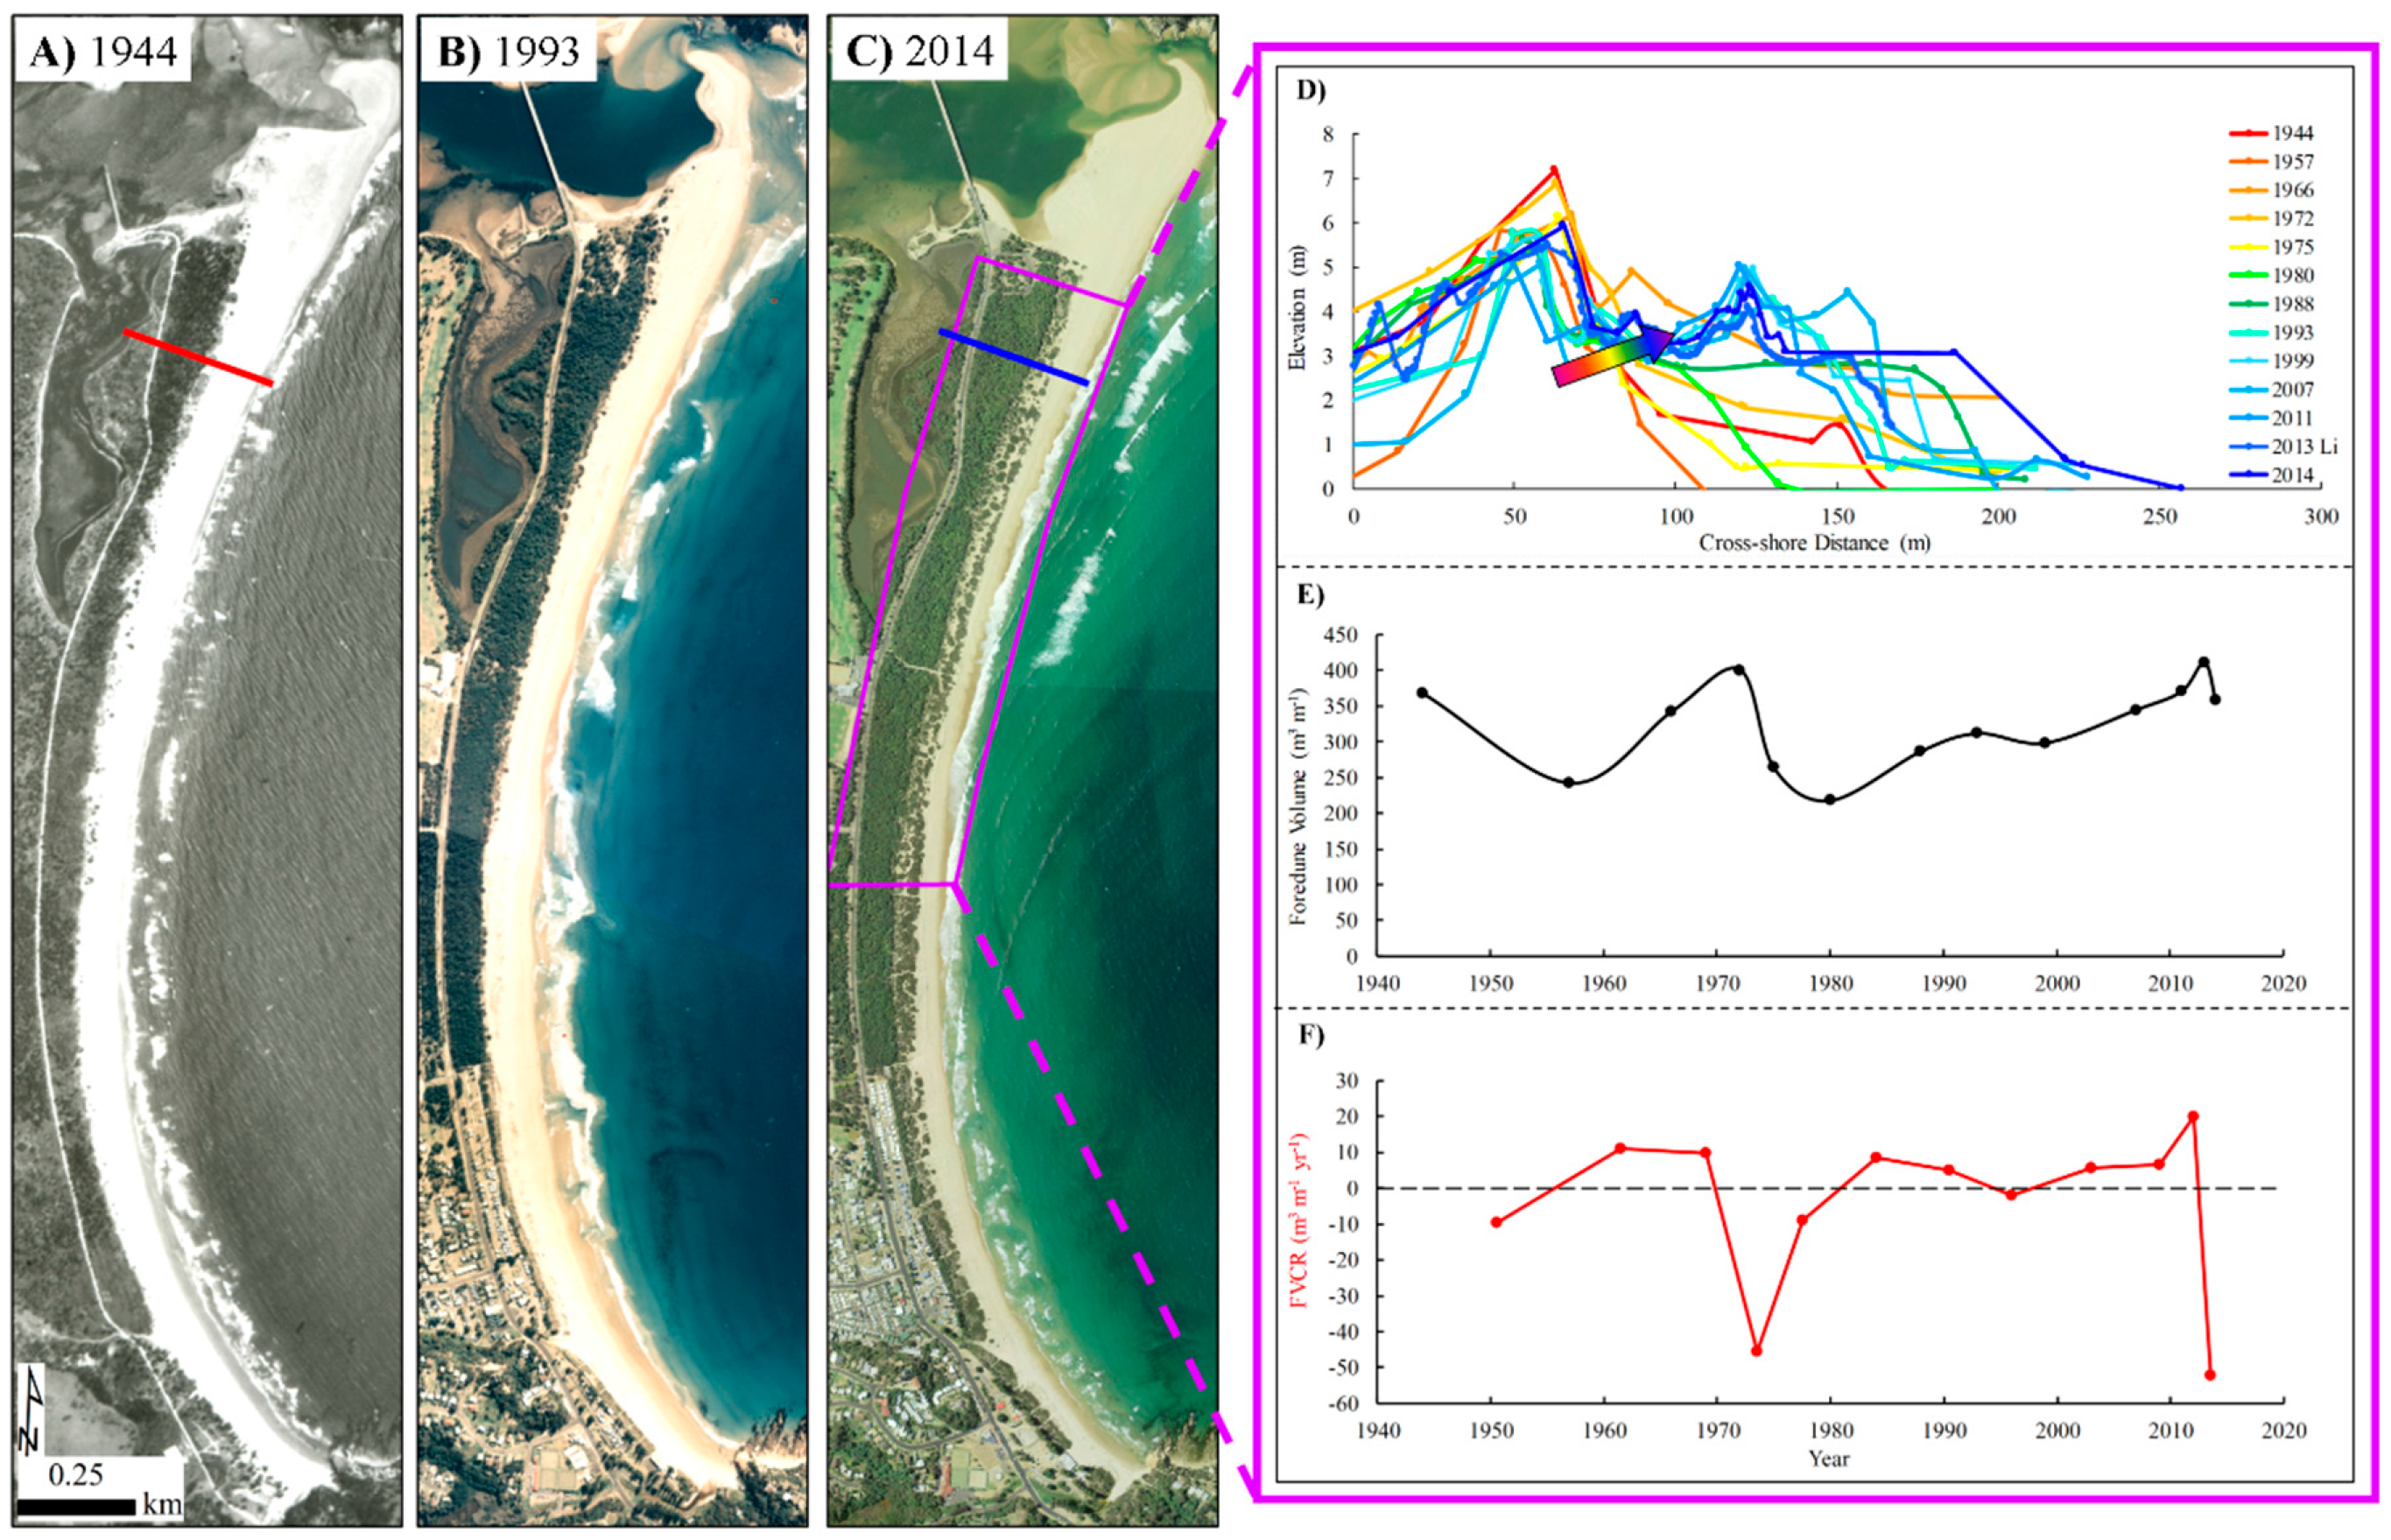
Similarly, the 43-year beach profiling conducted at Narrabeen-Collaroy Beach (in Sydney) has also found the beach-foredune system to be characterised by an apparent state of stability [33,34], responding to storm events (especially 2016) with initial erosion then slow recovery of the beachface and dunes (i.e., the beach and dunes fluctuate in sand volume, with no net erosion or accretion). At Dark Point, in Central NSW, there is a 40-year record of foredune behaviour. This foredune system has been found to have a net (longer-term) accretional trend over that time, with new incipient foredunes forming seaward of the system or an older foredune growing vertically after major storm events ([35], see Figure 3).
Finally, in the northern region of the state, research conducted within the Iluka-Woody Bay compartment has shown two contrasting foredune and shoreline behaviours. Woody Bay has been receding at an accelerated rate in the past 100 years, while Iluka has prograded [2]. It was found, for this area, that fluvial sand supply, a changing wave climate, and associated longshore drift patterns played a crucial role in the behaviour of the foredunes (and shoreline) over the intermediate timescale.
Other than these few systems, there are no other foredune environments in NSW for which intermediate timescale information exists. This is of concern, as this type of data is essential for effective coastline management [9]. This study, therefore, aims to investigate how the NSW foredunes have changed over the past seven decades, to determine whether they have prograded, eroded, or remained stationary, and to test whether they conform to Hesp’s conceptual model (Figure 1, Hesp [14,25]). The second major focus involves evaluating potential controls on beach and foredune behaviour, specifically those related to different wind and wave climates, characteristics of sediment supply and longshore sediment transport, as well as regional sediment compartment dynamics.
Providing this information to coastal managers will offer insight into what and where future research needs to be focused and to better prepare for the varying impacts of climate change. Such things include species invasion, sand supply changes, sea-level rise, and differing patterns of storminess, which all may interact in ways which make coastal protection a real issue, particularly in Australia where the majority of the population lives in the coastal zone [36].
2. Regional Setting
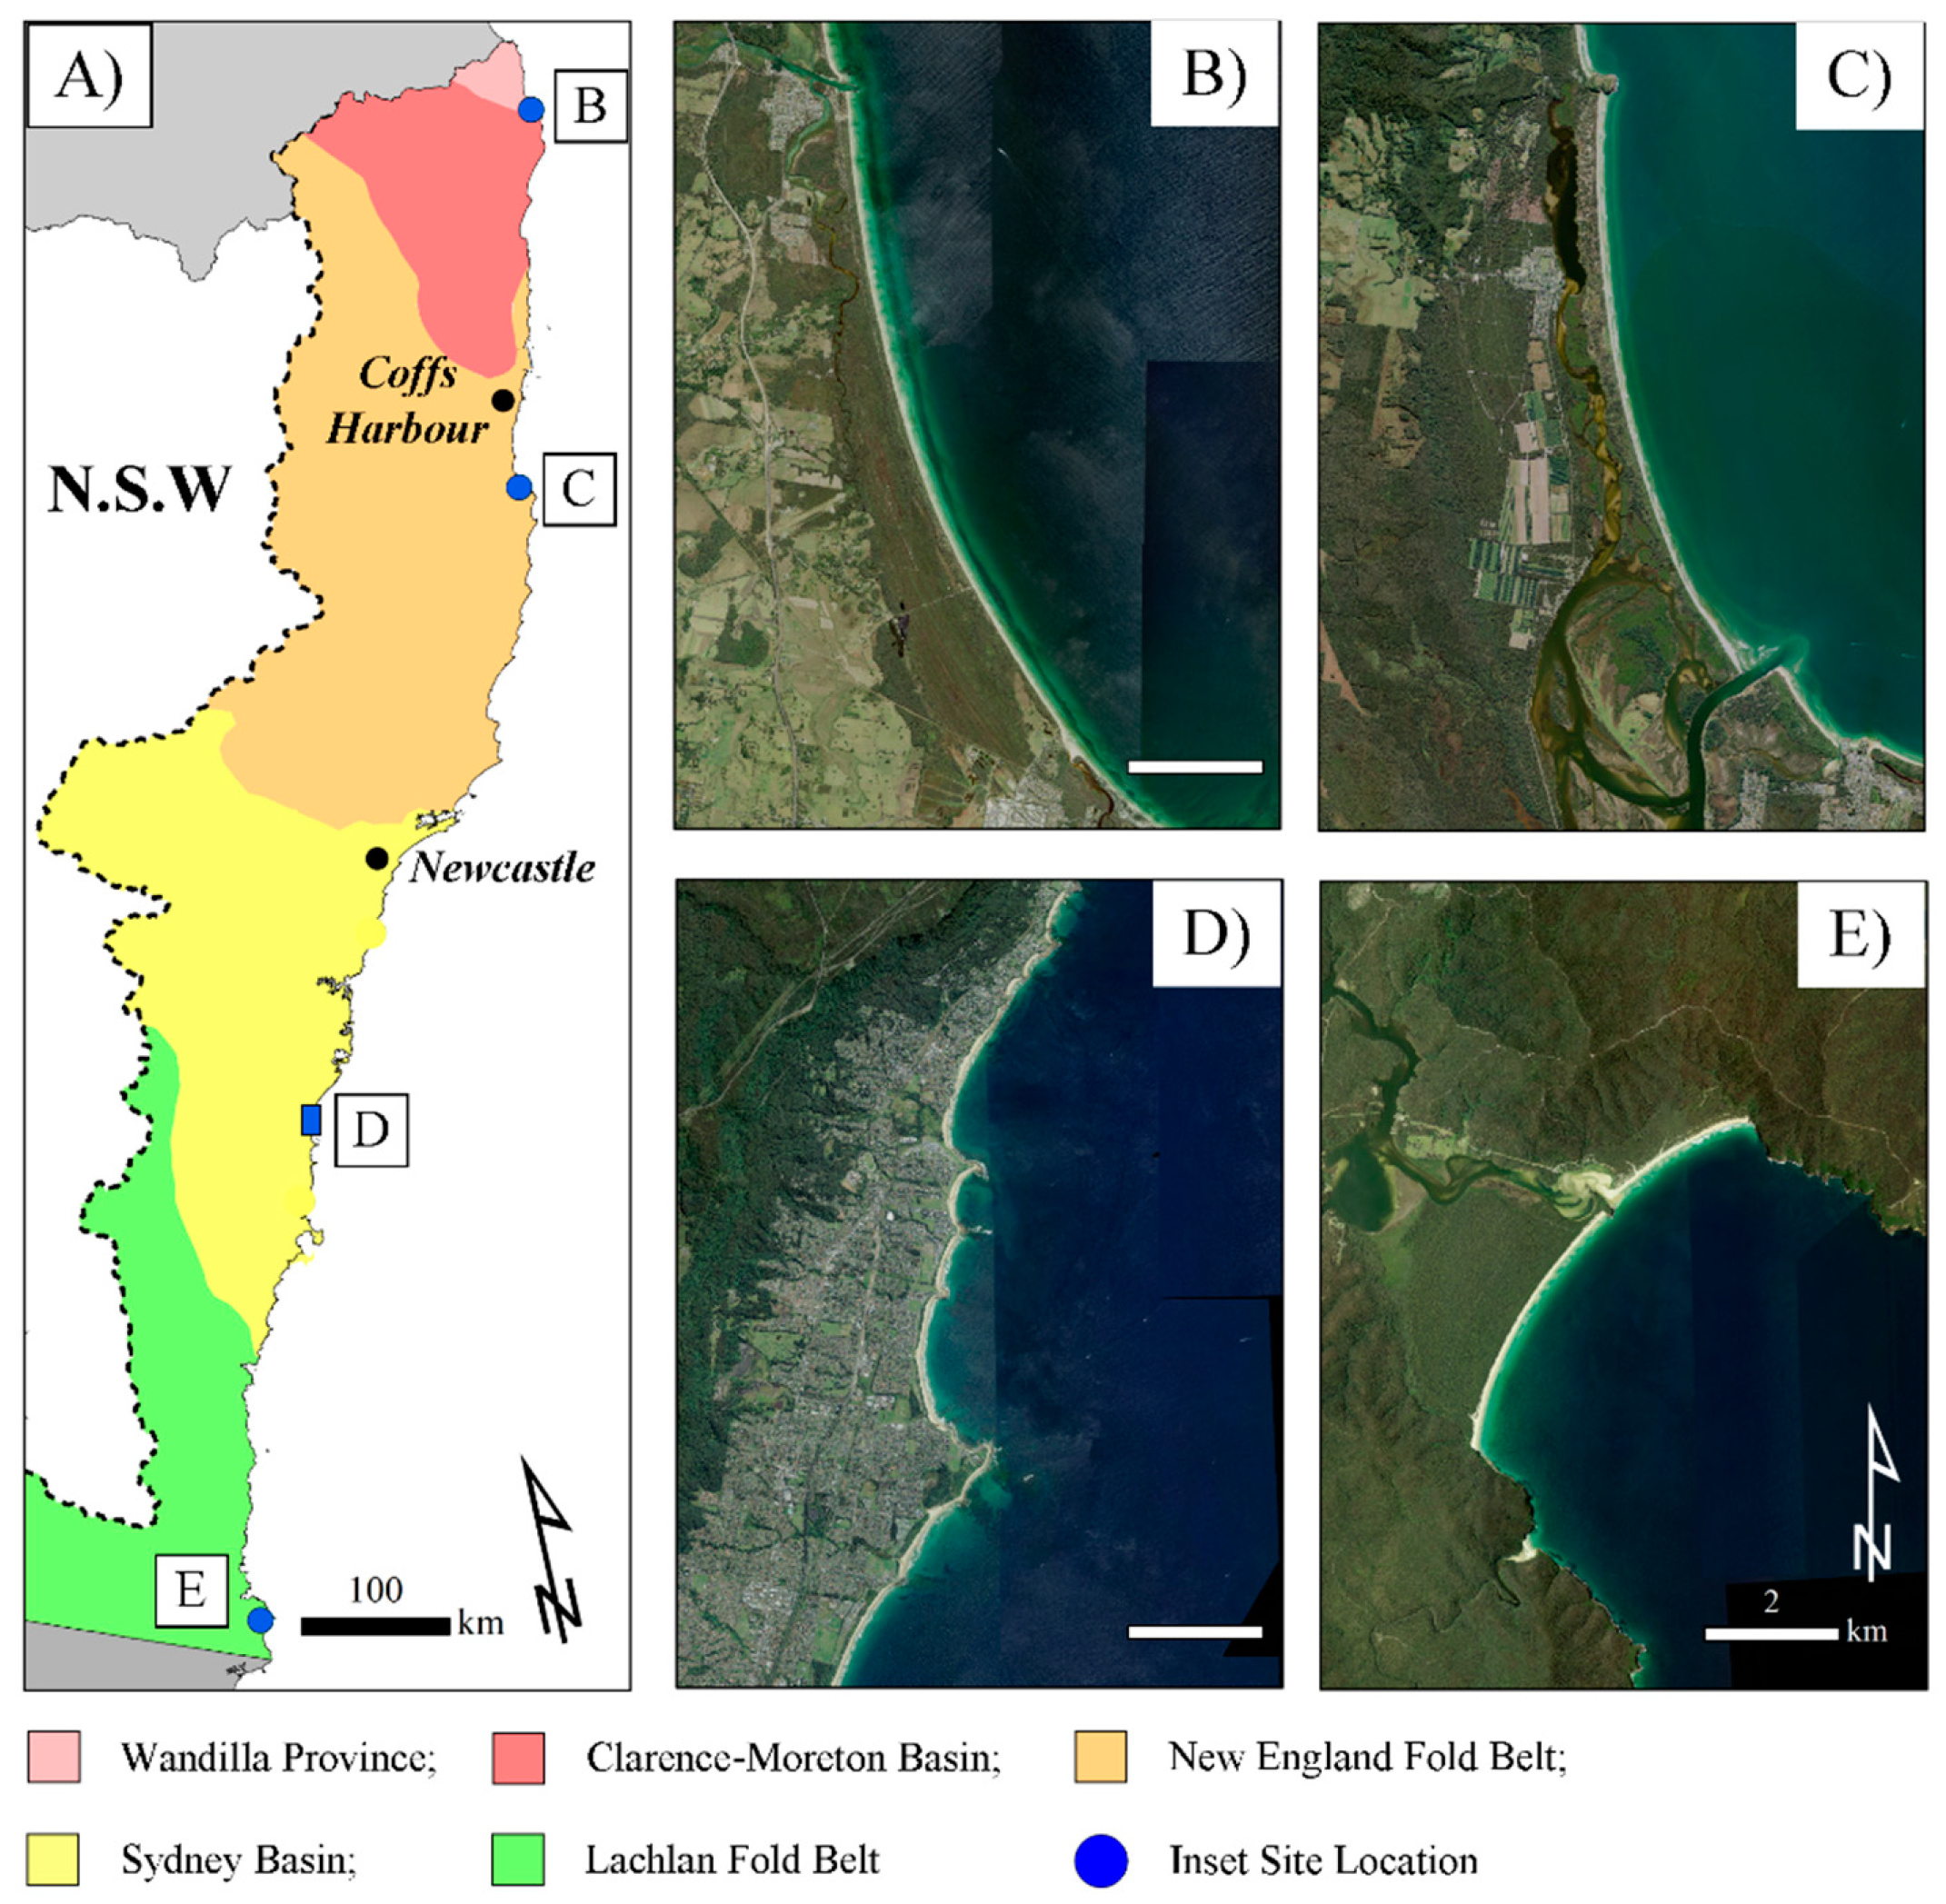
NSW extends from 28–38° S latitude and has an embayed coast where rocky cliff headlands alternate with sandy embayments, which have been infilled to differing degrees with late Pleistocene and Holocene sediment [37]. Along the coast, these sandy embayments vary in nature and size, with differing dimensions of the continental shelf, as well as beach and dune sands forming barrier complexes of varying dimensions, each fronted by an active beach and foredune [38]. The major geological divisions of the NSW coast vary latitudinally, where from north–south they include Wandilla Province, Clarence-Morton Basin, New England Fold Belt, Sydney Basin, and Lachlan Fold Belt (Figure 2 and Table 1).
The NSW geology provides the framework that influenced the evolution of the coast, including the forces controlling the lineation of the continental margin and the basic structural and lithologic patterns of the hinterland [39]. Table 1 and Figure 2 both illustrate the influence this geology has on coastal emabyments along the NSW coast. Generally, it can be divided into two main categories, the ‘subdued’ north coast (transition zone between Coffs Harbour and Newcastle) and the ‘rugged’ south (south of transition zone) [40]. The ‘subdued’ section of the coast refers to areas of low to moderate relief, where embayments are broad and headlands are relatively less obvious (Figure 2B,C). The ‘rugged’ section (predominantly the southern section) refers to areas that have a hilly hinterland directly behind the coast (high relief), more prominent headlands, and bays/embayments are generally small and narrow [20,39] (Figure 2D,E). The varying coastal relief and embayment types along the NSW coast can, therefore, directly be attributed to the differing geology (Figure 2), as well as the subsequent fluvial erosion that has occurred along NSW in the past (predominantly during the Cainozoic).
The various geologic provinces along the coastline have formed distinct sediment compartments, which are a section of coast within which similar processes operate, and they are generally bounded by broad scale structural features that often impede alongshore transport of sediment [19,41]. Sediment compartments also allow scientists to understand the movement of sediment in, out, and around beaches in much more detail [19]. Along the wave-dominated NSW coast, southeasterly swell waves drive a dominant northerly longshore sand transport. This transport of sediment is interrupted, by headlands in the south of the state, and only becomes more continuous in northern NSW, where headlands are less prominent (Figure 2 and Table 1).
In terms of climate, winds are particularly important climatic processes for dunes, as they transport sand from the beach into the foredunes. In the north of the state, ESE–E–SE winds are predominantly responsible for sand drift and potentially dune development. In the central regions of the state, SSE–S winds become more predominant, while in the south, ENE winds are important for aeolian sand transport [42] (Figure 3).
The NSW coast is dominated by east-southeasterly swells, with a mean Ho of 1.6 m (T = 10 s), a microtidal spring tidal range of 1.6 m, and a neap range of 0.7 m [7,43]. The beaches are highly dynamic but intermediate beach types predominate with nearshore bars and frequent rip currents responding to ambient wave conditions (Figure 2) [44,45]. The foredunes are not particularly dynamic, but major storms occasionally reach the dune base and cause substantial scarping and erosion.
To investigate how NSW foredunes have changed over the past seven decades, 26 foredune sites along the NSW coast were analysed (Figure 3, Table 2). Selection of sites for detailed study was undertaken in order to investigate foredunes that form part of three Holocene barrier types, prograded, stationary, and receded types. Appropriate beach-dune systems were chosen from the four regional geologic provinces that make up the NSW coast, with representative examples of two extremes of dune modification (no modification, and highly modified dunes) (see Table 2). Six case study foredune sites have been examined in detail and were selected from each of the northern, central, and southern areas of the state to cover a suitable spatial range (Figure 3A–F). These sites were also selected to represent the various foredune evolution behaviours illustrated in Figure 1.
3. Materials and Methods
3.1. Data Collection—Topographic Data
Airborne topographic LiDAR data was acquired from flights conducted along the entire NSW coastline between 17 December 2009 and 14 September 2014. These surveys were part of a government “Coastal capture program”, coordinated by the state department Land and Property Information (LPI) (Table 2), and is the data that formed the basis of an ecomorphological characterization of dune topography and vegetation described by Doyle and Woodroffe [46]. The LiDAR elevation data uses the horizontal datum, GDA94 (Geocentric Datum of Australia, 1994), and the vertical datum, AHD (Australian Height Datum). LPI have reported a vertical and horizontal accuracy of ±0.3 m and ±0.8 m, respectively.
The topographic photogrammetric data used in this study was acquired from the Office of Environment and Heritage (OEH) (state government), using aerial photographs taken between 1941 and 2014 (Table 1). Photogrammetric analysis was undertaken using a Wild Aviolyt AC1 stereo analytical plotter, operated by an experienced photogrammetrist. This equipment is commonly used in topographic mapping and enables high resolution digital topographic data to be obtained from stereo pairs of aerial photograph diapositives [47]. Horizontal and vertical errors post-1960 aerial imagery are ±0.5 m and ±0.2 m, respectively. For pre-1960 imagery, errors are generally higher and can range from ±1–1.5 m in the horizontal and ±0.7 m in the vertical (due to lack of camera calibration) [9]. It should be noted that, in areas of dense dune vegetation, errors may be locally greater than those indicated. In these areas, the photogrammetrist will generally continue along the elevation profile until the ground is visible, so there can be sections of unknown height. This was acknowledged in this analysis and will be noted if significant sections of unknown height are apparent at any one beach-dune location. More specific details of these methods are given in Hanslow et al. [48] and Hanslow [9].
Table 1 summarises the beaches included in this study, which were classified in terms of barrier type (green indicates prograded, orange is stationary, and red is receded) (classification based on A. Short’s NSW Barrier Database, which was derived from field and aerial photo investigations). Table 1 also summarises the geographic region and history of dune modification (year/s of major dune management and/or sand mining), the dates of aerial photographs used in photogrammetric analysis (ordered most recent to oldest) (see Appendix A Table A1 for more detailed information on photography dates associated with the photogrammetry), as well as the survey date of the LiDAR data and acquired historic aerial photography used for each study site. Historic aerial photographs of selected study sites were acquired from OEH, which were scanned and georeferenced for use in delineating foredune areas.
3.2. Foredune Evolution Data and Analysis
For each of the twenty-six beaches (Table 1), geomorphic data was extracted to generate sand supply and accumulation rate proxies over a decadal timeframe. Due to the highly variable nature of most NSW beach environments [33], and the complexity and potential bias shown for more commonly used shoreline change proxies (i.e., high water line etc.) [49,50,51], a less variable and more reliable coastal trend indicator, foredune volume, was used to create the sand supply and/or accumulation rates used to analyse long-term trends along the NSW coastline [9].
In developing spatially varying coastal trend proxies, the raw elevation data was first interpolated into surfaces from which the proxies were extracted. The native photogrammetric data is a series of point profiles, which were used to make triangulated irregular network (TIN) models for each year there is data, on each study beach (see Table 1). Similarly, the airborne LiDAR data, were interpolated into a TIN model (following the methods of Doyle and Woodroffe [44]). For Brunswick Heads Beach (North) (Table 2), for example, there were 18 TIN surfaces produced using the photogrammetry (18 sets of photogrammetric observations) and a single TIN surface created using the LiDAR (only a single LiDAR scan).
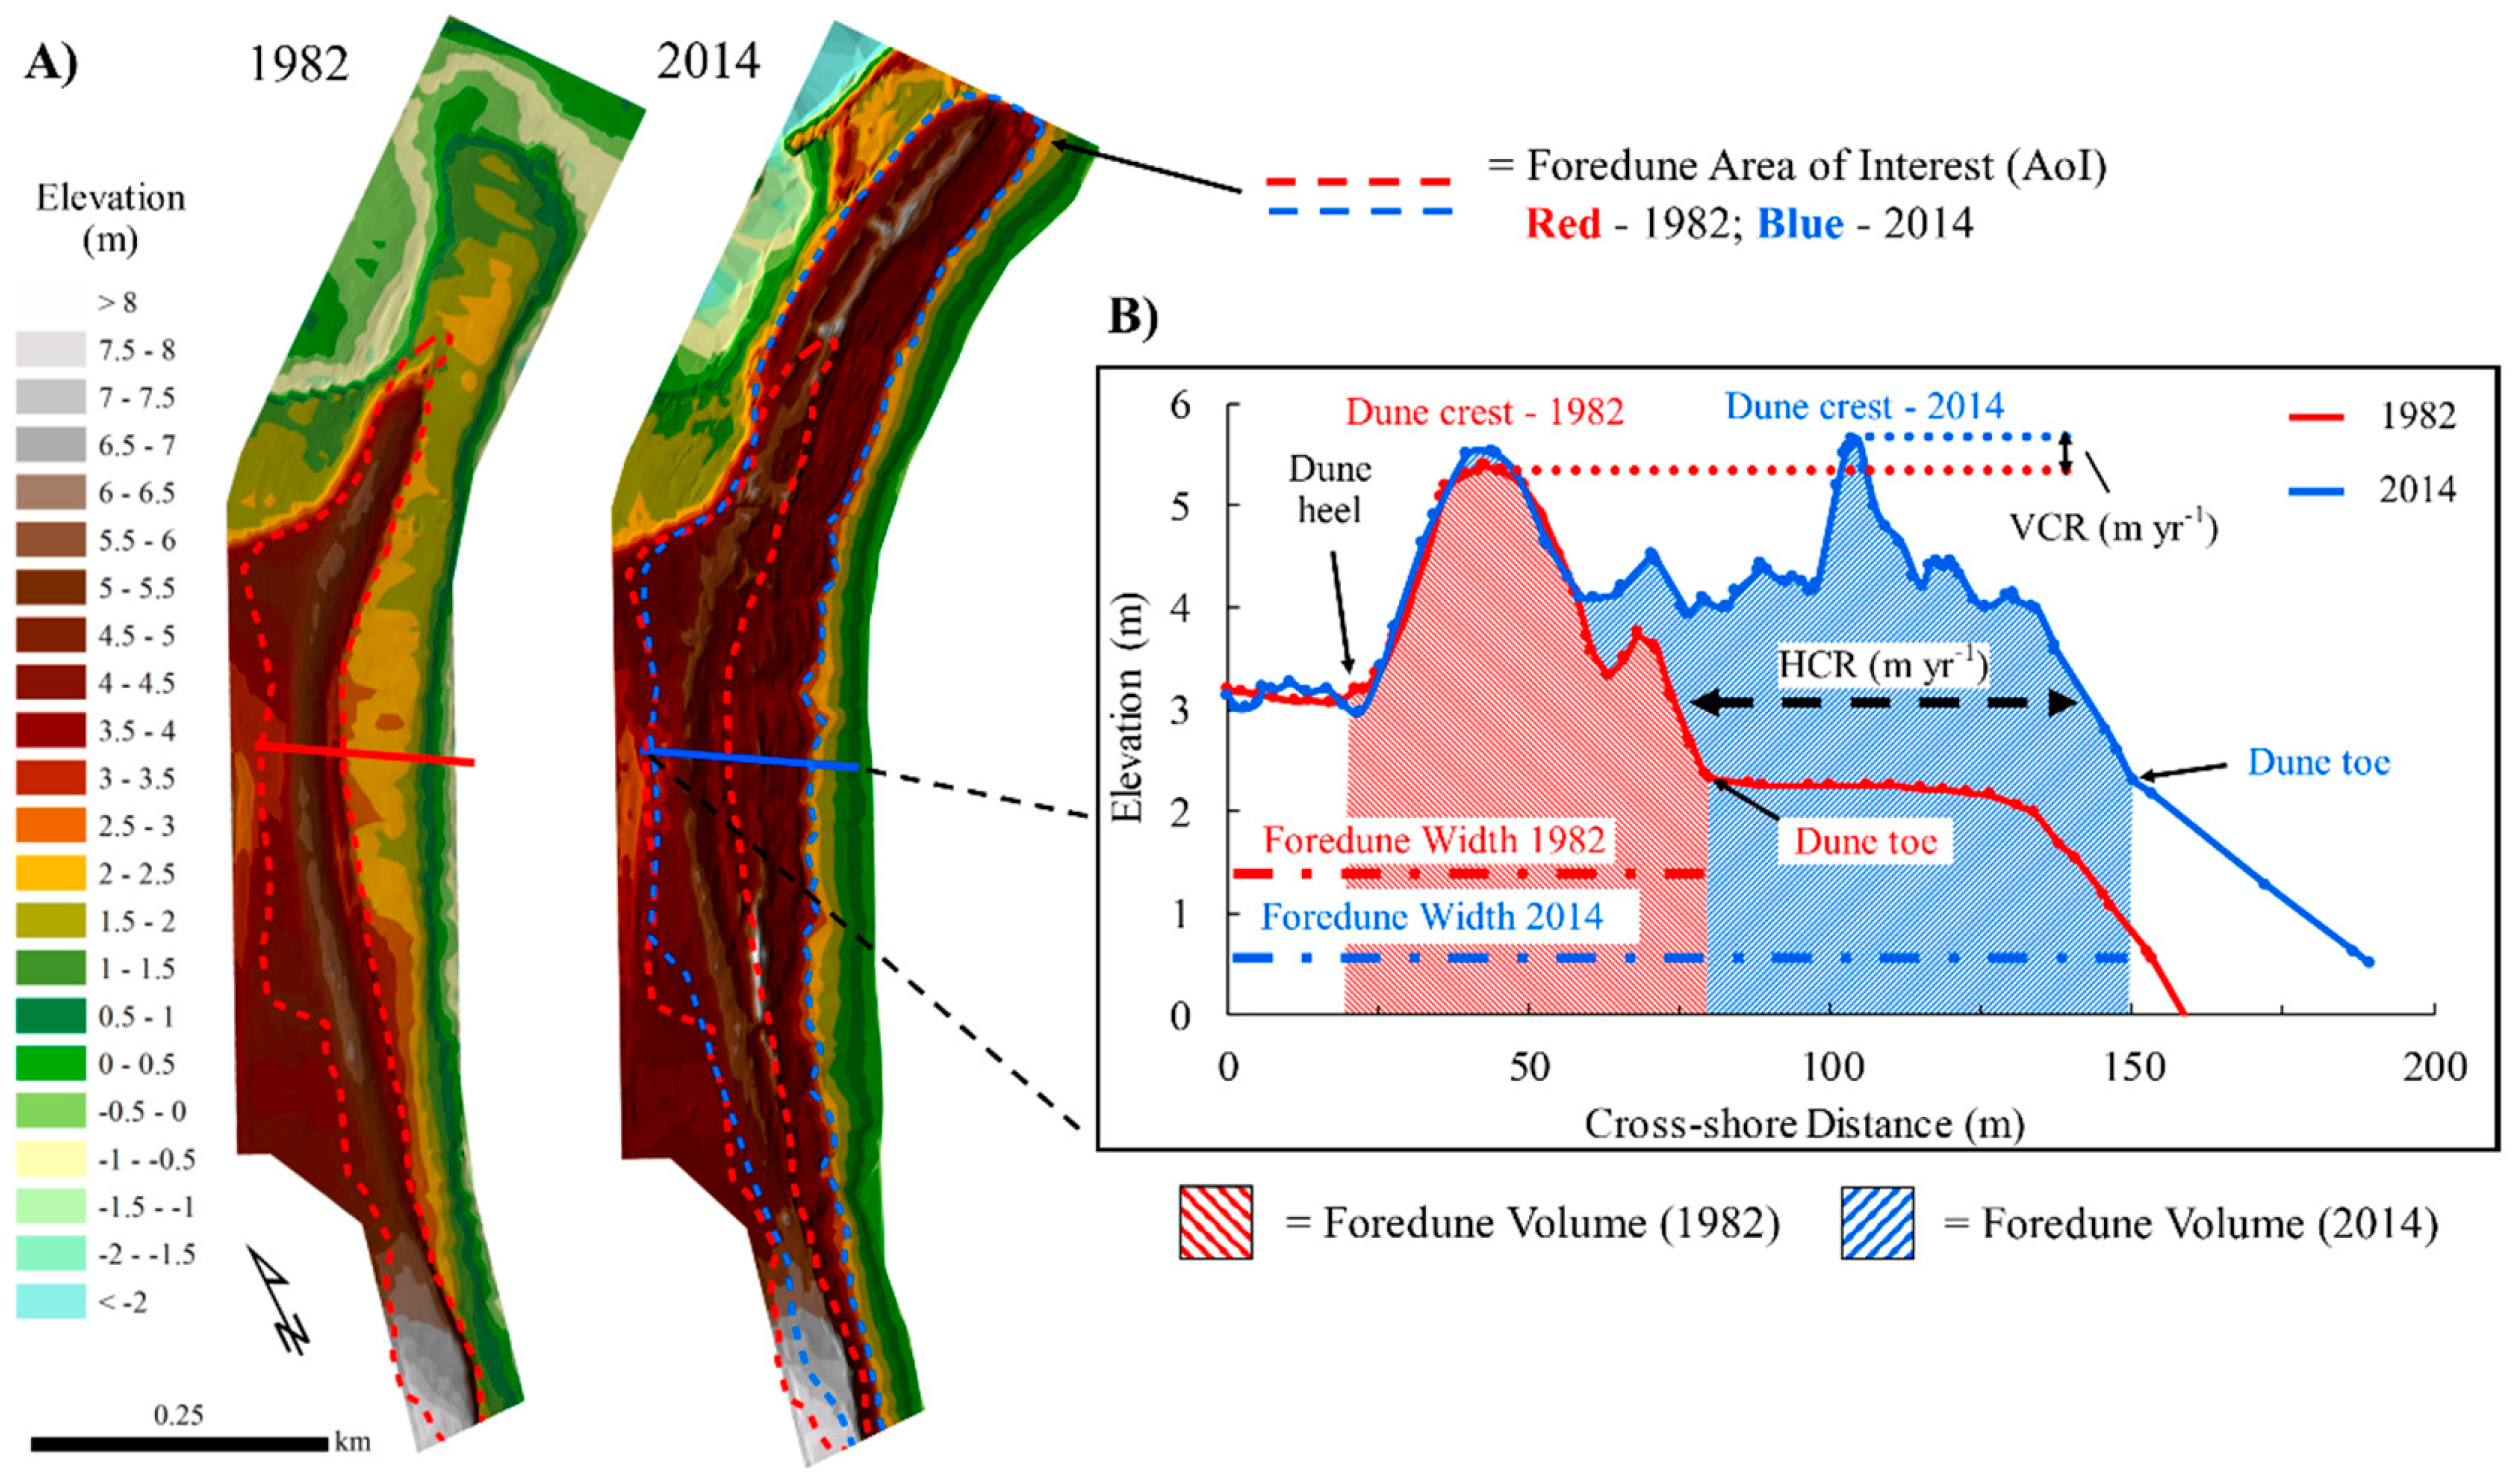
TINs were selected as the most appropriate interpolation method, as they constrain elevation at each data point, to avoid difficulties with addressing uncertainties that are common with other interpolation models [52,53], and TIN surface structure is known to preserve the original data, making it much easier to distinguish dune morphologic features (i.e., foredune toe, width, etc.) [54] (see Figure 4A). TINs also possess a comparatively low computational cost, and the associated accuracy of derived elevation is high and not significantly different (in terms of accuracy) from other interpolation methods ( e.g., kriging [54]).
Using the interpolated TIN surfaces (derived from both the topographic (stereo) photogrammetry and airborne LiDAR) quantitative morphometric parameters were extracted that describe NSW foredune morphology (e.g., foredune volume, width, crest height, etc.; see Figure 3 for definitional sketch of these morphometrics). The method to extract morphometric variables from the derived TIN models follows a very similar procedure to that demonstrated in Doyle and Woodroffe ([46]), but reapplied to each year there is elevation data available. A foredune “Area of Interest” (AoI) is outlined for each year, using the TIN and available aerial imagery (Figure 3A). Due to the photogrammetric precision, this foredune AoI includes both the established and incipient foredune features for the entire beach (and any additional dune features developed over the study period, e.g., a new incipient foredune). The foredune was then segmented into smaller sections along the beach, allowing for investigation of alongshore variability. These steps were repeated for each year of data. Morphometric parameters are then extracted from these layers (e.g., foredune volume, width, crest height etc.) using both the entire dune AoI, as well as each dune-segment (segment width of a meter) (Figure 3B). A semi-automated model was produced in ArcMap to automate some of these analyses. Parameters were then tabulated and exported for further analysis.
Several coastal trend proxies were derived in an attempt to integrate the main physical processes of sand availability and dune evolution (at a decadal timescale) [3,8,22,55,56,57,58]. The foredune volume change rate (FVCR) (m3 m−1 year−1) is the rate at which each foredune at a given study site increases in sand volume (aggrades/progrades) (positive rate), loses sand volume (recedes) (negative rate), or maintains a similar volume (stable) (zero or close to zero), over time. This rate was calculated from the volume of each foredune AoI digitised (for each year there is topographic data), which extended from the foredune toe (start of incipient foredune) to the foredune heel (topographic low landward of the established foredune crest) and a base height set to 0 m AHD (Australian Height Datum) (see Figure 3). The AoI, in most cases, covers the entire beach length. However, for some locations, data was not available for the entire system. The sites with limited data are indicated in Table 1 and are shown with either a “Nth or Sth” (or both) title. This refers to where the data is constrained to, geographically. This rate therefore reflects the decadal spatially varying net sand supply to the foredune over the past seven decades.
The horizontal change rate (HCR) (m year−1) was calculated using the foredune width change over time. This was calculated using the AoI delineated for each site, and so represents an averaged measure of width along each AoI (which generally reflects the entire beach, but, in some cases, could only be a section. See above). This parameter indicates the rate at which the present foredune increased (positive rate), decreased (negative), or remained with the same width over the study period. Finally, a foredune vertical change rate was generated (VCR) (m year−1), which represented the average increase (positive rate) or decrease (negative rate) in maximum dune crest elevation (Figure 3B).
The absolute foredune volume change and overall foredune volume change rate (FVCR) were used to determine the type of evolution the foredune systems have undergone; prograding, stable, or receding (Figure 1). Those with a positive FVCR higher than 1.5 m3 m−1 yr−1 were deemed prograding systems, while those with a FVCR between 1.5 to −1.5 m3 m−1 yr−1 were considered stable (due to the upper error margin of the photogrammetry being ±1.5m) [9,48]. Finally, the foredunes that were found to have a FVCR lower than −1.5 m3 m−1 y−1 were considered to be receding, because they are beyond the error threshold.
The period 1941 to 2014 is an appropriate timeframe to investigate the evolution of NSW foredunes (i.e., FVCR, HCR, VCR etc.) because the largest East Coast cyclones (or Extratropical cyclones, also locally known as ‘east coast low’ (ECL) storms) struck the NSW coast in 1974 and 1978. The 1974 event consisted of two separate, but closely spaced, events (25–26 May and 8–14 June), while the 1978 storms involved four individual events (18–20 March, 31 May–2 June, 15–16 June, and 18–21 June). These storms severely eroded many of the foredunes along the NSW coast, with their erosion scarps still visible in many locations, and have subsequently initiated an incipient foredune development cycle in the years following the storms [20,31,59,60,61]. Dune recovery in NSW has been found to take place on timescales of years (up to 10 years) [32], whereas this decadal scale measure is representative of longer term dune evolution (as shown in [8]).
3.3. Coastal Wind Data and Analysis
The wind analysis was derived from a 44-year (on average; upper range was 70 years, lower was 6 years) wind record (speed and direction) from the Bureau of Meteorology (BOM) (see Doyle [40]). The wind data, measured in meters per second (m. s−1), was analysed to obtain sand roses for each study location, so aeolian sediment drift potentials and direction [62] could be compared.
The Fryberger and Dean (1979) method was used to determine aeolian drift potential and direction (i.e., resultant drift potential (RDP) and resultant drift direction (RDD)), which is a widely used method for aeolian environments (see [63,64]). The method makes use of historic wind records (speed and direction) to calculate the potential for sand drift, using several classes of wind velocity and direction. The Fryberger and Dean (1979) method expresses the potential for sediment transport (drift potential (DP)) in vector units (v.u) [62,63].
Sand roses were made for only two kinds of approach winds, onshore winds and onshore plus alongshore (or oblique) winds, and drift potentials were calculated from those winds only (i.e., offshore winds were not included in DP and RDP calculations) (Figure 3). The onshore winds were those that approached the study site between 15° and 165° (assuming the foredune is lying along an axis of 0°, if not, this was adjusted to the orientation of the beach) and the alongshore winds were those approaching between 0° and 15° and 165° and 180° to the foredune [64,65]. The rest of the methodology for the wind analysis follows the same steps taken by Miot da Silva and Hesp [64].
4. Results
4.1. Changes in Foredune Morphology–State-Wide
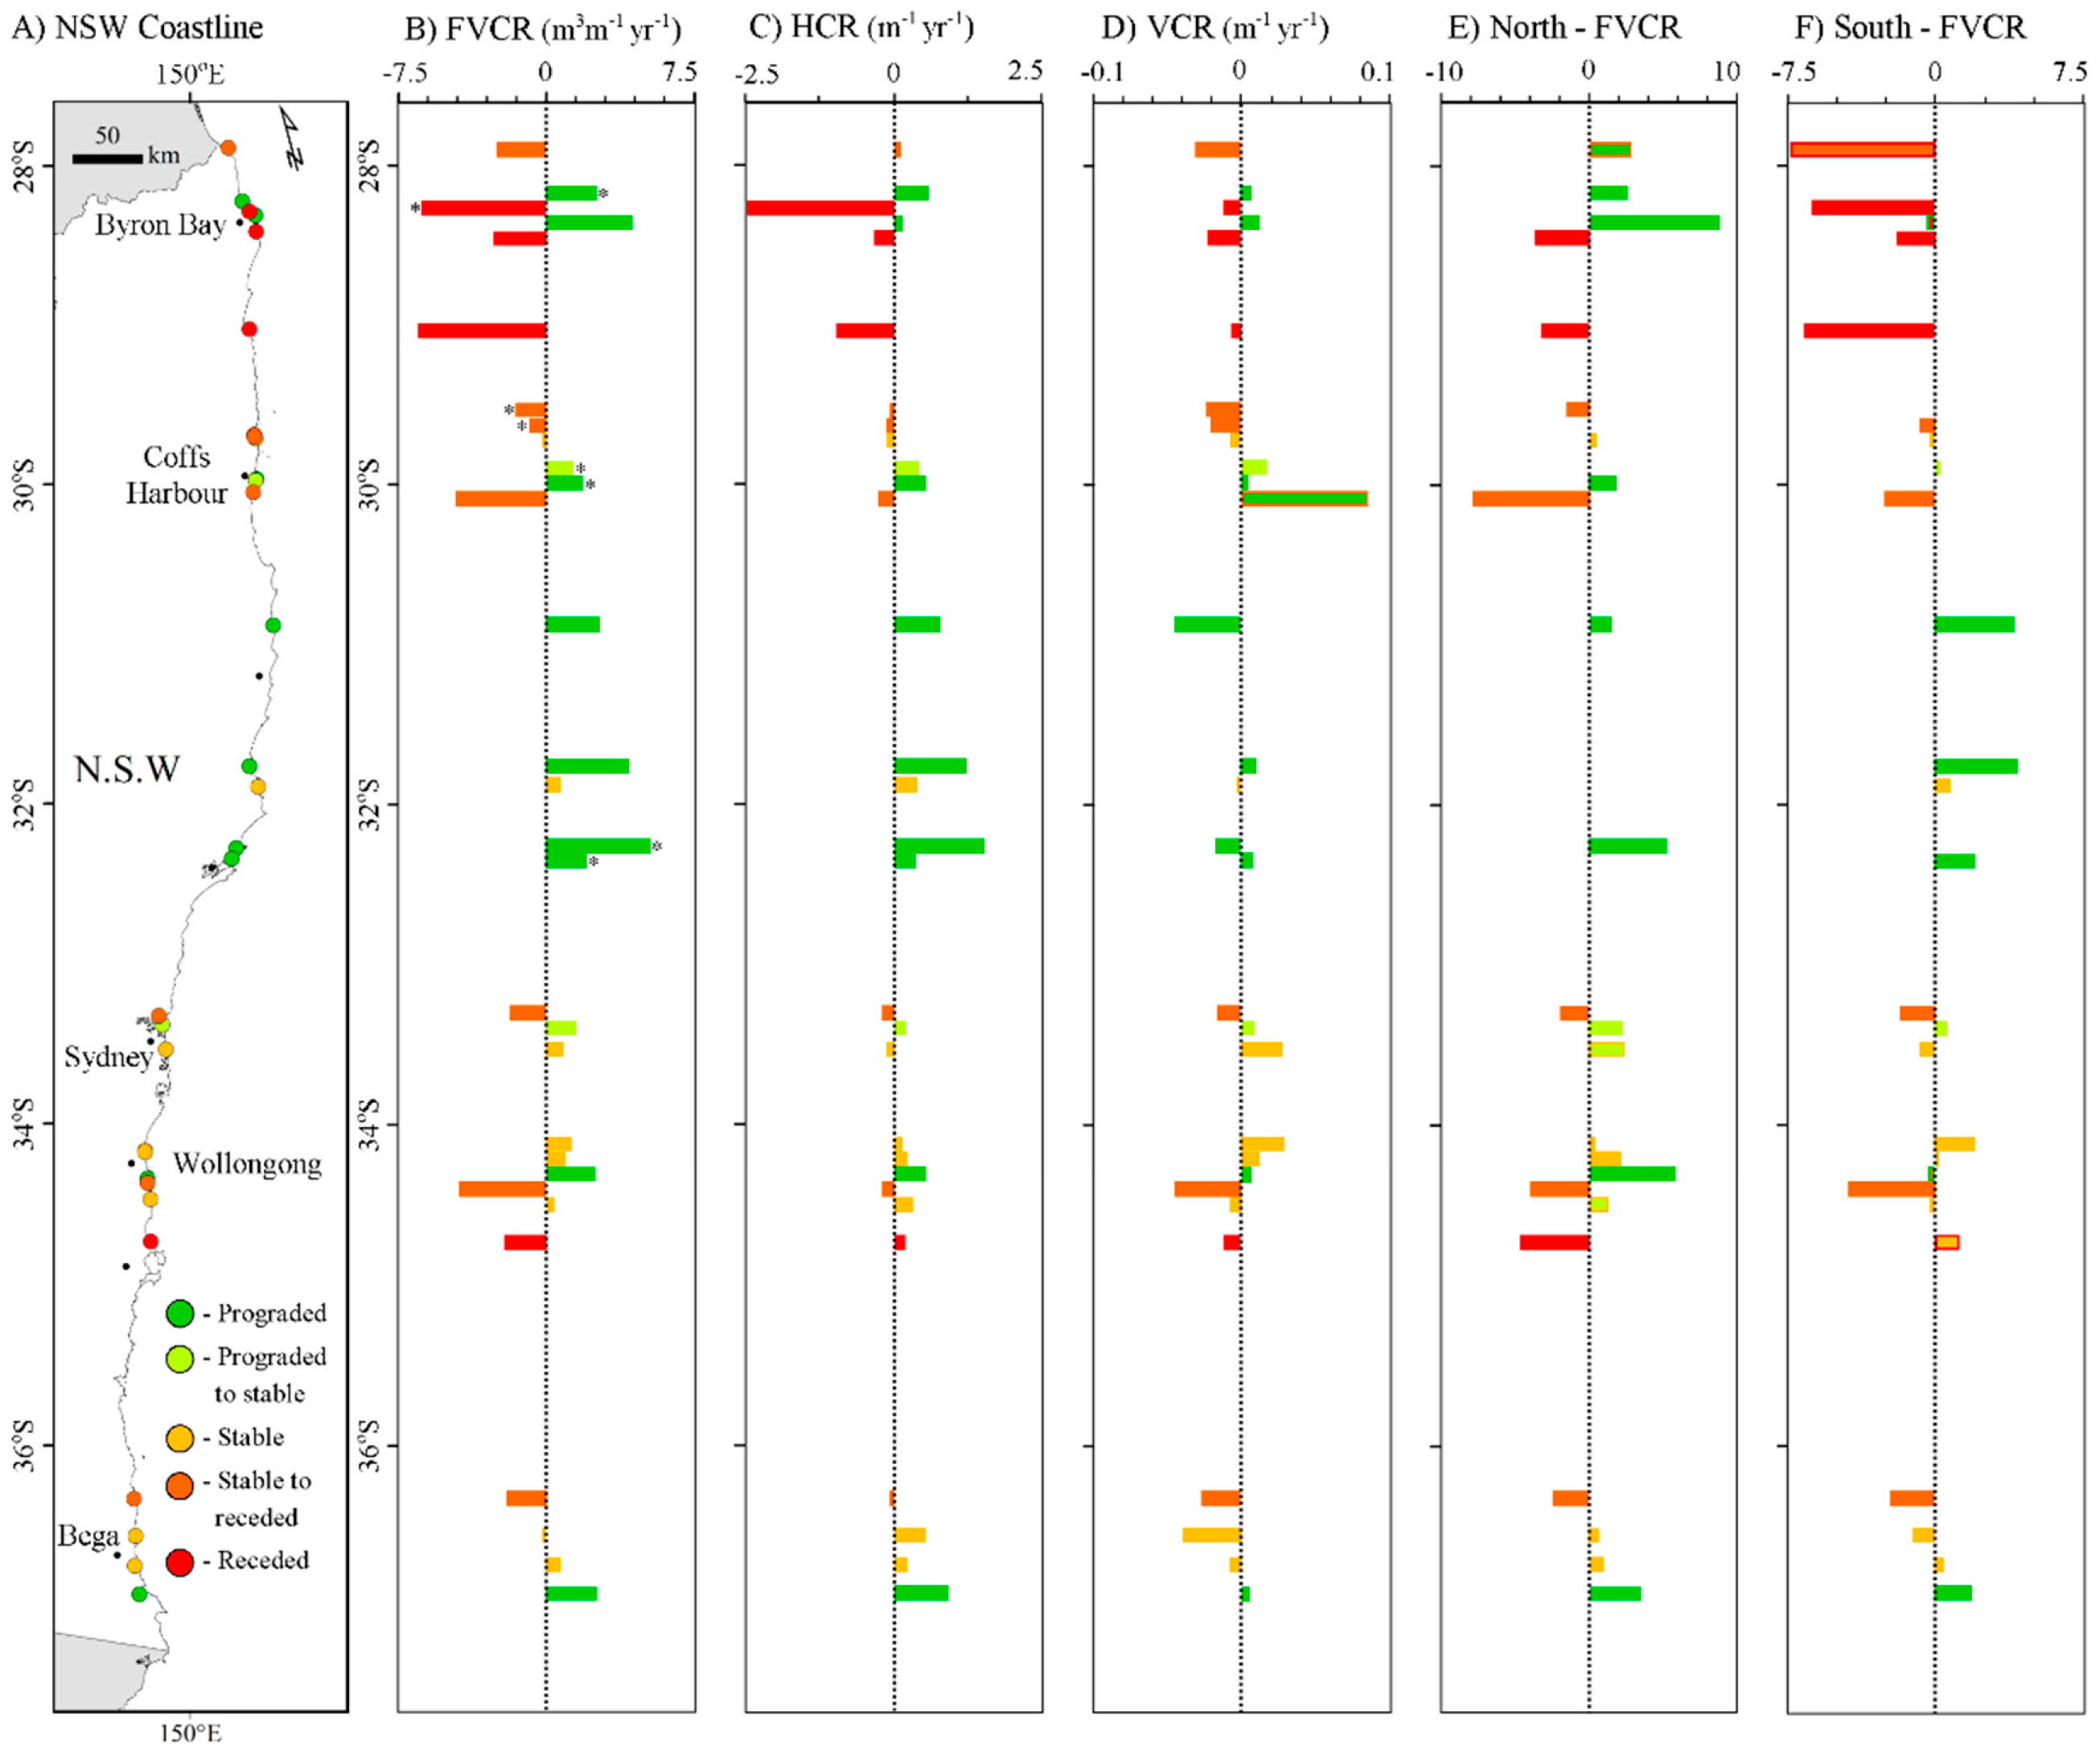
The foredune study sites have generally evolved in one of three ways. They have either prograded, remained stable, or eroded over the past seven decades (Figure 5). Those systems that prograded either did so in such a way that new foredune features have developed seaward of the historical foredune, or the historic foredunes have built vertically (and, or seaward) but no new dune was initiated (Figure 5). Those foredunes that gained sand over the study period had an average 101.2 m3 m−1 sand gained, at an accumulation rate of 1.9 m3 m−1 y−1 (Figure 5). While those that have receded, and therefore lost foredune sand volume over time, had an average 170.6 m3 m−1 lost over the study time frame, at an average rate of −2.8 m3 m−1 y−1 (Table 3).
Both Table 3 and Figure 5 summarise the selected foredunes and indicate whether the systems have prograded, remained stable, or receded over the study period (1941–2014). The absolute foredune volume change and overall foredune volume change rate (FVCR) were used in the determination of the type of evolution the foredune system has undergone. Those with a positive FVCR higher than 1.5 m3 m−1 yr−1 were deemed prograding systems, while those with a FVCR between 1.5 to −1.5 m3 m−1 yr−1 were considered stable (due to the upper error margin of the photogrammetry being ±1.5 m). Finally, the foredunes that were found to have a FVCR lower than −1.5 m3 m−1 yr−1 were considered receding.
The “Stable - receding 2” category was created because, even though these systems seem to have lost a large amount of sand over time, closer analysis of the foredune volume changes indicates that these systems may still recover given more time (Table 3). Figure 5 also summarises the other variables calculated for each study site, including the absolute, horizontal change rate (HCR), vertical change rate (VCR), FVCR for the northern half of each system (North - FVCR), and the same for the southern half (South - FVCR).
The northern sections of most study beaches have prograded over time (at an average of rate of 2.6 m3 m−1 y−1), while those few beaches that lost sand in the north, did so at an average rate of −3.5 m3 m−1 y−1. Conversely, the majority of study sites receded in the southern section of the foredune, at an average rate of −2.4 m3 m−1 y−1 (those few dunes that gained sand in the south, over time, did this at an average rate of 1.5 m3 m−1 y−1) (Figure 5E,F).
Changes in foredune shape have also occurred along the NSW coast, where the majority of foredunes have increased in width. That is, they have grown seaward, in most cases as incipient foredunes. An average of 25.2 m was gained at an average rate of 0.5 m y−1 over the total time (the few that decreased in width had an average total loss of −19 m at an average rate of −0.45 m y−1). Crest elevation, on the other hand, has generally decreased over the past 70 years (with a total average loss of −1.2 m, at an average rate of −0.02 m y−1). Those few beaches that gained crest elevation, on average, gained 0.8 m at an average rate 0.02 m yr−1, over the study period (Figure 5C,D).
4.2. Changes in Foredune Morphology—Case Study Sites
Several case study sites have been selected to conduct more in-depth investigations, to further demonstrate how NSW foredunes have changed over time. The following sites were chosen because each represents an example of a different type of foredune evolution (Table 3), as well as different degrees of human modification. These include, Brunswick Heads, Palm, Woonona-Bellambi, Tathra, Woody Bay, and Warilla Beaches (Figure 3A–F).
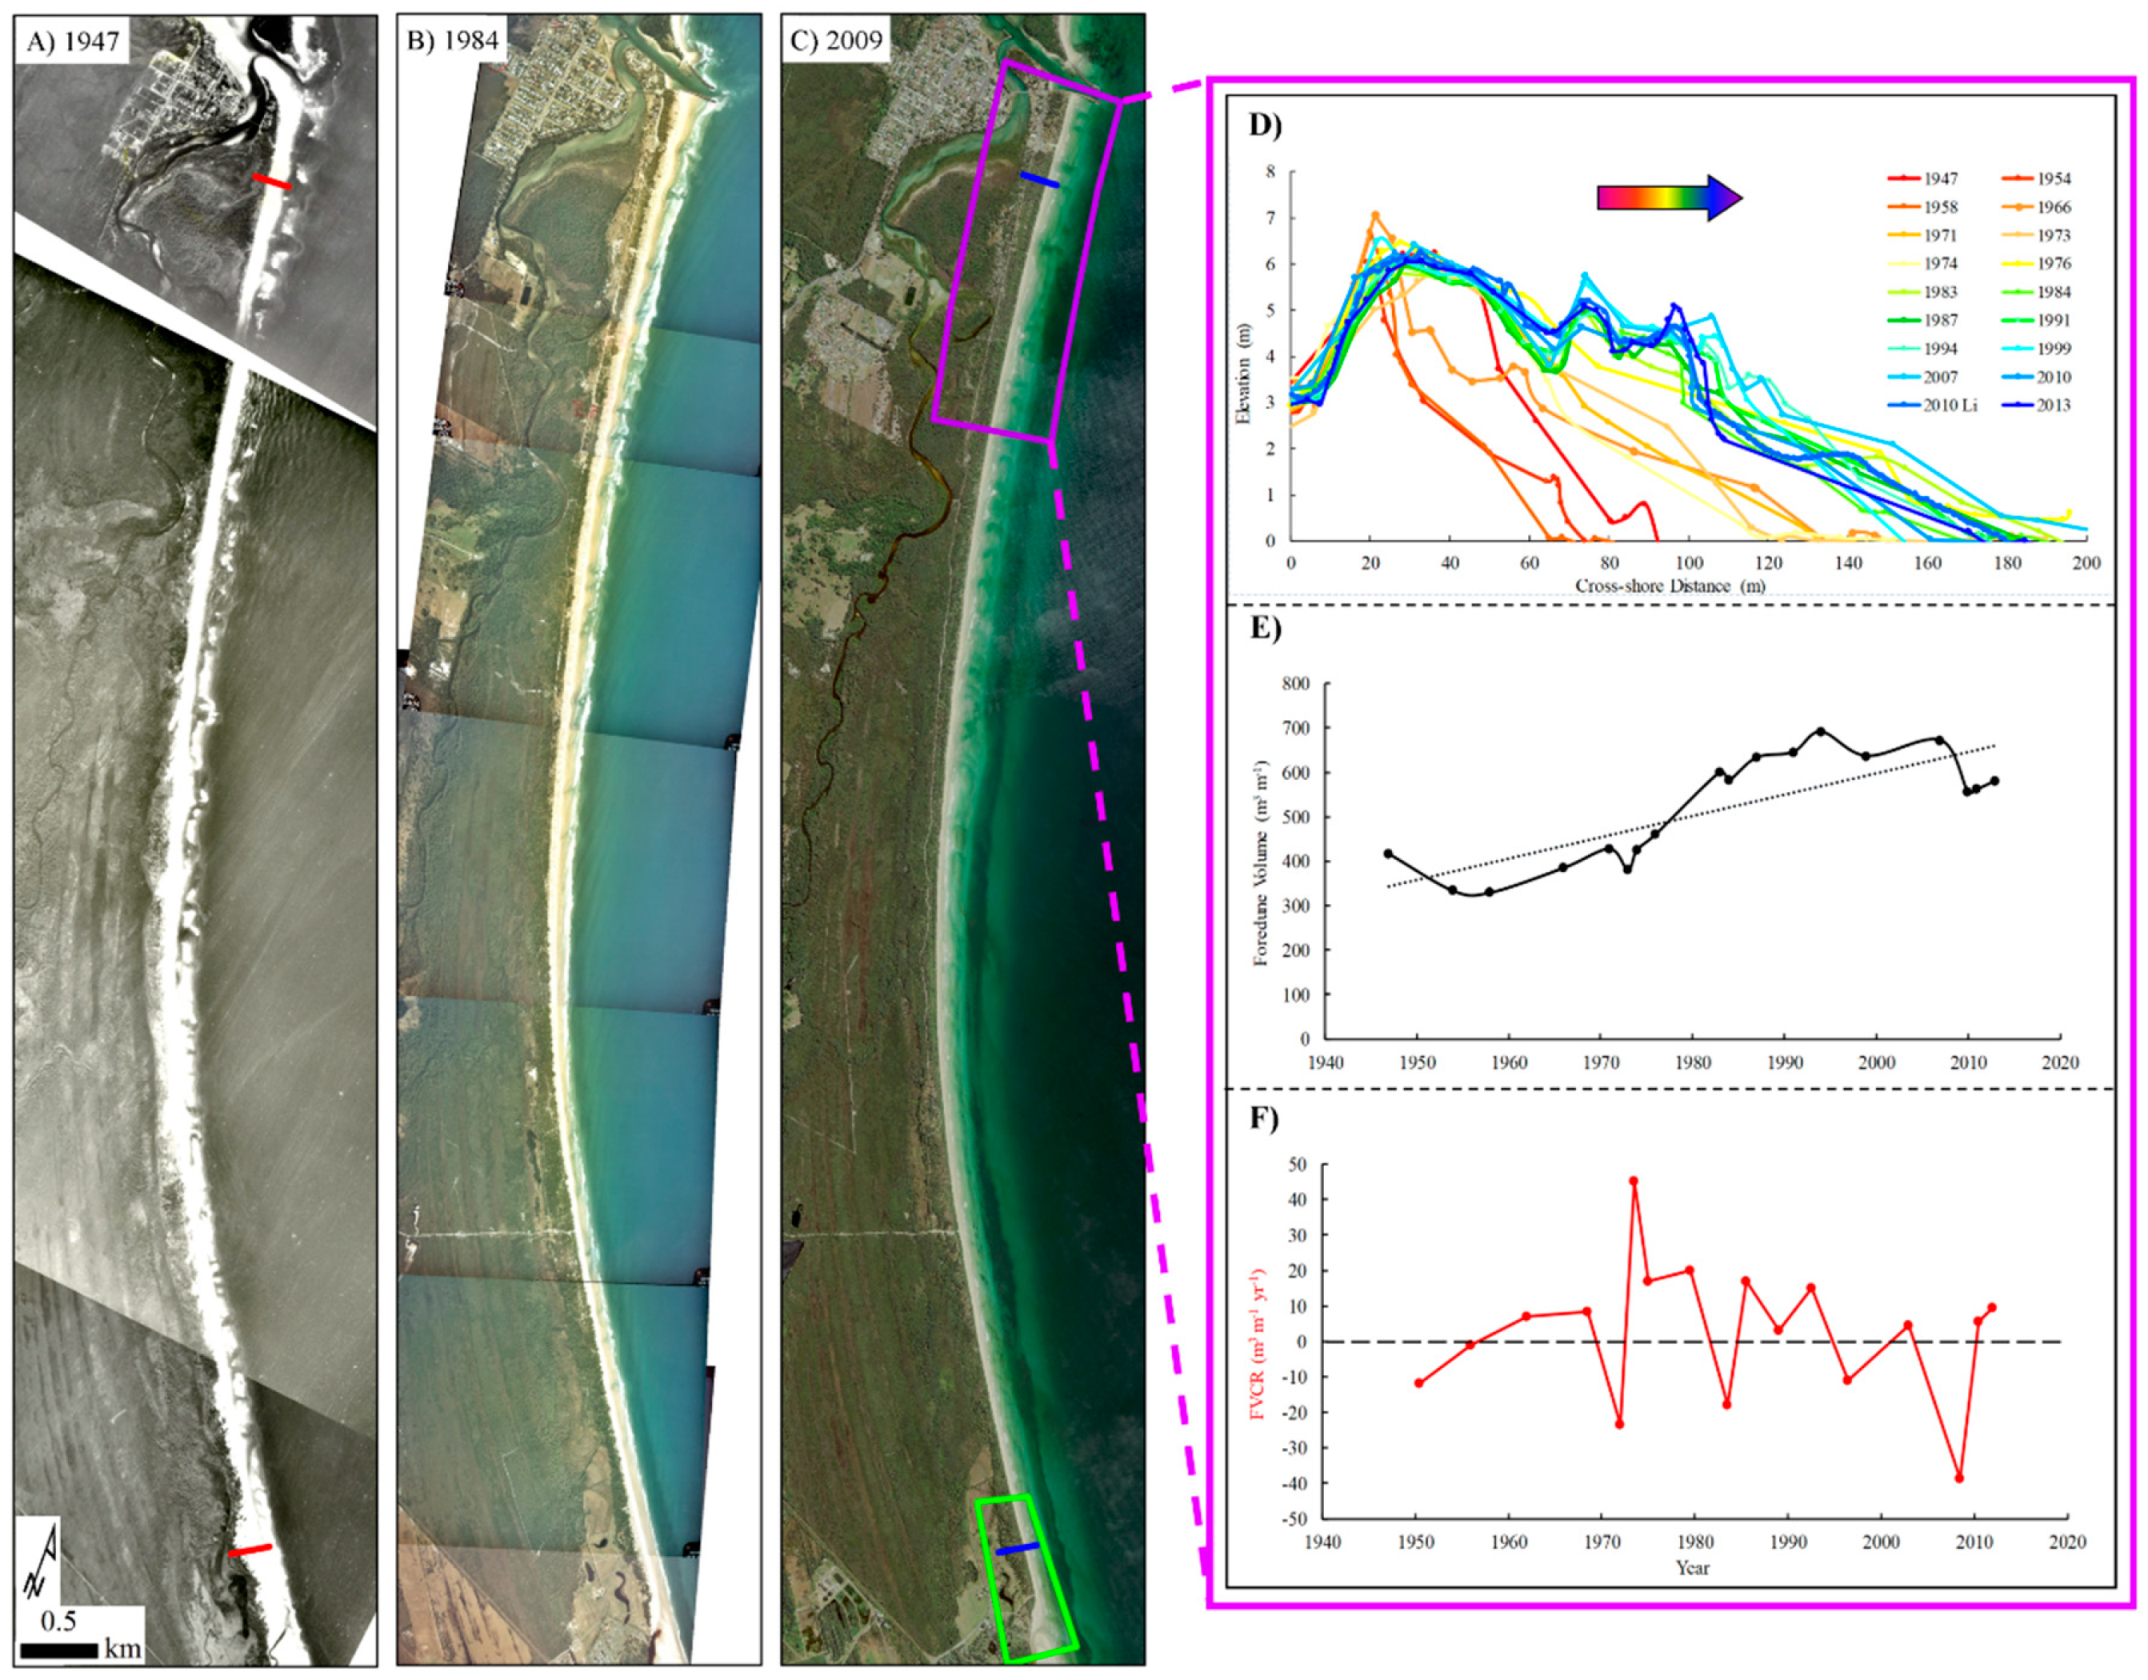
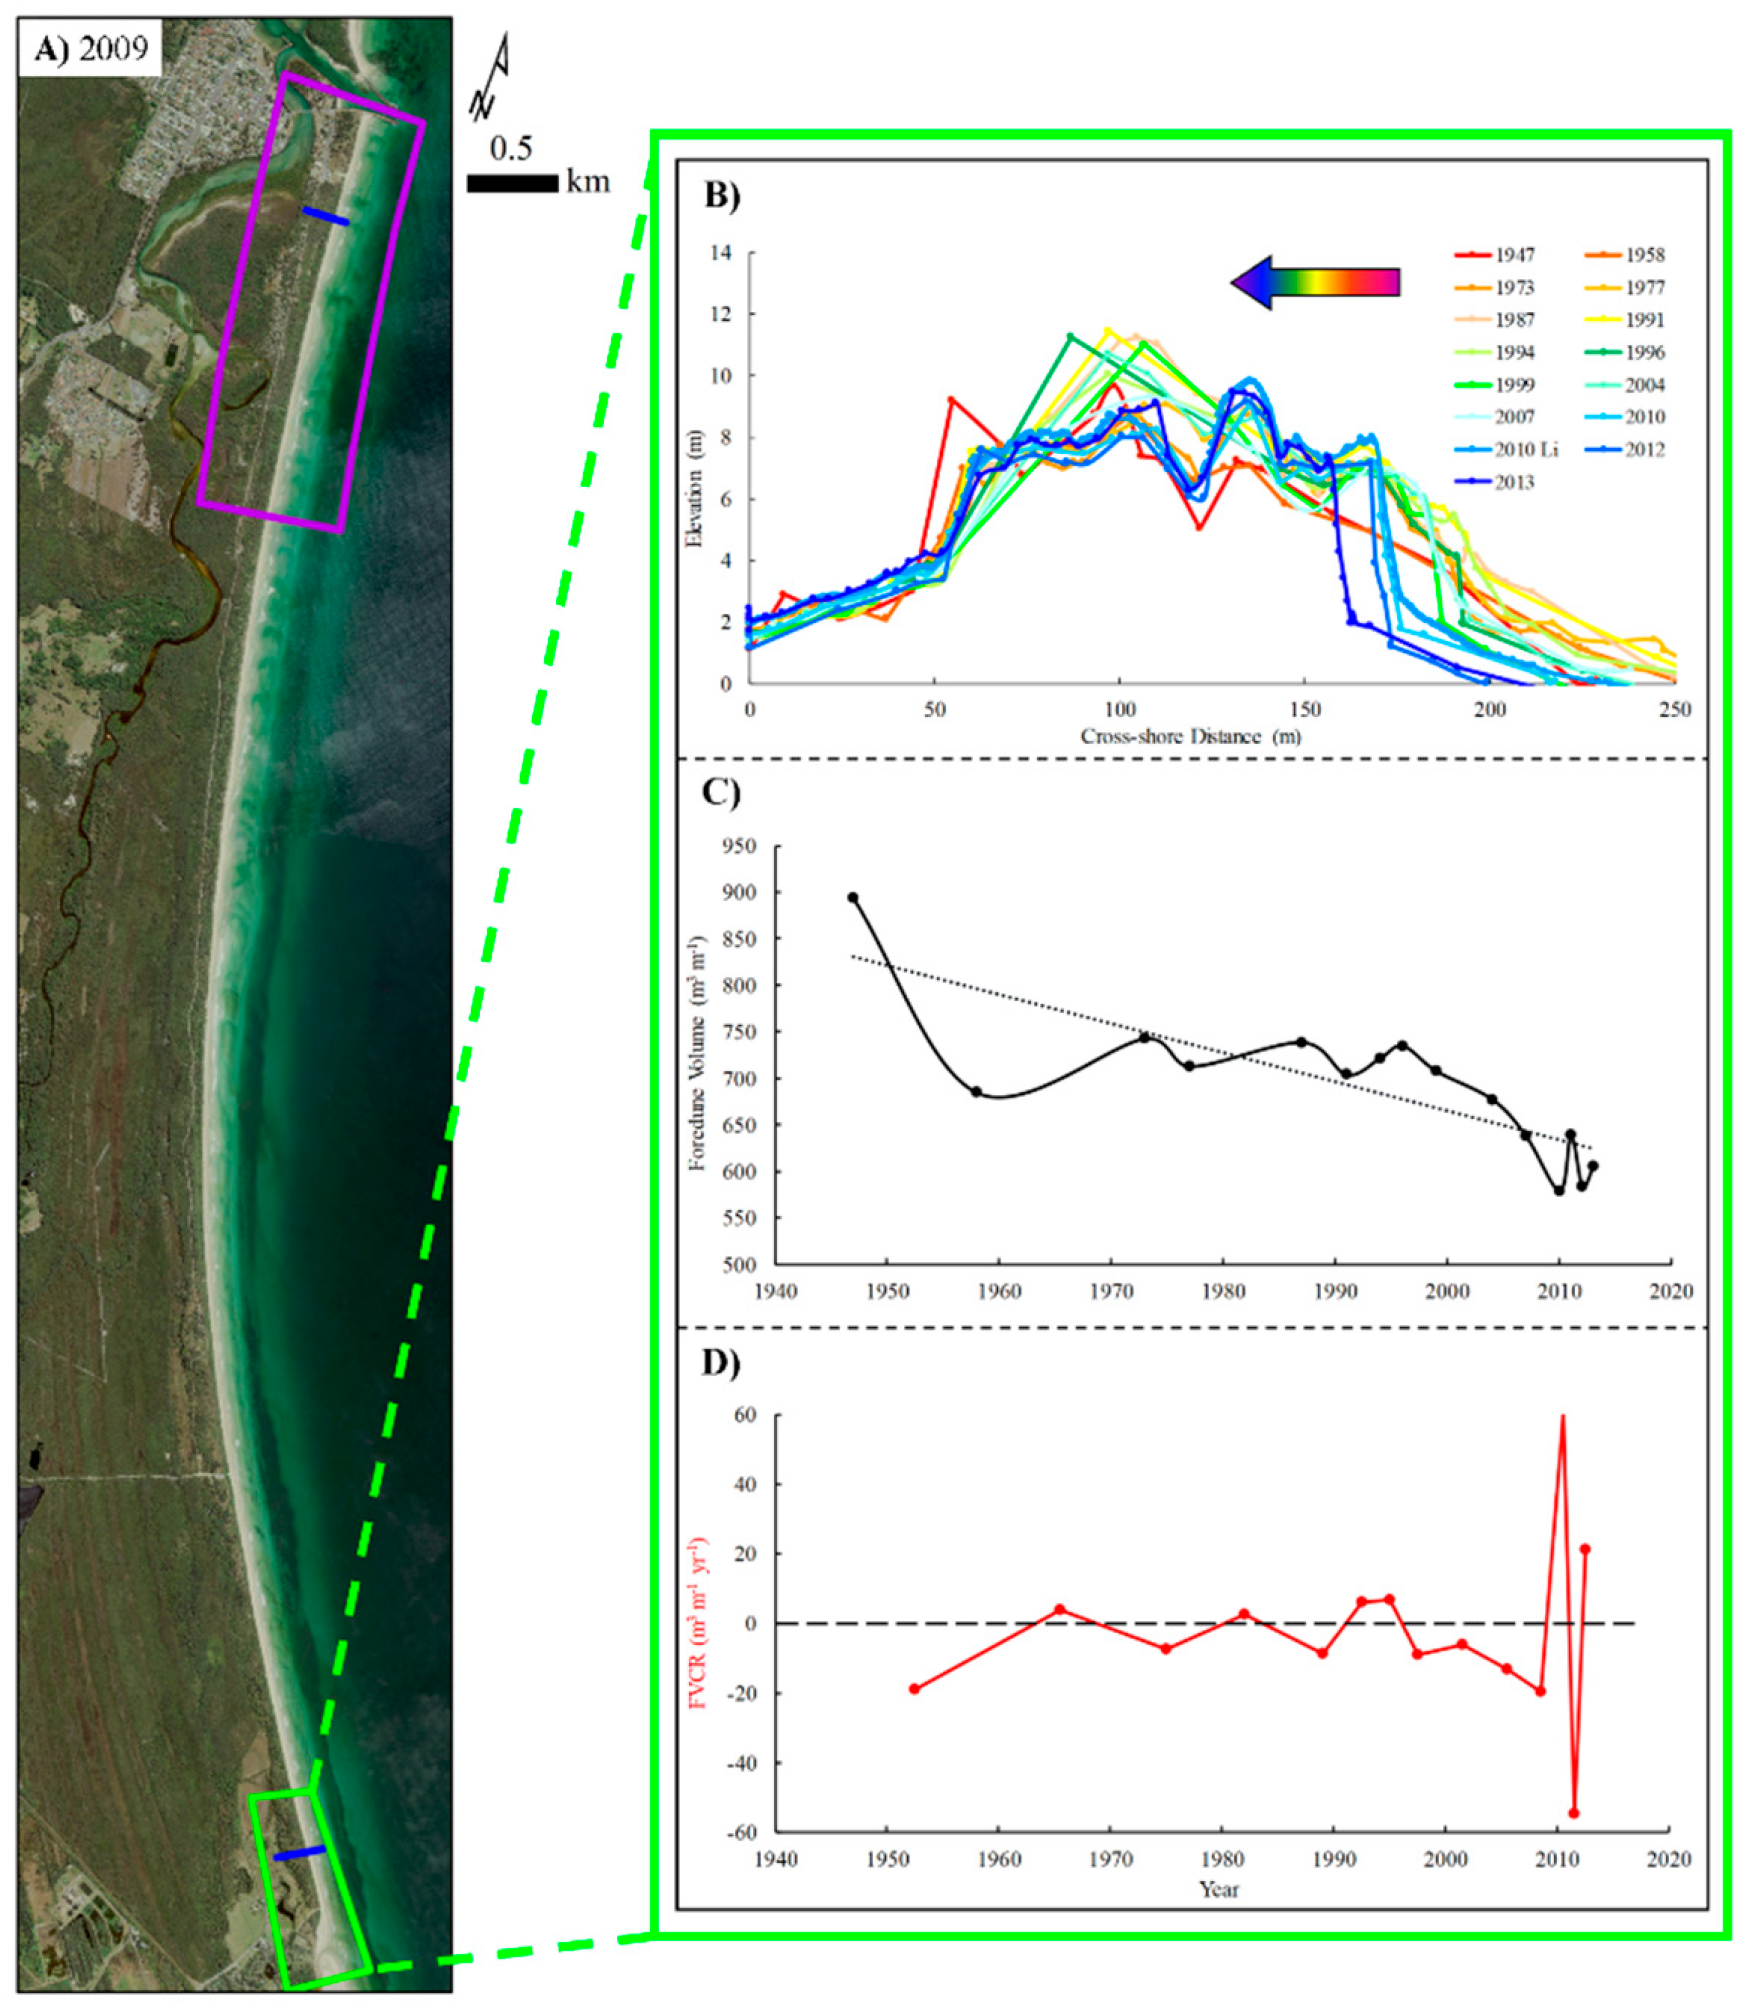
Brunswick Heads Beach extends for 10.6 km and curves to the south toward the town of Byron Bay (north NSW, Figure 3A). Two analyses were performed on this beach, one focused on a northern section of the foredune and the other on a section in the south (due to data coverage) (Figure 6C). The northern section of the foredune prograded over the study period (1947–2013) and gained 164.5 m3 m−1 in sand volume, on average, at a rate of 2.5 m3 m−1 y−1 (Table 3) (Figure 6). The volume accumulated in the horizontal, with the production of a new incipient foredune seaward of the original dune (average dune width gain of 37.3 m and HCR of 0.56 m y−1) (Figure 6D – 1983 onwards). The crest height did not change greatly, it increased by 0.35 m (VCR of 0.005 m y−1). In contrast, the southern section of the foredune receded over time (Figure 7). The foredune volume decreased by an average −6.1 m3 m−1 y−1, with a total loss of −288 m3 m−1 of sand. Similar to the northern end, most of this sand movement was experienced in the horizontal, where the foredune width decreased by an average of 55.2 m (at a rate of −2.4 m y−1 HCR), as opposed to the crest elevation, which decreased by 0.73 m (VCR of 0.01 m y−1).
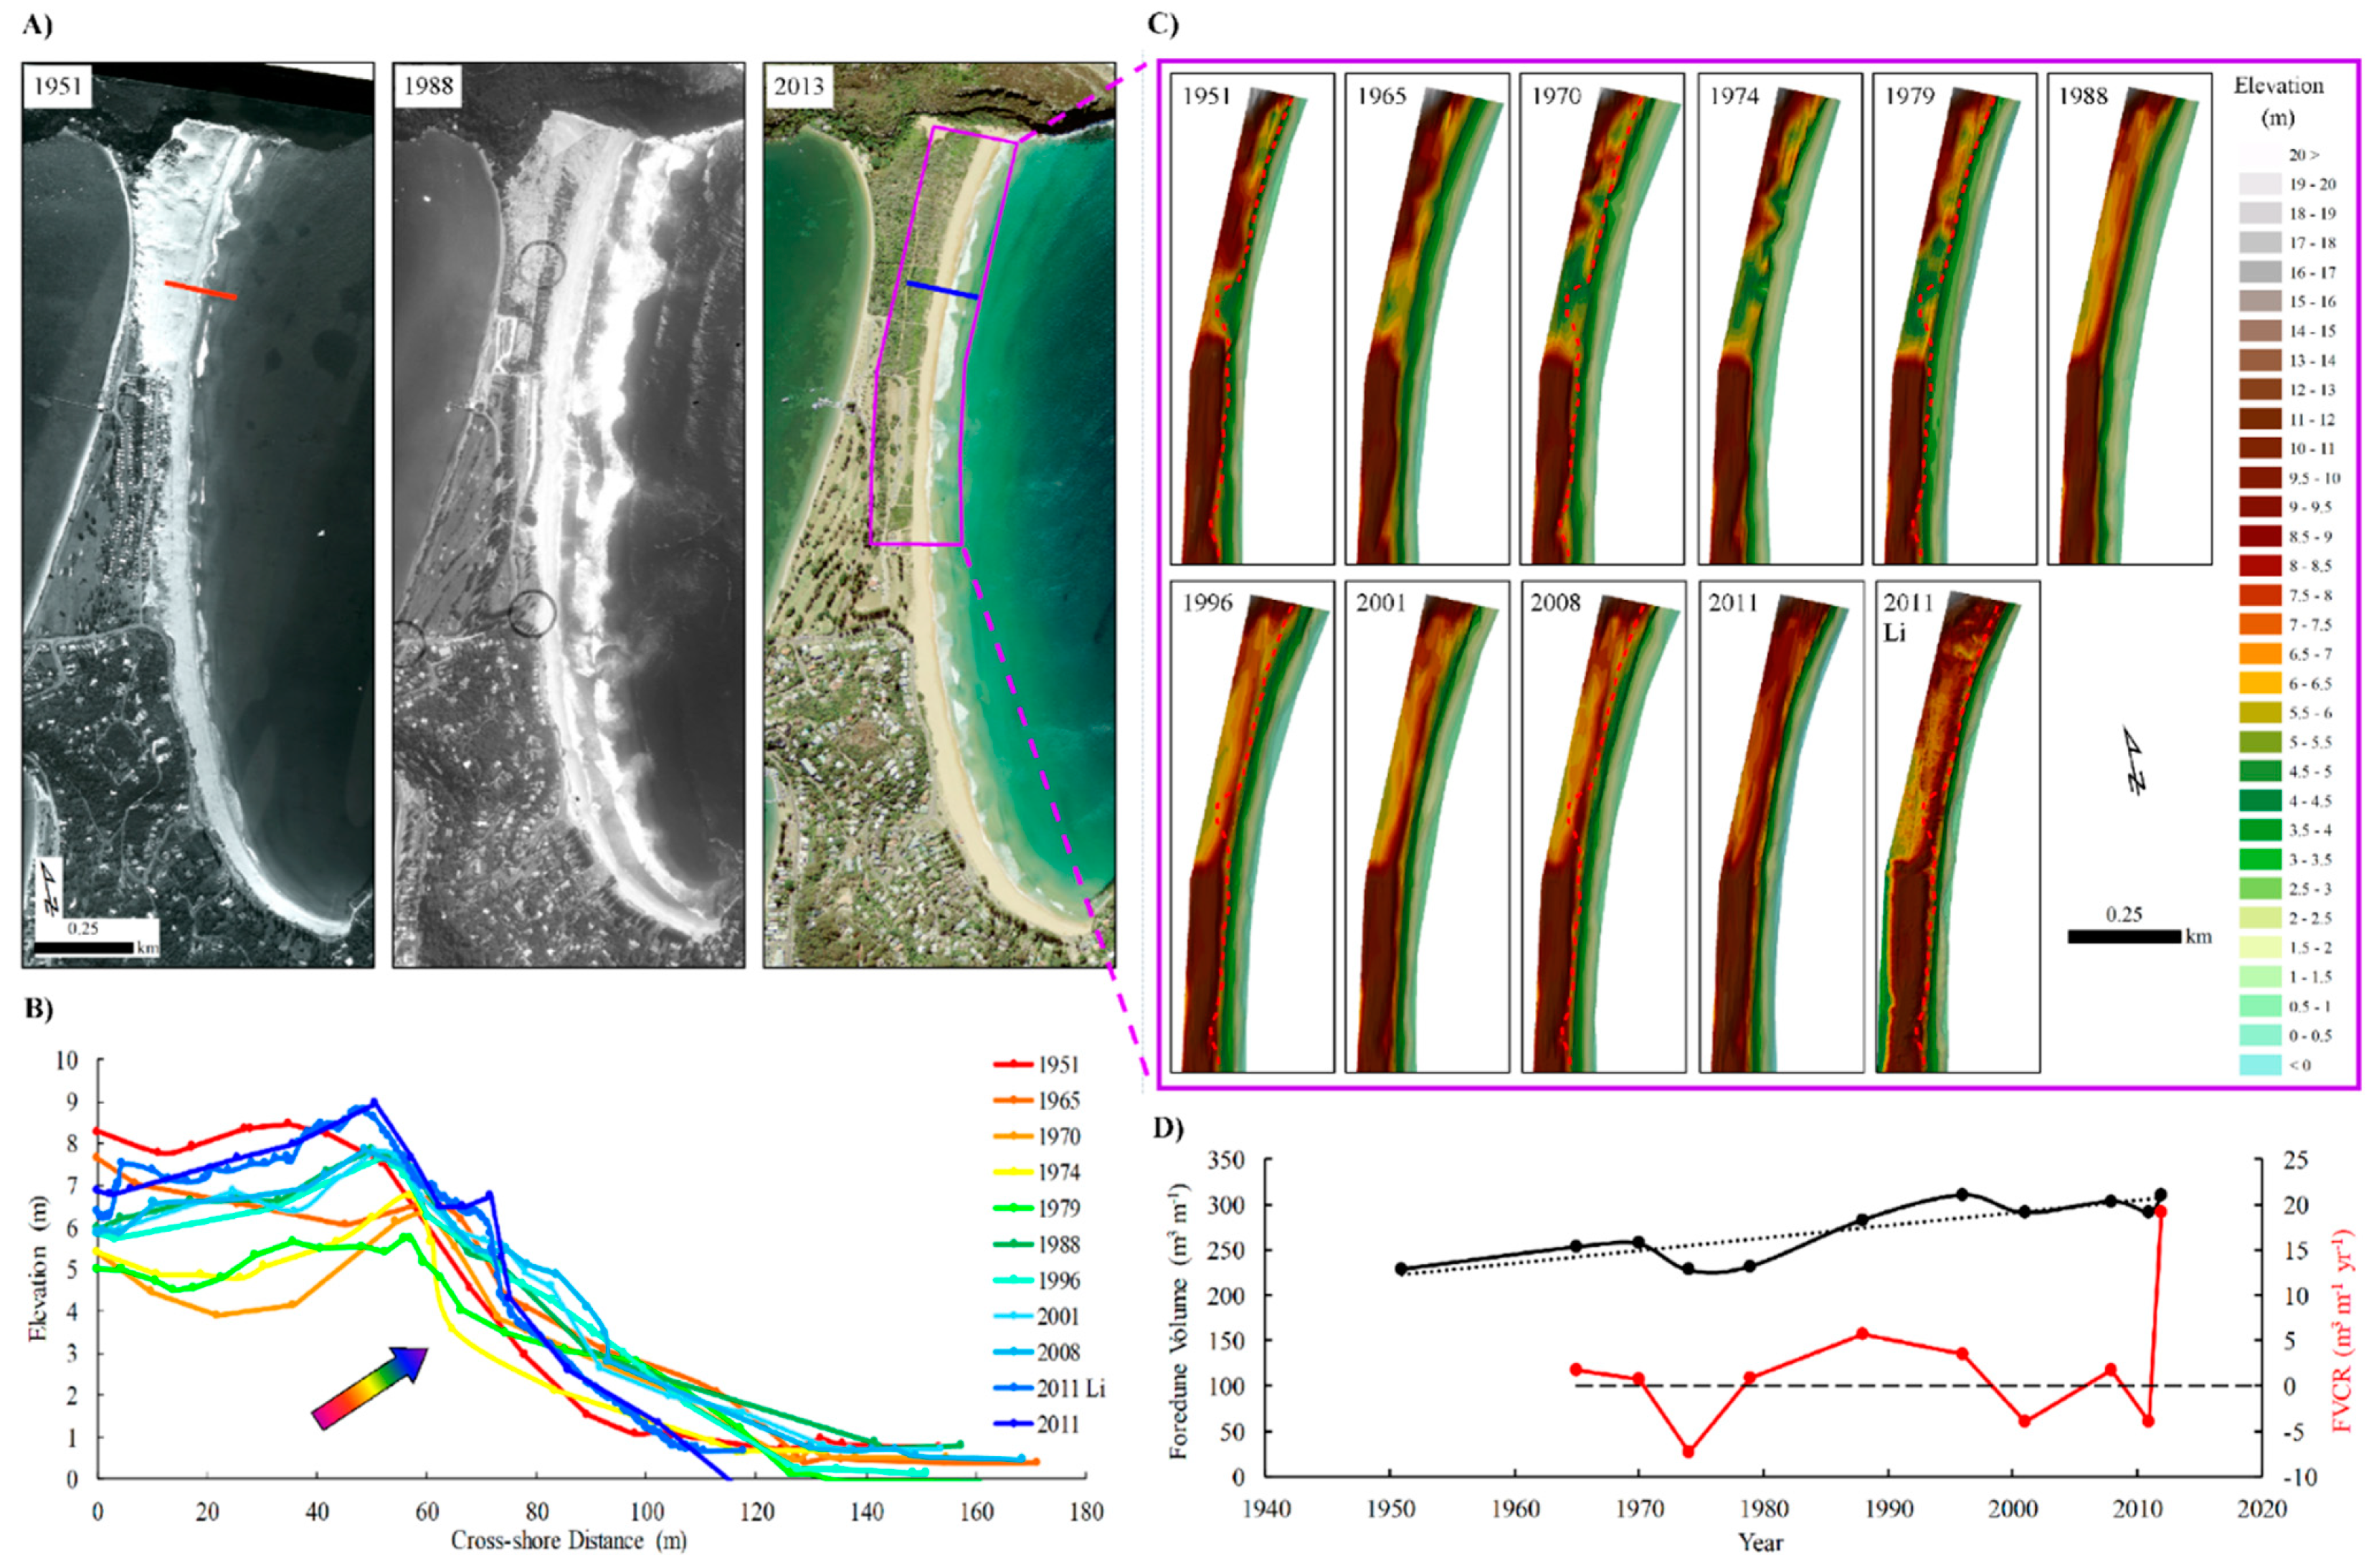
Palm Beach extends for 2.3 km and is located 33 km north of Sydney CBD (Figure 3C). This foredune has prograded over the study period (1951–2011) (Figure 8C,D). However, the dune has not gained a substantial amount of sand, so it could also be considered stable, hence the prograding to stable classification. In Figure 8, panels B and C clearly show the formation of an incipient foredune in the north of the system after the year 1988, and this feature fluctuated following that time (Figure 8). Overall, the foredune at Palm Beach increased in volume by 81.93 m3 m−1 (at a rate of 1.37 m3 m−1 y−1) (Table 2), the width increased by 8.52 m (HCR of 0.14 m y−1), and the dune crest increased in elevation by 0.45 m (VCR of 0.01 m y−1).
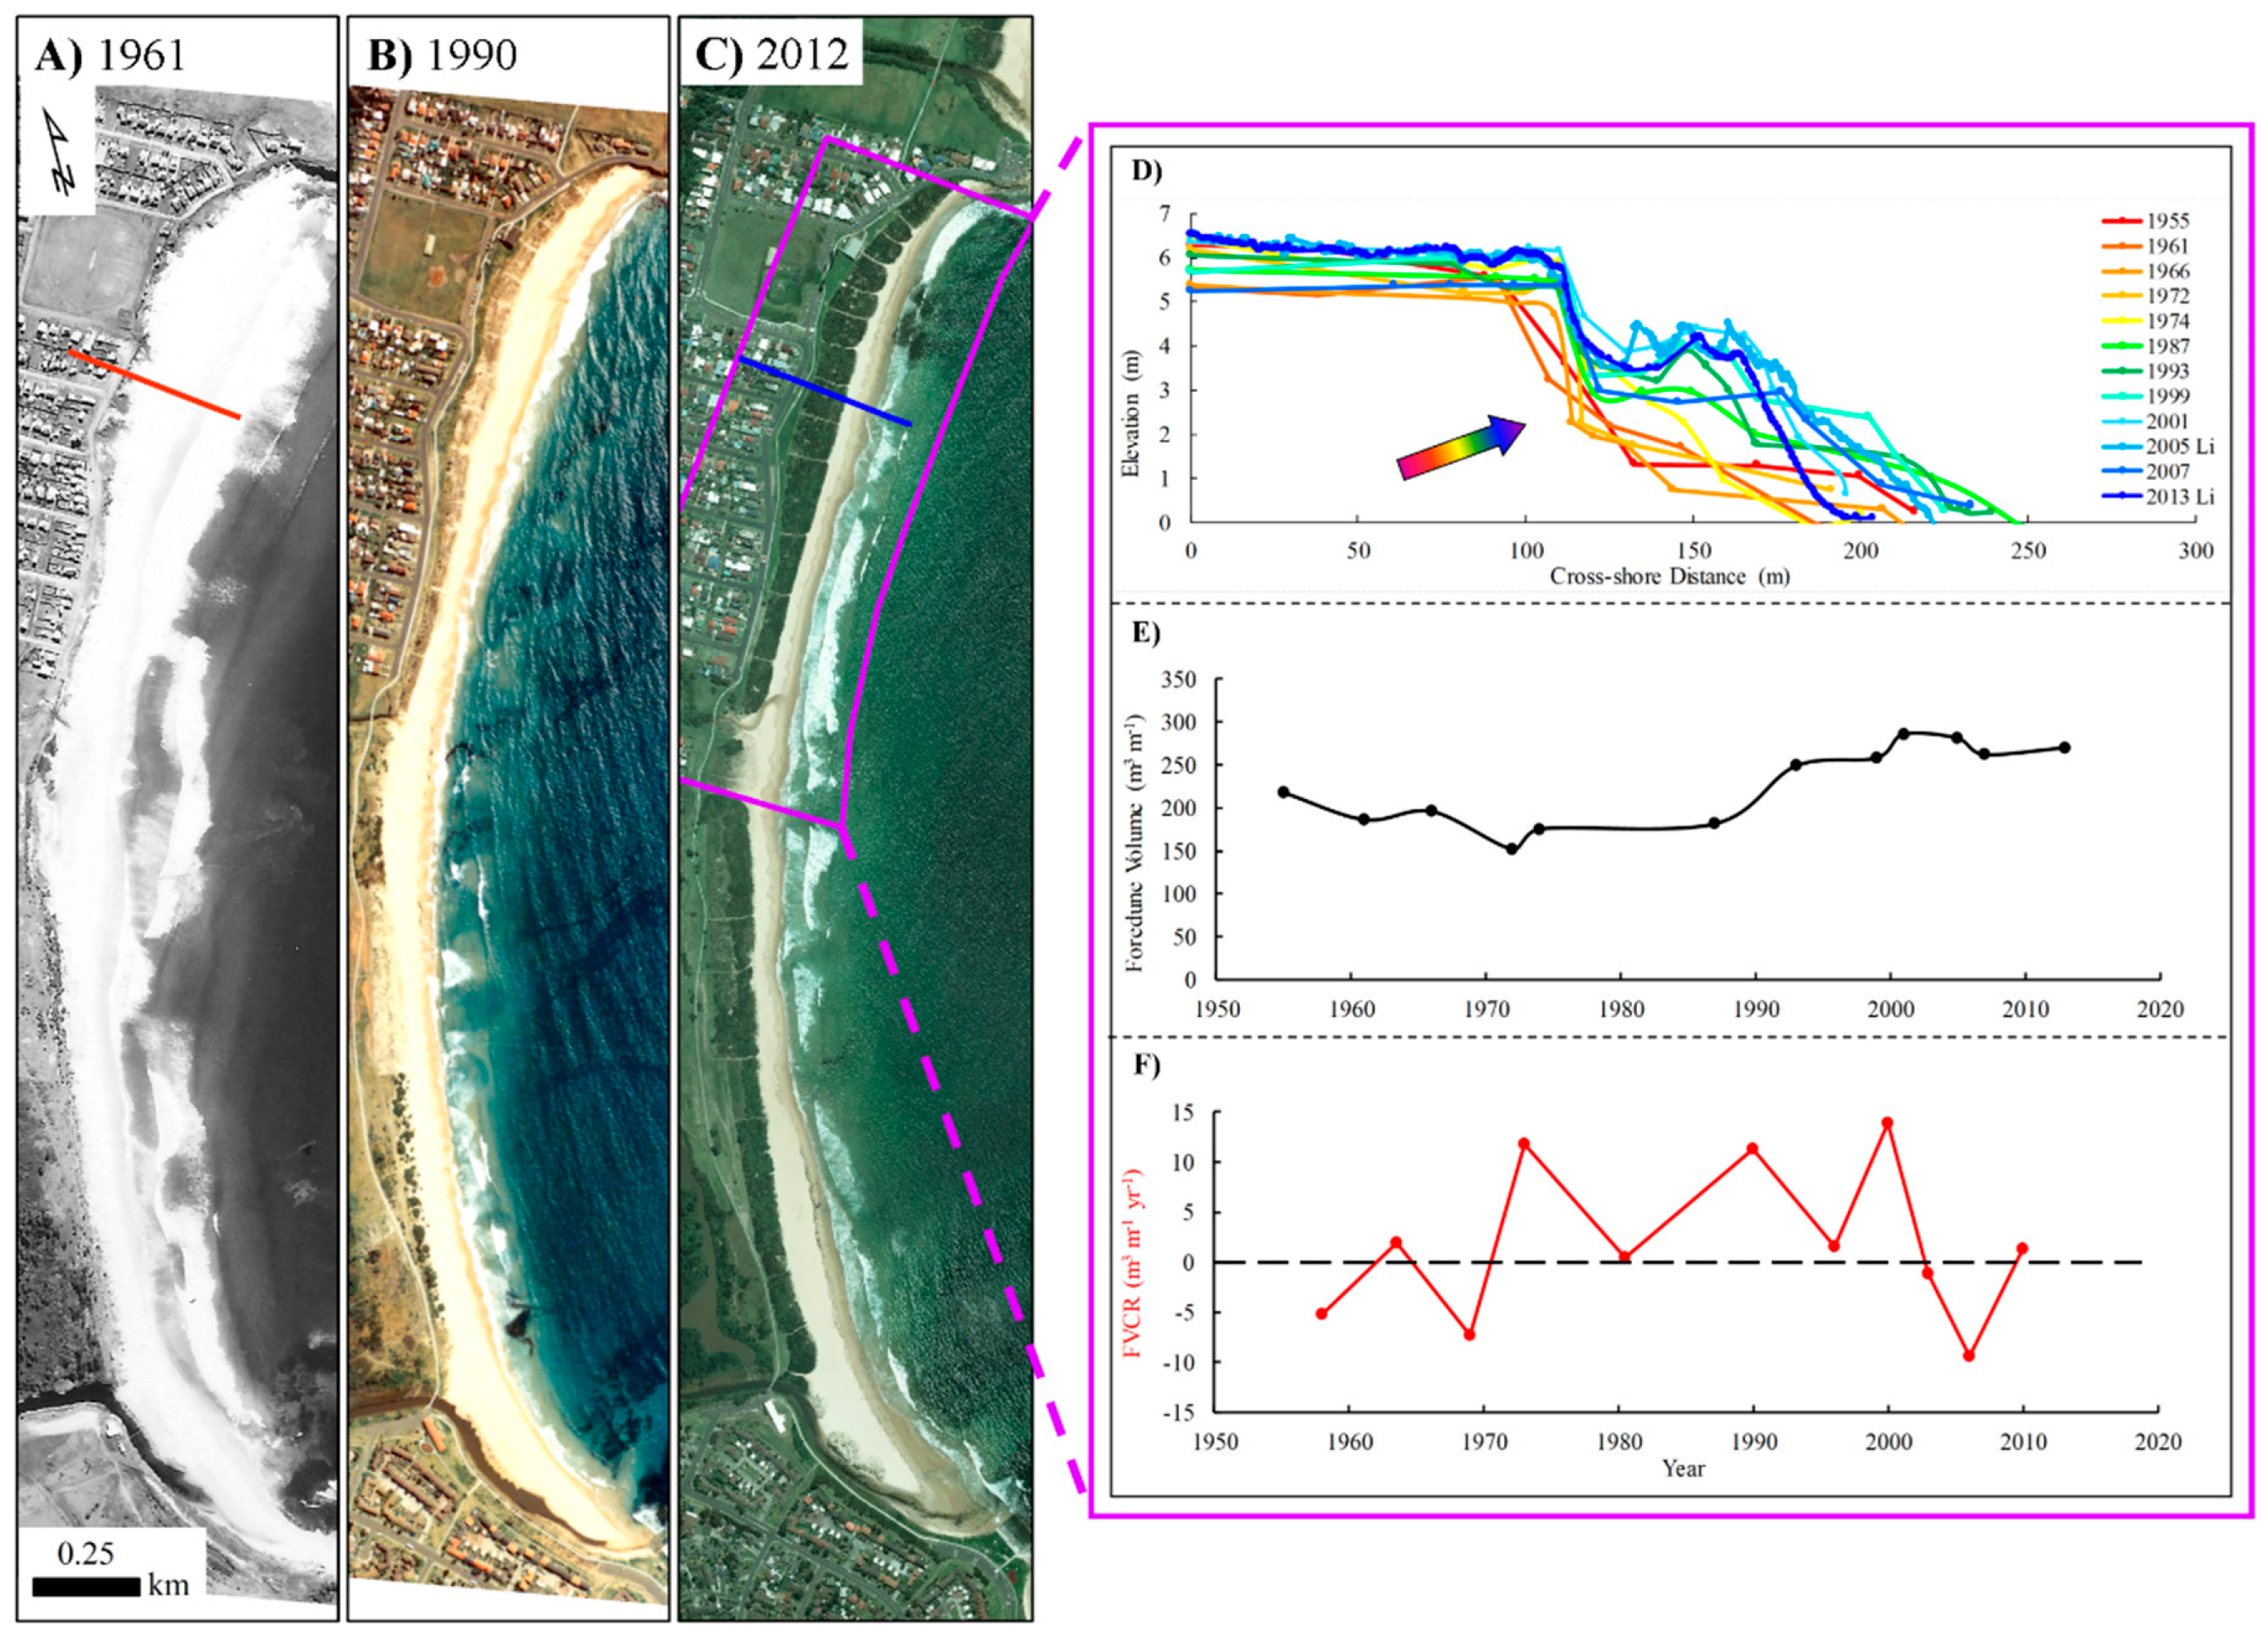
Woonona-Bellambi Beach extends for 2.2 km, curving gently south towards Bellambi Point, just north of Wollongong (Figure 3D). The foredune has remained relatively stable over the study period (1955–2013) (Table 3). A new foredune began forming in the north of this system after 1987 (Figure 9D), which seemed to reach its peak size in 2005, and since it has oscillated around a similar volume (Figure 9D,E). Overall, the foredune at Woonona-Bellambi has increased in dune volume by 52.42 m3 m−1 (at a rate of 0.90 m3 m−1 y−1 FVCR), increased in width by 10.23 m (HCR of 0.18 m y−1), and in crest elevation by 0.60 m (VCR of 0.01 m y−1).
Tathra Beach lies on the southern side of the Bega River mouth and curves for 3.3 km to Tathra Head, near Bega (Figure 3F). Its foredune has remained relatively stable over the study period (1944–2014), despite having a final deficit absolute volume calculation (Table 3). Although there was noticeable foredune erosion in 1957–1966, and 1972–1975 (associated with major flood events in the 1960’s and ~1978) (Figure 10), a new incipient foredune started forming all along this system between 1988 and 1993 (Figure 10A–D), and the dune volume increased. Overall, the foredune at Tathra has decreased in volume by −9.66 m3 m−1 (at a rate of −0.14 m3 m−1 y−1 FVCR), increased in width by 35.40 m (HCR of 0.51 m y−1), but decreased in crest elevation by −2.75 m (VCR of −0.04 m y−1). When the northern and southern sections of this embayment are compared, they seem to have behaved differently, as the north seems to have prograded over time, whereas the south has receded landwards (Figure 10).
Woody Bay is a semi-circular beach that is located between two prominent sandstone reefs, as well as two additional reefs in the centre of the system. It is situated in the far north coast of NSW (Figure 3B), faces northeast-north, and is very protected from southeast waves by Woody Head (Figure 11A). Its beach and dune have experienced severe recession over the study period (1942–2010) (Table 3), as illustrated in Figure 11. Overall, the foredune here has decreased in volume by −436.93 m3 m−1 (at a rate of −6.33 m3 m−1 y−1 FVCR), decreased in width by −65.64 m (HCR of −0.95 m y−1), and crest elevation by −0.46 m (VCR of −0.01 m y−1). Both the north and south ends of this system are receding; however, the south is doing this at a much faster rate (Figure 5) (i.e., north FVCR is −3.10 and the south experiences −6.55 m3 m−1 y−1 of sand loss). Additionally, the foredune found at the northern end of Woody Bay has gone from being strongly influenced by tombolo associated processes (Figure 11A, 1942 southern tombolo, star graphic), to having no effects from the rock reef at all (Figure 11A, 2012, purple star graphic).
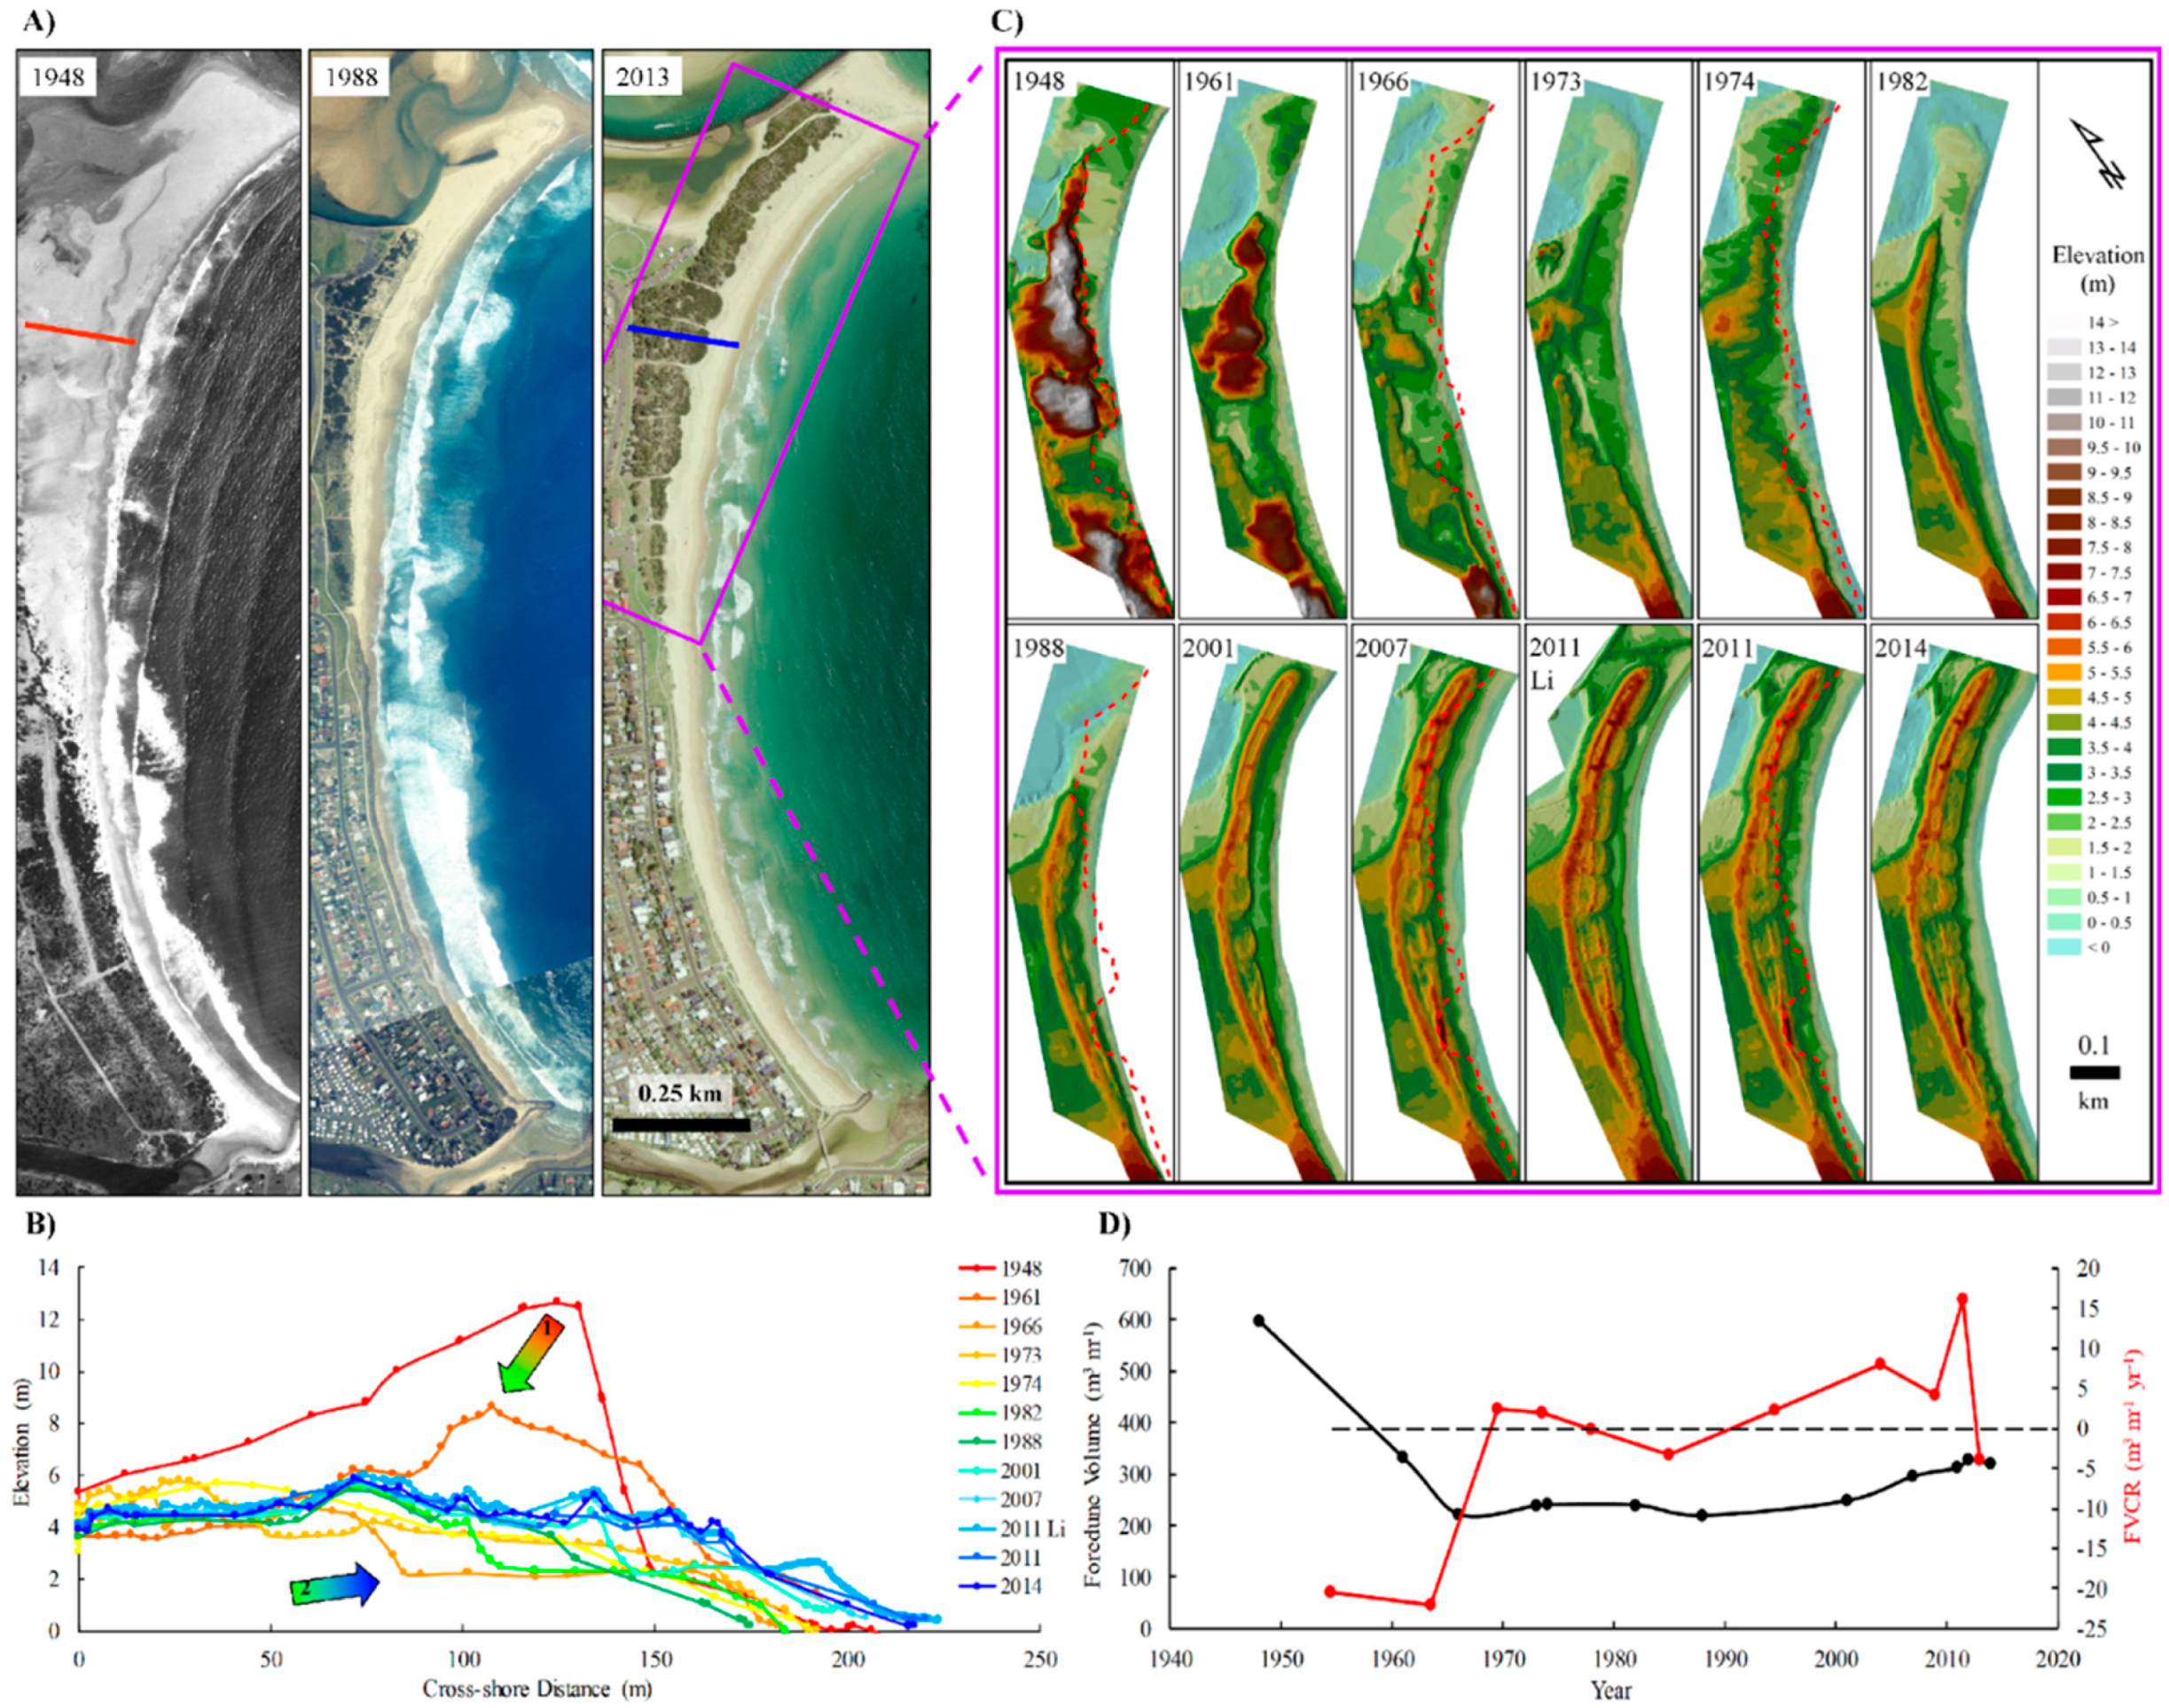
Warilla Beach is the final case study site, and it is a curving, east-facing, 2 km long embayment, extending from Windang Island to Barrack Point on the south coast of NSW (Figure 3E). The foredune at Warilla Beach seems to have receded over the study period (1948–2014), but it has also gone through some significant changes (particularly as a consequence of management) (Figure 12), and could still be recovering. Overall, the foredune at Warilla has decreased in volume by −278.21 m3 m−1 (FVCR of −4.22 m3 m−1 y−1), decreased in width by −11.62 m (HCR of −0.18 m y−1), and decreased in crest elevation by −2.90 m (VCR of −0.04 m y−1). When the northern and southern sections of this embayment are compared, they seem to be behaving similarly, however the north seems to have a lower FVCR (−3.80 m3 m−1 y−1) than the south (−4.30 m3 m−1 y−1). This follows suit for all the other morphometrics measured for longer-term foredune evolution (Figure 12).
5. Discussion
Foredunes along the NSW coast have displayed a range of changes over the past seven decades; either aggrading and/or prograding, remaining relatively stable, or eroding (Figure 5). It is important to investigate their spatial distribution and environmental setting to determine what might be causing this disparate behaviour (especially those eroding and receding) in order to develop effective dune management schemes. The following sections examine the spatial distribution of the dunes and possible controls on their behaviour.
5.1. Accreting Shorelines
Those beach-foredune environments that have prograded over the past seven decades have either extended seaward as new incipient foredunes, and/or grown vertically in place (Figure 1). The reasons for the aggradation/progradation and their rates of sand supply are not clear. Table 4 shows the prograded sites, sorted by decreasing volume of progradation, to highlight the spatial variation occurring. It is clear that most sites are found in the northern half of the state, except Boydtown, Perkins-Windang, and Palm beaches. Table 3 also summarises the evolution style of each prograded site. The majority (8 out of 11) have prograded by extending seawards as new incipient foredunes, rather than building vertically (3 out of 11).
Table 4 lists some other features that could also be influencing the sediment budget of these coastal environments. Table 4, column 4 (wave alignment), separates the prograded sites into several main compartment types (primarily swash- and/or drift-aligned). The term compartment mentioned here (and for the rest of the study) refers to the tertiary sediment compartment of which the sites form part (see [19]). Swash-aligned shorelines form curving beaches aligned to refracted waves, which arrive parallel to shore and have negligible longshore transport [66,67]. Drift-aligned shorelines have waves break at angles to the shore, which assists in forming more linear beaches with prominent longshore drift [67].
Compartment leakiness refers to the movement of sediment in, out of, or around a tertiary compartment (see [19]). Most beaches found in the southern regions of NSW are part of closed sediment compartments, with no connection to adjacent compartments. Instead, the sand is trapped by prominent headlands and remains within the tertiary compartment [68,69]. In fact, those systems which have the wave alignment type in bold in Table 4 (9 out of 11) are those which have been proposed to have “major or complete barriers to longshore drift” just north of them ([20], Figure 7). Analysis within the Shoalhaven tertiary compartment has shown how, once sediments are delivered to this compartment, they remain there (i.e., circulating in a closed system) and do not leak to any adjacent compartment [69]. Leaky compartments, on the other hand, are those that maintain sediment sharing pathways (i.e., aid in longshore drift), so sand can easily by-pass headlands to adjacent northern compartments [2], a common process in northern NSW.
Column six in Table 4 outlines the Fryberger and Dean potential for aeolian sediment transport [62]. This method calculates the potential of sediment transport as drift potentials (DP or RDP: resultant drift potential) in vector units (v.u), and resultant drift direction (RDD) [62,64]. Table 4 displays the drift potentials only (i.e., DP and RDP), and most prograded sites have high sediment transport potential (>18 v.u). This indicates that strong onshore (and alongshore) winds are important processes that transport sediment supplied to the beachface, into the foredunes, and contribute to dune building [30].
The final column in Table 4 proposes the potential cause for the progradation and evolution style for each site. These causes range from continual sediment supply from longshore drift, offshore sediment delivery, sediment supply from river sources, beach rotation, high potential for aeolian sediment transport, or human impacts (like the installation of river training walls or dune management programs). Long-term change analyses, conducted on the Iluka-Woody Bay sand barrier, showed that mature estuaries (or rivers) can contribute sediment to the beach and dunes [2]. In fact, the Iluka Beach compartment has prograded over the past 100 years, at a rate of 10.3 m3 m−1 yr−1, with 6 ± 0.5 m3 m−1 yr−1 of sand delivered to the compartment by the Clarence River, and ~4.5 ± 0.5 m3 m−1 yr−1 delivered by dominant northerly longshore sediment transport experienced along the northern NSW coastline [2].
Other studies have shown that beach systems can be composed of a mix of fluvial sediments and shelf marine sand. For example, Tathra and Boydtown Beaches have been found to contain a mixture of marine and fluvial sands, indicating a contribution from the Bega, Nullica and Towamba Rivers to the adjacent beaches, and potentially foredunes ([70,71,72,73]). All the other creeks/rivers associated with this study have no evidence of supplying any significant amounts of bedload to the coast and therefore have very limited influence on the dune progradation [19,74].
Onshore and alongshore sand transport processes are considered to be the major factors contributing to the sediment budget and foredune changes found in NSW [19]. Alongshore transport seems to be the dominant factor controlling sand budgets in the north of the state (especially drift-aligned compartment types), whereas, onshore-offshore sand exchange seems to dominate the sediment transport processes in the central to southern regions of NSW (especially swash-aligned compartments) [19,20].
The prograding foredunes found in northern NSW (i.e., Brunswick Heads, Tallows, Boambee, and Delicate Nobby) (Table 4) could therefore be receiving sand from longshore drift and longshore sand transport processes, including headland sand bypassing [75,76]. It has been shown at Brunswick Heads (especially in the vicinity of Cape Byron) [77,78], Iluka – Woody Bay [2], as well as various other sites within this section of the NSW coast (see [79,80]), that longshore sand transport plays a crucial role in sediment supply. Sand also bypasses around headlands, forming updrift migratory rips that erode beaches, exposing the backshore and foredunes (or even infrastructure) to wave erosion. However, this is generally followed by calmer conditions (i.e., swell waves) which initiate shoreline recovery and accretion [81].
The sites in central to southern NSW (i.e., Nine Mile, Bennett’s, Perkins, Palm, and Boydtown) (Table 4), are bordered by prominent headlands, which obstruct longshore drift, with onshore-offshore sand exchanges as the dominant sediment transport process [19]. Onshore-offshore sand exchange occurs primarily during and following storms when ‘post storm recovery’ takes place (demonstrated by the long-term surveying at Moruya, see Thom and Hall [31], McLean et al. [82], or what was observed at Tathra, Figure 10). Studies by Roy, Cowell, Kinsela, and others at Nine Mile Beach (near Forster) have indicated that offshore sand bodies could be supplying sand to this system, which may also be occurring elsewhere along the coast [17].
When the current progradation rates (Table 4) are compared to those found in other studies, which were over much longer timescales (i.e., geologic; Table 5), some interesting trends can be observed. Table 5 shows that, for Bennett’s Beach, the progradation rate has slowed somewhat, but the cause of the progradation is still offshore sand supplies. Nine Mile Beach is still prograding at a similar rate to what it was 6000 years ago, and despite most of the sand being sourced from the offshore, the sediment supply received from alongshore sources has increased in the past 1500 years (maintaining the uniform progradation rates at the site) [17]. Boydtown Beach, like Nine Mile, has also maintained similar progradation rates to what it has experienced over the past 1500 years (Table 5), and this too can be attributed to predominant inner shelf and shoreface supplies of sand. Several pieces of evidence, however, suggest that the Towamba River has also been supplying additional sediment to the Boydtown dunes in the past ~1500 years and this is reflected in the more rapid progradation rates experienced at the site in recent years (1500 to present; Table 5) [18].
The potential for aeolian sediment transport is also a contributing factor to foredune progradation. All the prograded sites have high potentials for aeolian sediment transport (or RDP) (>18 v.u), so if there is a supply of sand, there is a high chance this sand will make it to the dunes and contribute to foredune development [30,64].
Finally, the presence of engineered structures or human activities (e.g., management, sand mining) can influence the style and rate of progradation. Brunswick Heads (north), Bennett’s (south), and Palm Beach have all been highly impacted by engineered structures/human activities. The entrance to the Brunswick River had twin breakwater walls installed between 1960 and 1962 [83]. These walls created a new headland, resulting in significant accretion and re-alignment of Brunswick Head beach (south of the wall) and erosion on the beach to the north. Within 10 years of the wall installation, the village of Sheltering Palms on the northern side, was devasted by storm wave inundation [83,84]. After the natural sand by-passing established around the training walls in 1987, the beach and dunes to the north re-established, and Brunswick continued to gain sand (Table 4). Bennett’s (south) beach was mined for heavy minerals in the late 1970s and Palm Beach was impacted by the Beach Improvement Program, with dune stabilisation works/management (and vegetation planting) being conducted on the northern foredunes in 1976.
5.2. Stable Shorelines
The foredunes that have remained relatively stable over the past 70 years are those that occur behind predominantly embayed beaches (Table 6). This compartment type is controlled by prominent headlands and in NSW this is usually situated in the more sheltered southern end of the system [67]. These headlands cause refraction into the embayment resulting in a curved shadow zone and a longer straighter beach towards the north (downdrift, if the beach is long enough).
These systems have been termed stable because, on average, their volume has remained within +/−50 m3 m−1 (Table 3), and they have recovered from a number of storm impacts experienced along the NSW coast over the study period. It is also clear that a majority (6 out of 9) of sites are found within leaky compartments (Table 6), where the sediment may be lost to another compartment via headland bypassing [19,75,76], perhaps indicating a balanced budget.
Table 6 lists the stable sites, sorted by decreasing values of dune volume change, to further highlight the spatial variation occurring. Most stable sites are found in the central to southern half of the state, areas that have prominent headlands forming embayed beach compartments.
All the stable sites were found to have moderate potentials for sediment transport (or RDP) (28–5 v.u) (Table 6), indicating sufficient onshore and alongshore winds for intermittent sediment transport and associated dune development.
It has been mentioned previously that adjacent rivers might be delivering sand to some coastal reaches and Tathra, in particular, has been shown to have gained sand from the Bega River (especially during flood events), which may have aided the formation of an incipient foredune over the study period (see Figure 10). It has been hypothesised that the occasional flood events likely deliver sands from upstream and marine sand from the entrance bar (flood tide delta) into the immediate nearshore zone, which could then be reworked onshore during calmer periods by waves (and then potentially to the dunes via favourable winds) [73,87]. Similar conditions and processes that have occurred, and are still occurring, at the nearby Boydtown Beach and the Towamba River (Table 5 and [18]).
5.3. Receding Shorelines
Those beach-foredune environments that have eroded over the past seven decades have retreated landwards and/or reduced in height or width. Table 6 shows the sites that eroded over the study period, which are sorted by increasing values of foredune erosion. There is no clear trend here, as eroded sites were found all along the NSW coastline.
The eroded foredunes are part of either embayed or drift-aligned compartments that have no estuarine features (i.e., creek, estuary) but more importantly are “leaky” and found within compartments that have a more east-northeasterly orientation or shoreline alignment (23–106°) (Table 7). Additionally, all the eroded sites have sufficient potentials for sand transport.
The final column in Table 7 proposes the potential cause for the erosion that has occurred at each site. The overarching cause is that each site is found within a compartment that has a negative sediment budget, which is resulting in beach and foredune retreat. This negative budget could be caused by a range of things, including deficient longshore transport, long-term beach rotation/alignment, the position of beach in the compartment, the beach orientation, obstacles to sand supply, or human impacts (like the installation of river training walls and sand bypassing systems or coastal management programs).
The site that eroded and receded the most was Woody Bay and this site has been the focus of several studies (see Goodwin et al. [2]). It was found that decadal changes in modal wave direction (SE to ESE) impacted the net northward longshore transport along the NSW coast, starving Woody Bay of sand [2,7] (see Table 5). Many coastal compartments rely on this longshore movement of sediment (as inferred earlier) and if altered to a more cross-shore dominance, those with major obstacles fronting the beach system (i.e., rocky reefs) or with no reserves of sediment stored on the lower shoreface (both scenarios occurring at Woody Bay [6]) may experience exacerbated shoreline recession [7]. In addition, the impact of incident storms (especially from the E to NE) may further erode these systems, because instead of storing eroded sands out in the nearshore, for calmer waves to bring it back, they are being lost (or leaked) into downdrift compartments (as is the case for Woody Bay, [2] and Table 5).
The location of beach systems at the southern end of a secondary compartment has also been proposed as a contributing factor to beach and dune erosion [2]. Seven Mile (Lennox Head) and Brunswick South (Byron Bay) have previously been noted as erosional “hot spots” and this study has confirmed this (Table 3). Both of these sites have deficient longshore sediment budgets. Lennox Head is owing to sand trapped by the updrift Ballina river training walls and Byron Bay is probably because of sand loss to the subaqueous spit off Cape Byron [78]. Culburra Beach, on the south coast, is not located in the most southern area of the coastal compartment, but does have a NE orientation, no fluvial features, and has a major barrier to longshore drift occurring just south of it (e.g., the Beecroft Peninsular/headland and Penguin Head immediately south of the beach) [20,69], which is probably causing a deficient longshore sediment budget. The presence of a large rocky reef fronting this whole Culburra system ([88]) could also act as an obstacle to any offshore sand supplies, further exacerbating the deficit sediment budget occurring there.
Those foredunes classified as the “stable-receding 2” type (Table 7, orange colour), even though they have substantially less sand in the system (when compared to past conditions), may still be in a state of recovery (e.g., from the intense storm impacts or sand mining), rather than a deficit (Figure 12B,D). Warilla Beach, for example, may eventually become a stable system, following construction of the Lake Illawarra entrance training walls and the recent beach nourishment (2001 and 2007). The dunes have sequestered the nourished sand into the northern vegetated foredunes (Figure 12) (also see [89] for more information on Warilla Beach). The southern section has recently had the buried seawall exposed again, following an intense storm event in 2016 (described in [33]).
5.4. Comparison with Wider Classifications, Conceptual Models, and Studies
5.4.1. Barrier Types
Several interesting correlations can be observed when comparing the geologic evolutionary trends of each site, particularly in relation to barrier type (as introduced in Table 2; i.e., prograded, stationary, or receded), although they still do not clearly explain the spatial nature of the foredune behaviours occurring in NSW. Table 8 shows each study site with its appropriate barrier type and resultant decadal foredune behaviour. It is clear that the majority of the prograded barriers continued gaining sand over the study period, with the exception of Brunswick Heads south, Bonville, and Ocean- Umina. It is also interesting to note that the sites that form part of prograded barriers accreted by extending seaward through the deposition of incipient foredunes, even at some sites that were deemed stable (i.e., Tathra and Merimbula). These progradational systems still formed new incipient dunes over the study period (Table 8 and Figure 10), despite not gaining large amounts of sand overall.
Those sites that form part of stationary barriers were all generally stable over the decadal study period (Table 8). Three stationary barrier sites prograded over the study period and, interestingly, they only accreted by growing vertically in place (see Palm Beach for example, Figure 8). The sites that were part of receded barriers all typically receded or remained stable over the decadal study period, with one exception, Delicate Nobby. Delicate Nobby prograded over this study, by building vertically and then extending seaward with the deposition of an incipient foredune.
These findings indicate that barrier type might be an important feature contributing to the foredune evolutionary behaviours experienced over the past 70 years. The conditions that were present during the barrier development may still be apparent and impacting how foredunes currently develop in NSW. For example, prograded barriers may still have stores of sand in the offshore, which are still being reworked onto the coast, while receded barriers may be in settings that are no longer receiving a supply of sand. To really discover what is causing these beach-foredune behaviors in NSW, very detailed studies are required at each individual system, including both onshore and offshore investigations, as well as how sediment moves laterally along the coast.
5.4.2. Foredune Conceptual Model and Other Studies
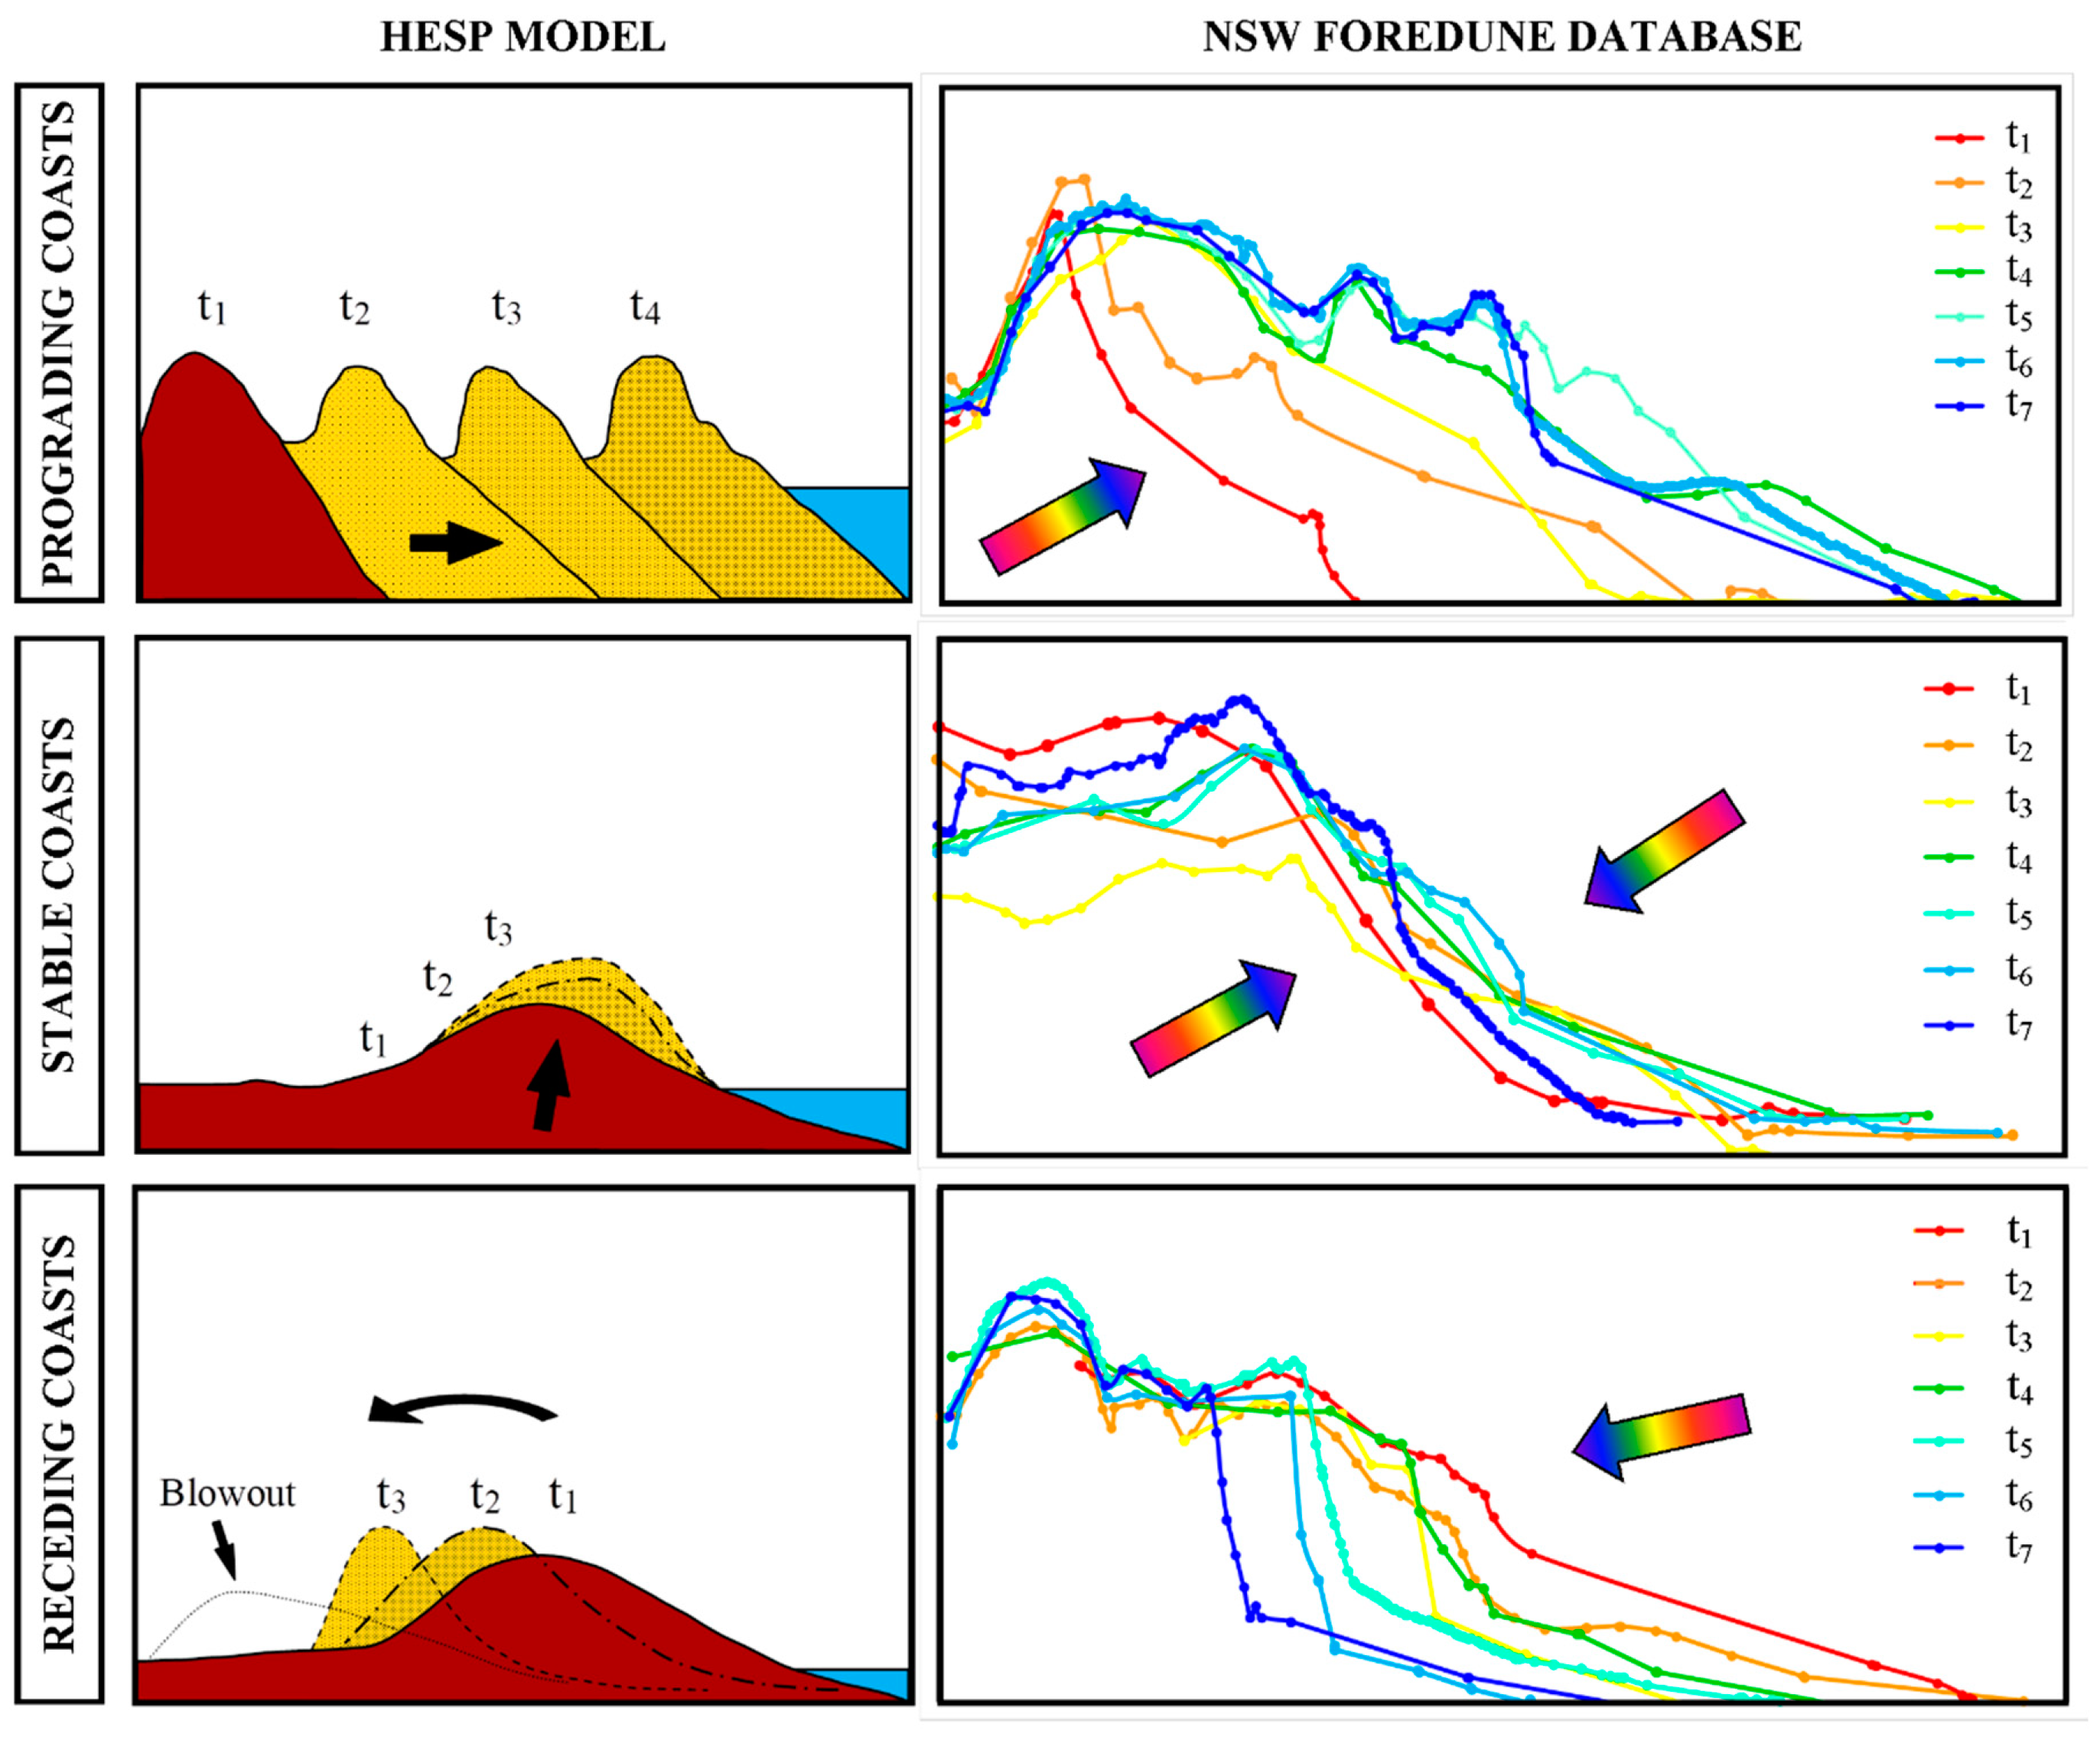
The foredune behaviour, observed within this study, generally conformed to the evolutionary styles proposed in the conceptual model produced by Hesp [14], and illustrated in Figure 1. Foredunes found on prograding coastlines extended seaward as incipient foredunes and/or grew vertically in place. Stable foredunes were those that remained within +/−50 m3 m−1 of their initial volume and managed to slowly recover from storm impacts. Those foredunes in recession have retreated landwards and/or have reduced in height or width. Upon closer examination of the conceptual model and the observed dune behaviours, some subtle differences can be seen and these are illustrated in Figure 13.
For prograding shorelines (top row, Figure 13), foredunes were found to build vertically (top right side, t1–t3), until a particular height (or volume) was reached, then extended seaward as an incipient dune/s (top right, t4–t7). This transition period, from building vertically to laterally seaward, has been attributed to a change in littoral sediment supply, sea level, beach progradation, and/or vegetation controls (i.e., cover, species) [30]. Intermittent storm impacts can interrupt these progradation behaviours (right, t5–t6), but with sufficient sediment supply to the beach, as well as favorable wind and wave conditions, the dune accretion has continued, as observed at Brunswick Heads Beach (North) (Figure 6), Tathra Beach (Figure 10), Bengello Beach [32], Boydtown and Wonboyn Beach [18], and Long Beach Peninsula foredunes (USA) [3,90].
Dune behaviour on stable coastlines is less well understood and in NSW, generally, the dune volume fluctuated around a constant value, eroding during storm events, and then recovering, but at a slower rate. In contrast to the Hesp model (Figure 1), dune changes generally occurred within the incipient foredune (Figure 13, center row), however there were cases where the established dune also changed morphology too (see Figure 13, middle row, right side, t3–t7). During storm events the incipient dune would erode back, sometimes to the foot of the established dune (right, t2–t3 or t6–t7), while during recovery phases, the incipient dune was rebuilt (right, t3–t6) and/or the established dune recovered vertically (see Figure 13, middle row). Similar foredune behaviour has been observed in Canada (see Figure 4 in [30]), with an established foredune system maintaining a stable volume and recovering from intermittent storm impacts, but this system generally recovered vertically, rather than depositing an incipient dune seaward.
Those foredunes found on receding coastlines in NSW deviated the most from the styles outlined in the Hesp model. Rather than the established dune crest migrating landwards (as shown in Figure 1d,e and Figure 13, bottom left), the receding dunes observed in this study remained stationary. The incipient dune was generally lost first (bottom right side, t1–t3), then the erosion slowly continued into the established dune, reducing the foredune width (bottom right, t3–t7). This was the case for both foredunes that had human settlement directly behind the established dune and those found with a more natural hind dune zone (i.e., nothing obstructing the landward migration of the established dune but vegetation). Continual monitoring of these receding sites would be needed to determine if a blowout would form once the foredune reached a critical eroded limit. In addition to monitoring receding sites, several sites from all the foredune behaviours could be investigated in much more detail, including major on- and offshore studies, to understand not only how the foredunes are changing, but also what is causing those changes.
6. Conclusions
NSW foredunes have undergone some significant changes over time. This study has shown how, over the past seventy years, NSW foredunes have exhibited considerable spatial variation, ranging from accretion/aggradation to recession. Many of these changes are in response to natural processes, whereas others are direct impacts from human actions. The various foredune behaviours did have a clear spatial distribution, where the prograded sites tended to occur in the north-central areas of the state, whereas the stable systems were generally found in the southern regions. The receding sites had no spatial distribution and more detailed investigations should occur to determine what might be causing this behaviour.
Foredunes that prograded/accreted over the study period have predominantly extended seaward as new incipient foredunes, rather than growing vertically in place. They gained a maximum of 235 m3 m−1 of sand volume over the study period, which equates to a rate of 2.5 m3 m−1 y−1 (FVCR). The potential for sediment transport at each site ranged from 18–133 v.u. The majority of the prograded sites occur in the northern part of the state and are found within closed drift- or swash-aligned sediment compartments. This indicates that longshore and/or offshore supplies of sand could be playing larger roles in supplying sand to the beachface, which is then transported into the dunes at these sites.
The foredunes that have remained stable over the past 70 years are those that, on average, have remained within +/−50 m3 m−1 of their starting volume, which equates to roughly +/−1.5 m3 m−1 y−1 (FVCR), and have recovered from various storm impacts experienced along the NSW coast over the study period. The majority of these sites occur behind embayed beaches and are found within leaky sediment compartments, or those that have estuarine sinks. Most of these sites are found within the central to southern half of the state, which are areas that commonly have headlands present to form embayed beach compartments.
Those foredune environments that have eroded over time have retreated landwards and/or reduced in height or width. Over the study period, sites lost up to −437 m3 m−1 of sand volume, which equates to a maximum erosion rate of −6.3 m3 m−1 y−1 (FVCR). There was no clear spatial trend occurring for receded sites, as they were found all along the NSW coastline. There were some that were found in compartments that had a more east-northeasterly orientation (e.g., 23–71°), were the southernmost beach in a secondary compartment, were in the negative phase of beach rotation and had obstacles to sand supply (i.e., rocky reefs), or were being impacted by humans (i.e., the installation of river training walls and sand bypassing systems or coastal management programs). There was no single cause identified. Overall, this study has shown that NSW foredunes have undergone substantial recent changes and, by understanding their past history, will provide better insight into how they can be managed into the future.
Author Contributions
T.B.D. and C.D.W. conceived the overall concept and approach of this study. T.B.D. lead the design and development of the methodology and carried out the GIS analysis. C.D.W. and P.R. contributed to the validation of the methods. T.B.D. prepared the original draft manuscript with input from all co-authors. A.D.S., P.R., and C.D.W. also contributed to various manuscript revisions and editing until the final version was created.
Funding
This research has been conducted with the support of an Australian Government Research Training Program Scholarship, as well as a top-up scholarship from the Global Challenges Program (University of Wollongong).
Acknowledgments
The authors gratefully acknowledge the NSW State Government Agency, Land and Property Information, for acquiring and supplying the airborne LiDAR data, as well as the NSW State Government Agency, Office of Environment and Heritage (OEH), for generating and supplying the raw photogrammetric data and historic aerial photography used in this study. We would like to acknowledge Dave Hanslow and Bob Clout (OEH Photogrammetrist) for assistance with photogrammetry and access to the OEH Aerial Photo Library in Newcastle, NSW. We would also like to acknowledge Heidi Brown (Spatial Officer from UoW) for providing guidance on automatic programming of GIS procedures within ArcGIS, Graziela Miot da Silva for assistance with wind data analyses and sand rose creation, and the three anonymous journal reviewers for detailed, insightful, and constructive comments that greatly improved the manuscript.
Conflicts of Interest
The authors declare no conflict of interest. The funding bodies had no major role in the design of the study; in the collection, analyses, or interpretation of data; in the writing of the manuscript, and in the decision to publish the results.
Appendix A

Table A1.
Aerial photo records and detailed dates.
| BCH No. (NSW): | BEACH NAME: | GEO. REGION: | PHOTOGRAMMETRIC OBSERVATIONS: | LiDAR (LPI) | HISTORIC AERIAL PHOTOS |
|---|---|---|---|---|---|
| 2 | Letitia Spit | Far North | 14 10 07 04 99 85 71 62 47 | 06.03.2014 | 06.07.2014 |
| 12.03.2007 | |||||
| 21.07.1999 | |||||
| 26.02.1985 | |||||
| 10.05.1971 | |||||
| 01.08.1962 | |||||
| 04.01.1955 | |||||
| 27.05.1947 | |||||
| 11 | Brunswick Hds - North | Far North | 13 10 07 99 94 91 87 84 83 76 74 73 71 66 58 54 47 | 28.08.2010 | 06.09.2012 |
| 11 | Brunswick Hds - South | 13 12 10 07 04 99 96 94 91 87 77 73 58 47 | 11.01.2010 | ||
| 26.06.2004 | |||||
| 19.05.1994 | |||||
| 21.07.1991 | |||||
| 06.08.1987 | |||||
| 31.08.1984 | |||||
| 02.12.1976 | |||||
| 30.07.1974 | |||||
| 17.04.1973 | |||||
| 22.09.1966 | |||||
| 12.10.1958 | |||||
| 27.05.1947 | |||||
| 16 | Tallows | Far North | 13 12 10 04 99 84 76 73 66/67 58 | 28.08.2010 | 11.01.2010 |
| 05.09.1999 | |||||
| 31.08.1984 | |||||
| 03.06.1973 | |||||
| 10.02.1966 | |||||
| 27.05.1947 | |||||
| 21 | Seven Mile (Lennox Hd) | Far North | 13 99 94 91 83 76 67 58 47 | 26.06.2010 | 05.09.1999 |
| 12.06.1994 | |||||
| 21.07.1991 | |||||
| 27.07.1981 | |||||
| 02.12.1976 | |||||
| 29.05.1967 | |||||
| 22.10.1958 | |||||
| 27.05.1947 | |||||
| 36 | Woody Bay | Far North | 10 06 04 00 96 90 87 79 73 71 69 66 58 42 | 19.03.2010 | 11.01.2010 |
| 10.08.2000 | |||||
| 30.06.1996 | |||||
| 01.01.1987 | |||||
| 23.03.1979 | |||||
| 20.06.1971 | |||||
| 24.08.1966 | |||||
| 11.07.1958 | |||||
| 20.08.1942 | |||||
| 83 | Corindi/Arrawarra - North | Mid-North | 06 96 81 74 73 64 | 21.09.2013 | 26.11.2006 |
| 83 | Corindi/Arrawarra - South | 93 88 83 81 74 64 56 43 | 28.07.2004 | ||
| 17.06.1993 | |||||
| 09.05.1988 | |||||
| 26.10.1981 | |||||
| 23.06.1974 | |||||
| 12.08.1964 | |||||
| 26.04.1956 | |||||
| 11.03.1943 | |||||
| 85 | Ocean View | Mid-North | 04 00 96 93 88 81 74 73 64 56 43 | 21.09.2013 | 26.07.2004 |
| 17.05.2000 | |||||
| 17.06.1993 | |||||
| 09.05.1988 | |||||
| 21.05.1974 | |||||
| 12.08.1964 | |||||
| 26.04.1956 | |||||
| 11.03.1943 | |||||
| 113 | Boambee - whole Bch | Mid-North | 93 86 77 69 42 | 21.09.2013 | 04.05.2013 |
| 113 | Boambee - North | 13 07 04 00 96 93 86 74 73 69 42 | 11.01.2007 | ||
| 28.06.1996 | |||||
| 31.08.1983 | |||||
| 01.01.1981 | |||||
| 01.01.1974 | |||||
| 06.04.1969 | |||||
| 04.05.1954 | |||||
| 23.04.1942 | |||||
| 115 | Bonville | Mid-North | 07 96 81 74 73 64 | 17.12.2009 | 11.01.2007 |
| 28.06.1996 | |||||
| 04.11.1980 | |||||
| 21.05.1974 | |||||
| 01.08.1964 | |||||
| 04.05.1954 | |||||
| 154 | Delicate Nobby | Mid-North | 09 00 96 88 81 72 67 | 02.11.2009 | 12.12.2009 |
| 15.05.2000 | |||||
| 31.05.1996 | |||||
| 23.04.1988 | |||||
| 29.06.1981 | |||||
| 02.12.1976 | |||||
| 06.04.1974 | |||||
| 30.06.1972 | |||||
| 01.01.1967 | |||||
| 04.11.1942 | |||||
| 195 | Nine Mile (Tuncurry) | Central Coast | 13 08 01 94 86 80 74 72 63 | 18.08.2012 | 21.04.2006 |
| 24.09.2001 | |||||
| 18.09.1999 | |||||
| 08.02.1997 | |||||
| 22.06.1994 | |||||
| 22.06.1986 | |||||
| 13.01.1980 | |||||
| 08.08.1974 | |||||
| 24.09.1972 | |||||
| 01.11.1963 | |||||
| 01.10.1952 | |||||
| 204 | Seven Mile (Booti) | Central Coast | 08 97 86 73 63 | 09.06.2013 | 27.05.2008 |
| 24.09.2001 | |||||
| 18.09.1999 | |||||
| 22.08.1997 | |||||
| 22.06.1986 | |||||
| 05.07.1980 | |||||
| 26.11.1977 | |||||
| 12.05.1973 | |||||
| 09.09.1972 | |||||
| 01.11.1963 | |||||
| 01.09.1952 | |||||
| 223 | Bennett’s - North | Central Coast | 08 06 01 96 91 86 80 72 | 18.08.2012 | 05.12.2012 |
| 223 | Bennett’s - South | 13 08 01 94 83 74 63 51 | |||
| 297 | Ocean - Umina | Central Coast | 11 08 01 96 93 86 78 77 74 71 70 64 61 41 | 10.05.2011 | 13.09.2011 |
| 02.05.2008 | |||||
| 30.05.1996 | |||||
| 01.01.1986 | |||||
| 01.01.1978 | |||||
| 01.01.1974 | |||||
| 01.01.1964 | |||||
| 01.01.1941 | |||||
| 300 | Palm Beach | Central Coast | 11 08 01 96 88 79 74 70 65 51 | 13.05.2011 | 31.12.2011 |
| 03.07.2008 | |||||
| 13.09.2001 | |||||
| 30.05.1996 | |||||
| 10.03.1988 | |||||
| 14.04.1979 | |||||
| 19.06.1974 | |||||
| 23.09.1965 | |||||
| 01.05.1951 | |||||
| 01.01.1941 | |||||
| 314 | Dee Why | Central Coast | 01 99 96 90 85 76 74 65 61 | 10.04.2013 | 09.09.2001 |
| 20.06.1999 | |||||
| 19.04.1993 | |||||
| 18.08.1986 | |||||
| 19.06.1974 | |||||
| 08.06.1961 | |||||
| 01.05.1951 | |||||
| 366 | Bulli | South | 05 93 84 74 72 61 | 24.04.2013 | 19.01.2005 |
| 20.05.1993 | |||||
| 24.10.1984 | |||||
| 19.06.1974 | |||||
| 01.07.1972 | |||||
| 14.07.1961 | |||||
| 01.05.1951 | |||||
| 379 | Perkins/Windang | South | 14 07 99 88 74 61 | 24.04.2013 | 11.10.2014 |
| 24.03.2007 | |||||
| 20.02.1999 | |||||
| 09.03.1988 | |||||
| 29.12.1974 | |||||
| 07.07.1961 | |||||
| 19.12.1948 | |||||
| 380 | Warilla | South | 14 11 07 01 88 82 74 73 66 61 48 | 08.03.2011 | 11.10.2014 |
| 13.05.2011 | |||||
| 24.03.2007 | |||||
| 15.04.2001 | |||||
| 20.02.1999 | |||||
| 01.01.1988 | |||||
| 29.03.1974 | |||||
| 07.07.1961 | |||||
| 11.01.1955 | |||||
| 23.10.1948 | |||||
| 389 | Bombo | South | 14 01 96 93 86 79 71 63 48 | 08.03.2011 | 11.10.2014 |
| 13.05.2011 | |||||
| 15.04.2001 | |||||
| 23.07.1996 | |||||
| 29.01.1993 | |||||
| 21.04.1986 | |||||
| 29.06.1981 | |||||
| 28.07.1977 | |||||
| 29.12.1974 | |||||
| 27.11.1971 | |||||
| 06.07.1950 | |||||
| 06.06.1949 | |||||
| 402 | Culburra | South | 14 05 93 78 69 61 49 | 17.12.2010 | 19.01.2005 |
| 01.05.1993 | |||||
| 07.03.1984 | |||||
| 30.07.1978 | |||||
| 29.12.1974 | |||||
| 08.01.1969 | |||||
| 21.09.1961 | |||||
| 04.04.1949 | |||||
| 633 | Cauttagee | Far South | 14 11 07 01 99 93 88 86 80 79 77 71 63 44 | 27.03.2013 | 10.01.2014 |
| 15.05.2011 | |||||
| 31.03.2001 | |||||
| 02.05.1993 | |||||
| 24.10.1988 | |||||
| 30.09.1980 | |||||
| 26.11.1977 | |||||
| 23.03.1971 | |||||
| 18.09.1963 | |||||
| 12.02.1944 | |||||
| 659 | Tathra | Far South | 14 11 07 99 93 88 80 75 72 66 57 44 | 13.03.2013 | 12.01.2014 |
| 15.05.2011 | |||||
| 27.03.2007 | |||||
| 02.05.1993 | |||||
| 24.10.1988 | |||||
| 21.12.1980 | |||||
| 08.09.1975 | |||||
| 24.05.1966 | |||||
| 01.05.1957 | |||||
| 03.03.1944 | |||||
| 671 | Merimbula/Pambula | Far South | 14 11 07 01 93 89 79 77 75 72 62 | 13.03.2013 | 10.01.2014 |
| 16.05.2011 | |||||
| 27.03.2007 | |||||
| 02.05.1993 | |||||
| 28.02.1989 | |||||
| 29.01.1979 | |||||
| 08.09.1975 | |||||
| 23.07.1962 | |||||
| 692 | Boydtown | Far South | 14 11 07 99 86 79 64 | 11.03.2013 | 10.01.2014 |
| 27.03.2007 | |||||
| 26.01.1999 | |||||
| 19.05.1993 | |||||
| 03.09.1986 | |||||
| 24.01.1979 | |||||
| 06.04.1964 |
References
- Bird, E. Coastline Changes: A Global Review; Wiley: Chichester, UK, 1985. [Google Scholar]
- Goodwin, I.D.; Stables, M.A.; Olley, J.M. Wave climate, sand budget and shoreline alignment evolution of the Iluka-Woody Bay sand barrier, northern New South Wales, Australia, since 3000 yr BP. Mar. Geol. 2006, 226, 127–144. [Google Scholar] [CrossRef]
- Ruggiero, P.; Kaminsky, G.M.; Gelfenbaum, G.; Cohn, N. Morphodynamics of prograding beaches: A synthesis of seasonal- to century-scale observations of the Columbia River littoral cell. Mar. Geol. 2016, 376, 51–68. [Google Scholar] [CrossRef] [Green Version]
- Houston, J.R.; Dean, R.G. Shoreline Change on the East Coast of Florida. J. Coast. Res. 2014, 30, 647–660. [Google Scholar]
- Bruun, P. Sea-level rise as a cause of shore erosion. J. Waterw. Harb. Div. Proc. Am. Soc. Civ. Eng. 1962, 88, 117–130. [Google Scholar]
- Cowell, P.J.; Stive, M.J.F.; Roy, P.S.; Kaminsky, G.M.; Buijsman, M.C.; Thom, B.G.; Wright, L.D. Shoreface sand supply to beaches. In Proceedings of the Proceedings 27th International Conference on Coastal Engineering (ASE), Sydney, Australia, 16–21 July 2000; pp. 2495–2508. [Google Scholar]
- Mortlock, T.R.; Goodwin, I.D. Directional wave climate and power variability along the Southeast Australian shelf. Cont. Shelf Res. 2015, 98, 36–53. [Google Scholar] [CrossRef]
- Zarnetske, P.L.; Ruggiero, P.; Seabloom, E.W.; Hacker, S.D. Coastal foredune evolution: The relative influence of vegetation and sand supply in the US Pacific Northwest. J. R. Soc. Interface 2015, 12, 20150017. [Google Scholar] [CrossRef] [PubMed]
- Hanslow, D.J. Beach erosion trend measurement: A comparison of trend indicators. J. Coast. Res. 2007, 50, 588–593. [Google Scholar]
- Woodroffe, C.D.; Cowell, P.J.; Callaghan, D.P.; Ranasinghe, R.; Jongejan, R.; Wainwright, D.J.; Barry, S.J.; Rogers, K.; Dougherty, A.J.; Facility, N.C.C.A.R. Approaches to Risk Assessment on Australian Coasts: A Model Framework for Assessing Risk and Adaptation to Climate Change on Australian Coasts; National Climate Change Adaption Research Facility: Gold Coast, Australia, 2012. [Google Scholar]
- Short, A.D. Australian Beach Systems-Nature and Distribution. J. Coast. Res. 2006, 22, 11–27. [Google Scholar] [CrossRef]
- Stockdon, H.F.; Sallenger, A.H.; Holman, R.A.; Howd, P.A. A simple model for the spatially-variable coastal response to hurricanes. Mar. Geol. 2007, 238, 1–20. [Google Scholar] [CrossRef]
- Silva, R.; Martinez, M.L.; Oderiz, I.; Mendoza, E.; Feagin, R.A. Response of vegetated dune-beach systems to storm conditions. Coast. Eng. 2016, 109, 53–62. [Google Scholar] [CrossRef]
- Hesp, P.A. Foredunes and blowouts: Initiation, geomorphology and dynamics. Geomorphology 2002, 48, 245–268. [Google Scholar] [CrossRef]
- Roy, P.S.; Cowell, P.J.; Ferland, M.A.; Thom, B.G. Wave-dominated Coasts. In Coastal Evolution: Late Quaternary Shoreline Morphodynamics; Carter, W.G., Woodroffe, C.D., Eds.; Cambridge University Press: Cambridge, UK, 1994; pp. 121–186. [Google Scholar]
- Cowell, P.J.; Roy, P.S.; Jones, R.A. Simulation of large-scale coastal change using a morphological behaviour model. Mar. Geol. 1995, 126, 45–61. [Google Scholar] [CrossRef]
- Kinsela, M.A.; Daley, M.J.A.; Cowell, P.J. Origins of Holocene coastal strandplains in Southeast Australia: Shoreface sand supply driven by disequilibrium morphology. Mar. Geol. 2016, 374, 14–30. [Google Scholar] [CrossRef]
- Oliver, T.S.N.; Tamura, T.; Hudson, J.P.; Woodroffe, C.D. Integrating millennial and interdecadal shoreline changes: Morpho-sedimentary investigation of two prograded barriers in southeastern Australia. Geomorphology 2017, 288, 129–147. [Google Scholar] [CrossRef] [Green Version]
- Thom, B.G.; Eliot, I.; Eliot, M.; Harvey, N.; Rissik, D.; Sharples, C.; Short, A.D.; Woodroffe, C.D. National sediment compartment framework for Australian coastal management. Ocean Coast. Manag. 2018, 154, 103–120. [Google Scholar] [CrossRef] [Green Version]
- Chapman, D.M.; Geary, M.; Roy, P.S.; Thom, B.G. Coastal Evolution and Coastal Erosion in New South Wales; Coastal Council of New South Wales: Sydney, Australia, 1982.
- Woodroffe, C.D.; Murray-Wallace, C.V. Sea-level rise and coastal change: The past as a guide to the future. Quat. Sci. Rev. 2012, 54, 4–11. [Google Scholar] [CrossRef]
- Psuty, N.P. Spatial variation in coastal foredune development. In Coastal Dunes: Geomorphology, Ecology, and Management for Conservation; Carter, R.W.G., Curtis, T.G.F., Sheehy-Skeffington, M.J., Eds.; Balkema: Rotterdamn, The Netherlands, 1992; pp. 3–13. [Google Scholar]
- Arens, S.M.; Wiersma, J. The Dutch foredunes: Inventory and classification. J. Coast. Res. 1994, 10, 189–202. [Google Scholar]
- Trenhaile, A.S. Sand Dunes. In Coastal Dynamics and Landforms; Trenhaile, A.S., Ed.; Clarendon Press: Oxford, UK, 1997; pp. 143–169. [Google Scholar]
- Hesp, P.A. The Beach Backshore and beyond. In Handbook of Beach and Shoreface Morphodynamics; Short, A.D., Ed.; Wiley: London, UK, 1999; pp. 145–170. [Google Scholar]
- Hesp, P.A. Morphology, Dynamics and Internal Stratification of some Established Foredunes in Southeast Australia. Sediment. Geol. 1988, 55, 17–41. [Google Scholar] [CrossRef]
- Ruggiero, P.; Mull, J.; Zarnetske, P.; Hacker, S.; Seabloom, E. Interannual to Decadal Foredune Evolution. In Proceedings of the Coastal Sediments 2011, Miami, FL, USA, 2–6 May 2011; Wang, P., Rosati, J., Roberts, T., Eds.; World Scientific Publishing Company: Miami, FL, USA, 2011; pp. 698–711. [Google Scholar]
- Corbau, C.; Simeoni, U.; Melchiorre, M.; Rodella, I.; Utizi, K. Regional variability of coastal dunes observed along the Emilia-Romagna littoral, Italy. Aeolian Res. 2015, 18, 169–183. [Google Scholar] [CrossRef] [Green Version]
- Keijsers, J.G.S.; Poortinga, A.; Riksen, M.J.P.M.; Maroulis, J. Spatio-temporal variability in accretion and erosion of coastal foredunes in the Netherlands: Regional climate and local topography. PLoS ONE 2014, 9, e91115. [Google Scholar] [CrossRef]
- Davidson-Arnott, R.; Hesp, P.; Ollerhead, J.; Walker, I.; Bauer, B.; Delgado-Fernandez, I.; Smyth, T. Sediment Budget Controls on Foredune Height: Comparing Simulation Model Results with Field Data. Earth Surf. Process. Landf. 2018, 43, 1798–1810. [Google Scholar] [CrossRef]
- Thom, B.G.; Hall, W. Behaviour of beach profiles during accretion and erosion dominated periods. Earth Surf. Process. Landf. 1991, 16, 113–127. [Google Scholar] [CrossRef]
- McLean, R.; Shen, J.S. From Foreshore to Foredune: Foredune Development Over the Last 30 Years at Moruya Beach, New South Wales, Australia. J. Coast. Res. 2006, 22, 28–36. [Google Scholar] [CrossRef]
- Harley, M.D.; Turner, I.L.; Kinsela, M.A.; Middleton, J.H.; Mumford, P.J.; Splinter, K.D.; Phillips, M.S.; Simmons, J.A.; Hanslow, D.J.; Short, A.D. Extreme coastal erosion enhanced by anomalous extratropical storm wave direction. Sci. Rep. 2017, 7, 6033. [Google Scholar] [CrossRef] [PubMed]
- Turner, I.L.; Harley, M.D.; Short, A.D.; Simmons, J.A.; Bracs, M.A.; Phillips, M.S.; Splinter, K.D. A multi-decade dataset of monthly beach profile surveys and inshore wave forcing at Narrabeen, Australia. Sci. Data 2016, 3, 160024. [Google Scholar] [CrossRef] [PubMed]
- Hesp, P.A. A 34 year record of foredune evolution, Dark Point, NSW, Australia. J. Coast. Res. 2013, 65, 1295–1300. [Google Scholar] [CrossRef]
- Chen, K.; McAneney, J. High-resolution estimates of Australia’s coastal population. Geophys. Res. Lett. 2006, 33. [Google Scholar] [CrossRef]
- Roy, P.S.; Thom, B.G.; Wright, L.D. Holocene sequences on an embayed high-energy coast: An evolutionary model. Sediment. Geol. 1980, 26, 1–19. [Google Scholar] [CrossRef]
- Thom, B.G. Transgressive and regressive stratigraphies of coastal sand barriers in southeast Australia. Mar. Geol. 1984, 56, 137–158. [Google Scholar] [CrossRef]
- Roy, P.S.; Thom, B.G. Late Quaternary marine deposition in New South Wales and southern Queensland—An evolutionary model. J. Geol. Soc. Aust. 1981, 28, 471–489. [Google Scholar] [CrossRef]
- Langford-Smith, T.; Thom, B.G. Coastal morphology of New South Wales. J. Geol. Soc. Aust. 1969, 16, 572–580. [Google Scholar]
- Davies, J.L. The coastal sediment compartment. Aust. Geogr. Stud. 1974, 12, 139–151. [Google Scholar] [CrossRef]
- Doyle, T.B. Foredune Morphodynamics in New South Wales, Australia. Ph.D. Thesis, University of Wollongong, Wollongong, Australia, 2019. [Google Scholar]
- Phillips, M.S.; Harley, M.D.; Turner, I.L.; Splinter, K.D.; Cox, R.J. Shoreline recovery on wave-dominated sandy coastlines: The role of sandbar morphodynamics and nearshore wave parameters. Mar. Geol. 2017, 385, 146–159. [Google Scholar] [CrossRef]
- Short, A.D. Beaches of the New South Wales Coast, 2nd ed.; Sydney University Press: Sydney, Australia, 2007. [Google Scholar]
- Harley, M.D.; Turner, I.L.; Short, A.D.; Ranasinghe, R. Assessment and integration of conventional, RTK-GPS and image-derived beach survey methods for daily to decadal coastal monitoring. Coast. Eng. 2011, 58, 194–205. [Google Scholar] [CrossRef]
- Doyle, T.B.; Woodroffe, C.D. The application of LiDAR to investigate foredune morphology and vegetation. Geomorphology 2018, 303, 106–121. [Google Scholar] [CrossRef]
- Moore, L.J. Shoreline mapping techniques. J. Coast. Res. 2000, 16, 111–124. [Google Scholar]
- Hanslow, D.J.; Clout, B.; Evans, P.; Coates, B. Monitoring Coastal Change Using Photogrammetry. In Proceedings of the Second Joint Conference, Institute of Australian Geographers and New Zealand Geographical Society, Hobart, Australia, 28–31 January 1997; Bliss, E., Ed.; New Zealand Geographical Society Conference Series: Hobart, Australia, 1997; Volume 19, pp. 422–426. [Google Scholar]
- Boak, E.H.; Turner, I.L. Shoreline Definition and Detection: A Review. J. Coast. Res. 2005, 21, 688–703. [Google Scholar] [CrossRef]
- Moore, L.J.; Ruggiero, P.; List, J.H. Comparing mean high water and high water line shorelines: Should proxy-datum offsets be incorporated into shoreline change analysis? J. Coast. Res. 2006, 22, 894–905. [Google Scholar] [CrossRef]
- Ruggiero, P.; List, J.H. Improving Accuracy and Statistical Reliability of Shoreline Position and Change Rate Estimates. J. Coast. Res. 2009, 255, 1069–1081. [Google Scholar] [CrossRef]
- Zhang, J.; Goodchild, M. Uncertainty in Geographical Information; Taylor & Francis Ltd.: New York, NY, USA, 2002. [Google Scholar]
- Dawson, J.L.; Smithers, S.G. Shoreline and beach volume change between 1967–2007 at Raine Island, Great Barrier Reef, Australia. Glob. Planet. Chang. 2010, 72, 141–154. [Google Scholar] [CrossRef]
- Pardo-Pascual, J.E.; Garcia-Asenjo, P. New Methods and Tools to analyze beach-dune system evolution using a Real-Time Kinematic Global Positioning System and Geographic Information Systems. J. Coast. Res. 2005, 34–39. [Google Scholar]
- Hesp, P.A. A review of biological and geomorphological processes involved in the initiation and development of incipient foredunes. Proc. R. Soc. Edinb. Sect. B Biol. Sci. 1989, 96, 181–201. [Google Scholar] [CrossRef]
- Seabloom, E.W.; Wiedemann, A.M. Distribution and Effects of Ammophila breviligulata Fern. (American beachgrass) on the Foredunes of the Washington Coast. J. Coast. Res. 1994, 10, 178–188. [Google Scholar]
- Hacker, S.D.; Zarnetske, P.; Seabloom, E.; Ruggiero, P.; Mull, J.; Gerrity, S.; Jones, C. Subtle differences in two non-native congeneric beach grasses significantly affect their colonization, spread, and impact. Oikos 2012, 121, 138–148. [Google Scholar] [CrossRef]
- Zarnetske, P.L.; Hacker, S.D.; Seabloom, E.W.; Ruggiero, P.; Killian, J.R.; Maddux, T.B.; Cox, D. Biophysical feedback mediates effects of invasive grasses on coastal dune shape. Ecology 2012, 93, 1439–1450. [Google Scholar] [CrossRef] [PubMed]
- Thom, B.G. Coastal erosion in eastern Australia. Search 1974, 5, 198–209. [Google Scholar] [CrossRef]
- Bryant, E.A.; Kidd, R. Beach Erosion, May–June, 1974, Central and South Coast, NSW. Search 1975, 6, 511–513. [Google Scholar]
- Clarke, D.J.; Eliot, I.G. Low-frequency changes of sediment volume on the beachface at Warilla Beach, New South Wales, 1975–1985. Mar. Geol. 1988, 79, 189–211. [Google Scholar] [CrossRef]
- Fryberger, S.G.; Dean, G. Dune forms and wind regime. In A Study of Global Sand Seas; McKee, E.D., Ed.; Geological Survey Prof. Paper, 1052; US Govt. Printing Office: Washington, DC, USA, 1979; pp. 137–170. [Google Scholar]
- Pearce, K.I.; Walker, I.J. Frequency and magnitude biases in the “Fryberger” model, with implications for characterizing geomorphically effective winds. Geomorphology 2005, 68, 39–55. [Google Scholar] [CrossRef]
- Miot da Silva, G.; Hesp, P. Coastline orientation, aeolian sediment transport and foredune and dunefield dynamics of Moçambique Beach, Southern Brazil. Geomorphology 2010, 120, 258–278. [Google Scholar] [CrossRef]
- Arens, S.M.; Van Kaam-Peters, H.M.E.; Van Boxel, J.H. Air flow over foredunes and implications for sand transport. Earth Surf. Process. Landf. 1995, 20, 315–332. [Google Scholar] [CrossRef] [Green Version]
- Davies, J.L. Geographical Variation in Coastal Development, 2nd ed.; Longman: London, UK, 1980. [Google Scholar]
- Woodroffe, C.D. Coasts—Form, Process and Evolution; Cambridge University Press: Cambridge, UK, 2003. [Google Scholar]
- Short, A.D. Role of geological inheritance in Australian beach morphodynamics. Coast. Eng. 2010, 57, 92–97. [Google Scholar] [CrossRef]
- Carvalho, R.C.; Woodroffe, C.D. From catchment to inner shelf: Insights into NSW coastal compartments. In Proceedings of the 24th NSW Coastal Conference 2015, Forster, NSW, Australia, 11–13 November 2015; pp. 1–14. [Google Scholar]
- PWD. Tathra Erosion Study; Report No. PWD 79015; Department of Public Works Coastal Engineering Branch: Sydney, Australia, 1980.
- Hudson, J.P. Late Quaternary Evolution of Twofold Bay, Southern New South Wales; Masters of Science, University of Sydney: Sydney, Australia, 1991. [Google Scholar]
- Coast and Marine Geosciences. Bega River Estuary Sediment Study; Coastal & Marine Geosciences in Association with Environmental Sciences & Engineering P/L Consultants: Bega, Australia, 1999.
- Jorissen, J.; Andrews, M. Bega Valley Shire Coastal Processes and Hazards Definition Study—Volume 1: Final Report; BMT WBM Pty Ltd.: Brisbane, Australia, 2015; Volume 1. [Google Scholar]
- Roy, P.S. Does the Hunter River supply sand to the New South Wales coast today? Proc. R. Soc. NSW 1975, 110, 17–24. [Google Scholar]
- Short, A.D.; Masselink, G. Embayed and structurally controlled beaches. In Handbook of Beach and Shoreface Morphodynamics; Short, A.D., Ed.; Wiley & Sons: Chichester, UK, 1999. [Google Scholar]
- Vieira da Silva, G.; Toldo, E.E.; Klein, A.H.; Short, A.D.; Woodroffe, C.D. Headland sand bypassing—Quantification of net sediment transport in embayed beaches, Santa Catarina Island North Shore, Southern Brazil. Mar. Geol. 2016, 379, 13–27. [Google Scholar] [CrossRef]
- PWD. Byron Bay—Hastings Point Erosion Study; Report No. PWD 78026; Department of Public Works [PWD] Coastal Engineering Branch: Sydney, Australia, 1978.
- Goodwin, I.D.; Freeman, R.; Blackmore, K. An insight into headland sand bypassing and wave climate variability from shoreface bathymetric change at Byron Bay, New South Wales, Australia. Mar. Geol. 2013, 341, 29–45. [Google Scholar] [CrossRef]
- Mariani, A.; Flocard, F.; Carley, J.T.; Drummond, C.; Guerry, N.; Gordon, A.D.; Cox, R.J.; Turner, I.L. East Coast Study Project—National Geomorphic Framework for the Management and Prediction of Coastal Erosion, Water Research Laboratory; WRL Research Report; School of Civil and Environmental Engineering, UNSW: Manly Vale, Australia, 2013. [Google Scholar]
- Patterson, D.C. Modelling as an Aid to Understand the Evolution of Australia’s Central East Coast in Response to Late Pleistocene-Holocene and Future Sea-Level Change. Ph.D. Thesis, University of Queensland, Brisbane, Australia, 2013. [Google Scholar]
- Short, A.D. Handbook of Beach and Shoreface Morphodynamics; John Wiley: London, UK, 1999. [Google Scholar]
- McLean, R.F.; Shen, J.-S.; Thom, B.G. Beach change at Bengello Beach, Eurobodalla Shire, NSW: 1972–2010. In Proceedings of the The 19th NSW Coastal Conference 2010, Batemans Bay, NSW, Australia, 10–12 November 2010; Australian Coastal Society: Batemans Bay, NSW, Australia, 2010; pp. 1–11. [Google Scholar]
- Nielsen, A.F.; Gordon, A.D. Breakwaters and Training Walls the Good, the Bad and the Ugly. In Proceedings of the 25th NSW Coastal Conference, Coffs Harbour, Australia, 9–11 November 2016; pp. 1–12. [Google Scholar]
- Huang, H.; Short, A.D.; Zeng, T.; Hanslow, D.J. Impact of Brunswick River mouth training walls on adjacent beaches, Brunswick Heads, New South Wales, Australia. China Ocean Eng. 2004, 18, 207–220. [Google Scholar]
- Lord, D.; Edwards, S. Woody Head Erosion Mitigation, Coastal Processes, Hazard Definition, Management Study and Management Plan; Manly Hydraulics Laboratory Draft Report MHL 1043, July, 2000; Manly Hydraulics Laboratory: Sydney, Australia, 2000.
- NSW Public Works Department. Woody Bay Photogrammetric Analysis; New South Wales Public Works Coast and Estuaries Branch Report, February, 1993; New South Wales Public Works department: Sydney, NSW, Australia, 1993.
- Pranzini, E.; Rosas, V.; Jackson, N.L.; Nordstrom, K.F. Beach changes from sediment delivered by streams to pocket beaches during a major flood. Geomorphology 2013, 199, 36–47. [Google Scholar] [CrossRef]
- Carvalho, R.C. Sediment Budget of the Shoalhaven Coastal Compartment. Ph.D. Thesis, School of Earth and Environmental Science, University of Wollongong, Wollongong, Australia, 2018. [Google Scholar]
- Doyle, T.B.; Short, A.D.; Woodroffe, C.D. Foredune evolution in Eastern Australia: A management case study on Warilla Beach. In Coastal Sediments; Rosati, J.D., Wang, P., Lindino, B., Hapke, C., Hanson, H., Ruggiero, P., Eds.; World Scientific Press: St Petersburg, FL, USA, 2019. [Google Scholar]
- Cohn, N.; Ruggiero, P.; de Vries, S.; Kaminsky, G.M. New Insights on Coastal Foredune Growth: The Relative Contributions of Marine and Aeolian Processes. Geophys. Res. Lett. 2018, 4965–4973. [Google Scholar] [CrossRef]
Figure 1.
Conceptual model of foredune morphology, dynamics, and evolutionary trends on prograding (a,b), stable (b–d), and eroding (d,e) coastlines. A foredune may develop through several morpho-ecological stages (1–3), which are strongly controlled by the degree of vegetation cover. In the longer-term, an established foredune may be replaced by a new foredune ridge ((a) prograding coasts), slowly build vertically and or seaward ((b) prograding to stable), or simply build in place as a stable feature ((c) stable coast). Alternatively, foredunes may retreat landwards gradually ((d) stable to eroding), or completely destabilise and move inland as a blowout ((e) receding coasts). Note that the black arrow indicates the direction of net sand accumulation and the “t” symbols represent an element of time, where t1 is the earliest time step and t4 is the most recent (based on [14,22,24,32]).

Figure 2.
The Major geological provinces of eastern NSW (A) and the location of each sample embayment type (B–E). Aerial view of (B) Brunswick Heads Beach (Byron LGA), (C) Stuart Point Beach (Kempsey), (D) North Wollongong area, including Towradgi to Brickyard Beach (Wollongong), and (E) Wonboyn Beach (Bega Valley) (Data Source: © Land and Property (LPI) [2014]).

Figure 3.
The location is shown for each study site, beach of interest, key towns, and the major geological provinces of eastern NSW, as well as the location of each case study site investigated in detail: (A) Brunswick Heads Beach, (B) Woody Bay Beach, (C) Palm Beach, (D) Woonona Beach, (E) Warilla Beach, and (F) Tathra Beach. On the far right are sand roses, which summarise the main geomorphically significant wind systems impacting coastal NSW. These roses were generated using all available historic wind data of the labelled station. Onshore wind resultant drift potential (RDP) (measured in vector units, v.u) and resultant drift direction (RDD) are indicated by the dashed arrow. Alongshore plus onshore winds are indicated by the continuous solid arrows. Arrows indicate the resultant drift potential and direction sand may move, while grey bars indicate the drift potentials from the nine key wind directions for each weather station (those deemed onshore and alongshore/oblique) (Data source: © BoM, Commonwealth of Australia (2018)).

Figure 4.
TIN elevation surfaces from the northern end of Warilla Beach (A), as an example of the analysis that follows and representative cross-shore profiles extracted from these surfaces (B). (B) Also shows the foredune morphometric parameters extracted from these elevations datasets.
Figure 4.
TIN elevation surfaces from the northern end of Warilla Beach (A), as an example of the analysis that follows and representative cross-shore profiles extracted from these surfaces (B). (B) Also shows the foredune morphometric parameters extracted from these elevations datasets.

Figure 5.
Absolute changes in foredune morphometric variables along the NSW coastline (A) over time, including foredune volume change rate (FVCR) (B), horizontal change rate (width) (HCR) (C), vertical change rate (elevation) (VCR) (D), and FVCR for the north and south halves of study sites (E,F). Note: * refers to multiple analyses done on the same beach, due to data coverage for that area (i.e., topographic data only covered northern section and a southern section of the beach, and not the entire embayment). Colours refer to the different types of evolution (see Table 2).

Figure 6.
Aerial photo mosaics of Brunswick Heads Beach in 1947 (A), 1984 (B), and 2009 (C), as well as the evolution of foredune geomorphology between 1947 and 2013 for representative cross-shore profiles found in the north of Brunswick Head Beach (Panel D). Panels (E) and (F) show the time evolution of the foredune volume found at Brunswick (black line), as well as the FVCR (red line). Note: Colours in panels (D) represent different years, where red is the earliest, through to blue, which is the most recent. Multicoloured arrows represent the direction of the net foredune movement.

Figure 7.
Aerial photo of Brunswick Heads Beach in 2009 (A) for each AoI, i.e., north (purple outline) and south (green), as well as the evolution of foredune geomorphology between 1947 and 2013 for the representative cross-shore profile found in the south of the beach (Panel B). Panels (C) and (D) show the time evolution of the foredune volume found at Brunswick (black line), as well as the FVCR (red line). Note: Colours in panels B represent different years, where red is the earliest, through to blue, which is the most recent. Multicoloured arrows represent the direction of the net foredune movement.

Figure 8.
Aerial photo mosaic of Palm Beach in 1951, 1988, and 2013 (A), as well as maps and graphs showing foredune morphologic change (elevation), focused to an AoI, where much change has occurred, i.e., north (C) (Purple). Note: The red dotted lines in panel (C) outline the initial foredune toe for that section of beach, Li = LiDAR data, and the red and blue transects, featured in panel (A), denote the location of the representative cross-shore profile featured in panel (B). Panel (B), therefore, shows the evolution of the foredune between 1951 and 2011 for the representative profile. The multicoloured arrow represents the direction of net foredune movement. Panel (D) shows the time evolution of the entire foredune volume (black line) and the FVCR (red line).

Figure 9.
Aerial photo mosaics of Woonona Beach in 1961 (A), 1990 (B), and 2012 (C), as well as the evolution of foredune geomorphology between 1947 and 2013 for representative cross-shore profiles found in the north of the beach (Panel D). Panels (E) and (F) show the time evolution of the foredune volume found at Brunswick (black line) (E), as well as the FVCR (red line) (F). Note: The red and blue transects featured in panel (A) (1961 and 2012), denote the location of the representative cross-shore profile featured in panel (D), and the colours in panels D represent different years, where red is the earliest, through to blue, which is the most recent. Multicoloured arrows represent the direction of the net foredune movement.

Figure 10.
Aerial photo mosaics of Tathra Beach in 1944 (A), 1993 (B), and 2014 (C), as well as the evolution of foredune geomorphology between 1944 and 2014 for representative cross-shore profiles found in the north of the beach (Panel D). Panels (E) and (F) show the time evolution of the foredune volume found at Tathra (black line) (E), as well as the FVCR (red line) (F). Note: The red and blue transects featured in panel (A) and (C) (1944 and 2014), denote the location of the representative cross-shore profile featured in panel (D), and the colours in panels D represent different years, where red is the earliest, through to blue, which is the most recent. Multicoloured arrows represent the direction of the net foredune movement.

Figure 11.
Aerial photo mosaic of Woody Bay Beach in 1942, 1987, and 2010 (A). Note the inset in the 2010 panel, this shows the geographic setting and orientation of Woody Bay. Panel (B) depicts the evolution of foredune geomorphology between 1942 and 2010 for the representative cross-shore profile for this beach. Note: The red and blue transects featured in panel (A) (1942 and 2010), denote the location of the representative cross-shore profile featured in panel (B). Panel (C) shows the time evolution of the foredune volume for Woody Bay (black line), as well as the FVCR (red line). Note: the different colours in panel (B) represent different years, where red is the earliest, through to blue, which is the most recent. The multicoloured arrow represents the direction of net foredune movement.

Figure 12.
Aerial photo mosaic of Warilla Beach in 1948, 1988, and 2013 (A), as well as maps showing foredune elevation change (C). Note: Red and blue transects featured in panel (A) (1948 and 2013), denote the location of the representative cross-shore profile featured in panel (B), Li = LiDAR data, and the red dotted lines in panel (C) outline the initial foredune toe for that section of beach (i.e., 1948). Panel (B), therefore, shows the evolution of the foredune between 1948 and 2014 for the representative profile (the multicoloured arrows represents two main phases and direction of net foredune movement; phase 1 (sand loss) and phase 2 (sand gain and foredune expansion seaward). Panel (D) shows the time evolution of the entire foredune volume (black line) and the FVCR (red line).

Figure 13.
Comparison of the foredune conceptual model produced by Hesp [14] and the general dune trends observed in this study. The top row shows foredune behaviour on prograding coastlines (NSW e.g., Brunswick Heads Beach, north), the centre shows dune behaviour on stable coastlines (NSW e.g., Palm Beach), and the bottom row illustrates how those behave on receding shorelines (NSW e.g., Brunswick Heads Beach, south) (based on [14]). Note arrows indicates the direction of net sand accumulation and the “t” symbols represent an element of time, where t1 is the earliest time step and t7 is the most recent.

Table 1.
NSW geological provinces with their main structural units on the coast and the regional relationships between lithologies, structural fabric, coastal relief, river size, and the nature of the embayments in which Quaternary sediments have accumulated (from Chapman [20]).
Table 1.
NSW geological provinces with their main structural units on the coast and the regional relationships between lithologies, structural fabric, coastal relief, river size, and the nature of the embayments in which Quaternary sediments have accumulated (from Chapman [20]).
| Geological Province | Geology | Geographic Region | Structural Elements | Coast Relief | River Size | Coastal Embayment Type |
|---|---|---|---|---|---|---|
| Clarence Moreton | Soft Mesozoic sediment | Far North | Parallel to coastline orientation | Low | Very Large | Large and broad |
| New England Fold Belt | Hard Palaeozoic metamorphic | Mid-north | Transverse to coastline orientation | Moderate | Very small | Small and narrow |
| Mod. Hard Palaeozoic metamorphic | Central | Medium | Moderately large and broad | |||
| Sydney Basin | Soft Triassic and Permian | South | Transverse to coastline orientation | Low | Large | Large narrow incised valleys, plus large to small estuaries |
| Jointed Hard Hawksbury Sandstone | South | Moderate | ||||
| Soft Triassic and Permian | South | Low to moderate | Medium to small | |||
| Lachlan Fold Belt | Hard Palaeozoic metamorphic and igneous | Far South | Parallel to coastline orientation | High | Small | Small and narrow |
Table 2.
Key information on each beach-dune study site, including geographic region, Holocene barrier type (green = prograded; orange = stationary; red = receded), dune modification history (year/s of major management or M indicates sand mining in past), dates of aerial photographs used in photogrammetric analysis (are ordered most recent to oldest and shortened to last 2 digits; 20- or 19-), survey date of the most recent LiDAR data, and finally, dates of acquired historic aerial photography (ordered most recent to oldest and shortened) used for each study site.
| Beach No. (NSW) | Beach Name | Geographic Region | Barrier Type ^ | Modified (yr.) | Photogrammetric Observations (20- or 19-) | LiDAR Data | Year of Aerial Photography |
|---|---|---|---|---|---|---|---|
| 011 | Brunswick Hds - Nth | Far North | PROG | 89 Post 89 | ‘13 10 07 99 94 91 87 84 83 76 74 73 71 66 58 54 47 | 28.08.2010 | 10 09 04 94 91 87 84 76 74 73 66 58 47 |
| Brunswick Hds - Sth | 89 Post 89 | ‘13 12 10 07 04 99 96 94 91 87 77 73 58 47 | |||||
| 113 | Boambee - whole Bch | Mid-North | PROG | M | ‘93 86 77 69 42 | 21.09.2013 | 09 07 96 83 81 74 69 54 42 |
| Boambee - Nth | M | ‘13 07 04 00 96 93 86 74 73 69 42 | |||||
| 115 | Bonville | Mid-North | PROG | ‘07 96 81 74 73 64 | 17.12.2009 | 14 09 07 96 80 74 64 54 | |
| 195 | Nine Mile (Tuncurry) | Central | PROG | 89 | ‘13 08 01 94 86 80 74 72 63 | 18.08.2012 | 13 10 06 01 99 97 94 86 80 74 72 63 52 |
| 223 | Bennett’s - Nth | Central | PROG | 89 | ‘08 06 01 96 91 86 80 72 | 18.08.2012 | 12 |
| Bennett’s - Sth | 89 | ‘13 08 01 94 83 74 63 51 | |||||
| 297 | Ocean - Umina | Central | PROG | 78 | ‘11 08 01 96 93 86 78 77 74 71 70 64 61 41 | 10.05.2011 | 14 11 08 96 86 78 74 64 41 |
| 659 | Tathra | Far South | PROG | Post 89 | ‘14 11 07 99 93 88 80 75 72 66 57 44 | 13.03.2013 | 14 11 07 93 88 80 75 66 57 44 |
| 671 | Merimbula - Pambula | Far South | PROG | Post 89 * | ‘14 11 07 01 93 89 79 77 75 72 62 | 13.03.2013 | 14 11 10 07 93 89 79 75 62 |
| 692 | Boydtown | Far South | PROG | ‘14 11 07 99 86 79 64 | 11.03.2013 | 14 10 07 99 93 86 79 64 | |
| 002 | Letitia Spit | Far North | STAT | 62-65 00 | ‘14 10 07 04 99 85 71 62 47 | 06.03.2014 | 14 12 07 99 85 71 62 55 47 |
| 016 | Tallows | Far North | STAT | 87 88 M | ‘13 12 10 04 99 84 76 73 66/67 58 | 28.08.2010 | 10 09 99 84 73 66 47 |
| 083 | Corindi - Arrawarra -Nth | Mid-North | STAT | ‘06 96 81 74 73 64 | 21.09.2013 | 09 06 04 93 88 81 74 64 56 43 | |
| Corindi - Arrawarra - Sth | ‘93 88 83 81 74 64 56 43 | ||||||
| 204 | Seven Mile (Booti Booti) | Central | STAT | M | ‘08 97 86 73 63 | 09.06.2013 | 13 10 08 01 99 97 86 80 77 73 72 63 52 |
| 300 | Palm Beach | South | STAT | 82 86 88 | ‘11 08 01 96 88 79 74 70 65 51 | 13.05.2011 | 13 08 07 01 96 88 79 74 65 51 41 |
| 367 | Woonona - Bellambi | South | STAT | 87 89 M | ‘07 01 99 93 87 74 72 66 61 55 | 24.04.2013 | 14 12 08 01 90 82 76 61 51 |
| 379 | Perkins - Windang | South | STAT | 85-88 M | ‘14 07 99 88 74 61 | 24.04.2013 | 14 13 08 07 99 88 74 61 48 |
| 380 | Warilla | South | STAT | 83 M | ‘14 11 07 01 88 82 74 73 66 61 48 | 08.03.2011 | 13 11 09 07 01 99 88 74 61 55 48 |
| 389 | Bombo | South | STAT | ‘14 01 96 93 86 79 71 63 48 | 08.03.2011 | 14 13 12 11 09 08 03 01 96 93 86 81 77 74 71 50 | |
| 633 | Cuttagee | Far South | STAT | ‘14 11 07 01 99 93 88 86 80 79 77 71 63 44 | 27.03.2013 | 14 11 10 01 93 88 80 77 71 63 44 | |
| 021 | Seven Mile (Lennox Hd) | Far North | RECE | 92-93 M | ‘13 99 94 91 83 76 67 58 47 | 26.06.2010 | 09 99 94 91 81 76 67 58 47 |
| 036 | Woody Bay | Far North | RECE | M | ‘10 06 04 00 96 90 87 79 73 71 69 66 58 42 | 19.03.2010 | 10 09 00 96 87 79 71 66 58 42 |
| 085 | Ocean View | Mid-North | RECE | ‘04 00 96 93 88 81 74 73 64 56 43 | 21.09.2013 | 09 04 00 93 88 74 64 56 43 | |
| 154 | Delicate Nobby | Mid-North | RECE | ‘09 00 96 88 81 72 67 | 02.11.2009 | 14 09 00 96 88 81 76 74 72 67 42 | |
| 314 | Dee Why | South | RECE | 84 | ‘01 99 96 90 85 76 74 65 61 | 10.04.2013 | 13 07 01 99 93 86 74 61 51 |
| 366 | Bulli | South | RECE | 87 89 | ‘05 93 84 74 72 61 | 24.04.2013 | 14 08 05 93 84 74 72 61 51 |
| 402 | Culburra | South | RECE | 87 89 M | ‘14 05 93 78 69 61 49 | 17.12.2010 | 13 12 09 05 93 84 78 74 69 61 49 |
^ Barrier Type: PROG= Prograded; STAT= Stationary; and RECE= Receded; * Very limited areas of the dune were managed as part of the BIP.
Table 3.
Summary of the different foredune evolution, with associated foredune volume changes, volume change rate (FVCR), and study period. Note: Colours represent the different types of evolution. Bold signifies case study site.
Table 3.
Summary of the different foredune evolution, with associated foredune volume changes, volume change rate (FVCR), and study period. Note: Colours represent the different types of evolution. Bold signifies case study site.
| Beach Name * | Geographic Region | Foredune Evolution | Dune Volume Change (m3 m−1) | FVCR (m3 m−1 y−1) | Time (years) |
|---|---|---|---|---|---|
| Brunswick Heads - Nth | Far North | Prograding | 164.47 | 2.49 | 66 |
| Tallows Beach | Far North | Prograding | 235.15 | 4.28 | 55 |
| Boambee Beach - Nth | Mid-North | Prograding | 123.55 | 1.72 | 71 |
| Delicate Nobby | Mid-North | Prograding | 108.74 | 2.53 | 42 |
| Nine Mile Beach | Central | Prograding | 194.33 | 4.05 | 50 |
| Bennett’s Beach - Nth | Central | Prograding | 207.09 | 5.18 | 36 |
| Bennett’s Beach - Sth | Central | Prograding | 117.31 | 1.89 | 62 |
| Perkin’s – Windang Beach | South | Prograding | 123.11 | 2.32 | 53 |
| Boydtown Beach | Far South | Prograding | 123.77 | 2.48 | 50 |
| Boambee Beach - whole | Mid-North | Prograding - Stable | 89.32 | 1.26 | 71 |
| Palm Beach | South | Prograding - Stable | 81.93 | 1.37 | 60 |
| Ocean View Beach | Mid-North | Stable | 9.32 | 0.13 | 70 |
| Seven Mile Beach (Booti) - Sth | Central | Stable | 31.56 | 0.63 | 50 |
| Dee Why Beach | South | Stable | 40.65 | 0.78 | 52 |
| Bulli Beach | South | Stable | 62.45 | 1.20 | 52 |
| Woonona – Bellambi Beach | South | Stable | 52.42 | 0.90 | 58 |
| Bombo Beach | South | Stable | 24.80 | 0.38 | 66 |
| Tathra Beach | Far South | Stable | −9.66 | −0.14 | 70 |
| Merimbula – Pambula Beach | Far South | Stable | 31.83 | 0.61 | 52 |
| Corindi - Arrawarra - Nth | Mid-North | Stable - Receding 1 | −72.36 | −1.48 | 49 |
| Corindi - Arrawarra – Sth | Mid-North | Stable - Receding 1 | −49.11 | −0.70 | 70 |
| Letitia Spit Beach | Far North | Stable - Receding 2 | −159.56 | −2.35 | 67 |
| Bonville Beach | Mid-North | Stable - Receding 2 | −201.92 | −4.49 | 45 |
| Ocean-Umina Beach | Central | Stable - Receding 2 | −120.03 | −1.69 | 70 |
| Warilla Beach | South | Stable - Receding 2 | −278.21 | −4.22 | 66 |
| Cuttagee Beach | Far South | Stable - Receding 2 | −130.43 | −1.86 | 70 |
| Brunswick Heads - Sth | Far North | Receding | −288.25 | −6.13 | 66 |
| Seven Mile (Lennox Hd) Beach | Far North | Receding | −170.35 | −2.58 | 66 |
| Woody Bay Beach | Far North | Receding | −436.93 | −6.33 | 68 |
| Culburra Beach | South | Receding | −130.54 | −2.01 | 65 |
* Nth and Sth designate North and South and refer to there only being data for that area of the system.
Table 4.
NSW Foredune environments that have prograded over time (in decreasing order), as well as the way each site has gained sand (i.e., the evolution style), the total volume change of each system over the study period, wave alignment, sediment compartment type, total drift potential (DP and RDP), as well as the proposed cause for this behaviour. Bold compartment type1 refers to a major or complete barrier to longshore drift to the north of that site (Chapman 1982).
| Beach Name | Evolution Style 1 | Volume Change (m3 m−1) 2 | Wave Alignment 3 | Leakiness 4 | Total DP (RDP) 5 | Cause |
|---|---|---|---|---|---|---|
| Tallows Beach | Single | 235.15 | Drift-aligned | Closed | 113 (81.4) | Longshore |
| Bennett’s Beach - Nth | Multiple | 207.09 | Swash-aligned | Leaky | 133 (90.1) | Offshore/wind |
| Nine Mile Beach | Multiple | 194.33 | Drift-aligned | Closed | 24 (17.8) | Along- and Offshore |
| Brunswick Heads - Nth | Multiple | 164.47 | Drift-aligned | Closed | 95 (61.4) | Train Wall/longshore |
| Boydtown Beach | Multiple | 123.77 | Embayed? | Closed | 45 (39.1) | River supply |
| Boambee Beach - Nth | Multiple | 123.55 | Drift-aligned | Closed | 19 (8.9) | Longshore |
| Perkin’s – Windang | Both | 123.11 | Drift-aligned | Closed | 36 (19.0) | Offshore |
| Bennett’s Beach - Sth | Single | 117.31 | Swash-aligned | Leaky | 133 (90.1) | Offshore/wind |
| Delicate Nobby | Both | 108.74 | Embayed | Closed | 18 (9.4) | Rotation/Offshore? |
| Boambee Beach - whole | Multiple | 89.32 | Drift-aligned | Closed | 19 (8.9) | Longshore |
| Palm Beach | Single | 81.93 | Embayed | Closed | 3 (2.3) | Dune mgmt. |
1 Evolution style refers to the way foredunes have developed over the study period. They have either extended seaward as new incipient foredunes (multiple), and/or grown vertically in place (single) – based on photogrammetry and LiDAR analysis. 2 Based on Table 2. 3 Wave Alignment has been adapted from [41,66,67]. 4 Compartment Leakiness has been adapted from [19]. 5 DP: Drift potential; RDP: Resultant Drift Potential. See Section 3.3 or [42].
Table 5.
Comparison of previous dune or shoreline progradation/recession metrics and the proposed cause for those behaviours.
Table 5.
Comparison of previous dune or shoreline progradation/recession metrics and the proposed cause for those behaviours.
| Beach Name | Current Progradation/Recession Rates | Previous Progradation/ Recession Rates | Cause | References | |
|---|---|---|---|---|---|
| FVCR (m3 m−1 yr−1) | HCR (m yr1) | ||||
| Bennett’s Beach - Nth | +5.18 | +1.53 | +3 m yr−1 | Offshore | [35] |
| Nine Mile Beach | +4.05 | +1.25 | +4.30 m3 m−1 yr−1 | Offshore (~2.1 × 10⁴ m3 m−1) Longshore (~4.7 × 10³ m3 m−1) | [17] |
| Boydtown Beach | +1.78 | +0.84 | 7940–1500 yrBP +0.46 m3 m−1 yr−1 +0.16 m yr−1 1500–present +1.83 m3 m−1 yr−1 +0.65 m yr−1 | Offshore Towamba River (in last 1500 y) | [18] |
| Woody Bay Beach | −7.57 | −1.05 | 1400–1100 +0.5 m3 m−1 yr−1 1100–500 +1.0 m3 m−1 yr−1 500–250 2.3 m3 m−1 yr−1 250–150 4.3 m3 m−1 yr−1 150–present −9.0 m3 m−1 yr−1 −2.0 m yr−1 | Progradation: Longshore sand bypassing & Shark Bay tombolo development Recession: Storm bite, wave direction, lack of longshore sand bypassing/supplies | [2,85,86] |
Table 6.
NSW foredune environments that have remained stable over time, as well as the total volume change of each system over the study period, the sediment compartment types, total drift potential (DP, and RDP), and the proposed cause for this behaviour.
Table 6.
NSW foredune environments that have remained stable over time, as well as the total volume change of each system over the study period, the sediment compartment types, total drift potential (DP, and RDP), and the proposed cause for this behaviour.
| Beach Name | Volume Change (m3 m−1) ^ | Wave Alignment | Leakiness | Total DP (RDP) | Cause |
|---|---|---|---|---|---|
| Bulli Beach | 62.45 | Embayed | Leaky | 28 (17.2) | Embayed |
| Woonona – Bellambi Beach | 52.42 | Embayed | Leaky | 25 (14.0) | Embayed |
| Dee Why Beach | 40.65 | Embayed | Closed | 5 (4.3) | Embayed |
| Merimbula – Pambula Beach | 31.83 | Embayed | Closed | 6 (3.8) | Embayed |
| Seven Mile Beach (Booti) - Sth | 31.56 | Drift-aligned | Leaky | 14 (10.7) | Onshore |
| Bombo Beach | 24.80 | Embayed | Leaky? | 5 (2.2) | Embayed |
| Ocean View Beach | 9.32 | Embayed | Closed | 24 (9.9) | Embayed/closed |
| Tathra Beach | −9.66 | Embayed | Leaky? | 5 (3.2) | River |
| Corindi - Arrawarra – Sth | −49.11 | Embayed | Leaky | 27 (8.4) | Longshore |
| Corindi - Arrawarra - Nth | −72.36 | Embayed | Leaky | 27 (8.4) | Longshore |
Table 7.
NSW foredune environments that have receded (to varying degrees) over time, as well as the total volume change of each system over the study period, the compartment types, total Drift Potential (and RDP) as well as the proposed cause for this behaviour.
Table 7.
NSW foredune environments that have receded (to varying degrees) over time, as well as the total volume change of each system over the study period, the compartment types, total Drift Potential (and RDP) as well as the proposed cause for this behaviour.
| Beach Name (Orientation) | Volume Change (m3 m−1) | Wave Alignment | Leakiness | Total DP (RDP) | Cause |
|---|---|---|---|---|---|
| Ocean-Umina Beach (148) | −120.03 | Embayed | Closed | 83 (74.7) | Obstacles; Ebb tide delta |
| Cuttagee Beach (85) | −130.43 | Embayed | Leaky | 6 (3.8) | Position in comp. |
| Culburra Beach (69) | −130.54 | Embayed | Leaky? | 31 (16.8) | Position in comp./ orientation/longshore |
| Letitia Spit Beach (61) | −159.56 | Drift-aligned | Leaky | 86 (56.3) | Sand bypassing |
| Seven Mile (Lennox Hd) Beach (106) | −170.35 | Drift-aligned | Leaky | 109 (78.1) | Position in comp./longshore |
| Bonville Beach (116) | −201.92 | Drift-aligned | Leaky | 20 (6.2) | Position in comp./longshore |
| Warilla Beach (106) | −278.21 | Embayed | Closed? | 35 (17.0) | Training Wall/Human impact |
| Brunswick Heads – Sth (71) | −288.25 | Drift-aligned? | Leaky | 95 (61.4) | Rotation/Position in comp./orientation |
| Woody Bay Beach (23) | −436.93 | Embayed | Leaky? | 12 (8.4) | Position in comp./orientation/obstacles |
Table 8.
Foredune study sites by barrier type, foredune decadal behaviour, and volume changes.
| Beach Name | Geographic Region | Barrier Type | Foredune Behaviour (Decadal) | Dune Volume Change (m3 m−1) |
|---|---|---|---|---|
| Brunswick Hds - Nth | Far North | Prograded | Prograding (multiple) | +164.47 |
| Brunswick Hds - Sth | Receding | −288.25 | ||
| Boambee - whole Bch | Mid-North | Prograded | Prograding - stable (multiple) | + 89.32 |
| Boambee - Nth | Prograding (multiple) | +123.55 | ||
| Bonville | Mid-North | Prograded | Stable - receding 2 | −201.92 |
| Nine Mile (Tuncurry) | Central | Prograded | Prograding (multiple) | +194.33 |
| Bennetts - Nth | Central | Prograded | Prograding (multiple) | +207.09 |
| Bennetts - Sth | Prograding (single) | +117.31 | ||
| Ocean - Umina | Central | Prograded | Stable - receding 2 | −120.03 |
| Tathra | Far South | Prograded | Stable (multiple) | −9.66 |
| Merimbula - Pambula | Far South | Prograded | Stable (multiple) | +31.83 |
| Boydtown | Far South | Prograded | Prograding (multiple) | +123.77 |
| Letitia Spit | Far North | Stationary | Stable - receding 2 | −159.56 |
| Tallows | Far North | Stationary | Prograding (single) | +235.15 |
| Corindi - Arrawarra -Nth | Mid-North | Stationary | Stable - receding 1 | −72.36 |
| Corindi - Arrawarra - Sth | Stable - receding 1 | −49.11 | ||
| Seven Mile (Booti Booti) | Central | Stationary | Stable | +31.56 |
| Palm Beach | South | Stationary | Prograding - Stable (single) | +81.93 |
| Woonona - Bellambi | South | Stationary | Stable | +52.42 |
| Perkins - Windang | South | Stationary | Prograding (both) | +123.11 |
| Warilla | South | Stationary | Stable - receding 2 | −278.21 |
| Bombo | South | Stationary | Stable | +24.80 |
| Cuttagee | Far South | Stationary | Stable - receding 2 | −130.43 |
| Seven Mile (Lennox Hd) | Far North | Receded | Receding | −170.35 |
| Woody Bay | Far North | Receded | Receding | −436.93 |
| Ocean View | Mid-North | Receded | Stable | +9.32 |
| Delicate Nobby | Mid-North | Receded | Prograding (both) | +108.74 |
| Dee Why | South | Receded | Stable | +40.65 |
| Bulli | South | Receded | Stable | +62.45 |
| Culburra | South | Receded | Receding | −130.54 |
© 2019 by the authors. Licensee MDPI, Basel, Switzerland. This article is an open access article distributed under the terms and conditions of the Creative Commons Attribution (CC BY) license (http://creativecommons.org/licenses/by/4.0/).
Share and Cite
MDPI and ACS Style
Doyle, T.B.; Short, A.D.; Ruggiero, P.; Woodroffe, C.D. Interdecadal Foredune Changes along the Southeast Australian Coastline: 1942–2014. J. Mar. Sci. Eng. 2019, 7, 177. https://doi.org/10.3390/jmse7060177
AMA Style
Doyle TB, Short AD, Ruggiero P, Woodroffe CD. Interdecadal Foredune Changes along the Southeast Australian Coastline: 1942–2014. Journal of Marine Science and Engineering. 2019; 7(6):177. https://doi.org/10.3390/jmse7060177
Chicago/Turabian StyleDoyle, Thomas B., Andrew D. Short, Peter Ruggiero, and Colin D. Woodroffe. 2019. "Interdecadal Foredune Changes along the Southeast Australian Coastline: 1942–2014" Journal of Marine Science and Engineering 7, no. 6: 177. https://doi.org/10.3390/jmse7060177
Note that from the first issue of 2016, this journal uses article numbers instead of page numbers. See further details here.