
Applicability of Calculation Formulae of Impact Force by Tsunami Driftage


 ,
,
Abstract
:1. Introduction
2. Accuracy of Formulae for Calculating the Impact Force
2.1. List of Main Calculation Formulae
2.2. Correlation Examination of the Main Calculation Formulae
2.2.1. Driftwood
- (1)
- Experiment 1 of Matsutomi [15]
- (a)
- Parameters of the driftwood (larch)
- (b)
- Parameters of the collided body (steel)
- (c)
- Coefficients in the formula
- (d)
- Measured impact force and the collision velocity
- (2)
- Experiment 2 of Matsutomi [15]
- (a)
- Parameters of the driftwood (larch)
- (b)
- Parameters of the collided body (steel) and the apparent mass coefficients used the same values as (1) Matsutomi’s experiment 1 [15].
- (c)
- Coefficients in the formula;
- (d)
- Measured impact force and the collision velocity
- (3)
- Matsutomi’s experiment 3 [15]
- (a)
- Parameters of the driftwood (larch)
- (b)
- Parameters of the collided body (steel) and the apparent mass coefficients used the same values as (1) Matsutomi’s experiment 1 [15].
- (c)
- Coefficients in the formula;
- (d)
- Measured impact force and the collision velocity
- (4)
- Experiment 1 of Ikeno et al. [23];
- (a)
- Parameters of the driftwood (pine);
- (b)
- Parameters of the collided body (steel) and the apparent mass coefficients used the same values as (1) Matsutomi’s experiment 1 [15].
- (c)
- Coefficients in the formula;
- (d)
- Measured impact force and the collision velocity;
- (5)
- Experiment 2 of Ikeno et al. [23]
- (a)
- Parameters of the driftwood (cedar)
- (b)
- Parameters of the collided body (steel) and the apparent mass coefficients used the same values as (1) Matsutomi’s experiment 1 [15].
- (c)
- Coefficients in the formula;
- (d)
- Measured impact force and the collision velocity
- (6)
- Experiment 3 of Ikeno et al. [23];
- (a)
- Parameters of the driftwood (cedar)
- (b)
- Parameters of the collided body (steel) and the apparent mass coefficients used the same values as (1) Matsutomi’s experiment 1 [15].
- (c)
- Coefficients in the formula
- (d)
- Measured impact force and the collision velocity
2.2.2. Containers
- (1)
- Experiment of Arikawa et al. [20]
- (a)
- Parameters of the small container (steel)
- (b)
- Parameters of the collided body (concrete)
- (c)
- Coefficients in the formula
- (d)
- Measured impact force and the collision velocity
- (2)
- Experiment of Aghl et al. [12]
- (a)
- Parameters of the 6.1 m container (steel)
- (b)
- Parameters of the collided body (steel)
- (c)
- Coefficients in the formula
- (d)
- Measured impact force and the collision velocity
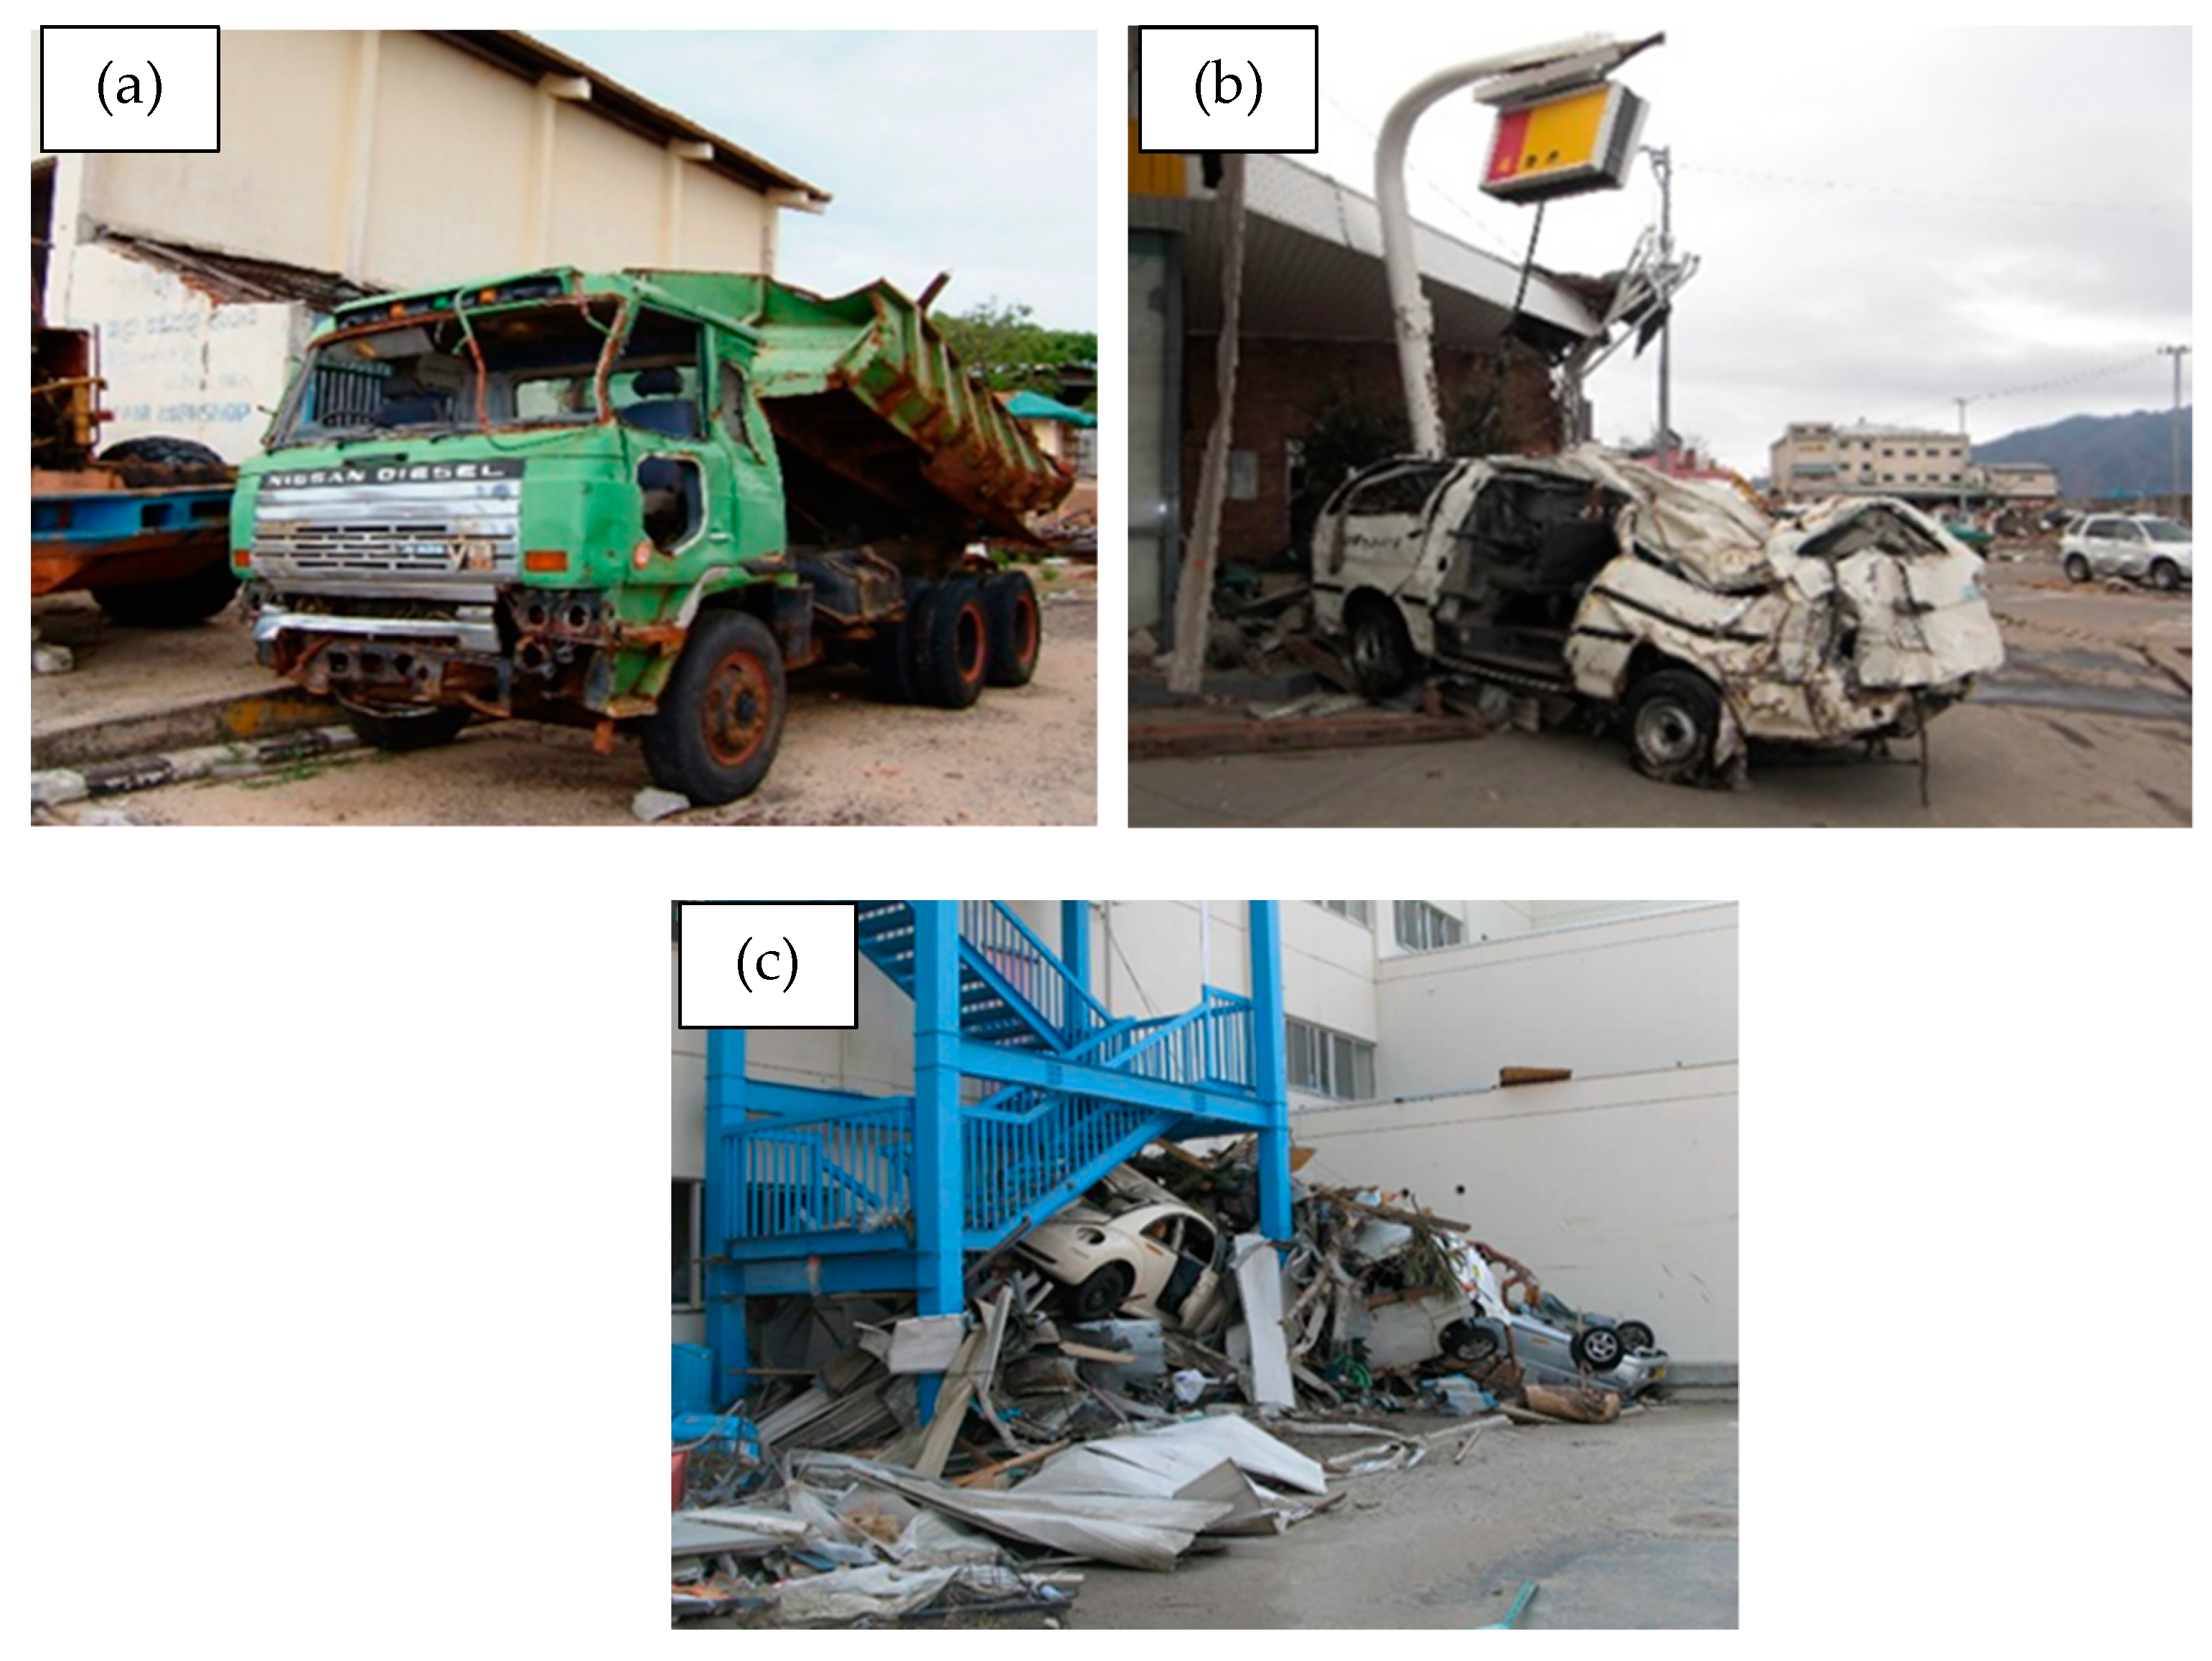
2.2.3. Car
- (a)
- Parameters of the actual car
- (b)
- Parameters of the collided body (steel)
- (c)
- Coefficients in the formula
- (d)
- Measured impact force and the collision velocity
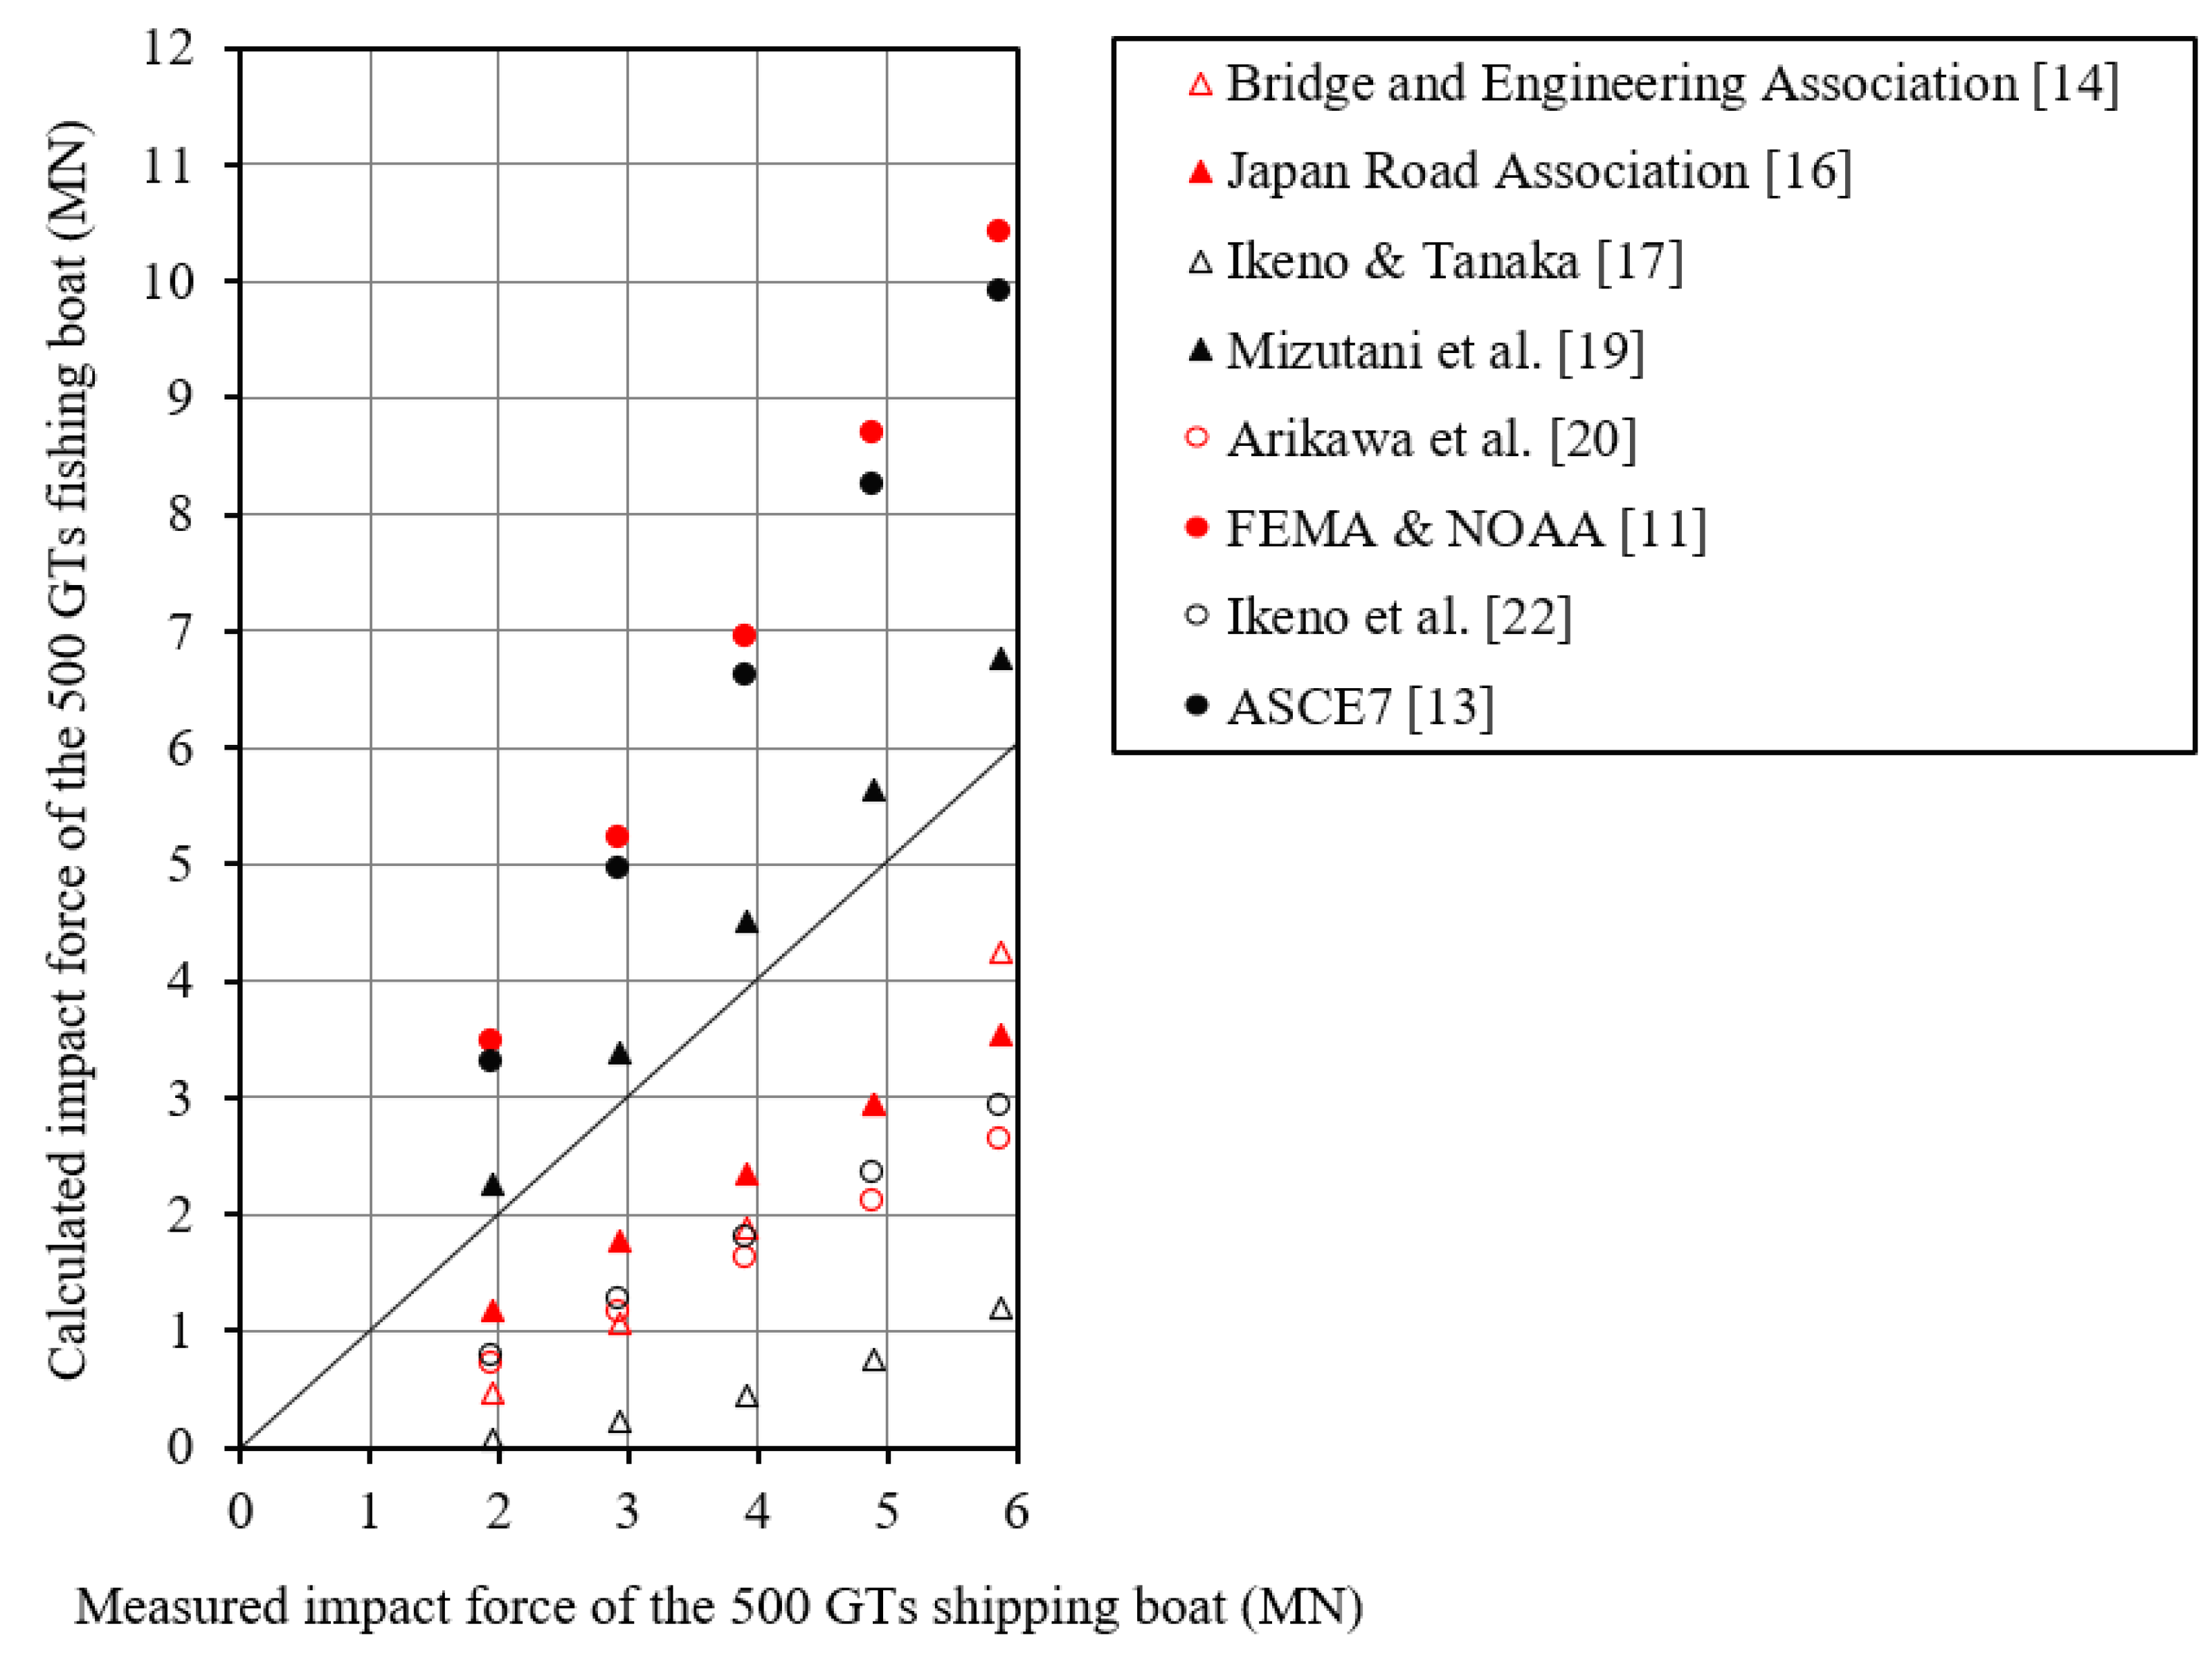
2.2.4. Ship
- (a)
- Parameters of the ship (500 GTs)
- (b)
- Parameters of the collided body (steel)
- (c)
- Coefficients in the formula
- (d)
- Measured impact force and the collision velocity
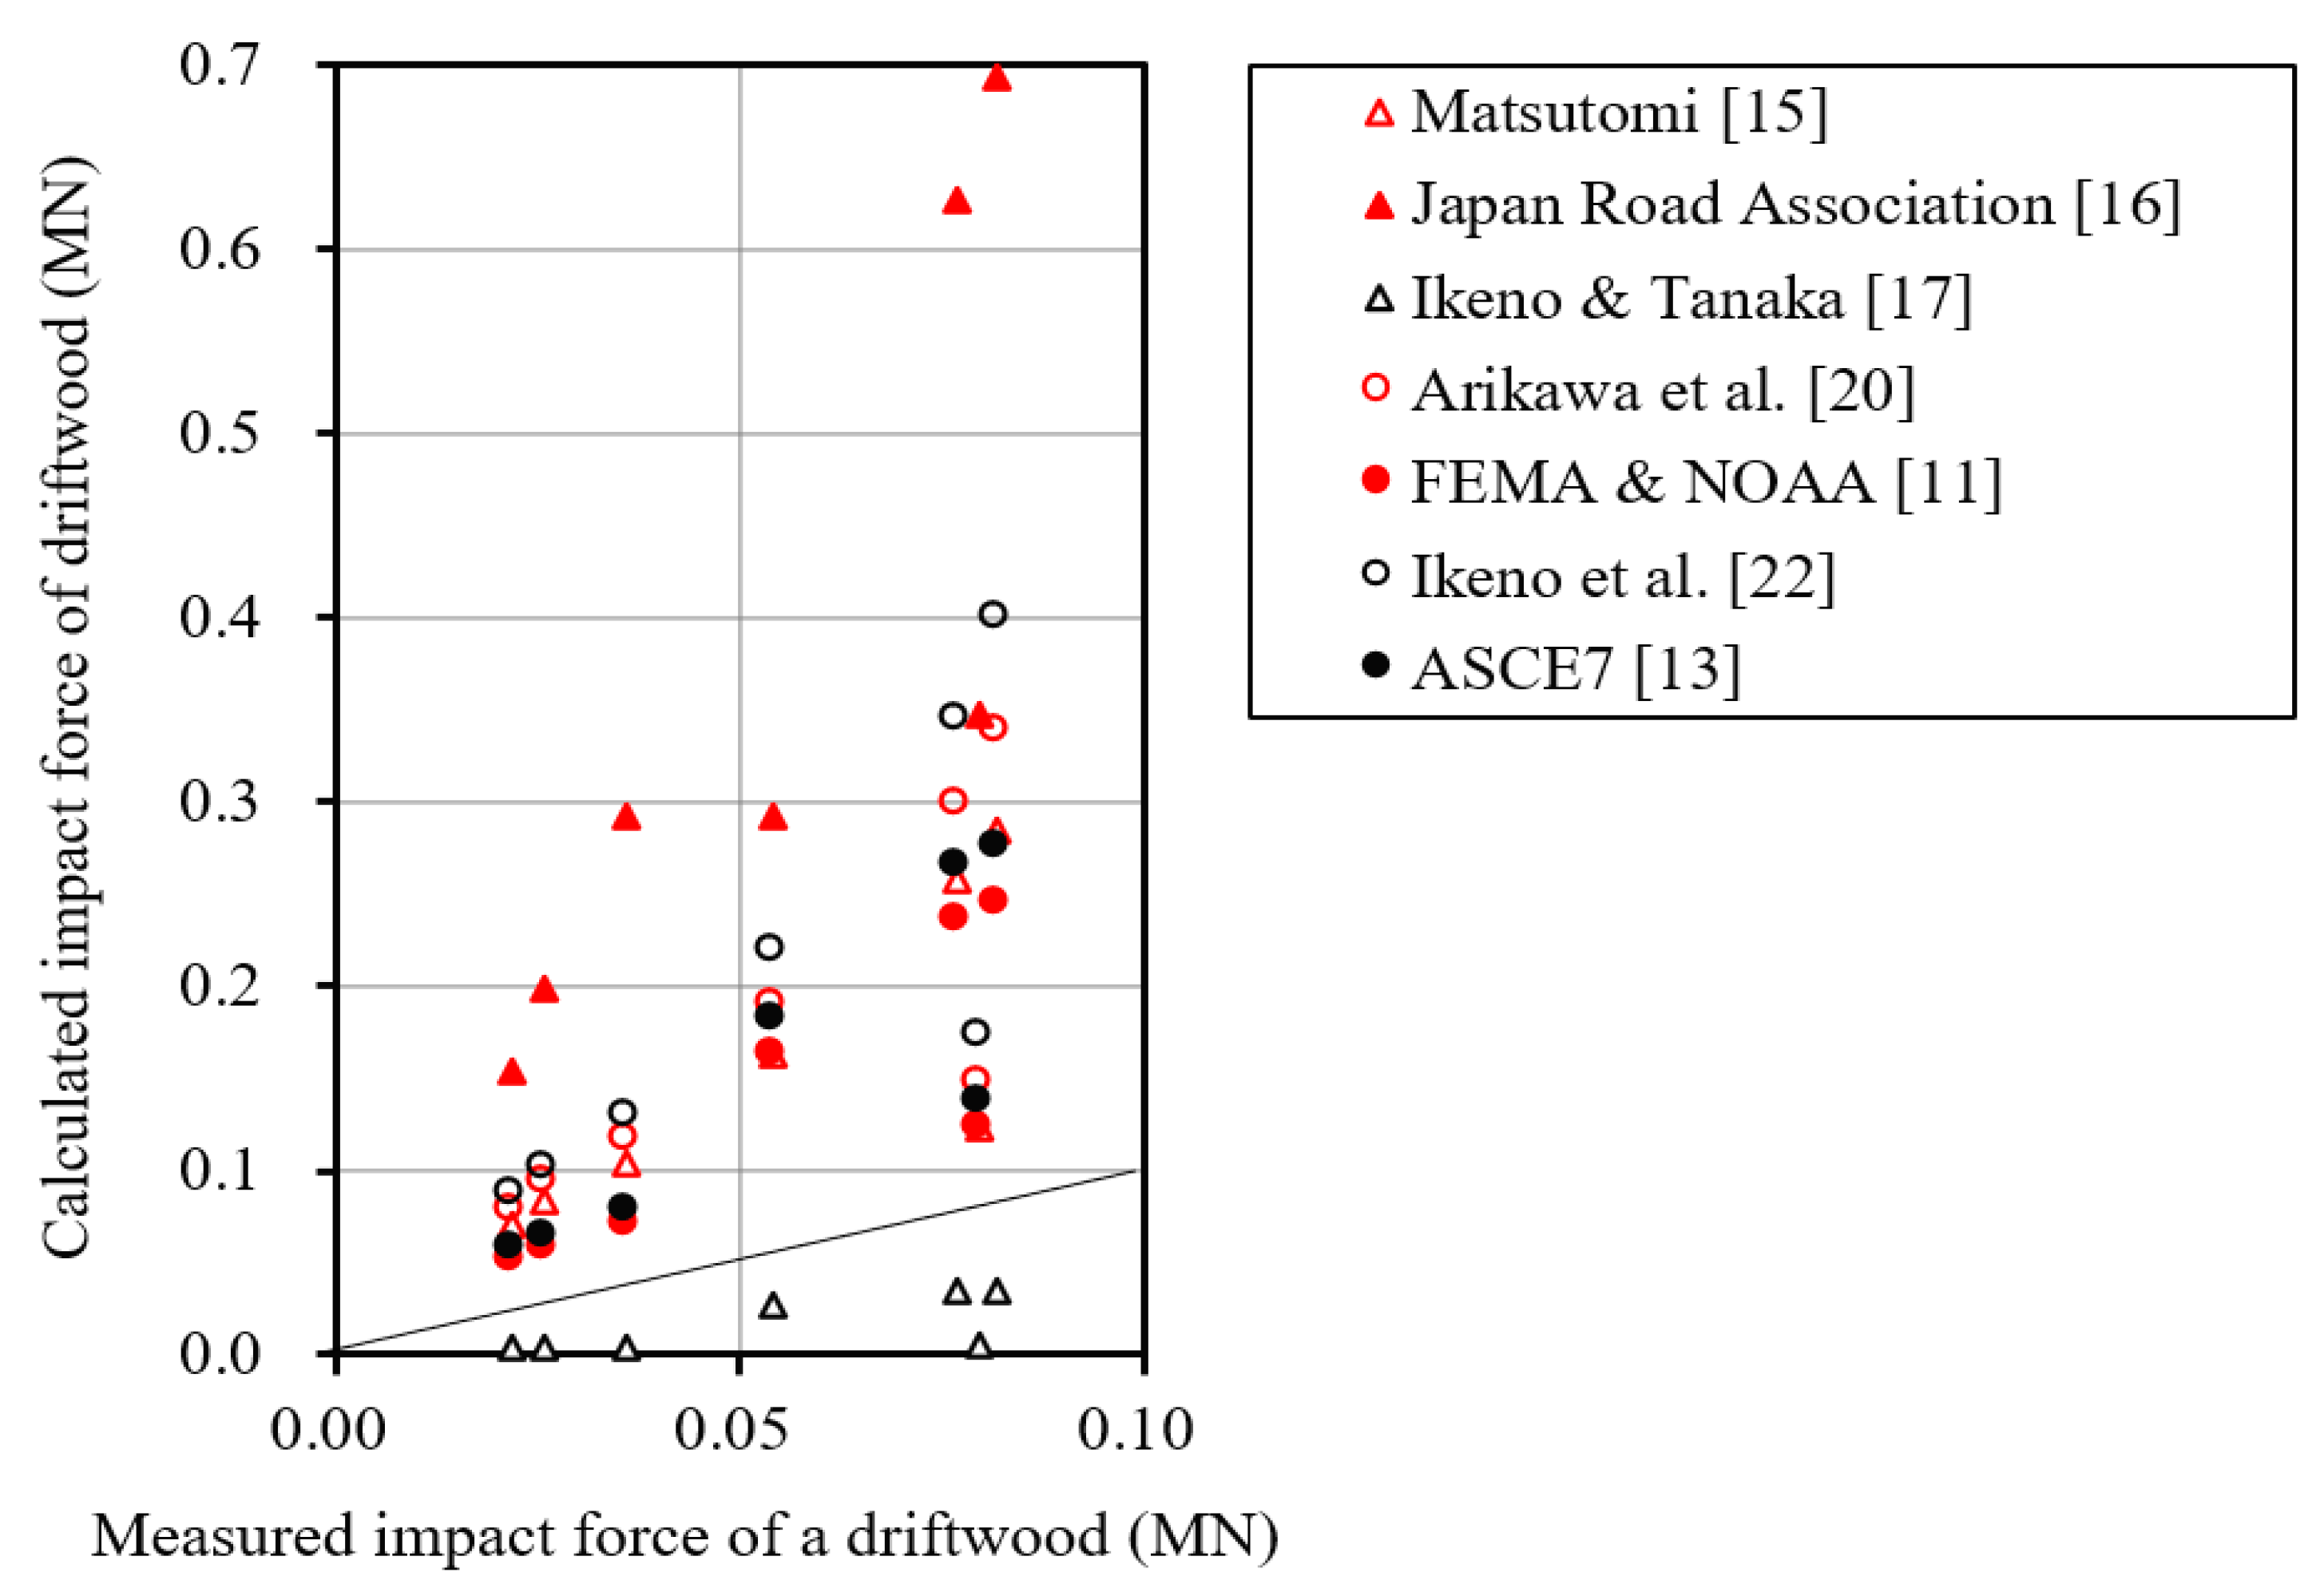
2.3. Range of Impact Force of Each Formula
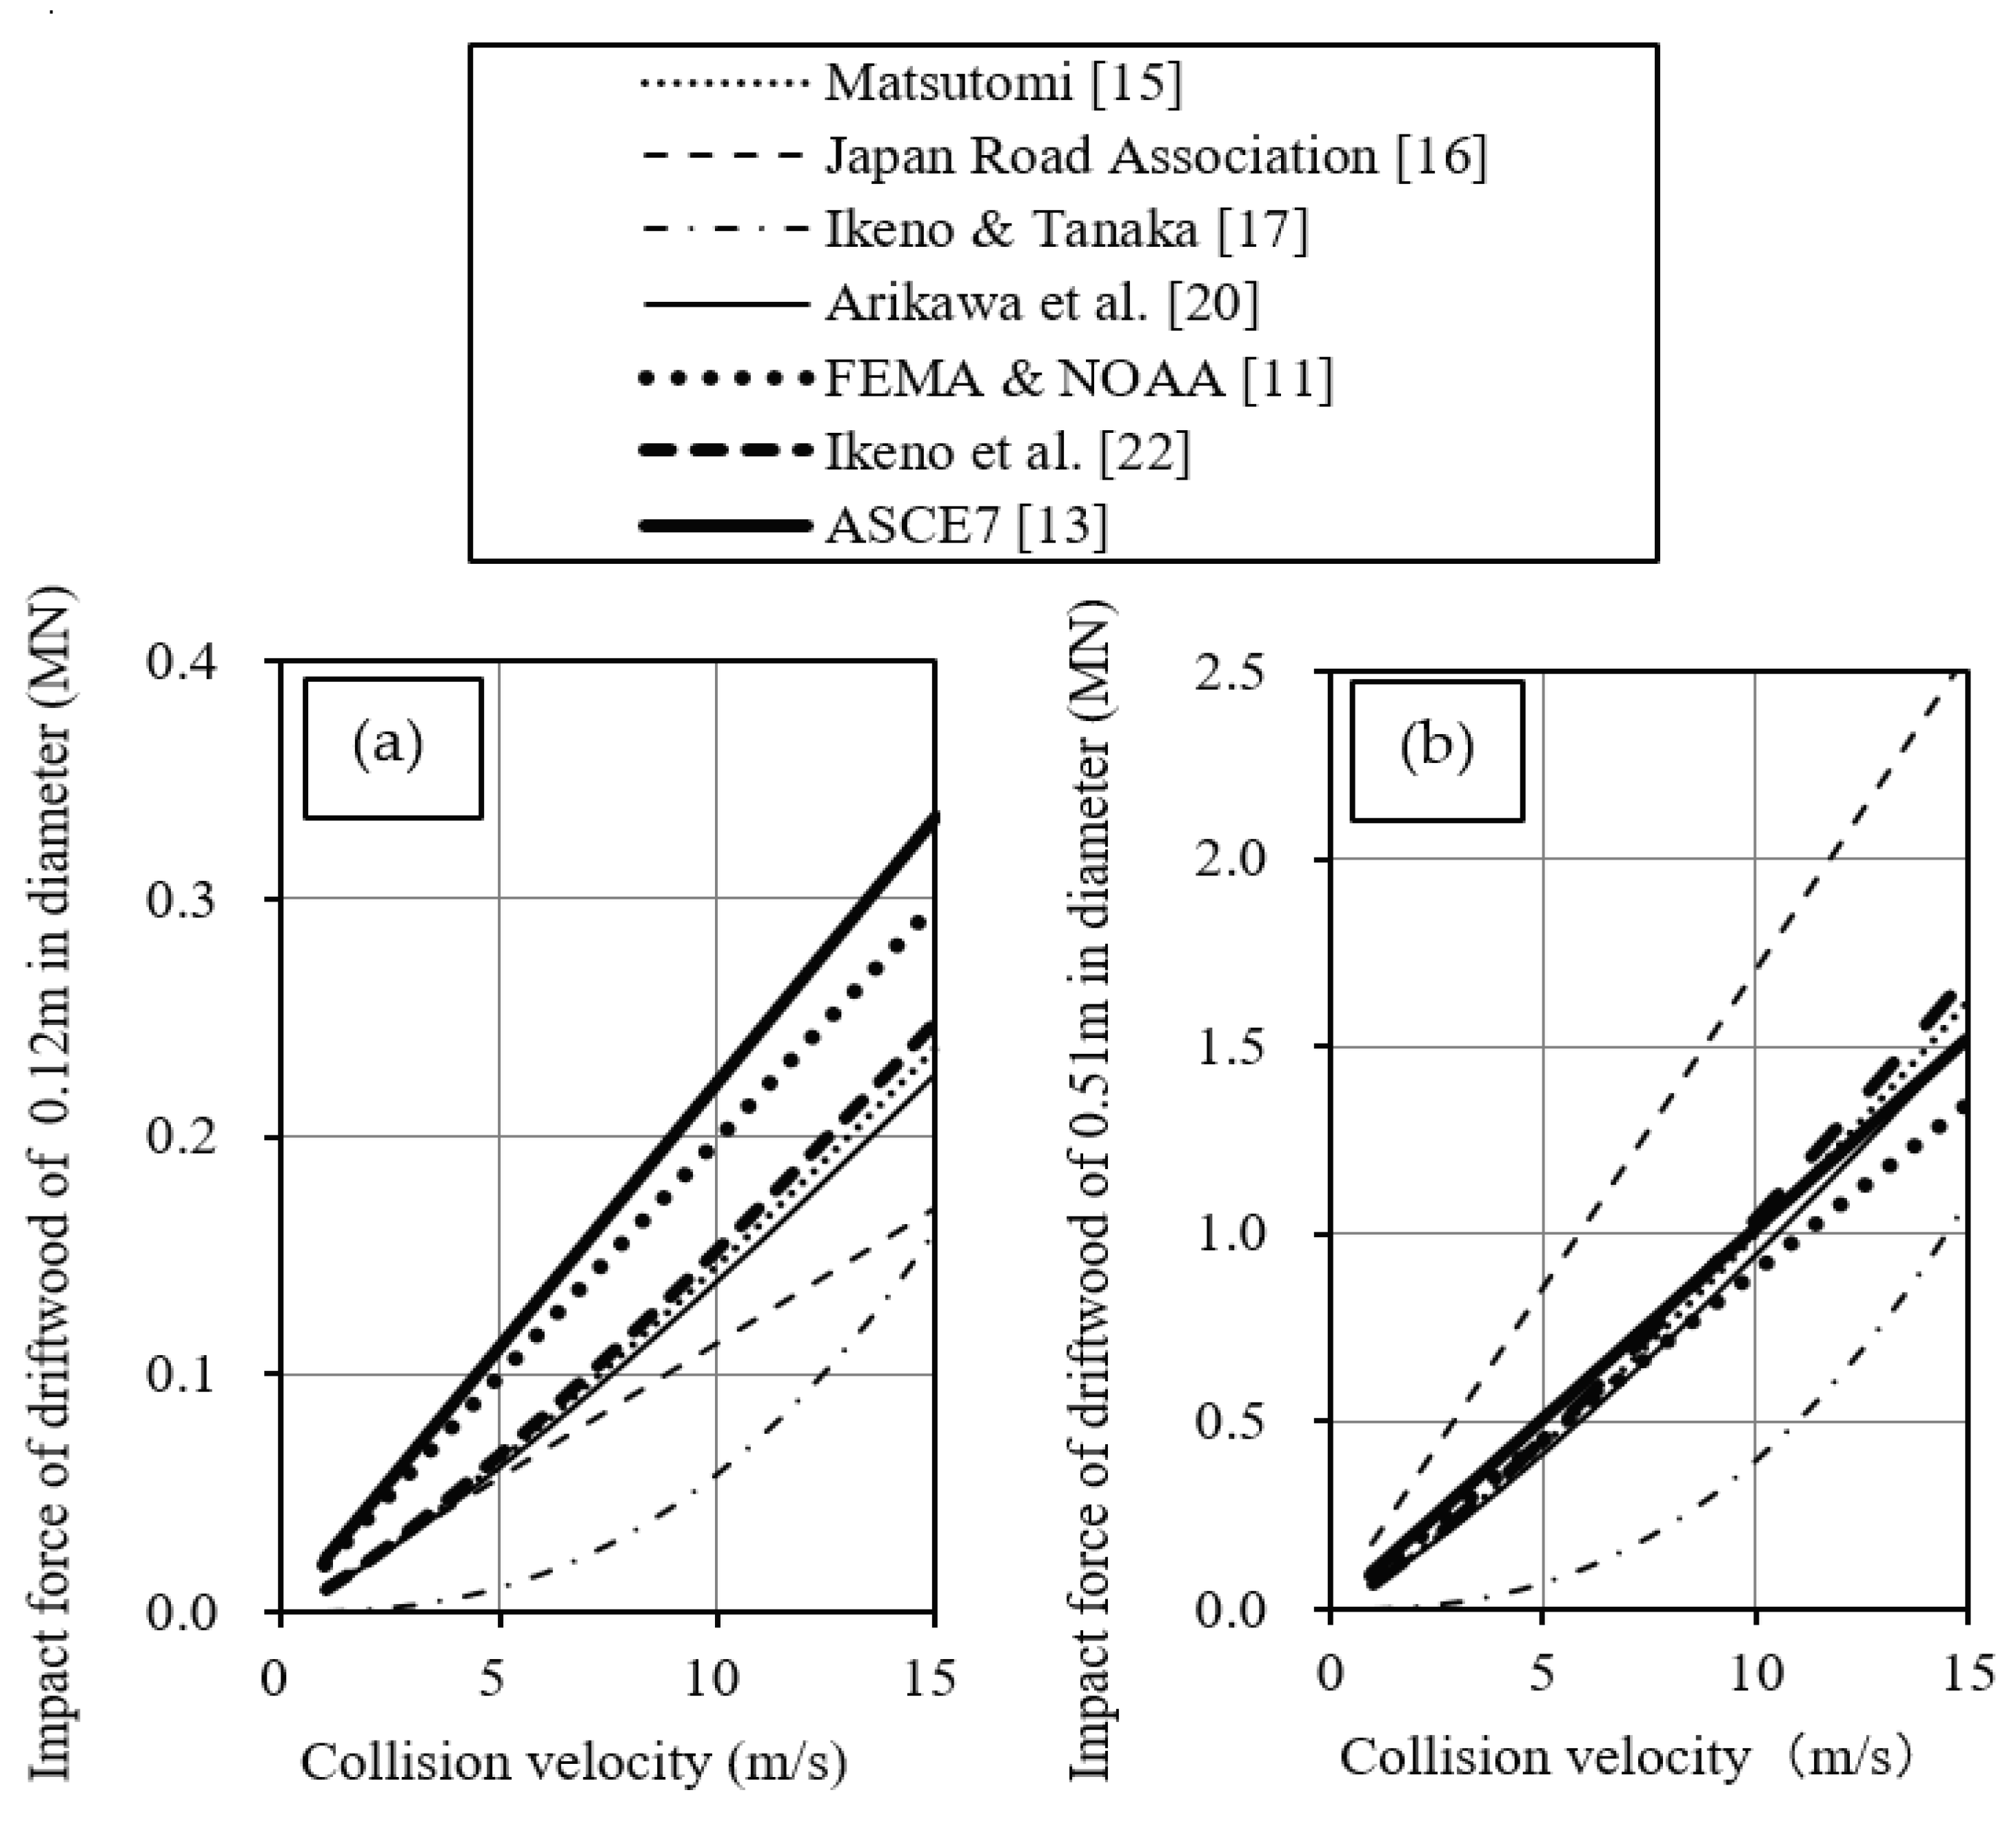
2.3.1. Driftwood
- (a)
- Parameters of a slender wood (pine and cedar);
- (b)
- Parameters of a thick wood (pine and cedar);
- (c)
- Parameters of the collided body (concrete);
- (d)
- Coefficients in the formula;
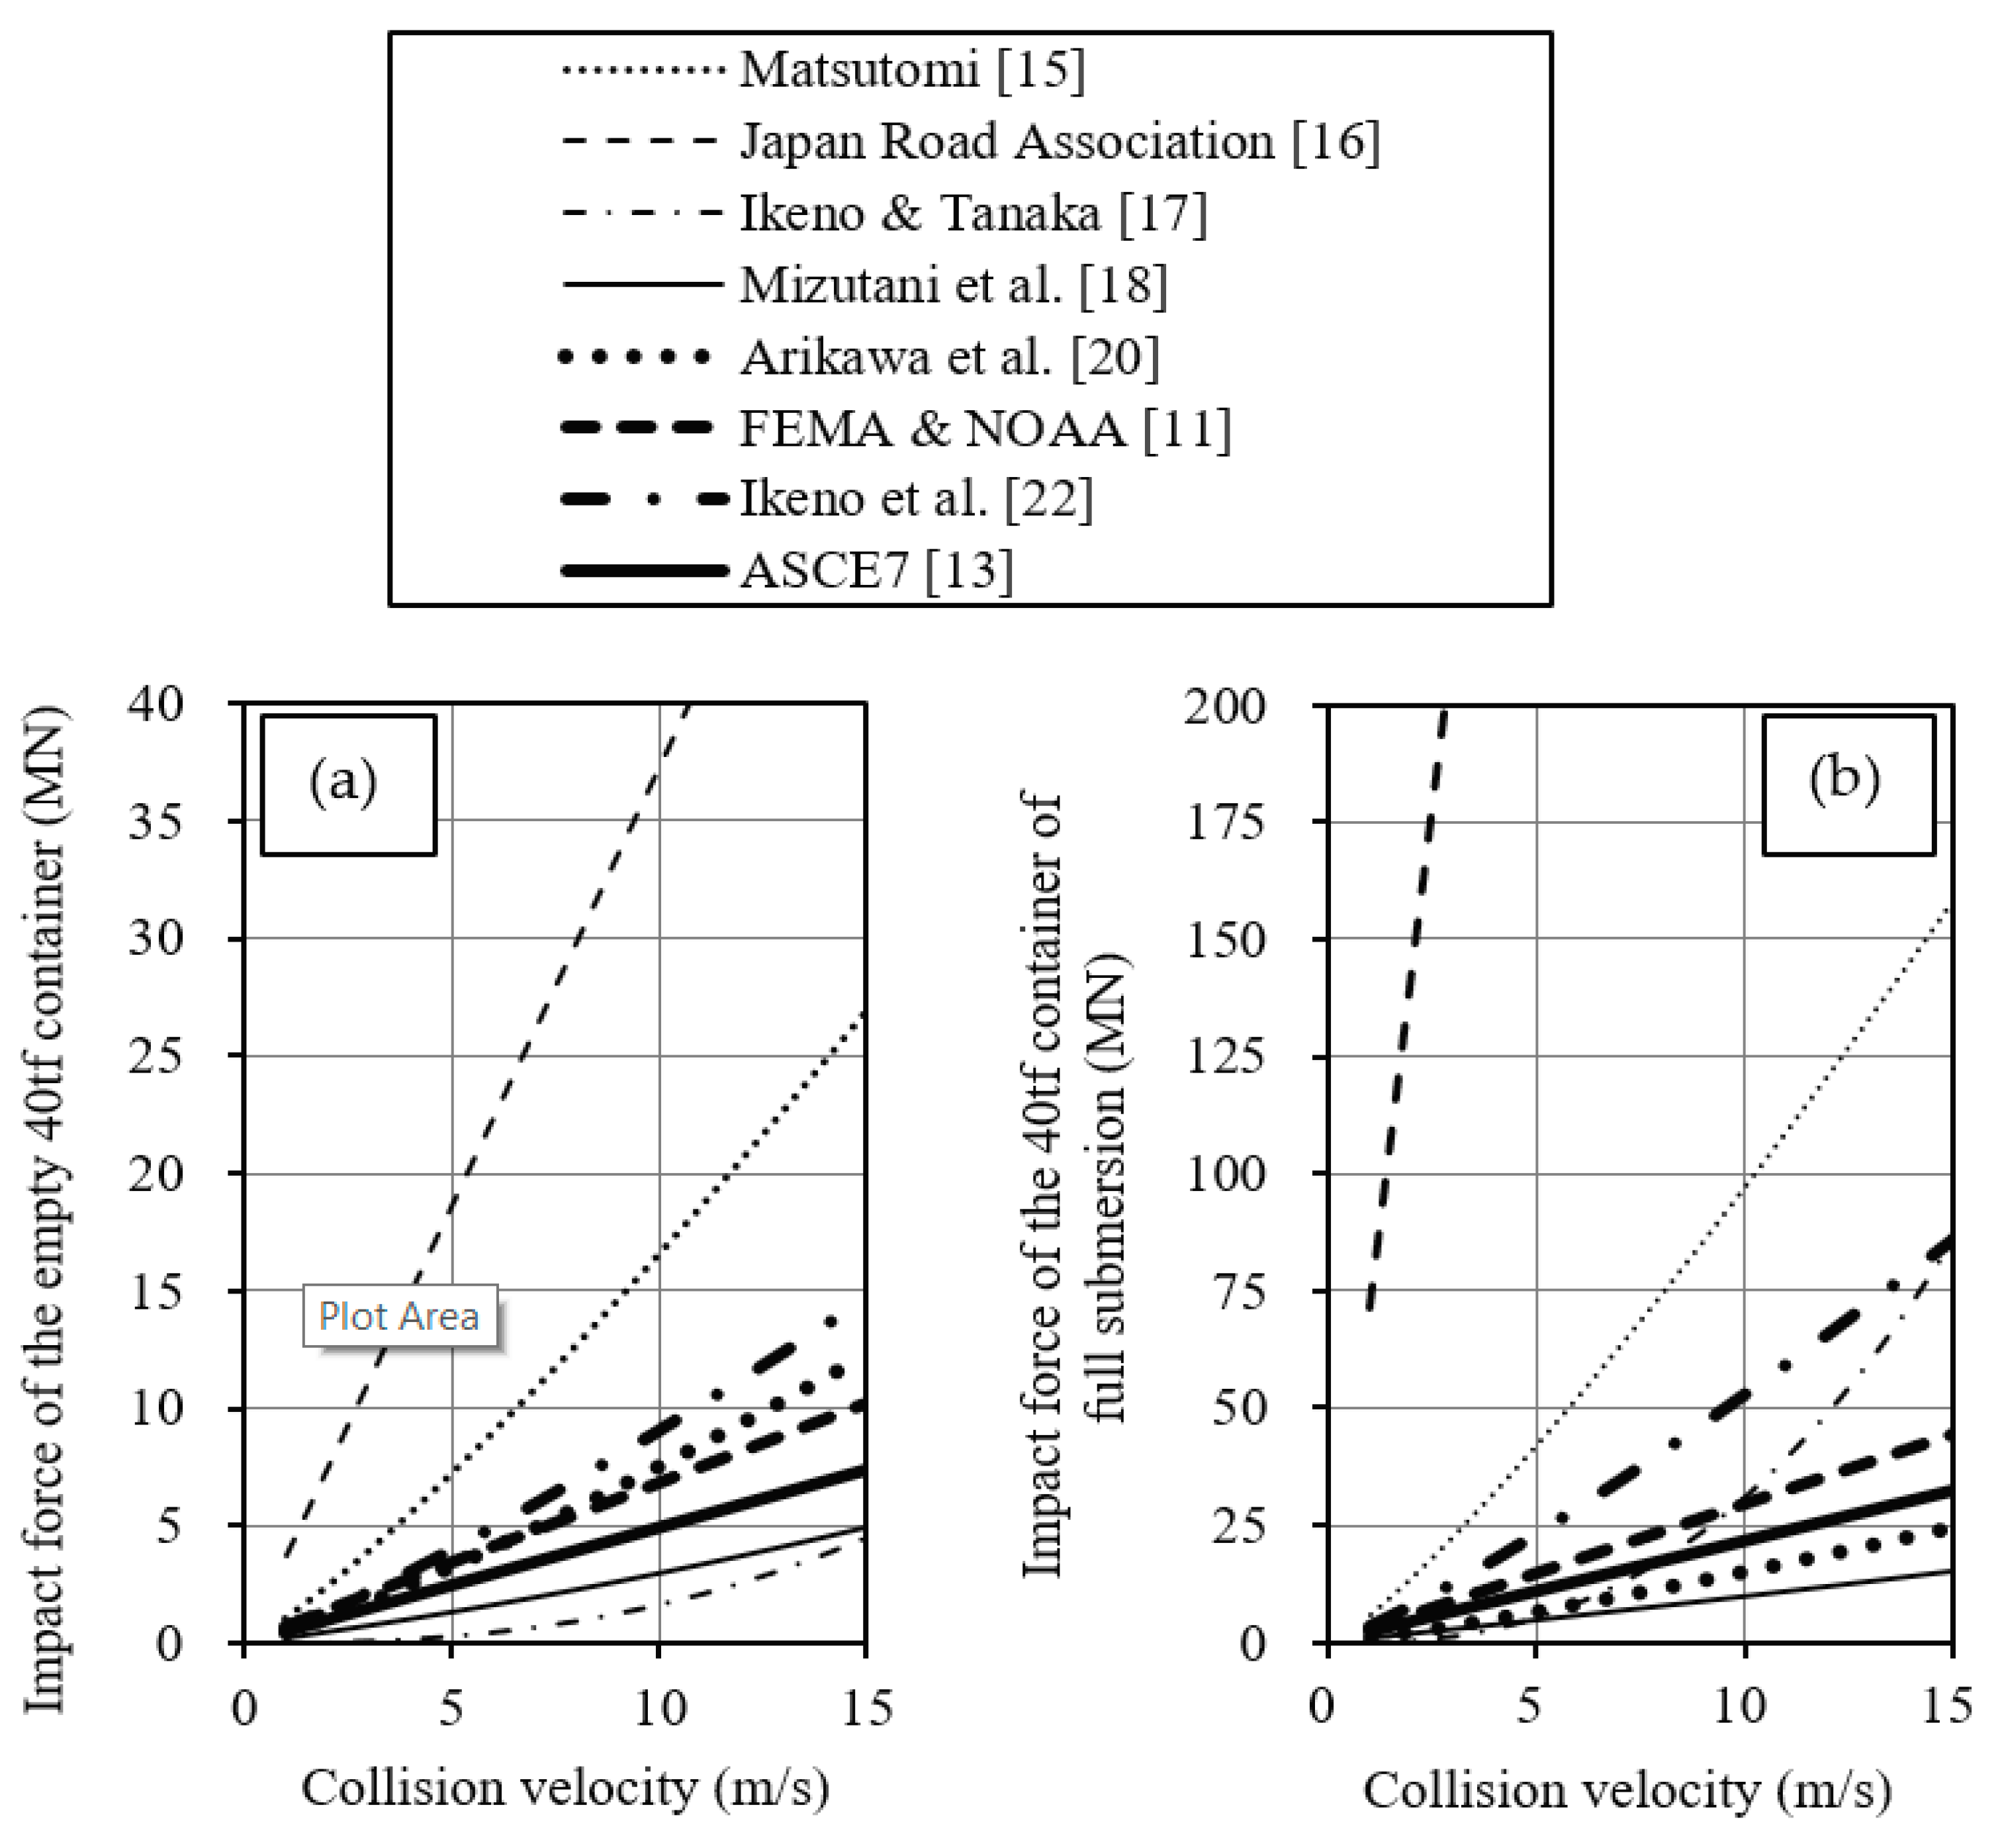
2.3.2. Containers
- (a)
- Parameters of an empty 12.2 m container;
- (b)
- Parameters of a fully-loaded 12.2 m container;
- (c)
- Parameters of the collided body (concrete);
- (d)
- Coefficients in the formula;
2.3.3. Car
- (a)
- Parameters of an actual car
- (b)
- Parameters of the collided body (concrete)
- (c)
- Coefficients of the formula
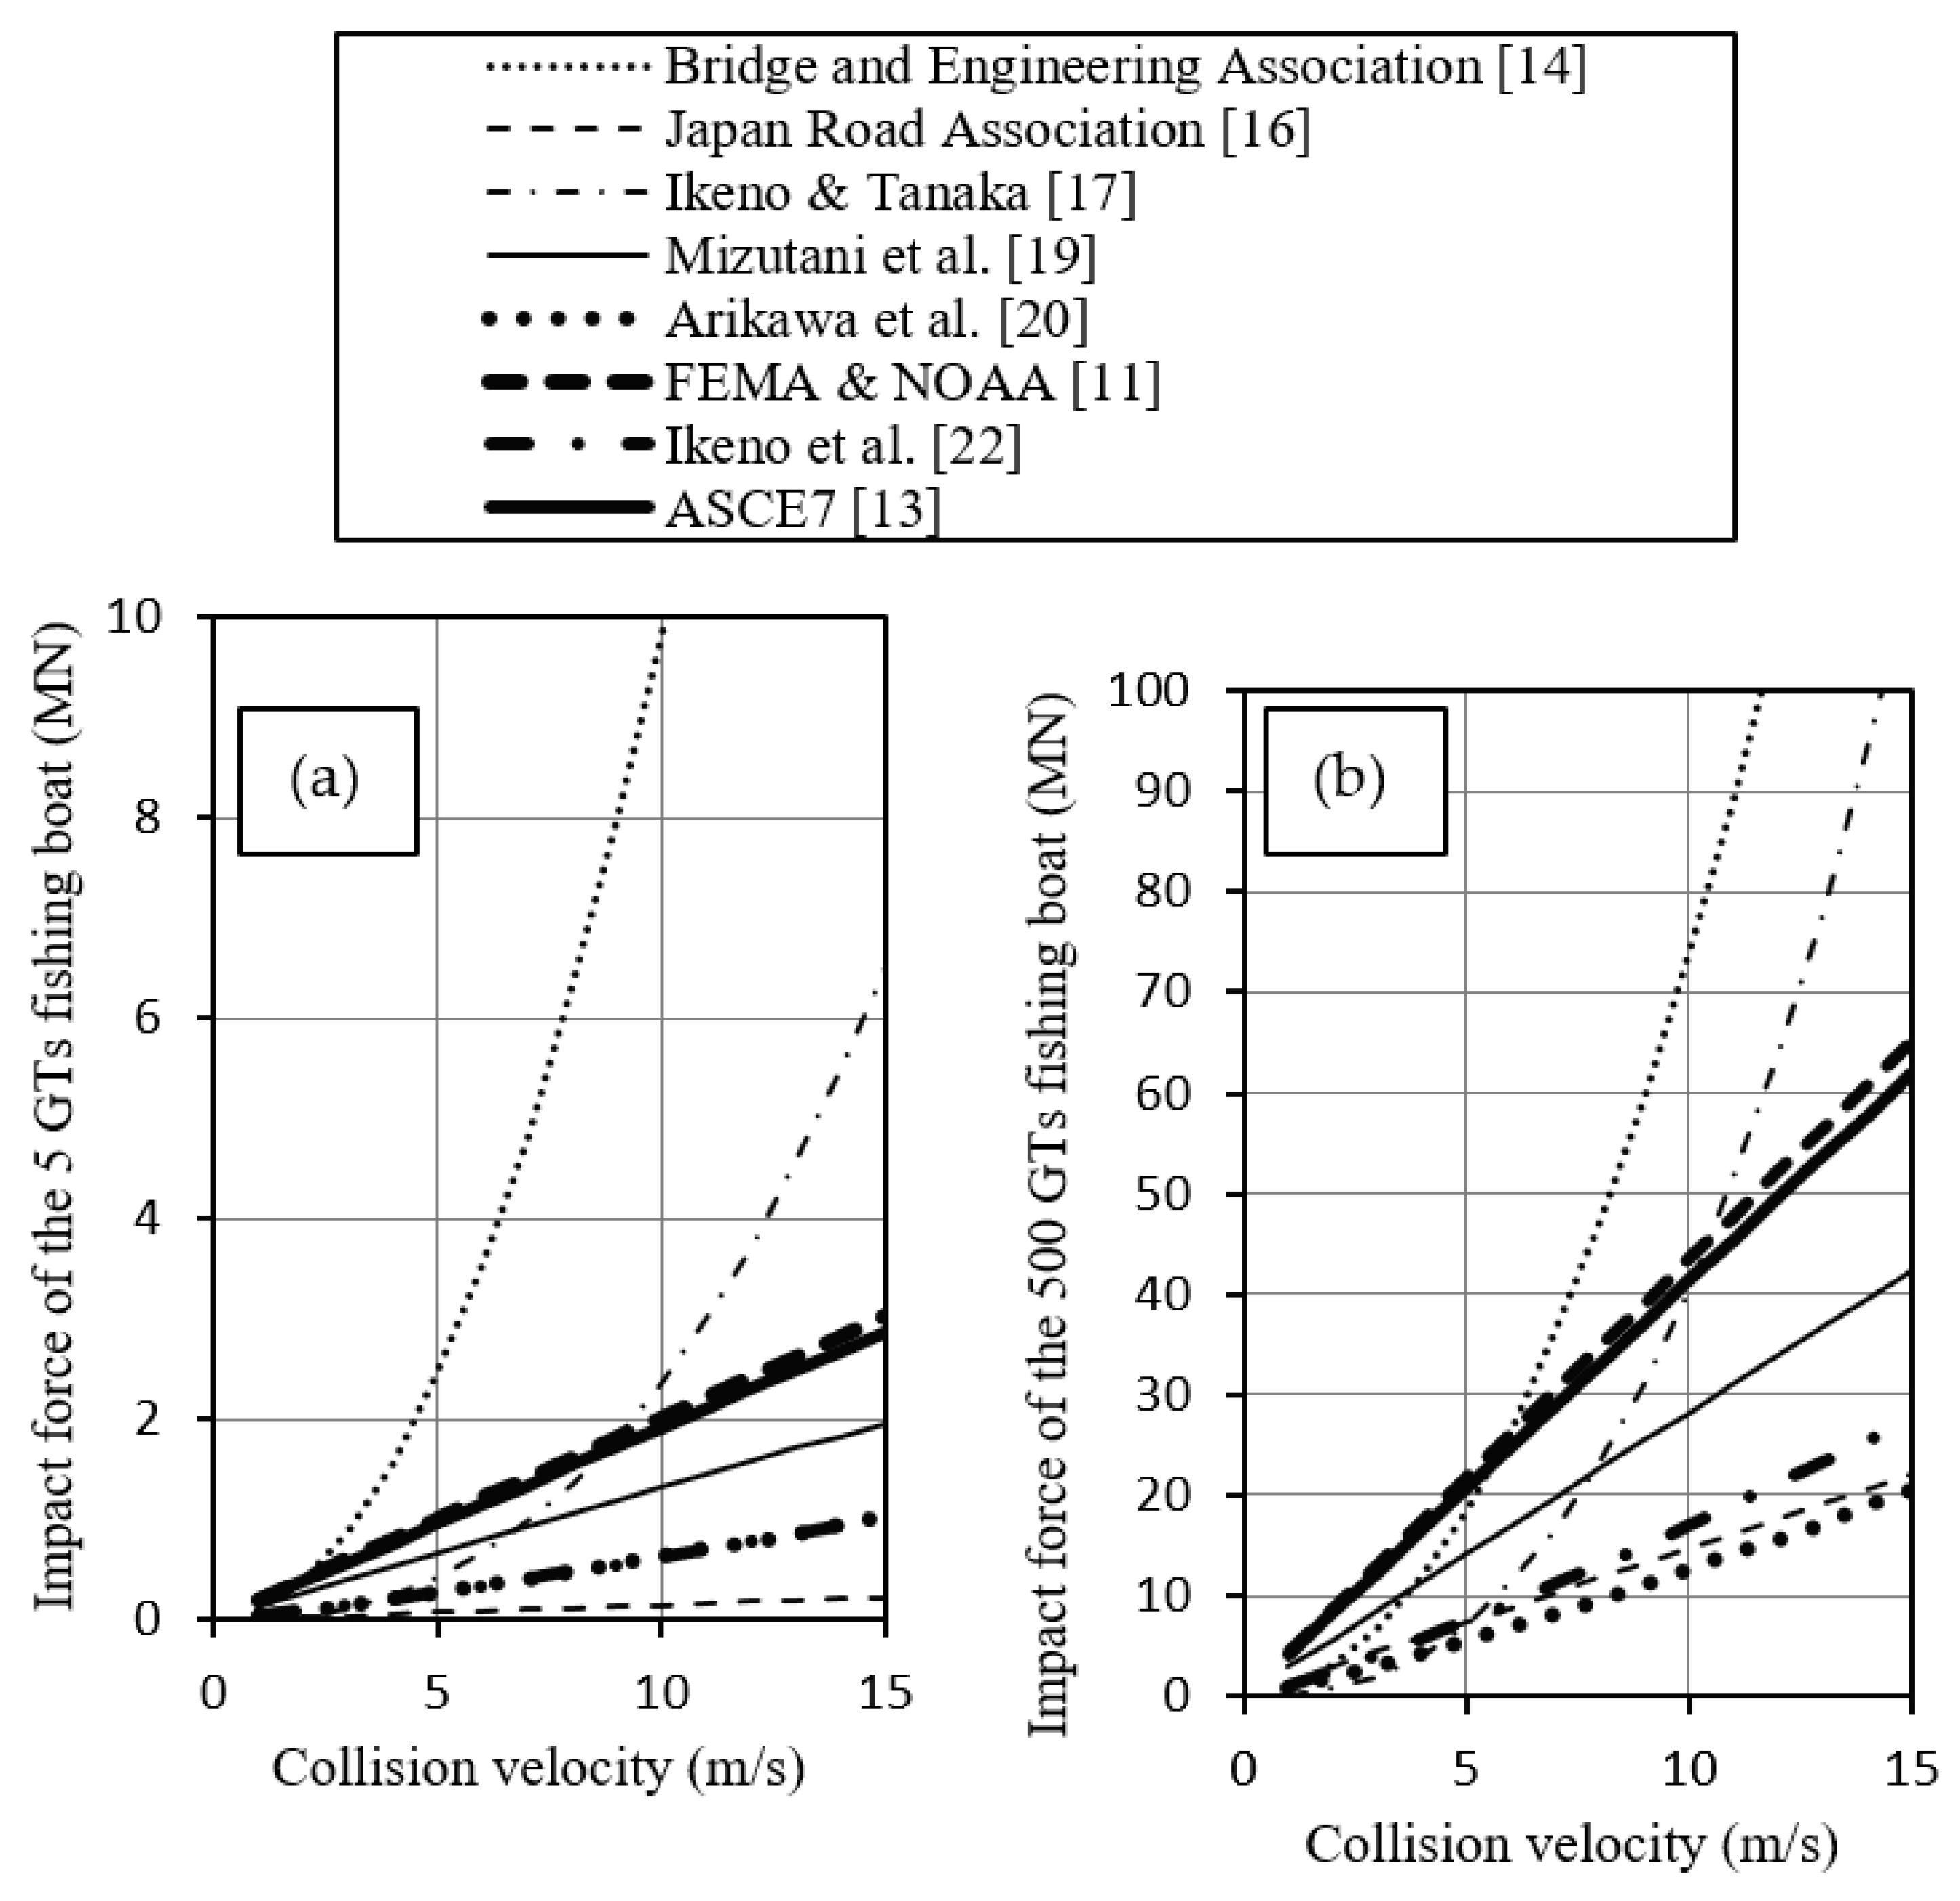
2.3.4. Ships
- (a)
- Parameters of a 5 GT ship
- (b)
- Parameters of a 500 GT ship
- (c)
- Parameters of the collided body (concrete)
- (d)
- Coefficients in the formula
3. Reliability Examination of Main Formulae
- (1)
- (2)
- (3)
- (4)
4. Conclusions
- (1)
- (2)
- (3)
- (4)
- (a)
- (b)
- Since the formulae of the Bridge and Engineering Association [14], Matsutomi [15], Mizutani et al. [18,19], Arikawa et al. [20], and Ikeno et al. [22] show good correlations with the measured values, provided the formulae are improved so that parameters concerning the rigidity of the driftage and the collided body can be considered, the reliability of the formulae is expected to increase, and the applicable scope to become larger;
- (c)
- Since the formulae of the Japan Road Association [16] and Ikeno and Tanaka [17] cannot make the difference in rigidity of the driftage and the collided body into consideration, the applicable range of their formulae is limited. Moreover, the former tends to give an excessive impact force, and the latter tends to give a too small impact force. Therefore, it is desirable to avoid using their equations.
Author Contributions
Funding
Institutional Review Board Statement
Informed Consent Statement
Data Availability Statement
Conflicts of Interest
References
- Nistor, I.; Goseberg, N.; Stolle, J. Tsunami-Driven Debris Motion and Loads: A Critical Review. Front. Built Environ. 2017, 3. [Google Scholar] [CrossRef] [Green Version]
- Naito, C.; Cercone, C.; Riggs, H.R.; Cox, D. Procedure for Site Assessment of the Potential for Tsunami Debris Impact. J. Waterw. Port Coastal Ocean Eng. 2014, 140, 223–232. [Google Scholar] [CrossRef]
- Yoneyama, N.; Tanaka, Y.; Pringle, J.W.; Nagashima, H. The development of three dimensional numerical analysis for tsu-nami driven debris in real scale senarios and its basic verification. J. JSCE B2 (Coast. Eng.) 2015, 71, 1027–1032. (In Japanese) [Google Scholar]
- Murase, F.; Teramoto, N.; Toyoda, A.; Tanaka, Y.; Arikawa, T. Examination for Evaluation Method of Collision Probability of Tsunami Debris Using Numerical Calculation. J. Jpn. Soc. Civ. Eng. Ser. B2 (Coast. Eng.) 2019, 75, I_439–I_444. [Google Scholar] [CrossRef]
- Magoshi, K.; Ge, H.; Nonaka, T.; Harada, T.; Murakami, K. Collision Simulation of A Large Flotsam and A Long-Span Bridge in A Tsunami. J. Jpn. Soc. Civ. Eng. Ser. B3 (Ocean Eng.) 2012, 68, 222–227. [Google Scholar] [CrossRef]
- Kaida, H.; Kihara, N. Evaluation Technologies for the Impact Assessment of Tsunami Debris on Nuclear Power Plants-Review of Current Status and Discussion on the Application; Central Research Institute of Electric Power Industry: Tokyo, Japan, 2017; Volume o16010, 45p. (In Japanese) [Google Scholar]
- Stolle, J.; Derschum, C.; Goseberg, N.; Nistor, I.; Petriu, E. Debris impact under extreme hydrodynamic conditions part 2: Impact force responses for non-rigid debris collisions. Coast. Eng. 2018, 141, 107–118. [Google Scholar] [CrossRef]
- Stolle, J.; Nistor, I.; Goseberg, N.; Petriu, E. Multiple Debris Impact Loads in Extreme Hydrodynamic Conditions. J. Waterw. Port Coast. Ocean Eng. 2020, 146, 04019038. [Google Scholar] [CrossRef]
- Haehnel, R.; Daly, S.F. Maximum impact force of woody debris on floodplain structures. J. Hydraul. Eng. 2004, 130, 112–120. [Google Scholar] [CrossRef]
- ASCE. ASCE/SEI, Standard 7-10, Minimum Design Loads for Buildings and Other Structures; ASCE: Virginia, WA, USA, 2010. [Google Scholar]
- FEMA. Guidelines for Design of Structures for Vertical Evacuation from Tsunamis, 2nd ed.; FEMA: Washington, DC, USA, 2012. [Google Scholar]
- Aghl, P.P.; Naito, C.J.; Riggs, H.R. Full-Scale Experimental Study of Impact Demands Resulting from High Mass, Low Velocity Debris. J. Struct. Eng. 2014, 140, 04014006. [Google Scholar] [CrossRef]
- ASCE. Standard 7, Chapter 6, Tsunami Loads and Effects; ASCE: Virginia, WA, USA, 2015. [Google Scholar]
- Marine Bridge Research Committee. Honshu Shikoku Bridge Technical Standards, Lower Volume, Sub-Structure Design Standards and Explanations; Bridge and Engineering Association: Tokyo, Japan, 1978. (In Japanese) [Google Scholar]
- Matsutomi, H. A practical formula for estimating impulsive force due to driftwoods and variation features of the impulsive force. Doboku Gakkai Ronbunshu 1999, 621, 111–127. (In Japanese) [Google Scholar] [CrossRef] [Green Version]
- Japan Road Association. Specifications for a Highway Bridge and Explanations, Part I Common; Japan Road Association: Tokyo, Japan, 2002; pp. 65–67. (In Japanese) [Google Scholar]
- Ikeno, M.; Tanaka, H. Experimental study on impulse force of drift body and tsunami running up to land. JSCE. Coast. Eng. 2003, 50, 721–725. (In Japanese) [Google Scholar]
- Mizutani, N.; Takagi, Y.; Shiraishi, K.; Miyajima, S.; Tomita, T. Study on wave force on a container on apron due to tsunamis and collision force of drifted container. Annu. J. Coast. Eng. JSCE 2005, 52, 741–745. (In Japanese) [Google Scholar]
- Mizutani, N.; Usami, A.; Koike, T. Experimental study on behavior of drifting boats due to tsunami and their collision forces. Annu. J. Civ. Eng. ocean, JSCE 2007, 23, 63–68. (In Japanese) [Google Scholar]
- Arikawa, T.; Ohtsubo, D.; Nakano, F.; Shimosako, K.; Ishikawa, N. Large Model Tests of Drifting Container Impact Force due to Surge Front Tsunami. Proc. Coast. Eng. JSCE 2007, 54, 846–850. [Google Scholar] [CrossRef] [Green Version]
- Arikawa, T.; Washizaki, M. Large Scale Tests on Concrete Wall Destruction by Tsunami with Driftwood. J. Jpn. Soc. Civ. Eng. Ser. B2 Coast. Eng. 2010, 66, 781–785. [Google Scholar] [CrossRef]
- Ikeno, M.; Kihara, N.; Takabatake, D. Simple and practical estimation of movement possibility and collision force of de-bris due to tsunami. J. JSCE B2 Coast. Eng. 2013, 69, 861–865. (In Japanese) [Google Scholar]
- Ikeno, M.; Takabatake, D.; Kihara, N.; Kaida, H.; Miyagawa, Y.; Shibayama, A. Collision Experiment of Woody Debris and Improvement of Collision Force Formula. J. Jpn. Soc. Civ. Eng. Ser. B2 Coast. Eng. 2015, 71, 1021–1026. [Google Scholar] [CrossRef]
- Takabatake, D.; Kihara, N.; Miyagawa, Y.; Kaida, H.; Shibayama, A.; Ikeno, M. Axial Stiffness Model for Estimating Floating Debris Impact Forces due to Tsunami. J. Jpn. Soc. Civ. Eng. Ser. B2 Coast. Eng. 2015, 71, 1015–1020. [Google Scholar] [CrossRef] [Green Version]
- Arita, K. A study on the strength of ships and other structures against collision. Rep. Natl. Marit. Res. Inst. 1988, 25, 35–125. (In Japanese) [Google Scholar]


| Driftage | Formula | Reference |
|---|---|---|
| Driftwood | Fi is the impact force (N); umax is the maximum velocity of driftwood; k is the effective contact stiffness; md is the mass of driftwood; cM is the added mass coefficient; mf is the mass of displaced fluid; β is the decreasing coefficient by the orientation angle φ; e is the decreasing coefficient by eccentricity; εo is the length from the barycenter to the collided point; ri is the turning radius; μ is the friction coefficient between the driftwood and the collided body; ro is the radius of the sectional area of the driftwood. | Haehnel and Daly (2004) [9] |
| Driftwood and Containers | Fi is the impact force (N); m is the mass of the driftage; u is the collision velocity; cI is the important factor; co is the orientation coefficient; cD is the coefficient of water depth; cB is the barrier coefficient; Rmax is the maximum response ratio to the collision load; Δt is the continuing time of the collision; k is the effective stiffness. | ASCE (2010) [10] |
| Driftwood (the Mass is about 450 kg) and Containers (the Empty Mass is 2200–3800 kg) | Fi is the impact force (N); 1.3 is the importance coefficient of risk category IV; umax is the maximum fluid velocity; md is the mass of driftage; k is the effective stiffness (2.4 × 10⁶ N/m to driftwood; 6.5 × 10⁸ N/m to 12.2 m empty containers; 1.5 × 10⁹ N/m to 6.1 m empty containers); c is the hydrodynamic mass coefficient (0.0 to the long axis direction for the collision of driftwood; 0.2 to the long axis direction for the collision of 12.2 m containers; 1.0 to the transverse direction for the collision of 12.2 m containers; 0.3 to the long axis direction of 6.1 m containers; 1.0 to the transverse direction of 6.1 m containers); g is the gravitational acceleration; R is the maximum run-up height × 1.3; z is the ground height on the water surface. | FEMA & NOAA (2012) [11] |
| Driftage | Formula | Reference |
|---|---|---|
| Driftwood, Containers, etc. | Fi is the impact force (N), u is the collision velocity; kd and md are the stiffness and the mass of driftage; E is the elastic modulus of driftage; Ad and Ld are the sectional area and the length of driftage. The impulse duration of the steel tube can be obtained using | Aghl, Naito, and Riggs (2014) [12] |
| Driftwood, Containers (6.1–12.2 m), Cars, Ships, etc. | Fi is the impact force (N); Rmax is the dynamic response ratio to the collision load (it is in the range of 0.0–1.8 according to the collision action time); ITSU is the importance factor (1.0–1.25); Co is the orientation coefficient (=0.65); umax is the maximum fluid velocity; k is the smaller one of (i) the stiffness of the driftage; (ii) the transverse direction stiffness of the collided body; md is the mass of the driftage. The stiffness of the driftwood can be calculated by using E is the elasticity modulus of the long axis direction of driftage; A and L are the sectional area and the length. The impulse duration for empty containers td can be calculated by using The impulse duration for loaded containers td can be calculated by using Here, mcontents is 50% of the maximum capacity of the container. | ASCE (2015) [13] |
| Ships | is the impact force (kN); is the weight of the ship (kN); is the collision velocity; is the stopping distance. Table of stopping distance of the ship 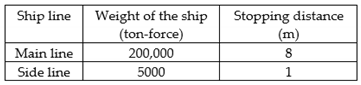 | Bridge and Engineering Association (1978) [14] |
| Driftwood (Long Axis Direction Collision) | F is the impact force (kN); is the apparent mass coefficient (1.7 for a bore or a surge, 1.9 for a steady flow); V is the collision velocity (m/s); D and L are the diameter and the length of driftwood (m); is the yield stress of driftwood (kN/m2]; is the unit weight of driftwood (kN/m3); is the gravitational acceleration. | Matsutomi (1999) [15] |
| Driftage | Formula | Reference |
|---|---|---|
| Driftwood, Cars, Ships, etc. | F is the impact force (kN): is the weight of driftage (kN); is the surface fluid velocity (m/s). | Japan Road Association (2002) [16] |
| Driftwood | F is the impact force (kN); S is a coefficient (5.0); is the added mass coefficient [pillar oriented transversely: 2.0 (two dimension), 1.5 (three dimension); square pillar oriented transversely: 2.0–4.0 (two dimension); 1.5 (three dimension); pillar oriented longitudinally: about 2.0, sphere: about 0.8]; is the bore fluid velocity (m/s); D is the collision section size (m); L is the length of driftwood (m); M is the mass of driftwood (kg); is the gravitational acceleration (m/s2). | Ikeno and Tanaka (2003) [17] |
| Containers | F is the impact force (kN); is the water density (t/m3); is the maximum run-up height; is the width of the container; is the drift velocity (m/s); W is the container weight; is the gravitational acceleration; dt is the collision time. | Mizutani et al. (2005) [18] |
| Small Ships | F is the impact force (kN); W is the weight of the small ship (kN); is the drifting velocity of the small ship (m/s); is the gravitational acceleration; dt is the collision time. | Mizutaniet al. (2007) [19] |
| Driftwood, Containers, etc. | for the driftwood: for the containers: F is the impact force (kN); is 1/2 of the radius of the collision sectional area (m); is the elastic modulus (kN/m2]; is Poisson’s ratio; is the mass (kg); V is the collision velocity (m/s); is the energy attenuation effect by plasticity (0.25); the suffix i of m and k indicates the driftage and the collided body. | Arikawa et al. (2007) [20], (2010) [21] |
| Driftwood and Containers | F is the impact force at the time of the elastic collision (kN); kc is a constant 0.243; is the apparent mass coefficient (2.0 for wooden pillar oriented longitudinally, 1.0 for containers); is the mass of driftage (kg); is the collision velocity (m/s); D is the collision sectional area size (m); E is the representative stiffness | Ikeno et al. (2013) [22] |
| Driftage | Examination Type | Bridge and Eng. Assoc. [14] | Matsutomi [15] | Japan Road Assoc. [16] | Ikeno and Tanaka [17] | Mizutani et al. [18,19] | Arikawa et al. [20] | FEMA and NOAA [11] | Ikeno et al. [22] | ASCE [13] |
| Driftwood | Correlation | ◯ | × | × | △ | ◯ | △ | ◯ | ||
| Existence range | × | |||||||||
| Reliability | ◯ | × | ◯ | ◯ | ||||||
| Container | Correlation | ◯ | × | × | △ | ◯ | ◯ | ◯ | ◯ | |
| Existence range | × | |||||||||
| Reliability | ◯ | × | ◯ | ◯ | ◯ | ◯ | ||||
| Car | Correlation | △ | × | × | △ | × | ◯ | × | ◯ | |
| Existence range | × | |||||||||
| Reliability | × | ◯ | ◯ | |||||||
| Fishing Boat | Correlation | △ | △ | × | ◯ | △ | ◯ | △ | ◯ | |
| Existence range | × | × | ||||||||
| Reliability | ◯ | ◯ | ◯ |
Publisher’s Note: MDPI stays neutral with regard to jurisdictional claims in published maps and institutional affiliations. |
© 2021 by the authors. Licensee MDPI, Basel, Switzerland. This article is an open access article distributed under the terms and conditions of the Creative Commons Attribution (CC BY) license (https://creativecommons.org/licenses/by/4.0/).
Share and Cite
Yamamoto, Y.; Kozono, Y.; Mas, E.; Murase, F.; Nishioka, Y.; Okinaga, T.; Takeda, M. Applicability of Calculation Formulae of Impact Force by Tsunami Driftage. J. Mar. Sci. Eng. 2021, 9, 493. https://doi.org/10.3390/jmse9050493
Yamamoto Y, Kozono Y, Mas E, Murase F, Nishioka Y, Okinaga T, Takeda M. Applicability of Calculation Formulae of Impact Force by Tsunami Driftage. Journal of Marine Science and Engineering. 2021; 9(5):493. https://doi.org/10.3390/jmse9050493
Chicago/Turabian StyleYamamoto, Yoshimichi, Yuji Kozono, Erick Mas, Fumiya Murase, Yoichi Nishioka, Takako Okinaga, and Masahide Takeda. 2021. "Applicability of Calculation Formulae of Impact Force by Tsunami Driftage" Journal of Marine Science and Engineering 9, no. 5: 493. https://doi.org/10.3390/jmse9050493