A Deep-Language Mathematical Analysis of Gospels, Acts and Revelation


1
Dipartimento di Elettronica Informazione e Bioingegneria, Politecnico di Milano, 20133 Milan, Italy
2
Istituto di Cristallografia, Consiglio Nazionale delle Ricerche (IC-CNR), 70126 Bari, Italy
*
Author to whom correspondence should be addressed.
Religions 2019, 10(4), 257; https://doi.org/10.3390/rel10040257
Submission received: 14 March 2019
/
Revised: 3 April 2019
/
Accepted: 5 April 2019
/
Published: 9 April 2019
(This article belongs to the Special Issue Current Trends in New Testament Study)
Abstract
:The paper aims at casting some light on the interrelations among the Gospels, Acts and Revelation. We do not consider words ranking and their frequency of occurrence, as largely done in the literature, but we analyze, statistically, some mathematical aspects of the texts, which the authors were not conscious of. We use mathematical methods developed for specifically studying deep-language parameters of literary texts, such as the number of words per sentence, the number of characters per word, the number of words per interpunctions, the number of interpunctions per sentence, all very likely peculiar to the writer’s style, after having recalled the punctuation in classical languages. First, we consider the full texts of the canonical Gospels, Acts and Revelation, then the partial texts attributable to the Triple Tradition (Matthew, Mark and Luke), to the Double Tradition (Matthew and Luke), Own Tradition (Matthew and Luke) and Q source. The mathematical/statistical tool used confirms and reinforces some general results concerning the Gospels, Acts, Revelation and Q source, but also evidences some interesting differences concerning the number of words per sentence and words per interpunctions, likely casting some light on the capacity of the short-term memory of the readers/listeners of these texts. All these New Testament writings fit very well in the larger Greek literature of the time. The existence of a proto gospel seems more probable than other possible hypotheses.
Keywords:
Acts; canonical Gospels; characters; Double Tradition; interpunctions; John; Luke; Mark; Matthew; own tradition; Q Source; Revelation; statistics; sentences; Triple Tradition; words; word interval1. Introduction
The Gospels of Matthew (Mt), Mark (Mk) and Luke (Lk), called synoptic because they have much material in common, are very different from that of John (Jn). The concordance and difference among them have produced many studies on their likely interdependence, giving rise to the so-called Synoptic Problem (Foster 2011). Although some scholars have largely supported an oral solution, there is a strong consensus on a documentary interdependence among the synoptic gospels (Reicke 1986). The traditional hypothesis, dating back to Augustine of Hippo (IV–V century), assumes that the order of composition of the synoptic Gospels was Matthew, Mark, Luke (Augustinian hypothesis). At the end of the XVIII century, Griesbach (Griesbach 1790) proposed the order Matthew, Luke, Mark (Griesbach hypothesis), resumed in recent years by Farmer (Two-Gospel or neo-Griesbach hypothesis, (Farmer 1983)). At the end of the XVIII century, however, the priority of Mark has taken hold, which today turns out to be the dominant hypothesis (Foster 2011), for the following reasons.
Mark has 661 verses, far fewer than Matthew (1068 verses) and Luke (1149 verses). 80% of Mark’s verses (meaning that they concern similar events) are found also in Matthew, and 65% in Luke. The Markan material found also in Matthew and Luke is referred to as the Triple Tradition (Table 1, Table 2 and Table 3). There are four main hypotheses that can account for the Triple Tradition:
- Markan priority hypothesis: Mark was the first Gospel and copied by both Matthew and Luke;
- Matthean priority hypothesis: Matthew was copied by Mark who, in turn, was copied by Luke (Augustinian hypothesis);
- Lukan priority hypothesis: Luke was copied by Mark who, in turn, was copied by Matthew;
- Griesbach hypothesis: Mark was third and he conflated Matthew and Luke (Griesbach 1790);
The material that Matthew and Luke share, about 220 verses—not present in Mark—is referred to as the Double Tradition (See Table 1, Table 2 and Table 3). There are three main hypotheses that can account for the Double Tradition:
- Q hypothesis: Matthew and Luke copied the Double Tradition from a common written source, usually named Q;
- Lukan posteriority hypothesis: Luke copied the Double Tradition from Matthew;
- Matthean posteriority hypothesis: Matthew copied the Double Tradition from Luke.
Many scholars share the Markan priority hypothesis for the Triple Tradition and the Q hypothesis for the Double Tradition (Two-Source hypothesis). The Q hypothesis rests on the independence of Matthew and Luke, and is framed in terms of the failure to prove that Luke depends upon Matthew or vice versa. If Matthew and Luke are independent, the Double Tradition must be explained by an indirect relationship upon common material, called Q. Accordingly, Mark was written first. Matthew and Luke independently copied Mark for its narrative framework (the Triple Tradition) and independently added discourse material from the Q source, which should have been lost (Weisse 1838; Stein 1994; Tuckett 1983; Goodacre 2001).
The reconstruction of the most primitive text of the Q source, however, remains a major ongoing enterprise (Foster 2011; Mack 1993). Nevertheless, most scholars assume valid the Two-Source hypothesis, even if it has deficiencies concerning some “minor agreements” (Foster 2011; Neirynck et al. 1974; Streeter 1924), because there are verses in which Matthew and Luke agree but diverge from Mark. The presence of these verses does not seem to be immediately compatible with the Mark priority.
Besides the Two-Gospel or neo-Griesbach hypothesis (Farmer 1983), another solution to the “minor agreements” is to hypothesize that Matthew, Mark and Luke depend on a primitive Gospel, called the Proto-Matthew, which, accordingly, was combined by Luke and Matthew with another supplementary source (Goodacre 2001; Vaganay 1954; Boismard 1979). This hypothesis (Proto-Gospel hypothesis) has been further developed by other scholars (Rolland 1984; Burkett 2004).
In summary, in these developments, it is supposed that the common material among the three synoptic Gospels would derive from a proto gospel. This proto gospel would have undergone two independent revisions, A and B. Mark would have recombined these two revisions; A + B. Matthew would have-based his Gospel on A, Luke on B. Moreover, both Matthew and Luke would have also drawn from a common collection of Jesus’ sayings, the Q source, as well as from other sources for their unique material, such as, for example, the Gospels of Infancy.
Other scholars, such as Butler (Butler 1951), have argued that Luke borrowed the material of the Double Tradition directly from Matthew, without referring to the hypothetical Q source. Even Mark would depend directly on Matthew. This hypothesis can be considered of Augustinian type because it proposes the Matthean priority hypothesis for the Triple Tradition and the Lukan posteriority hypothesis for the Double Tradition.
Another alternative approach to explain the problems of the Two-Source hypothesis, which received particular attention in the latest years, is Farrer’s hypothesis. It assumes the Markan priority hypothesis for the Triple Tradition and the Lukan posteriority hypothesis for the Double Tradition. The Double Tradition is explained by Luke’s further use of Matthew, thus dispensing with Q (Farrer 1955).
Going to the fourth gospel, there is more agreement that it does not depend on the Synoptics and vice versa, at least in their definitive versions, the canonical Gospels (Smith 1984). As a result, John can tell very little about the composition of the synoptic Gospels. Moreover, Acts are traditionally attributed to Luke, and Revelation is traditionally attributed to John. These attributions have been extensively discussed by scholars (Boring 1998). In principle, all these New Testament writings could be compared to search probable literary interrelations.
Given this general and not exhaustive overview of the complexity of the literary interdependence among some of the most important New Testament writings, the purpose of this paper is to help to cast some light on the interrelations among the Gospels (Mt, Mk, Lk, Jn), Acts (Ac) and Revelation (Re), by considering deep-language statistics not consciously controllable by the authors. For our analysis, we use some of the mathematical and statistical tools developed for specifically studying literary texts (Matricciani 2019), such as the number of words per sentence, , the number of characters per word, , the number of words per interpunctions, the number of interpunctions per sentence, ), all very likely peculiar to a writer’s style. In other words, we do not consider words ranking and frequencies of occurrence, as largely done in the literature—items not directly linked to the four parameters just mentioned—but we analyze statistically some aspects of the texts, which the authors were not conscious of. Our innovative approach has allowed assessing mathematical similarities and differences in a large corpus of literary texts written by the Italian mystic Maria Valtorta (Matricciani and De Caro 2018).
After this Introduction, in Section 2 we recall some mathematical parameters of text analysis; in Section 3 we summarize the main points on punctuation in classical Latin and Greek texts; in Section 4 we study the full texts of Matthew, Mark, Luke, Acts, and Revelation; in Section 5 we consider the texts of the so-called Triple Tradition (Matthew, Mark and Luke) and Q source; in Section 6 we consider the Double Tradition (Matthew and Luke) and Q; in Section 7 we consider the Own Tradition (Matthew and Luke) and Q; in Section 8 we show the relationship between the number of words per interpunctions and the number of words per sentence to evaluate the readability of the various texts; this section shows also a geometrical representation of the texts useful to evaluate at glance how identical or different the texts are; in Section 9, to place the New Testament writings in the larger Greek literature context of the time, we compare the mathematical/statistical results to those found in classical works of this literature; in Section 10, to obtain some indirect hints for discriminating the different hypotheses on Gospels’ genesis, we review our results with a graphical synthesis; finally in Section 11 we discuss the overall results and indicate some future work.
2. Some Mathematical Parameters of Text Analysis
Statistics of the Greek language used in the New Testament have been widely calculated by counting words and establishing their frequencies of occurrence (Van Voorst 2001; Poirier 2008; Brodie 2004; Abakuks 2015; Mealand 2016; Gareiou and Zervas 2018).
In this paper, we do not study word frequencies, but analyze the number of words per sentence, , the number of characters per word, , the number of words per interpunctions, the number of interpunctions per sentence, , all parameters very likely peculiar to a writer’s style or, in any case, to a particular text. Notice that gives also the number of word intervals in a sentence, because .
In particular, the number of words per interpunctions, referred to as the word interval (Matricciani 2019), namely the number of words between two successive interpunctions, is an interesting parameter because it very likely linked, empirically, to the capacity of the short–term memory—described by Miller’s “2 law” (Miller 1955)—required of the readers, with appropriate cultural background, to read the text more easily. The word interval is, in fact, spread in the same range of Miller’s law and, if converted into a time interval through an average reading speed, as shown for Italian (Matricciani 2019; Matricciani and De Caro 2018), it is spread in the same range of time that the immediate memory needs to record the stimulus for memorizing it in the short-term memory.
We think that the study of these linguistic parameters and their statistics, not consciously controllable by the authors, can cast some light on the interdependence of the four canonical Gospels, of Acts and Revelation. However, before proceeding with the mathematical/statistical analysis of the complete original Greek versions, we summarize, in the next section, what is known about the punctuation of classical (Greek and Latin) texts, because , and do depend on punctuation.
3. Punctuation in Classical Texts
We summarize the main points on punctuation in classical Latin and Greek texts, following Parkes (Parkes 1992). Punctuation is typical of written language and its history follows that of the written medium. In the Greek and Roman times, the written word was regarded as a record of the spoken word and texts were mostly read aloud. Starting from the sixth century, writing came to be regarded as conveying information directly to the mind through sight, so that silent reading became the norm. Before, as texts were mostly read aloud, a reader might murmur the sounds of the words to himself, but the ideal reader was one that declaimed the text with well-modulated pronunciation in which the text was carefully phrased by appropriate pauses. Silent reading was so rare that Augustine was astonished when in Milan, in the years 386–87, he saw the Bishop Ambrose reading without making a sound, as he recalls in his Confessions1. In any case, the ancient perception was that the written word was a record of the spoken word to be always heard in a reader’s mind.
From Antiquity, no manuscript containing the author’s own handwriting has survived. This lack of autograph material is attributed to the practice of dictating one’s own literary works, letters, and even notes, to scribes. Because the work of scribes was mechanical, they reproduced as faithfully as possible what had been transmitted to them, without further interpretation, therefore they did not introduce punctuation. Consequently, the text was difficult to be read at first sight, even though they indicated major divisions, such as chapters and paragraphs, a practice, which seems to go back to the second century B.C.
In the first century, in Latin manuscripts, words were separated by interpunctions, but this practice ceased by the end of the first century, and thereafter Roman scribes imitated Greek ones by copying texts without separating words (the so-called scriptio continua), or indicating any pauses within a major section of the text. When a text was written in scriptio continua, it required careful preparation before it could be read aloud with appropriate pronunciation and expression. Rendering a text in scriptio continua required an interpreter to identify many elements, such as letters, syllables, words, before conveying to their own mind, or to listeners, the full meaning of the text. Reading at first sight was thus unusual and unexpected.
Pauses in a text, however, started to be annotated thanks to the initiative of the reader who would insert them according to the difficulty of the text and to a reader’s comprehension. Many efforts were made to preserve, restore and explain texts, and to make texts more readable to a wider audience. Moreover, well-educated readers realized that the comprehension of literary language was declining and starting to affect the integrity of the texts, therefore they corrected and annotated their own copies for the benefit of friends and future readers.
For a religion of the book, as is the Christian Faith, grammatical culture was fundamental to the study of Scripture; therefore, at the higher levels, Christian scholars looked for the best manuscripts, corrected and annotated them, using the apparatus of textual criticism employed by classical scholars. In the third century, Origen (185–254) introduced the critical signs developed in the second century B.C. by Aristarchus in Alexandria.
Christianity attracted believers from all levels of society, and contrary to the elite audience of classical pagan literary texts, the Christian audience covered the whole spectrum of literacy. Some Christians read for themselves, but most of them could not read and listened to texts read aloud in churches, which, therefore, had to be paused for better delivering their correct meaning. In other words, the punctuation of the Bible became especially important when it was read in church, so that the reading and the Christian message could reach the whole community, both in the Latin and Greek speaking parts of the Roman Empire.
In a period dominated by oratory, the principal function of pauses, whether in speaking or reading, was not only to allow the reader to take a breath but also to phrase the delivery of a speech, or the reading of a text, to convey its meaning correctly. Pausing therefore belonged to reading, not to writing or copying, and during the first six centuries, wherever punctuation was employed, it was inserted by readers, or by scribes, as they read their own copies.
One of the weaknesses of the data about interpunctions is that it is not known how well the scribes interpreted the original intent of the authors. We can assume it was close. However, we must also acknowledge that it was not perfect. In conclusion, the actual punctuation in the New Testament texts in Greek is likely reliable because many scholars read these texts very carefully, and inserted interpunctions for improving text intelligibility and conveying the Christian faith without errors. Moreover, we can figure out that all these texts were treated homogenously, therefore, if we consider correct the inserted interpunctions in the New Testament writings, then our mathematical analysis, partially based on interpunctions, is justified and should be reliable.
4. Full Texts
In this section, we consider the full texts of Matthew, Mark, Luke, John, Acts and Revelation2. Afterwards we will consider the partial texts, which, as recalled in the Introduction, have been recognized as common to two or more authors. In the Gospels of Matthew and Luke, we have deleted the verses that list the names of Jesus’ ancestors (genealogy), to avoid some polarization of the statistics concerning, mainly, sentence length and word interval.
Our comparison considers the density and probability distribution functions (i.e., the probability that the indicated value is not exceeded) of the four parameters defined in Section 1, and the conclusions are based on the Kolmogorov–Smirnov test, mostly adopted for comparing probability distribution functions, as summarized in Appendix C of Matricciani and De Caro (2018). For each of the four parameters, the mathematical model of the probability density function is a three-parameter log-normal function, as described in Appendix B of Matricciani and De Caro (2018), each referred (scaled) to text block of 500 words (instead of 1000 because of the shorter literary texts here considered): see Appendix A of Matricciani and De Caro (2018). The threshold of the log-normal model for all variables, i.e., their minimum value, is 1. In other words, the density is shifted 1 unit to the right. We report the fundamental statistical results of the various selections in Table 4, Table 5, Table 6 and Table 7. From these data, the three-parameter log-normal probability density functions are derived as shown in Appendix B of (Matricciani and De Caro 2018).
Finally, notice that if different versions of Greek texts were analyzed, the statistical results reported below would not change in any significant way because of the large number of words, sentences, interpunctions considered. As an example, in the version we have analyzed the episode narrated in John 8,1–11 (about a woman caught in adultery) is not present, because, as is known (Ehrman 2000), this episode is missing in some of the early manuscripts. If these 11 verses were present, only the totals of the four parameters mentioned above would be slightly affected, but not in a significant way. The impact would be even smaller if some words were changed, as it can be in other manuscripts. Recall that the meaning of a text has no importance in our mathematical analysis.
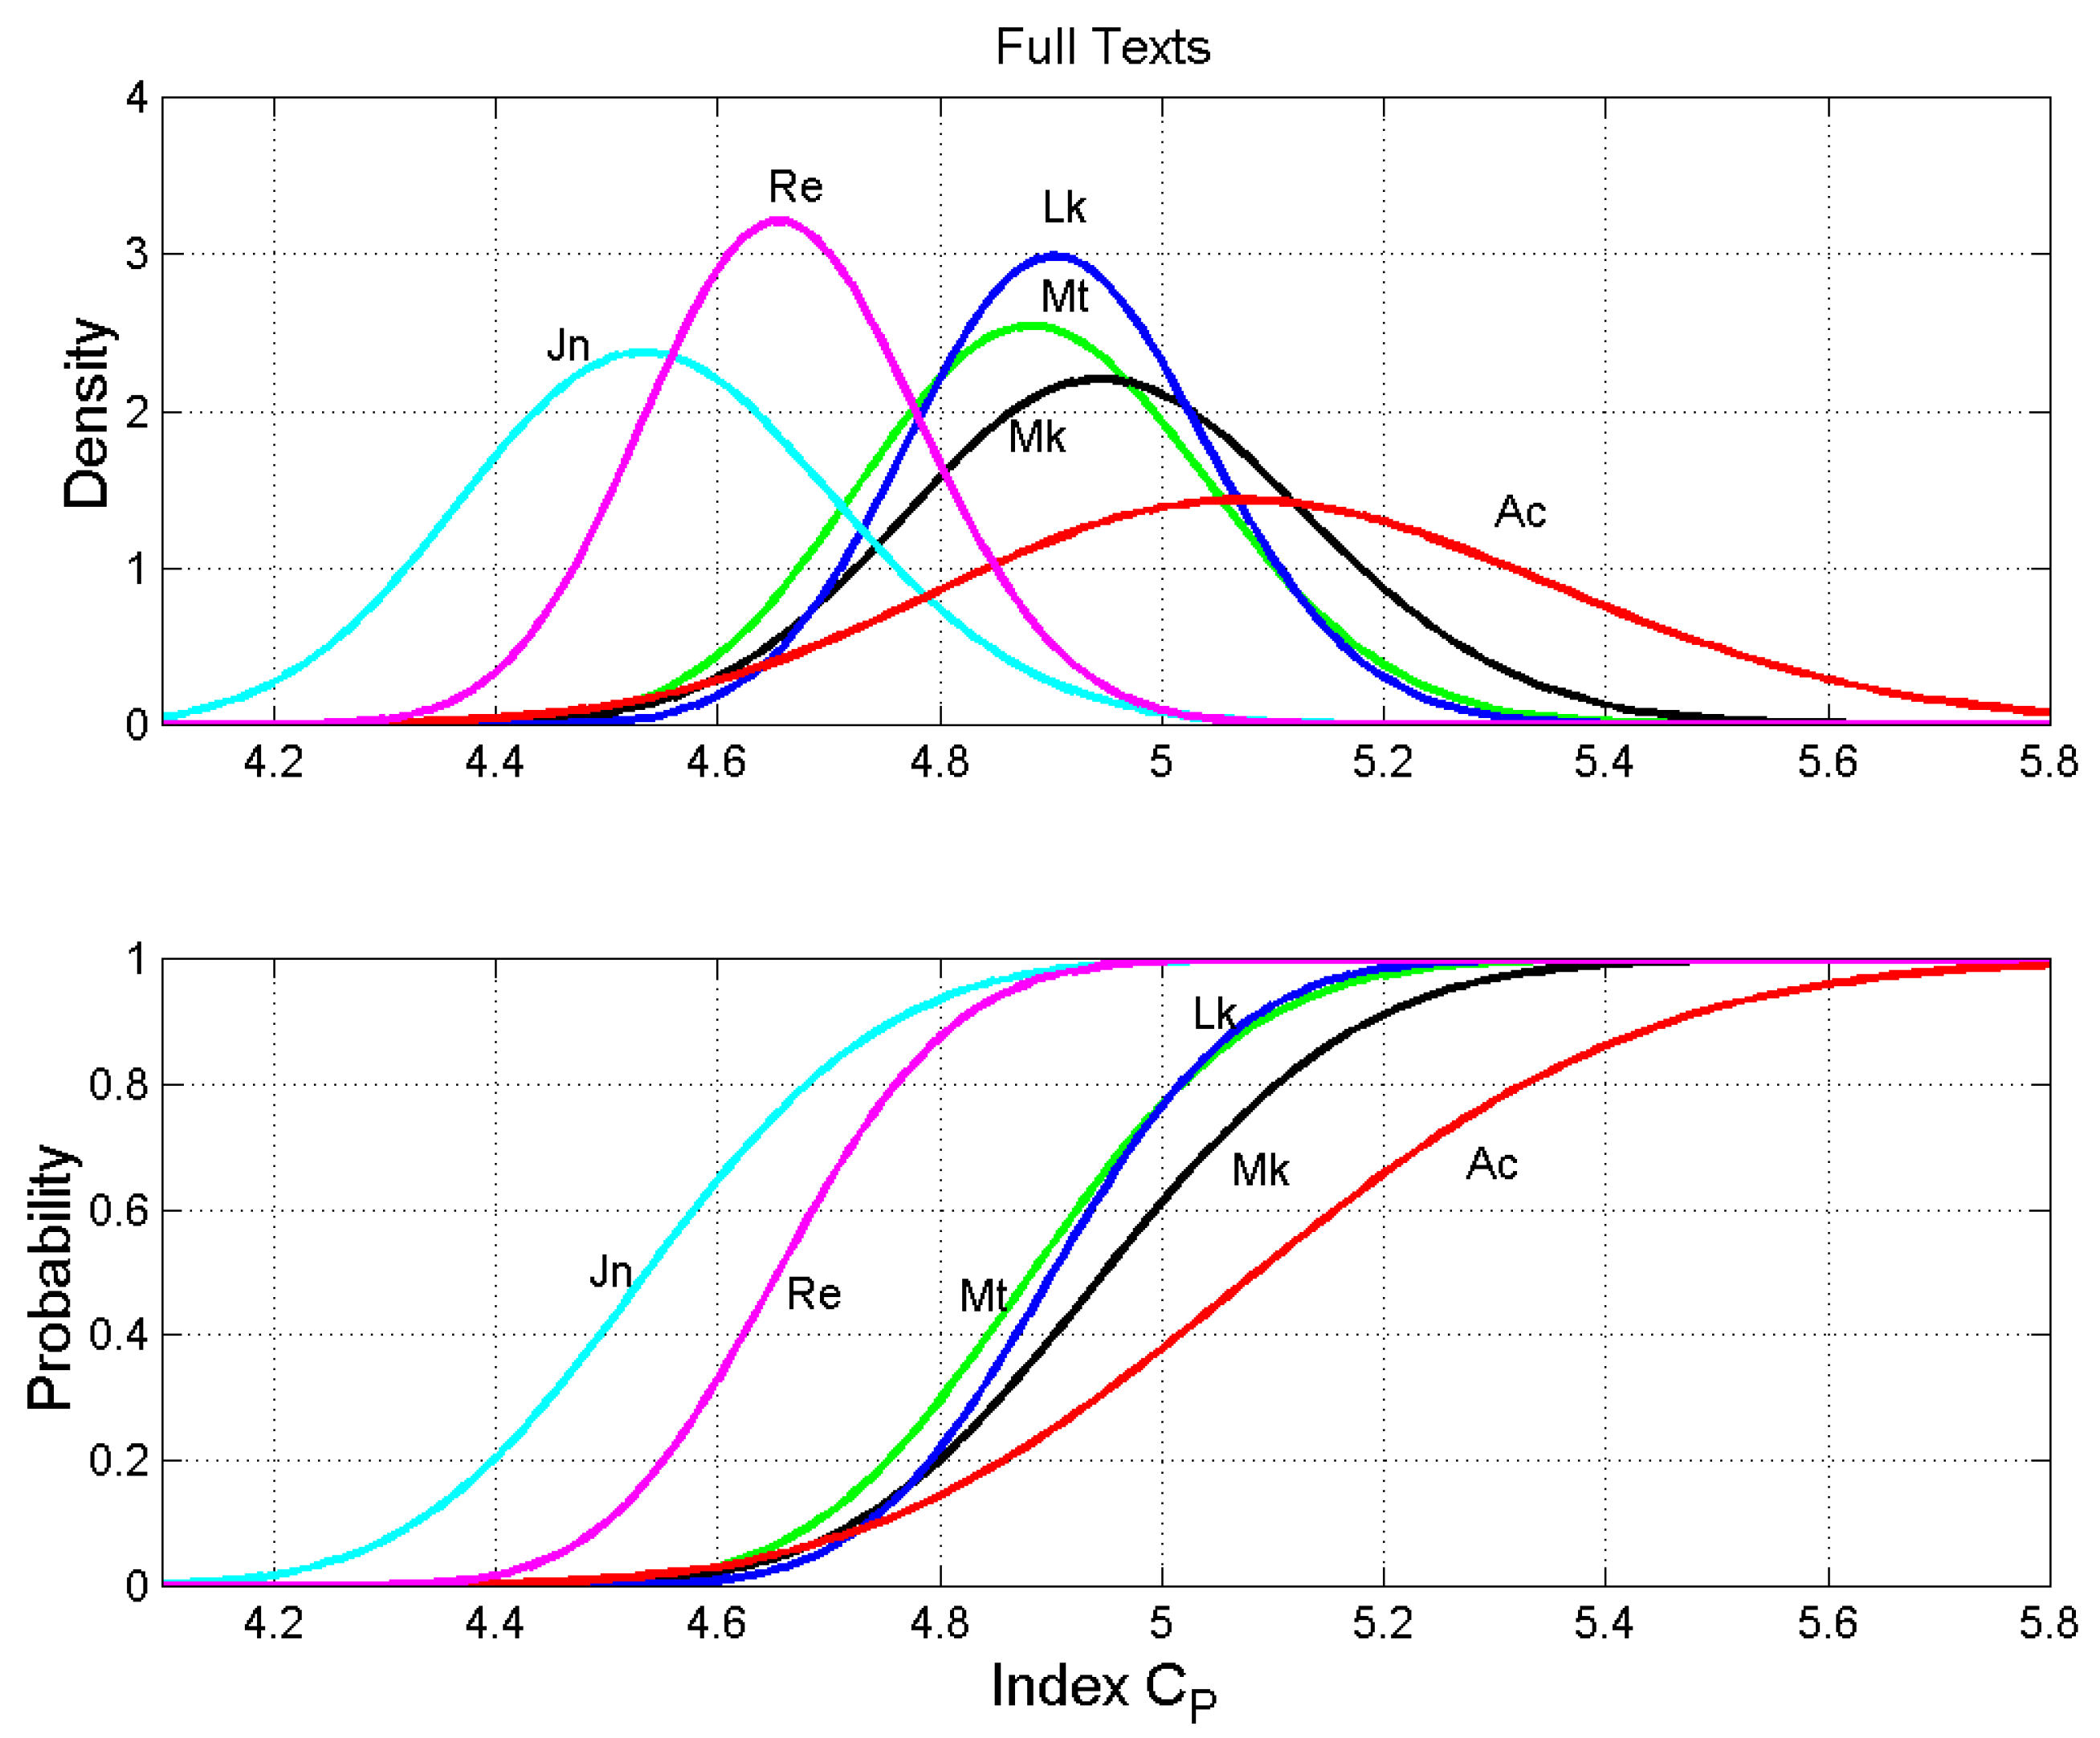
Figure 1 shows the density and probability distribution functions of the number of words per sentence, , for each text. We can notice almost a total coincidence of the functions for Matthew and Luke (the two curves overlap), a significant difference with John and very large differences of the four Gospels with Acts and Revelation (the corresponding curves are very different).
If Luke is the author both of the Gospel and Acts, then it seems that when he writes the Gospel he is likely forced to follow a common literary or oral source, as recalled in the Introduction, but when he writes the Acts he is free to follow his own literary style and, therefore, modulates the length of sentences accordingly, also because of the different narrative occasions of the Acts.
If John is the author both of the Gospel and the Revelation, in Revelation he modulates the length of sentences very differently from his Gospel. Other explanations, of course, could hold: (i) the author is not same person; (ii) the original texts have been successively rearranged by other authors before the final editing.
The results of the Kolmogorov–Smirnov test for are reported in Table 8 and confirm the conclusions drawn from a visual inspection of the functions shown in Figure 1. Each number in Table 8 gives the probability (or confidence level, %) that two texts are mathematically different. Therefore, 0% refers to identical texts, 100% to completely different texts. From these results, we can realize how different the texts examined are, by considering the confidence level we wish to adopt.
The test clearly shows that Matthew and Luke are indistinguishable (confidence level 1.25%, practically 0%); Mark is a little different from Matthew (45.49%) and Luke (52.70%), while John is different from Matthew (80.25%) and Luke (85.81%), but not so much from Mark (36.83%). Acts is very different from Luke (99.89%), and John is very different from Revelation (>99.99%, in practice 100%).
A synthetic index can be the root mean square (RMS) value for each text, also reported in Table 8. It can give some quick and general overview of the likely interdependence of the texts. We can see that the four Gospels have very similar RMS values (~75%); John 83.85%. Both Acts and Revelation (~99.5%) are different from all other texts.
Figure 2 shows the density and probability distribution functions of the number of characters per word, , for each text. Again, we can notice the almost total coincidence of the functions for Matthew, Luke and Mark, and a large difference with John, Acts and Revelation. If Luke is the author both of the Gospel and Acts, then, as for , it seems that when he writes the Gospel he is forced to follow a common dictionary (referring to the length of words), but when he writes the Acts he is free to use different word lengths, his own dictionary, also because he is narrating events quite different from those reported in the Gospel. If John is the author both of the Gospel and the Revelation, he seems to modulate the length of words very differently in the two texts.
The results of the Kolmogorov–Smirnov test for are reported in Table 8. The test clearly shows that Matthew and Luke are indistinguishable (confidence level 9.92%). John is very different from Matthew, Luke and Mark (confidence level >99.95%). Acts is very different from Luke (95.61%) and John is different from Revelation (74.21%).
Figure 3 shows the density and probability distribution functions of the number of interpunctions per sentence, , for each text and Table 9 reports the results of the Kolmogorov–Smirnov test. In addition, in this case, there is a total coincidence of the functions of Matthew and Luke, but now also John agrees with them. Mark and especially Revelation are at the extremes. Revelation does not agree with John, but now Acts does agree with Luke. It seems that Luke, both in the Gospel and in the Acts, “uses” the same style as far as interpunctions are concerned, even though the number of words per sentence, , does not follow this trend, as Figure 1 shows. Of course, interpunctions were inserted later, as discussed in Section 3, consequently, Acts and Luke must differ in the word interval statistics, as we show next.
The results of the Kolmogorov–Smirnov test for , reported in Table 9, confirm our visual observations and conclusions. Matthew, Luke and John are practically indistinguishable (9.63% and 24.32%), Mark is different from them (confidence level 82.94%). Acts and Luke are also indistinguishable (6.13%). John and Revelation are very different (>99.99%). Revelation is different from all other texts.
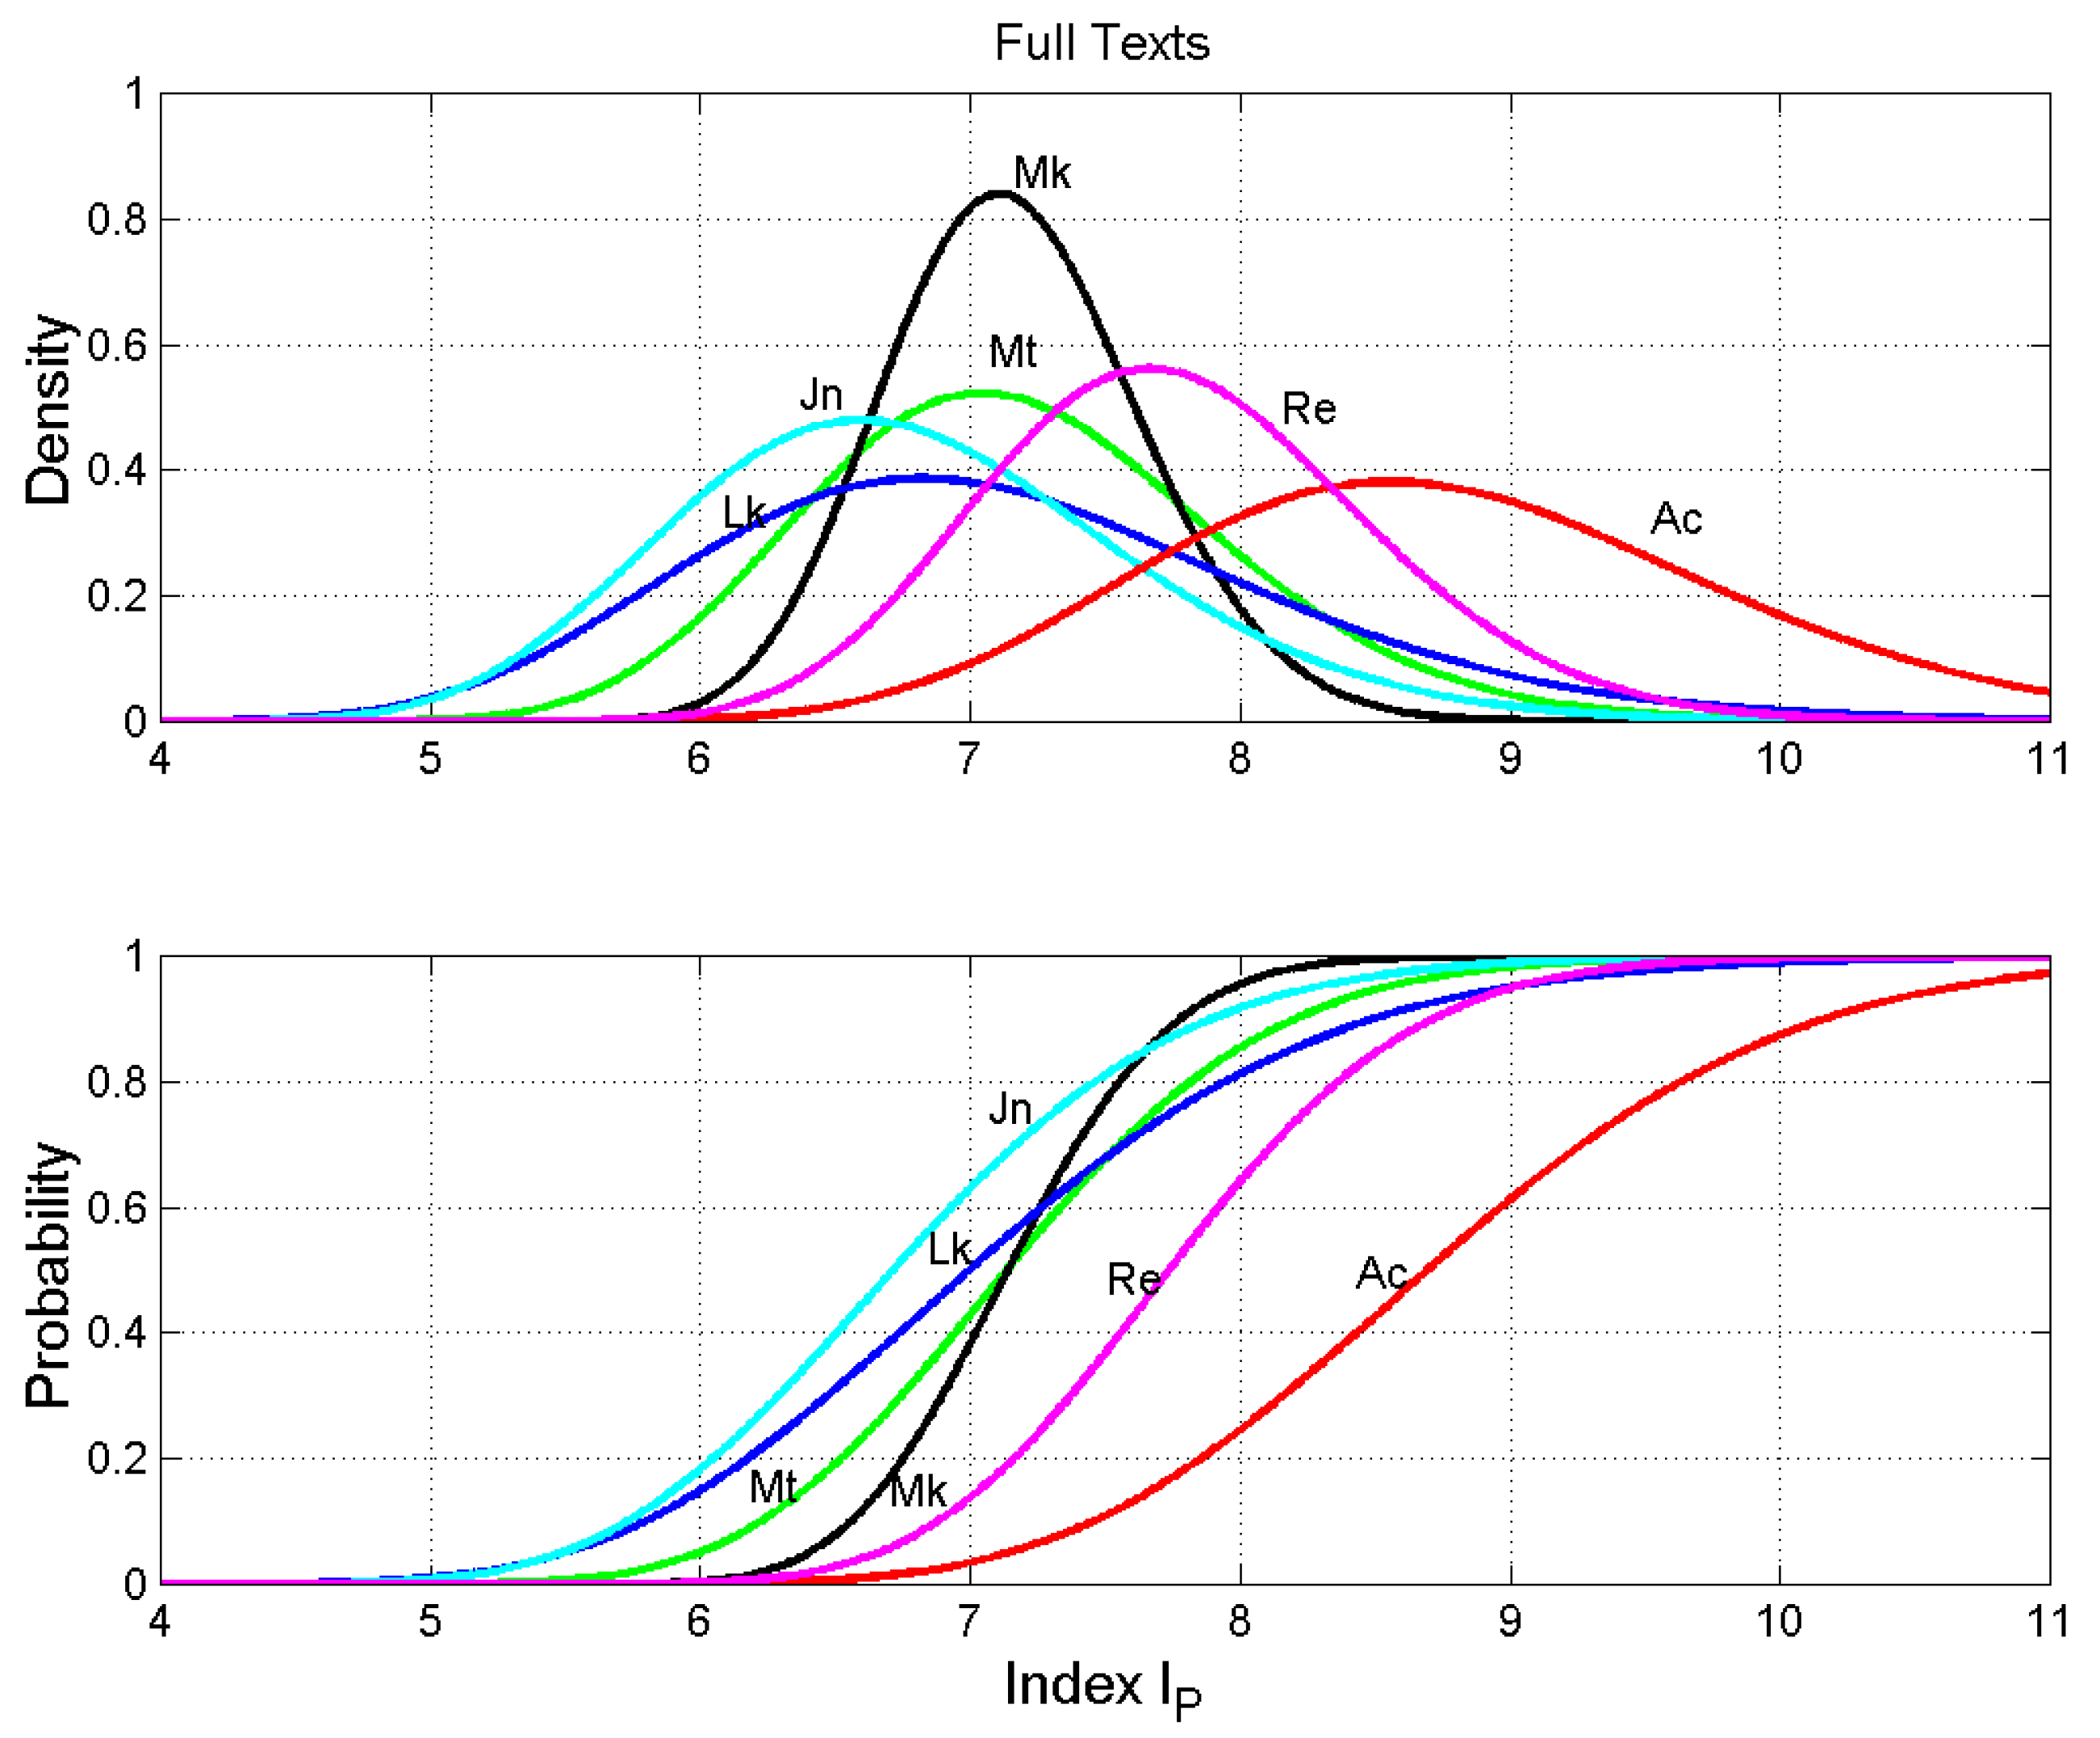
The number of words per interpunctions, referred to as the word interval , namely the number of words between two successive interpunctions, is an important parameter because it seems to be linked to the capacity of the short-term memory required of the readers to read the text more easily (Matricciani 2019; Matricciani and De Caro 2018).
Figure 4 shows the density and probability distribution functions of , for each text. We can notice that the probability distributions of Matthew and Luke are quite similar, with Mark and John significantly different, as the Kolmogorov–Smirnov test results, reported in Table 9, show. As we have anticipated, Acts and Luke differ very much in the word interval statistics (confidence level >99.99%). In addition, John and Revelation are very different (99.74%). In conclusion, Acts and Revelation are different from all other texts, as shown by the RMS values (99.81% and 96.01%).
Notice that the RMS values of are lower than those of (except for Revelation) therefore indicating some more homogeneity in the probability distribution of interpunctions.
5. Triple Tradition
In this section, we analyze the statistics of the four parameters in the texts of Matthew, Mark and Luke referred to as the Triple Tradition (Table 1, Table 2 and Table 3), and compared them to the Q source (Table 1).
Figure 5 shows the density and probability distribution functions of , for each text, and Table 10 reports the results of the Kolmogorov–Smirnov test. We can notice that the functions of Matthew and Luke are practically identical (confidence level 3.03%) and slightly closer to Q (Matthew–Q 34.83%; Luke–Q 26.27%) than to Mark (Matthew–Mark 46.21%; Luke–Mark 50.66%). Mark and Q are significantly different (78.80%). The RMS values are similar for Matthew and Luke and larger for both Mark (60.31%) and Q (52.00%).
In conclusion, these results indicate that Matthew, Luke and Q are very likely interdependent. Mark is likely linked to Matthew and Luke, or vice versa (confidence level about 50%), and less to Q. These findings substantially agree with the results found in the Full Texts analysis of Section 4.
Figure 6 shows the density and probability distribution functions of , for each text and Table 10 reports the results of the Kolmogorov–Smirnov test. We can notice that the functions of Matthew, Luke and Mark are practically identical and loosely linked to Q. The RMS values indicate that all texts share the same set of word lengths, with Q the most different. These results indicate that Matthew, Mark and Luke are using words of very similar length, a common dictionary as far as the number of characters per word is concerned, and agree with the results of the Full Texts analysis of Section 4.
6. Double Tradition
In this section, we analyze the statistics of the four parameters in the texts of Matthew and Luke, referred to as the Double Tradition (Table 1, Table 2 and Table 3), compared to the Q source.
Figure 9 shows the density and probability distribution functions of , for each text. We can notice that Matthew, Luke and Q are practically identical. They have about the same RMS values (Table 12).
Figure 10 shows the density and probability distribution functions of , for each text. As for , Matthew and Luke are very similar (27.74%), but now Q is enough different from Matthew (60.03%).
Figure 11 shows the density and probability distribution functions of , for each text and Table 13 reports the Kolmogorov–Smirnov test results. Matthew and Luke are practically identical, Q is very close to them. In other words, the scribes/readers who inserted the interpunctions treated these verses in the same way.
7. Own Tradition
In this section, we analyze the statistics of the four parameters derived in the texts of Matthew and Luke referred to as the Own Tradition (Table 1, Table 2 and Table 3), compared to the Q source (Table 1).
Figure 13 shows the density and probability distribution functions of , for each text and Table 14 reports the Kolmogorov–Smirnov test results. It is clear that, surprisingly, Matthew and Luke are identical. In other words, the unique (“Own”) verses of Matthew and Luke are statistically identical to those of the Double Tradition.
Figure 14 shows the density and probability distribution functions of , for each text and Table 14 reports the Kolmogorov–Smirnov test results. Again, as for , Matthew, Luke and Q are identical.
Figure 15 shows the density and probability distribution functions of , for each text and Table 15 reports the Kolmogorov–Smirnov test results. It is clear that all curves are practically identical, and in more agreement with the Double Tradition (Figure 11) than with the Full Texts (Figure 3) or Triple Tradition (Figure 7). In other words, the Own Tradition is very similar to the Double Tradition.
Figure 16 shows the density and probability distribution functions of , for each text. Here differences are very marked. Matthew and Luke are practically coincident (14.73%), while Q is clearly different (83.91%). This is mainly due to the differences in the number of words per sentence, . These findings seem to indicate that the capacity of the short-term memory required of the reader is significantly different for each text in the Double and Own Traditions, except for Q.
Finally, Table 16 reports, for an overview, the global RMS values of the confidence levels (from the previous tables), for the couple Matthew and Luke, in the Triple, Double and Own Traditions. We can notice that in any case the two texts are practically indistinguishable, with the Own Tradition giving values lower than those of the Double Tradition. From Table 10, Table 11, Table 12 and Table 13 and 16 we can calculate the overall RMS values: 13.89% for the Triple Tradition, 20.86% for the Double and 15.23% for the Own Tradition, therefore confirming the unexpected result that the Own Tradition is made of texts which are not really different from those of the Double Tradition or Triple Tradition.
8. Relationship between and , Readability and Geometrical Representation of Literary Texts
The number of words per interpunctions, , and the number of words per sentence, , are linked by a direct proportionality (Matricciani 2019; Matricciani and De Caro 2018). Moreover, the readability of a text depends mostly on , as shown for Italian (Matricciani 2019; Matricciani and De Caro 2018), with a readability index that decreases (the text is less readable) as and increase. Therefore, we can estimate, to a first approximation, the relationship between and the readability of the texts here considered, by using the averages values of and reported in Table 4, Table 5, Table 6 and Table 7. Figure 17 shows the average value of versus the average value of .
In Figure 17, we have also inserted some important literary works of the Greek literature to assess where the New Testament writings are placed in this broader scenario. The comparison of the New Testament writings with these literary works will be discussed in the next section. Now, we examine only the New Testament writings.
From Figure 17 several interesting observations emerge. The most readable text is John, as it has the smallest value of . The less readable is Revelation. Matthew and Luke are practically superposed, they have the same readability. Q is distinct from the synoptic Gospels. Mark is clearly distinct from Matthew and Luke, and even more from John.
The Triple Tradition gives results very close to the Full Texts results. Therefore, they have similar values of readability. On the contrary, the Double Tradition and the Own Tradition are far from each other and from the Full Texts. It is evident that the Own Tradition gives results very different from the other texts, and its texts are the less readable of the Gospels. Acts is very different from Luke and Revelation is very different from John.
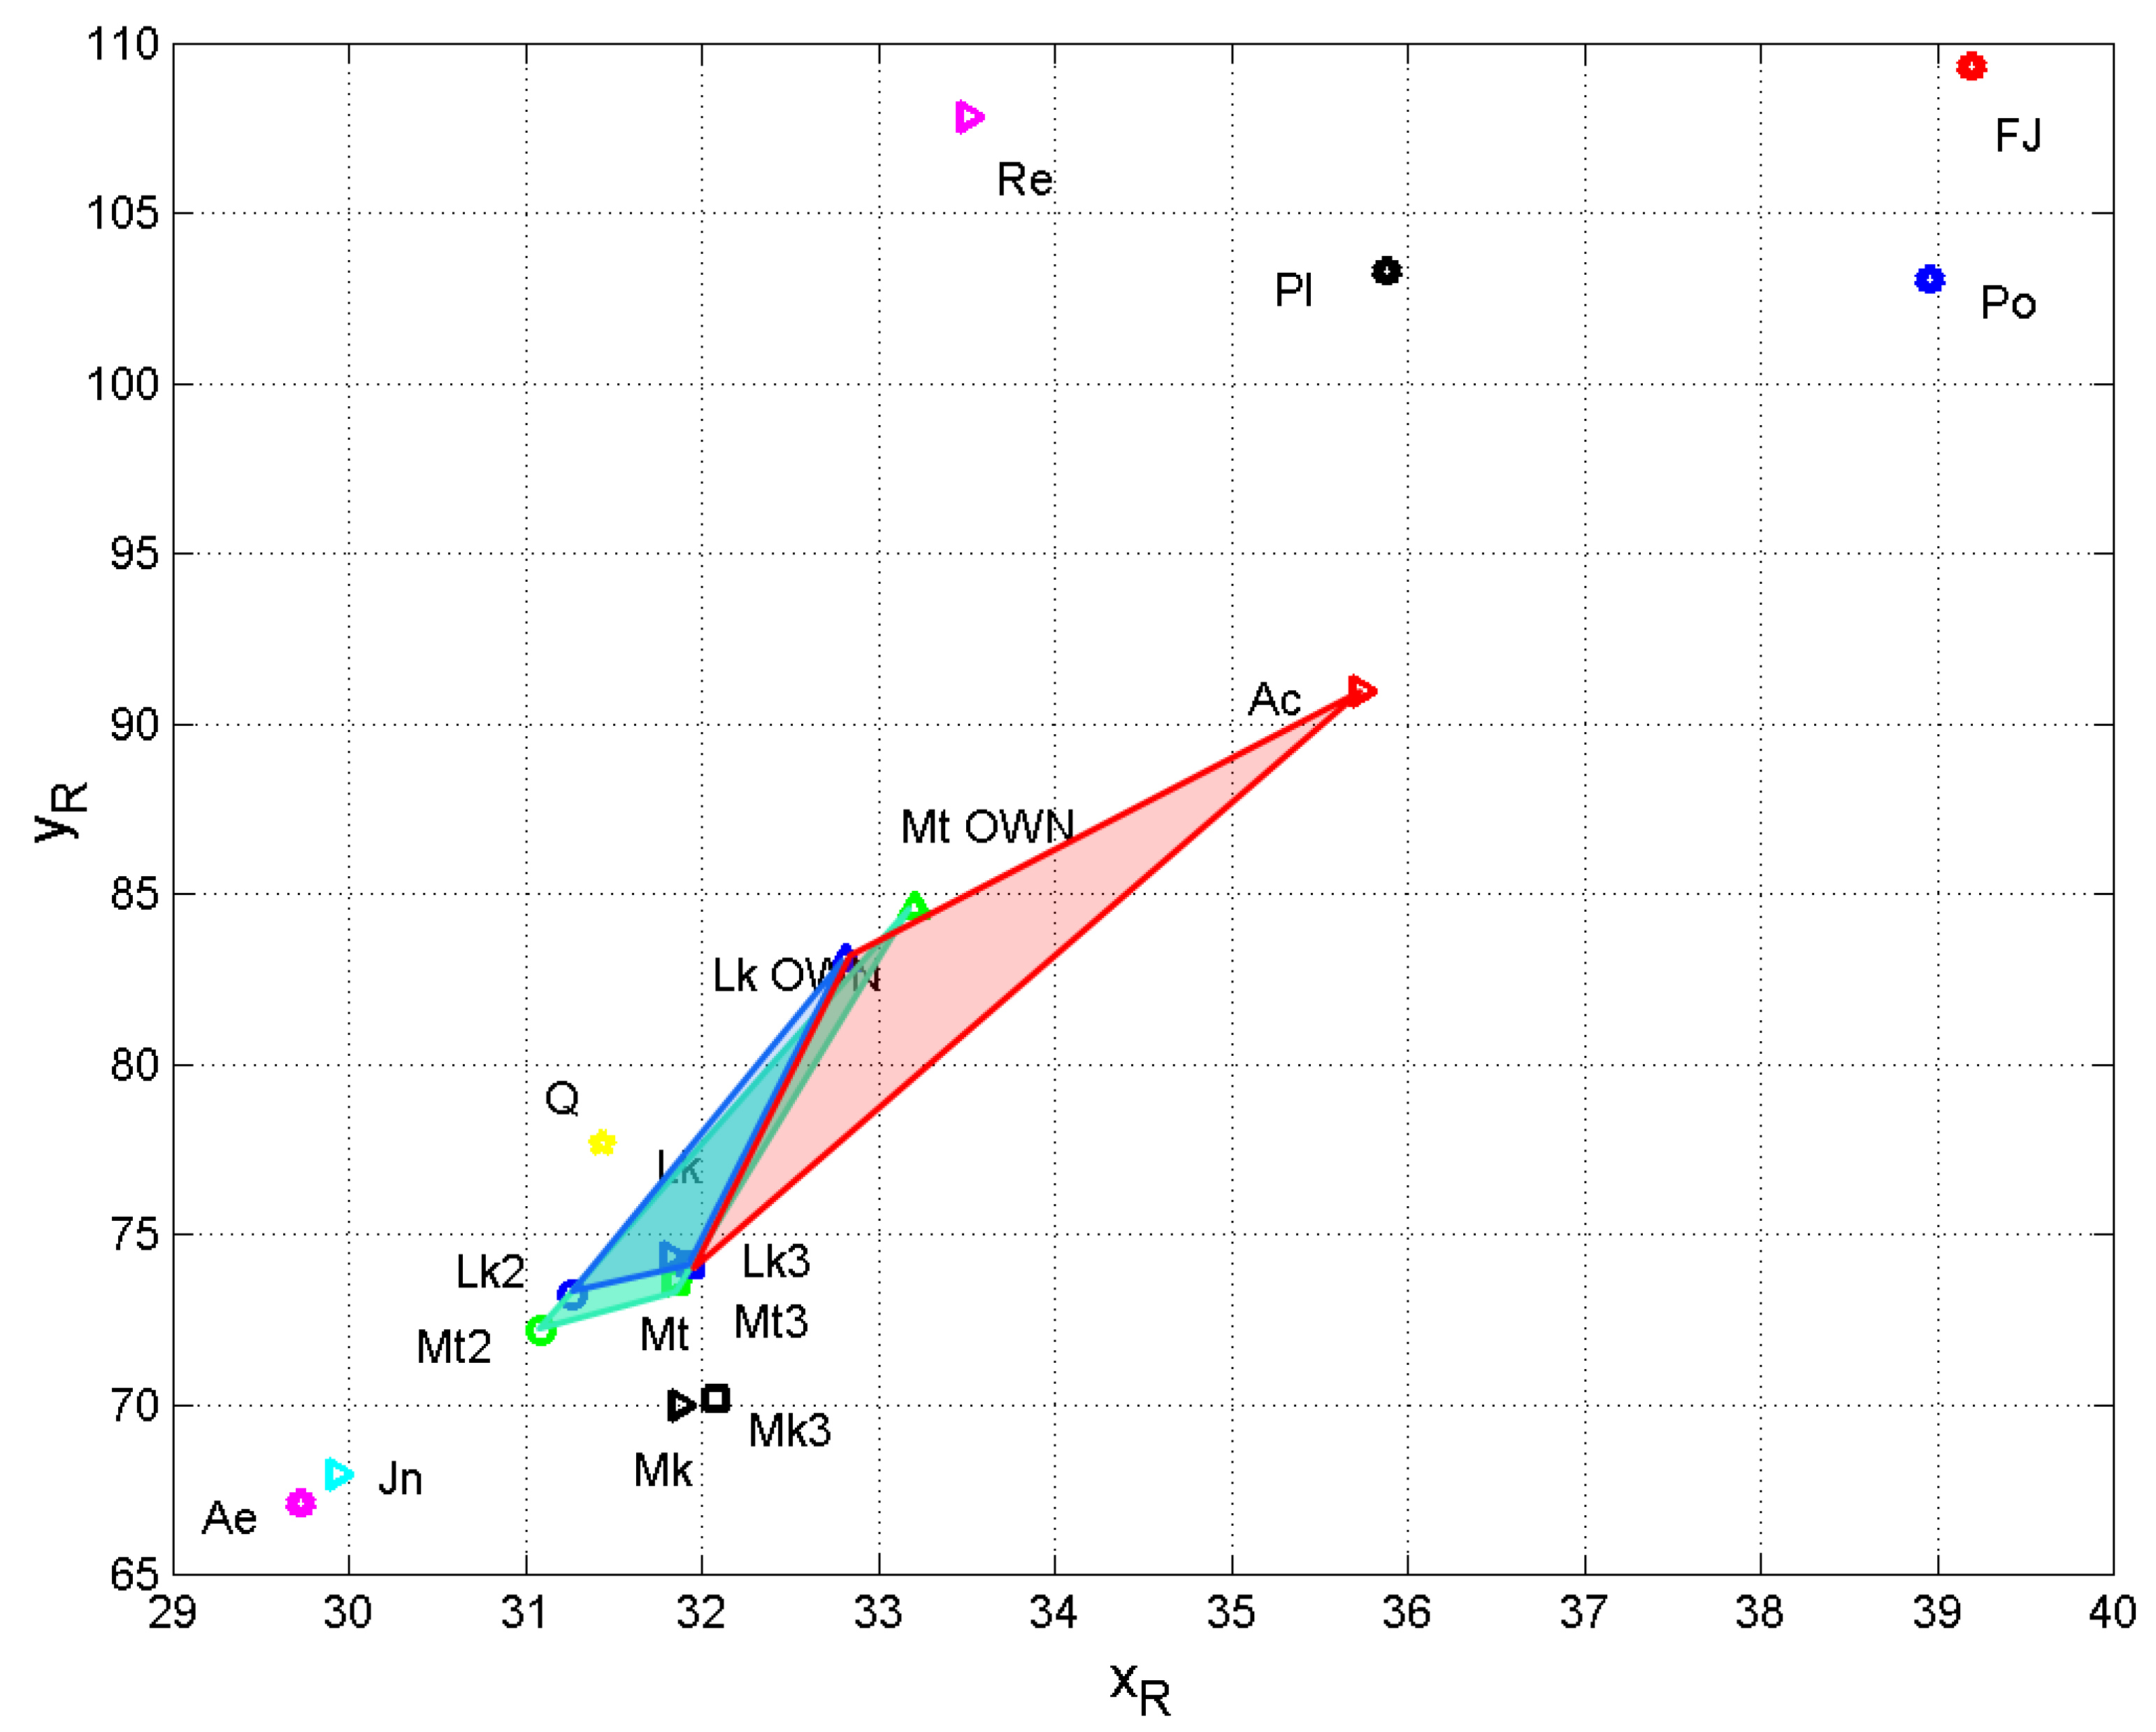
A useful graphical and mathematical tool for comparing different literary texts is the vector representation, discussed by Matricciani (2019), obtained by considering the following six vectors of components3 and ), ), ), ), ), ) and their resulting vector of coordinates, and given by:
Using the average values of Table 4, Table 5, Table 6 and Table 7, with the vector representation (1) a literary text ends up at a point of coordinates and in the first Cartesian quadrant, as shown in Figure 18. The closer the mark is to the origin of the Cartesian axes (0,0), not shown, the more readable the text. In Figure 18, differences and similarities already observed in Figure 17 are again clearly evidenced, therefore confirming the general picture that emerges from our results.
9. Comparison with the Classical Greek Literature
The New Testament writings were written in Greek by authors who were very likely conscious of the classical Greek literary works. This is more than a guess for Luke, who was of Greek origin and very literate, e.g., see Ehrman (2000). These classical literary works can guide us to place the New Testament writings, here studied, in a more general context. To this purpose we have done the same mathematical/statistical analysis on three historical works that can be considered quasi contemporaneous of the New Testament writings, or were largely known, namely4 the Histories by Polybius (II century B.C.), the Parallel Lives by Plutarch (I century A.C.), the Jewish War by Flavius Josephus (I century A.C), and the classical Fables by Aesop (V century B.C.). Table 17 lists the main statistics of these literary works.
Figure 17 and Figure 18 show where these works are located. From Table 17 and Figure 17 and Figure 18, we can notice some interesting facts:
(i) The Gospels are very close to Aesop’s Fables, as we should expect because in both cases the audience addressed is a popular one. Compared to Polybius, Plutarch and Flavius Josephus, the words used in the Gospels are in fact shorter, below about 5 characters per word against 5.2 to 6; the number of words per sentence is smaller, about 20 words per sentence against about 30 (recall that this number should determine the readability); the word interval is smaller (a parameter very likely linked to the short-term memory capacity), 7 against 8~9.
(ii) Revelation and Acts are closer to the historical works of Polybius, Plutarch and Flavius Josephus. On the models that might have inspired the author of Acts, see (Ehrman 2000). The four parameters of Acts and Revelation are closer to those of these historical works than to those of the Gospels.
10. A Synthetic Overview of the Statistical Results
In Figure 19, we have connected the three marks reported in Figure 18 for the Double, Triple and Own Traditions, for Matthew and Luke. The resulting triangles give, for each author, a pictorial estimate of the area involved in their literary statistics. The green triangle refers to Matthew, the blue triangle, smaller and practically overlapped to the green triangle, refers to Luke. The red triangle extends Luke’s literary area (blue + red) to the Acts.
From this synthetic overview, we can notice that Luke spans a total area given by the sum of the blue and red triangles. Conversely, Matthew is much more limited and contains the blue triangle, which is the expression of the literary style of Luke when he wrote his Gospel. In other words, these results say that Luke had the ability to use different styles, one for the Gospel, another one for the Acts. However, when he writes the Gospel the blue triangle spans an area smaller that Matthew’s area. Therefore, under the hypothesis of the existence of a proto gospel, these findings may suggest that when Luke wrote his Gospel he was practically compelled to rely on material from a previous written tradition (from which also Matthew drew his material), as he explicitly states in the prologue, a material characterized, however, by statistics quite different of those of the Acts, a book he apparently wrote without turning to an earlier tradition. In other words, all these data seem to support the hypothesis of a proto Gospel, maybe due to Matthew, an interesting conjecture that could bring future mathematical/statistical work to be done on proto Gospels.
11. Discussion and Conclusions
From the statistical results reported and discussed in the previous sections we can conclude that, for any of the four parameters considered, Revelation is significantly different from any other text.
Let us now examine the other texts, by considering first the number of interpunctions per sentence . From the functions shown in Figure 3, Figure 7, Figure 11 and Figure 15 we can notice that, for any text considered, the probability density and the probability distribution functions of can be considered practically identical. In other words, the punctuation of Acts, of the Full Texts, of the Triple Tradition, Double Tradition and Own Tradition texts, is very similar. Moreover, Q is very similar to these texts. This result strengthens the historical reconstruction done by Parkes (Parkes 1992), and summarized in Section 3, on how the interpunctions were inserted in the New Testament. The statistical homogeneity of seems to confirm that interpunctions were not inserted by the original authors, but by well-educated scribes and readers, as outlined in Section 3. However, the doubt remains whether the scribes and readers interpreted correctly the original intent of the authors.
Let us consider the number of characters per word, . Its average value is typical of a particular language but authors are a little free to select words with number of characters statistically different, as it is shown, for example, in the Italian literature (Matricciani 2019). Our analysis has shown that only Matthew’s, Mark’s and Luke’s Gospels share the same probability distributions (see Figure 2, Figure 6, Figure 10 and Figure 14). This finding reinforces the hypothesis that very likely a common written/oral tradition on Jesus’s sayings and events was available to these authors. On the contrary, John’s Gospel and Revelation draw words from a different set, and different form that of Matthew and Luke. Acts shows a very different selection of word length compared to Luke, allegedly written by the same author. As also underlined by the analysis of the other parameters, the alleged Luke when he writes the Acts is largely free from the common tradition from which he extracted the sayings and events narrated in Gospel. Q is quite similar to Luke and Matthew.
Let us now discuss the results concerning the two parameters most linked to author’s style (see Matricciani 2019), namely the number of words per sentence, , and the number of words per interpunctions, . Before doing so, let us state that, although the interpunctions inserted do determine these parameters, it must be said that the scribes, who inserted them, did it for rendering a correct understanding of the text. In other words, they should have not changed in any significant way the length of a sentence (hence, ), or the length of clauses and its natural pauses within a sentence (hence, ), although there is always the doubt about the correct interpretation of the original intent of the authors.
As for , Acts and Revelation are definitely different from the Gospels. Because the readability of a text mostly depends on this parameter (Matricciani 2019; Matricciani and De Caro 2018), we can say that Acts and Revelation are more difficult to read, as evidenced in Figure 17 and Figure 18. On the contrary, the Gospels appear very similar if we consider the Full Texts, the Triple Tradition and the Double Tradition (Figure 1, Figure 5 and Figure 9). Very surprisingly, the unique texts of Matthew and Luke (the Own Tradition, Figure 13) are very alike and similar to the texts of Matthew and Luke in the Double or Triple Traditions, as if they were describing facts and events with a style taken from a common literary source or present in the same oral tradition. Q is very similar to Matthew and Luke. Therefore, the results obtained seem to support particularly the proto-Gospel hypothesis, among all the different conjectures on Gospels genesis, summarized in the Introduction. From this common tradition, it seems that each author extracted facts and sayings, and chose a particular order presentation of them, according to the audience they were writing for, besides the theological aspects. This finding could be further studied by analyzing, with the same mathematical/statistical approach, the texts proposed by scholars as proto-Luke, proto-Matthew, and so on, to assess which hypothesis is more reliable.
As for , Acts and Revelation are definitely different from the Gospels, and confirm what has already been observed for on their readability. The Full Texts and the Triple Tradition are very similar, as if the authors had drawn their texts from a common literary or oral tradition, in which texts were addressed to people with alleged similar capacity of short-term memory. On the contrary, the subsets of Double and Own Traditions are at the extremes of the general picture depicted in the Full Texts: the Double Tradition considers shorter values of , and identically for both Matthew and Luke, while the Own Tradition shows longer values of , again identically for both Matthew and Luke. The relationship between and (Figure 17) and the geometrical representation of the texts (Figure 18) confirm the above observations.
All these New Testament writings fit very well in the larger Greek literature of the time. As shown in Figure 17 and Figure 18, the Gospels are much closer to Aesop’s Fables, while Acts and Revelation are closer to the historical works of Polybius, Plutarch and Flavius Josephus.
In conclusion, the mathematical/statistical tool used in this paper confirms and reinforces some general results found in the vast literature on the New Testament concerning the Gospels, Acts, Revelation and Q source, but also evidences some interesting differences concerning especially the number of words per sentence and words per interpunctions, maybe casting some light on the capacity of the short-term memory of the readers/listeners of these texts. Moreover, the findings concerning the surprising coincidence of the Own Tradition in Matthew and Luke may reinforce the hypothesis of the existence of a proto Gospel, maybe due to Matthew.
Author Contributions
E.M. conceived, designed and performed the calculations; both authors discussed and wrote the paper.
Funding
This research received no funding.
Conflicts of Interest
The authors declare no conflict of interest.
References
- Abakuks, Andris. 2015. The Synoptic Problem and Statistics. Boca Raton: CRC Press. [Google Scholar]
- Boismard, Marie-Émile. 1979. The Two–Source Theory at an Impasse. New Testament Studies 26: 1–17. [Google Scholar] [CrossRef]
- Boring, M. Eugene. 1998. The History and Theology of the New Testament Writings. Minneapolis: Fortress. [Google Scholar]
- Brodie, Thomas L. 2004. The Birthing of the New Testament. The Intertextual Development of the New Testament Writings. Sheffield: Sheffiled Phoenix Press. [Google Scholar]
- Burkett, Delbert. 2004. Rethinking the Gospel Sources: From Proto–Mark to Mark. London: A&C Black. [Google Scholar]
- Butler, Basil Christopher. 1951. The Originality of St. Matthew. Cambridge: Cambridge University Press. [Google Scholar]
- Ehrman, Bart D. 2000. The New Testament. A Historical Introduction to the Early Christian Writings. Oxford: Oxford University Press. [Google Scholar]
- Farmer, William R. 1983. New Synoptic Studies. The Cambridge Gospel Conference and Beyond. Macon: Mercer University Press. [Google Scholar]
- Farrer, Austin M. 1955. Studies in the Gospels. Essays in Memory of R. H. Lightfoot. Edited by D. E. Nineham. Oxford: Basil Blackwell, pp. 55–88. [Google Scholar]
- Foster, Paul, ed. 2011. New Studies in the Synoptic Problem: Oxford Conference, April 2008. Essays in Honor of Christopher M. Tuckett. Leuven: Peeters, April 20. [Google Scholar]
- Gareiou, Zoe, and Efthimios Zervas. 2018. Analysis of Environmental References in the Texts of the Four Gospels Using Descriptive Statistics. Religions 9: 266. [Google Scholar] [CrossRef]
- Goodacre, Mark. 2001. The Case against Q: Studies in Markan Priority and Synoptic Problem. Norcross: Trinity Press. [Google Scholar]
- Griesbach, Johann Jakob. 1790. Commentatio qua Marci evangelium totum e Matthaei et Lucae commentariis decerptum esse monstratur. Jena: Officina Stranckmannio-Fickelscherria, vols. I–II. [Google Scholar]
- Mack, Burton L. 1993. The Lost Gospel. The Book of Q & Christian Origins. San Francisco: Harper One. [Google Scholar]
- Matricciani, Emilio. 2019. Leggibilità della lingua italiana: rivisitazione della formula GULPEASE e legami con la “legge del 7 ∓ 2”. Nuova Secondaria, Ed. La Scuola, Part 1: February 2019, 6, 79–87; Part 2: March 2019, 7, 80–86. [Google Scholar]
- Matricciani, Emilio, and Liberato De Caro. 2018. A Mathematical Analysis of Maria Valtorta’s Mystical Writings. Religions 9: 373. [Google Scholar] [CrossRef]
- Mealand, David L. 2016. The Seams and Summaries of Luke and of Acts. Journal for the Study of the New Testament 38: 482–502. [Google Scholar] [CrossRef]
- Miller, George A. 1955. The Magical Number Seven, Plus or Minus Two. Some Limits on Our Capacity for Processing Information. Psychological Review 63: 343–52. [Google Scholar]
- Neirynck, Frans, Theo Hansen, and Frans van Segbroeck. 1974. The Minor Agreements of Matthew and Luke against Mark with a Cumulative List. Bibliotheca Ephemeridum Theologicarum Lovaniensium. Leuven: Peeters Publishers, vol. 37. [Google Scholar]
- Parkes, Malcolm B. 1992. Pause and Effect. An Introduction to the History of Punctuation in the West. Abingdon: Routledge. [Google Scholar]
- Poirier, John C. 2008. Statistical Studies of the Verbal Agreements and their Impact on the Synoptic Problem. Currents in Biblical Research 7: 83–123. [Google Scholar] [CrossRef]
- Reicke, Bo Ivar. 1986. The Roots of the Synoptic Gospels. Minneapolis: Fortress Press. [Google Scholar]
- Rolland, Philippe. 1984. Les premiers Evangiles. Un noveau regard sur le probléme synoptique. Les Paris: Editions du Cerf. [Google Scholar]
- Smith, Dwight Moody. 1984. Johannine Christianity. Columbia: University of South Carolina Press. [Google Scholar]
- Stein, Robert H. 1994. The Synoptic Problem: An Introduction. Grand Rapids: Baker Book House. [Google Scholar]
- Streeter, Burnett Hillman. 1924. The Four Gospels. London: Macmillan. [Google Scholar]
- Tuckett, Christopher M. 1983. The revival of the Griesbach Hypothesis. Cambridge: Cambridge University Press. [Google Scholar]
- Vaganay, Leon. 1954. Le problem synoptique. Paris: Descleé & Co. [Google Scholar]
- Van Voorst, Robert E. 2001. Building Your New Testament Greek Vocabulary, 3rd ed. Atlanta: Society of Biblical Literature. [Google Scholar]
- Weisse, H. 1838. Die evangelische Geschichte kritisch und philosopisch bearbeitet. Leipzig: Breitkopf und Hartel. Leipzig: Breitkopf und Hartel. [Google Scholar]
| 1 | The Confessions of Saint Augustine, Book VI, chapter 3: “But when he was reading, his eye glided over the pages, and his heart searched out the sense, but his voice and tongue were at rest.” English translation by Edward B. Pusey, Grand Rapids, MI: Christian Classics Ethereal Library. |
| 2 | The Greek texts have been downloaded from the web site http://www.bibbiaedu.it of the Catholic Institution of the Conferenza Episcopale Italiana (CEI) Fondazione di Religione Santi Francesco d’Assisi e Caterina da Siena. Last access, 31 March 2019. |
| 3 | The choice of which parameter represents the component x or y is not important. Once the choice is made, the numerical results will depend on it, but not the relative comparisons and general conclusions |
| 4 | These Greek literary works have been downloaded from the web site http://www.perseus.tufts.edu. Last access: 31 March 2019. |
Figure 1.
Probability density functions (upper panel) and probability distribution functions (lower panel) of the number of words per sentence. Matthew: green line; Mark: black line; Luke: blue line; John: cyan line; Acts: red line; Revelation: magenta line.
Figure 1.
Probability density functions (upper panel) and probability distribution functions (lower panel) of the number of words per sentence. Matthew: green line; Mark: black line; Luke: blue line; John: cyan line; Acts: red line; Revelation: magenta line.

Figure 2.
Probability density functions (upper panel) and probability distribution functions (lower panel) of the number of words per sentence. Matthew: green line; Mark: black line; Luke: blue line; John: cyan line; Acts: red line; Revelation: magenta line.
Figure 2.
Probability density functions (upper panel) and probability distribution functions (lower panel) of the number of words per sentence. Matthew: green line; Mark: black line; Luke: blue line; John: cyan line; Acts: red line; Revelation: magenta line.

Figure 3.
Probability density functions (upper panel) and probability distribution functions (lower panel) of the number of interpunctions per sentence . Matthew: green line; Mark: black line; Luke: blue line; John: cyan line; Acts: red line; Revelation: magenta line.
Figure 3.
Probability density functions (upper panel) and probability distribution functions (lower panel) of the number of interpunctions per sentence . Matthew: green line; Mark: black line; Luke: blue line; John: cyan line; Acts: red line; Revelation: magenta line.

Figure 4.
Probability density functions (upper panel) and probability distribution functions (lower panel) of the number of words per sentence. Matthew: green line; Mark: black line; Luke: blue line; John: cyan line; Acts: red line; Revelation: magenta line.
Figure 4.
Probability density functions (upper panel) and probability distribution functions (lower panel) of the number of words per sentence. Matthew: green line; Mark: black line; Luke: blue line; John: cyan line; Acts: red line; Revelation: magenta line.

Figure 5.
Triple Tradition. Probability density functions (upper panel) and probability distribution functions (lower panel) of the number of words per sentence. Matthew: green line; Mark: black line; Luke: blue line; Q: cyan line.
Figure 5.
Triple Tradition. Probability density functions (upper panel) and probability distribution functions (lower panel) of the number of words per sentence. Matthew: green line; Mark: black line; Luke: blue line; Q: cyan line.

Figure 6.
Triple Tradition and Q. Probability density functions (upper panel) and probability distribution functions (lower panel) of the number of words per sentence. Matthew: green line; Mark: black line; Luke: blue line; Q: cyan line.
Figure 6.
Triple Tradition and Q. Probability density functions (upper panel) and probability distribution functions (lower panel) of the number of words per sentence. Matthew: green line; Mark: black line; Luke: blue line; Q: cyan line.

Figure 7.
Triple Tradition. Probability density functions (upper panel) and probability distribution functions (lower panel) of the number of words per sentence . Matthew: green line; Mark: black line; Luke: blue line; Q: cyan line.
Figure 7.
Triple Tradition. Probability density functions (upper panel) and probability distribution functions (lower panel) of the number of words per sentence . Matthew: green line; Mark: black line; Luke: blue line; Q: cyan line.

Figure 8.
Triple Tradition and Q. Probability density functions (upper panel) and probability distribution functions (lower panel) of the number of words per interpunctions (word interval) . Matthew: green line; Mark: black line; Luke: blue line; Q: cyan line.
Figure 8.
Triple Tradition and Q. Probability density functions (upper panel) and probability distribution functions (lower panel) of the number of words per interpunctions (word interval) . Matthew: green line; Mark: black line; Luke: blue line; Q: cyan line.

Figure 9.
Double Tradition and Q. Probability density functions (upper panel) and probability distribution functions (lower panel) of the number of words per sentence. Matthew: green line; Luke: blue line; Q: cyan line.
Figure 9.
Double Tradition and Q. Probability density functions (upper panel) and probability distribution functions (lower panel) of the number of words per sentence. Matthew: green line; Luke: blue line; Q: cyan line.

Figure 10.
Double Tradition. Probability density functions (upper panel) and probability distribution functions (lower panel) of the number of characters per word. Matthew: green line; Luke: blue line; Q: cyan line.
Figure 10.
Double Tradition. Probability density functions (upper panel) and probability distribution functions (lower panel) of the number of characters per word. Matthew: green line; Luke: blue line; Q: cyan line.

Figure 11.
Double Tradition. Probability density functions (upper panel) and probability distribution functions (lower panel) of the number of interpunctions per sentence. Matthew: green line; Luke: blue line; Proto–Luke: blue dashed line; Q: cyan line.
Figure 11.
Double Tradition. Probability density functions (upper panel) and probability distribution functions (lower panel) of the number of interpunctions per sentence. Matthew: green line; Luke: blue line; Proto–Luke: blue dashed line; Q: cyan line.

Figure 12.
Double Tradition. Probability density functions (upper panel) and probability distribution functions (lower panel) of the number of words per interpunctions (word interval). Matthew: green line; Luke: blue line; Q: cyan line.
Figure 12.
Double Tradition. Probability density functions (upper panel) and probability distribution functions (lower panel) of the number of words per interpunctions (word interval). Matthew: green line; Luke: blue line; Q: cyan line.

Figure 13.
Own Tradition. Probability density functions (upper panel) and probability distribution functions (lower panel) of the number of words per sentence. Matthew: green line; Luke: blue line; Q: cyan line.
Figure 13.
Own Tradition. Probability density functions (upper panel) and probability distribution functions (lower panel) of the number of words per sentence. Matthew: green line; Luke: blue line; Q: cyan line.

Figure 14.
Own Tradition. Probability density functions (upper panel) and probability distribution functions (lower panel) of the number of characters per word. Matthew: green line; Luke: blue line; Q: cyan line.
Figure 14.
Own Tradition. Probability density functions (upper panel) and probability distribution functions (lower panel) of the number of characters per word. Matthew: green line; Luke: blue line; Q: cyan line.

Figure 15.
Own Tradition. Probability density functions (upper panel) and probability distribution functions (lower panel) of the number of interpunctions per sentence. Matthew: green line; Luke: blue line; Q: cyan line.
Figure 15.
Own Tradition. Probability density functions (upper panel) and probability distribution functions (lower panel) of the number of interpunctions per sentence. Matthew: green line; Luke: blue line; Q: cyan line.

Figure 16.
Own Tradition. Probability density functions (upper panel) and probability distribution functions (lower panel) of the number of words per interpunctions (word interval) . Matthew: green line; Luke: blue line; Q: cyan line.
Figure 16.
Own Tradition. Probability density functions (upper panel) and probability distribution functions (lower panel) of the number of words per interpunctions (word interval) . Matthew: green line; Luke: blue line; Q: cyan line.

Figure 17.
Average number of words per interpunctions, , versus the average number of words per sentence, . Triangles with vertex to the right refer to Full Texts. Squares refer to the Triple Tradition (e.g., Mt3). Circles refer to the Double Tradition (e.g., Mt2). Triangles with vertex up refer to the Own Tradition. Matthew: green; Mark: black; Luke: blue; John: cyan; Acts: red; Revelation: magenta; Q: yellow. Aesop (Ae): magenta star; Polybius (Po): blue star; Plutarch (Pl): black star; Flavius Josephus (FJ): red star.

Figure 18.
Coordinates and of the resulting vector (1) of the texts considered. Triangles with vertices to the right refer to Full Texts. Squares refer to the Triple Tradition (e.g., Mt3). Circles refer to the Double Tradition (e.g., Mt2). Triangles with vertices pointing up refer to the Own Tradition. Matthew: green; Mark: black; Luke: blue; John: cyan; Acts: red; Revelation: magenta; Q: yellow. Aesop (Ae): magenta star; Polybius (Po): blue star; Plutarch (Pl): black star; Flavius Josephus (FJ): red star.

Figure 19.
Coordinates and of the resulting vector (1) of the texts considered. Same symbols as Figure 18. The green triangle refers to Matthew; the blue triangle refers to Luke. The red triangle extends Luke’s literary area (blue + red) to the Acts.
Figure 19.
Coordinates and of the resulting vector (1) of the texts considered. Same symbols as Figure 18. The green triangle refers to Matthew; the blue triangle refers to Luke. The red triangle extends Luke’s literary area (blue + red) to the Acts.


Table 1.
List of the verses considered in Luke, in the indicated texts. The list of names (genealogy) in Verses 3.23–3.38 has not been considered in the statistical analyses.
Table 1.
List of the verses considered in Luke, in the indicated texts. The list of names (genealogy) in Verses 3.23–3.38 has not been considered in the statistical analyses.
| Luke Full Text | All Verses Except 3.23–3.38 (Genealogy) |
|---|---|
| Only in Luke (“Own”) | 1.1 et seq.; 2.1 et seq.; 7.11–17; 7.36–50; 8.1–3; 9.51–55; 10.1–12; 10.16–20; 10.29–42; 11.27–28; 12.13–20; 13.1–17; 14.1–14; 15.8–32; 16.1–15; 16.19–31; 17.11–19; 18.1–14; 19.1–10; 19.41–44; 24.13–53 |
| Matthew, Mark and Luke (“Triple Tradition”) | 3.1 et seq.; 4.1–30; 4.38–44; 5.1 et seq.; 6.1–19; 8.4–56; 9.1–48; 10.25–28;11.14–24; 11.29–33; 11.37–54; 12.33–48; 13.18–20; 14.34–35;16.18; 17.1–10; 17.20–37; 18.15–43; 19.28–40; 19.45–48; 20.1 et seq.; 21.5–37; 22.1 et seq.; 23.1 et seq.; 24.1–12 |
| Matthew and Luke (“Double tradition”) | 6.20–49; 7.1–10; 7.18–35; 9.57–62; 10.13–15; 10.21–24; 11.1–13; 11.34–35; 12.1–12; 12.22–32; 12.49–59; 13.22–35; 14.15–33; 15.1–7; 16.16–17; 19.11–27 |
| Q (Theory of the two sources) | 3.1–9; 3.15–17; 4.1–13; 6.20–23; 6.27–49; 7.1–10; 7.18–28; 7.31–35; 9.57–62; 10.1–16; 10.21–24; 11.1–4; 11.9–35; 11.39–52; 12.2–40; 11.42–46; 11.49–59; 13.18–21; 11.24–30; 11.34–35; 14.11–13; 14.16–35; 15.3–10; 16.13; 16.16–18; 17.1–4; 17.6; 17.23–37; 19.11–27; 22.28–30 |
Table 2.
List of the verses considered in Mark, in the indicated texts.
| Only in Mark (“Own”) | 4.26–28; 7.31–37; 8.22–26;16.9–11 |
|---|---|
| Matthew, Mark and Luke (“Triple Tradition”) | Full text except the verses indicated in “Own” and “Dual Tradition” and Verses 1.1–1.17 (Genealogy) |
| Matthew and Mark (“Double Tradition”) | 4.33–34; 6.45–56; 7.1–30; 8.1–19; 11.12–14; 11.20–25; 14.3–9; 15.16–20 |
Table 3.
List of the verses considered in Matthew, in the indicated texts. The list of names (Genealogy) in Verses 1.1–1.17 17 has not been considered in the statistical analysis.
Table 3.
List of the verses considered in Matthew, in the indicated texts. The list of names (Genealogy) in Verses 1.1–1.17 17 has not been considered in the statistical analysis.
| Matthew Full Text | Except 1.1–1.17 |
|---|---|
| Only in Matthew (“Own”) | 1.1 et seq. (all chapter 1); 2.1 et seq.; 4.23–25 (from Verse 4.23 to Verse 4.25); 5.17–20; 5.27.37; 6.1–18; 9.35–38; 10.34–42; 12.15–21; 13.36–52; 17.24–27; 18.19–35; 20.1–16; 21.28–32; 25.31–46; 27.1–10;28.11–15 |
| Matthew, Mark and Luke (“Triple Tradition”) | 3.1 et seq.; 4.1–17; 5.13–16; 8.1–4;8.14–17; 8.23–34; 9.1–23; 10.1–33;12.1–14; 12.22–50; 13.1–35; 13.53–58; 14.1–21; 16.1 et seq.; 17.1–23; 18.1–10; 19.13–30; 20.17–34; 21.1–17; 21.23–27; 21.33–46; 22.15–46; 23.1–36; 24.1 et seq.; 26.1–5; 26.14–75; 27.11–26; 27.32–66; 28.1–10 |
| Matthew and Luke (“Double Tradition”) | 5.1–11; 5.21–26; 5.38–48; 6.19–34; 7.1 et seq.; 8.5–13; 8.18–22; 9.27–34; 11.1 et seq.; 18.12–18; 22.1–14; 23.37–38; 25.1–30 |
Table 4.
Full Texts. Average number of characters per word , words per sentence , interpunctions per sentence (also, number of word intervals) , words per interpunctions (word interval) . The number between parentheses gives the standard deviation for text blocks of 500 words.
Table 4.
Full Texts. Average number of characters per word , words per sentence , interpunctions per sentence (also, number of word intervals) , words per interpunctions (word interval) . The number between parentheses gives the standard deviation for text blocks of 500 words.
| Text | ||||
|---|---|---|---|---|
| Matthew | 4.906 (0.157) | 20.27 (3.66) | 2.825 (0.413) | 7.182 (0.778) |
| Mark | 4.955 (0.182) | 19.14 (4.35) | 2.683 (0.693) | 7.165 (0.479) |
| Luke | 4.910 (0.134) | 20.47 (3.68) | 2.892 (0.419) | 7.105 (1.075) |
| John | 4.542 (0.169) | 18.56 (2.75) | 2.743 (0.336) | 6.785 (0.855) |
| Acts | 5.099 (0.280) | 25.47 (5.17) | 2.905 (0.467) | 8.766 (1.070) |
| Revelation | 4.658 (0.125) | 30.70 (5.78) | 3.970 (0.805) | 7.785 (0.721) |
Table 5.
Triple Tradition. Average number of characters per word , words per sentence , interpunctions per sentence (also, number of word intervals) , words per interpunctions (word interval) . The numbers between parentheses give the standard deviations for text blocks of 500 words.
Table 5.
Triple Tradition. Average number of characters per word , words per sentence , interpunctions per sentence (also, number of word intervals) , words per interpunctions (word interval) . The numbers between parentheses give the standard deviations for text blocks of 500 words.
| Text | ||||
|---|---|---|---|---|
| Matthew | 4.958 (0.160) | 20.26 (3.08) | 2.888 (0.428) | 7.046 (0.573) |
| Mark | 4.929 (0.152) | 19.20 (2.50) | 2.628 (0.291) | 7.331 (0.640) |
| Luke | 4.931 (0.126) | 20.40 (2.84) | 2.871 (0.330) | 7.136 (0.687) |
Table 6.
Double Tradition. Average number of characters per word , words per sentence , interpunctions per sentence (also, number of word intervals) , words per interpunctions (word interval) . The numbers between parentheses give the standard deviations for text blocks of 500 words.
Table 6.
Double Tradition. Average number of characters per word , words per sentence , interpunctions per sentence (also, number of word intervals) , words per interpunctions (word interval) . The numbers between parentheses give the standard deviations for text blocks of 500 words.
| Text | ||||
|---|---|---|---|---|
| Matthew | 5.009 (0.171) | 19.83 (3.26) | 3.085 (0.538) | 6.489 (0.470) |
| Luke | 4.906 (0.163) | 20.10 (2.43) | 3.095 (0.587) | 6.727 (1.060) |
Table 7.
Own Tradition. Average number of characters per word , words per sentence , interpunctions per sentence (also, number of word intervals) , words per interpunctions (word interval) . The numbers between parentheses give the standard deviations for text blocks of 500 words.
Table 7.
Own Tradition. Average number of characters per word , words per sentence , interpunctions per sentence (also, number of word intervals) , words per interpunctions (word interval) . The numbers between parentheses give the standard deviations for text blocks of 500 words.
| Text | ||||
|---|---|---|---|---|
| Matthew | 4.855 (0.137) | 23.57 (4.20) | 3.043 (0.529) | 7.800 (0.777) |
| Luke | 4.884 (0.136) | 23.12 (4.44) | 3.074 (0.468) | 7.545 (0.888) |
Table 8.
Full Texts. Kolmogorov–Smirnov test results for (below the diagonal of zeros) and (above the diagonal). The values reported are the confidence level (%) that the indicated couple of probability distributions are not identical. For example, the confidence level that the number of words per sentence, , in Mark and Luke are not identical is 1.25%, therefore the two probability distributions are, in effect, indistinguishable. The confidence level that the number of characters per word, , in Mark and Luke are not identical is 29.25%, therefore the two probability distributions are not very different, thus indicating that the words contained in their dictionary are of about the same length. The root mean square (RMS) value is calculated as follows. Example, Luke’s .
| Text | Matthew | Mark | Luke | John | Acts | Revelation | RMS |
|---|---|---|---|---|---|---|---|
| Matthew | 0 | 29.65 | 9.92 | 99.98 | 94.41 | 98.68 | 76.97 |
| Mark | 45.49 | 0 | 28.41 | 99.95 | 65.70 | 99.18 | 71.87 |
| Luke | 1.25 | 52.70 | 0 | >99.99 | 95.61 | 99.63 | 77.42 |
| John | 80.25 | 36.83 | 85.81 | 0 | >99.99 | 74.21 | 95.39 |
| Acts | 99.91 | 99.92 | 99.89 | 99.99 | 0 | 99.92 | 92.04 |
| Revelation | >99.99 | >99.99 | >99.99 | 99.99 | 97.57 | 0 | 94.86 |
| RMS | 75.49 | 72.37 | 77.61 | 83.85 | 99.46 | 99.52 |
Table 9.
Full Texts. Kolmogorov–Smirnov test results for (below the diagonal of zeros) and (above the diagonal). The values reported are the confidence level (%) that the indicated couple of probability distributions are not identical.
Table 9.
Full Texts. Kolmogorov–Smirnov test results for (below the diagonal of zeros) and (above the diagonal). The values reported are the confidence level (%) that the indicated couple of probability distributions are not identical.
| Text | Matthew | Mark | Luke | John | Acts | Revelation | RMS |
|---|---|---|---|---|---|---|---|
| Matthew | 0 | 82.94 | 9.63 | 24.32 | 22.74 | >99.99 | 60.13 |
| Mark | 30.51 | 0 | 89.89 | 81.70 | 89.72 | 99.99 | 89.09 |
| Luke | 39.61 | 77.86 | 0 | 48.89 | 6.13 | >99.99 | 64.19 |
| John | 78.00 | 94.17 | 45.87 | 0 | 65.71 | >99.99 | 69.25 |
| Acts | >99.99 | >99.99 | >99.99 | >99.99 | 0 | >99.99 | 67.71 |
| Revelation | 92.22 | 96.74 | 96.61 | 99.74 | 99.07 | 0 | >99.99 |
| RMS | 73.60 | 83.93 | 76.25 | 86.03 | 99.81 | 96.91 |
Table 10.
Triple Tradition and Q. Kolmogorov–Smirnov test results for (below the diagonal of zeros) and (above the diagonal). The values reported are the confidence level (%) that the indicated couple of probability distributions are not identical.
Table 10.
Triple Tradition and Q. Kolmogorov–Smirnov test results for (below the diagonal of zeros) and (above the diagonal). The values reported are the confidence level (%) that the indicated couple of probability distributions are not identical.
| Text | Matthew | Mark | Luke | Q | RMS |
|---|---|---|---|---|---|
| Matthew | 0 | 15.03 | 22.10 | 63.87 | 39.97 |
| Mark | 46.21 | 0 | 6.61 | 40.26 | 25.10 |
| Luke | 3.03 | 50.66 | 0 | 58.28 | 36.19 |
| Q | 34.83 | 78.80 | 26.27 | 0 | 55.07 |
| RMS | 33.45 | 60.31 | 32.99 | 52.00 |
Table 11.
Triple Tradition and Q. Kolmogorov–Smirnov test results for (below the diagonal of zeros) and (above the diagonal). The values reported are the confidence level (%) that the indicated couple of probability distributions are not identical.
Table 11.
Triple Tradition and Q. Kolmogorov–Smirnov test results for (below the diagonal of zeros) and (above the diagonal). The values reported are the confidence level (%) that the indicated couple of probability distributions are not identical.
| Text | Matthew | Mark | Luke | Q | RMS |
|---|---|---|---|---|---|
| Matthew | 0 | 81.58 | 7.70 | 67.98 | 61.47 |
| Mark | 54.01 | 0 | 81.40 | 74.24 | 79.15 |
| Luke | 14.65 | 23.57 | 0 | 11.31 | 47.66 |
| Q | 37.56 | 72.01 | 39.76 | 0 | 58.50 |
| RMS | 38.91 | 53.72 | 27.99 | 52.21 |
Table 12.
Double Tradition. Kolmogorov–Smirnov test results for (below the diagonal of zeros) and (above the diagonal). The values reported are the confidence level (%) that the indicated couple of probability distributions are not identical.
Table 12.
Double Tradition. Kolmogorov–Smirnov test results for (below the diagonal of zeros) and (above the diagonal). The values reported are the confidence level (%) that the indicated couple of probability distributions are not identical.
| Text | Matthew | Luke | Q | RMS |
|---|---|---|---|---|
| Matthew | 0 | 27.74 | 60.03 | 46.76 |
| Luke | 9.43 | 0 | 15.05 | 22.32 |
| Q | 36.82 | 28.66 | 0 | 43.76 |
| RMS | 26.88 | 21.33 | 32.99 |
Table 13.
Double Tradition and Q. Kolmogorov–Smirnov test results for (below the diagonal of zeros) and (above the diagonal). The values reported are the confidence level (%) that the indicated couple of probability distributions are not identical.
Table 13.
Double Tradition and Q. Kolmogorov–Smirnov test results for (below the diagonal of zeros) and (above the diagonal). The values reported are the confidence level (%) that the indicated couple of probability distributions are not identical.
| Text | Matthew | Luke | Q | RMS |
|---|---|---|---|---|
| Matthew | 0 | 0.50 | 11.73 | 8.30 |
| Luke | 29.70 | 0 | 11.71 | 8.29 |
| Q | 37.38 | 11.31 | 0 | 11.72 |
| RMS | 33.76 | 22.47 | 27.62 |
Table 14.
Own Tradition and Q. Kolmogorov–Smirnov test results for (below the diagonal of zeros) and (above the diagonal). The values reported are the confidence level (%) that the indicated couple of probability distributions are not identical.
Table 14.
Own Tradition and Q. Kolmogorov–Smirnov test results for (below the diagonal of zeros) and (above the diagonal). The values reported are the confidence level (%) that the indicated couple of probability distributions are not identical.
| Matthew | Luke | Q | RMS | |
|---|---|---|---|---|
| Matthew | 0 | 3.77 | 4.87 | 4.35 |
| Luke | 3.34 | 0 | 16.77 | 12.15 |
| Q | 37.50 | 34.26 | 0 | 12.35 |
| RMS | 26.62 | 24.34 | 35.92 |
Table 15.
Own Tradition and Q. Kolmogorov–Smirnov test results for (below the diagonal of zeros) and (above the diagonal). The values reported are the confidence level (%) that the indicated couple of probability distributions are not identical.
Table 15.
Own Tradition and Q. Kolmogorov–Smirnov test results for (below the diagonal of zeros) and (above the diagonal). The values reported are the confidence level (%) that the indicated couple of probability distributions are not identical.
| Text | Matthew | Luke | Q | RMS |
|---|---|---|---|---|
| Matthew | 0 | 5.47 | 20.89 | 15.27 |
| Luke | 14.73 | 0 | 10.30 | 8.25 |
| Q | 83.91 | 73.90 | 0 | 16.47 |
| RMS | 60.24 | 53.28 | 79.06 |
Table 16.
Confidence levels (%) for the indicated Traditions (only Matthew and Luke).
| Tradition | RMS | ||||
|---|---|---|---|---|---|
| Triple Tradition | 3.03 | 22.10 | 7.70 | 14.65 | 13.89 |
| Double Tradition | 9.43 | 27.74 | 0.50 | 29.70 | 20.86 |
| Own Tradition | 3.34 | 3.77 | 5.47 | 14.73 | 8.25 |
| RMS | 6.03 | 20.59 | 5.46 | 20.93 |
Table 17.
Examples of classical Greek literature. Totals of characters, words, sentences; average number of characters per word , words per sentence , interpunctions per sentence (also, number of word intervals, words per interpunctions (word interval) . The number between parentheses gives the standard deviation for text blocks of 500 words.
| Author | Characters | Words | Sentences | ||||
|---|---|---|---|---|---|---|---|
| Polybius | 1,530,968 | 256,495 | 8830 | 5.969 (0.438) | 29.19 (7.45) | 3.302 (1.200) | 8.877 (1.975) |
| Plutarch | 2,750,711 | 499,683 | 17,905 | 5.505 (0.362) | 29.35 (22.81) | 3.730 (2.288) | 7.815 (2.428) |
| Flavius Josephus | 670,313 | 121,717 | 4004 | 5.507 (0.218) | 31.05 (7.61) | 3.199 (0.657) | 9.737 (1.523) |
| Aesop | 204,913 | 39,122 | 2172 | 5.238 (0.167) | 18.29 (3.34) | 3.463 (0.511) | 5.275 (0.382) |
© 2019 by the authors. Licensee MDPI, Basel, Switzerland. This article is an open access article distributed under the terms and conditions of the Creative Commons Attribution (CC BY) license (http://creativecommons.org/licenses/by/4.0/).
Share and Cite
MDPI and ACS Style
Matricciani, E.; Caro, L.D. A Deep-Language Mathematical Analysis of Gospels, Acts and Revelation. Religions 2019, 10, 257. https://doi.org/10.3390/rel10040257
AMA Style
Matricciani E, Caro LD. A Deep-Language Mathematical Analysis of Gospels, Acts and Revelation. Religions. 2019; 10(4):257. https://doi.org/10.3390/rel10040257
Chicago/Turabian StyleMatricciani, Emilio, and Liberato De Caro. 2019. "A Deep-Language Mathematical Analysis of Gospels, Acts and Revelation" Religions 10, no. 4: 257. https://doi.org/10.3390/rel10040257
Note that from the first issue of 2016, this journal uses article numbers instead of page numbers. See further details here.