Contact-Less Real-Time Monitoring of Cardiovascular Risk Using Video Imaging and Fuzzy Inference Rules
by
 , ,
, ,
Gabriella Casalino
1,2 ,
,
Giovanna Castellano
1,2,* ,
,
Vincenzo Pasquadibisceglie
1 and
Gianluca Zaza
1 1
Department of Computer Science, University of Bari Aldo Moro, Via Orabona, 4-70125 Bari, Italy
2
INDAM Research Group GNCS, 00185 Roma, Italy
*
Author to whom correspondence should be addressed.
Information 2019, 10(1), 9; https://doi.org/10.3390/info10010009
Submission received: 30 October 2018
/
Revised: 12 December 2018
/
Accepted: 24 December 2018
/
Published: 29 December 2018
(This article belongs to the Special Issue eHealth and Artificial Intelligence)
Abstract
:Conventional methods for measuring cardiovascular parameters use skin contact techniques requiring a measuring device to be worn by the user. To avoid discomfort of contact devices, camera-based techniques using photoplethysmography have been recently introduced. Nevertheless, these solutions are typically expensive and difficult to be used daily at home. In this work, we propose an innovative solution for monitoring cardiovascular parameters that is low cost and can be easily integrated within any common home environment. The proposed system is a contact-less device composed of a see-through mirror equipped with a camera that detects the person’s face and processes video frames using photoplethysmography in order to estimate the heart rate, the breath rate and the blood oxygen saturation. In addition, the color of lips is automatically detected via clustering-based color quantization. The estimated parameters are used to predict a risk of cardiovascular disease by means of fuzzy inference rules integrated in the mirror-based monitoring system. Comparing our system to a contact device in measuring vital parameters on still or slightly moving subjects, we achieve measurement errors that are within acceptable margins according to the literature. Moreover, in most cases, the response of the fuzzy rule-based system is comparable with that of the clinician in assessing a risk level of cardiovascular disease.
1. Introduction
Cardiovascular diseases are on the list of top ten causes of annual global death in 2015 (Global Health Estimates: www.who.int/healthinfo/global_burden_disease/estimates/en/), hence regular assessment of the cardiovascular function is fundamental to prevent chronic diseases and to evolve treatment therapies adequately. The constant monitoring of vital signs, such as heart rate and arterial blood oxygen saturation, is the basis to detect a risk level of cardiovascular disease [1]. Electrocardiogram (ECG) is the most widely adopted technique to provide correct and reliable values for cardiac monitoring. However, this technique realizes an invasive acquisition mode, since it requires the contact between the electrodes and the skin, and an incorrect positioning of the electrodes on the skin can induce tissue irritation.
To avoid ECG inefficiency, less invasive solutions for comfortable physiological assessment without electrodes have been developed in the last years. In particular, photoplethysmography (PPG) [2] has been introduced as a low cost and non-invasive means of sensing the cardiovascular pulse wave (also called the blood volume pulse) through variations in transmitted or reflected light. In fact, the impulse of the cardio-vascular wave that flows through the body periodically causes a stretch in the vessel walls, with consequent fluctuations in blood volume. These fluctuations modulate the absorbency of light passing through a given volume of tissue, so it is possible to evaluate the variation of light during a normal cardiac cycle. If these changes are recorded, they originate a waveform that corresponds to the changes in the pulsatile arterial blood in the tissue [3]. Hence, PPG can provide valuable information about the cardiovascular system such as heart rate, arterial blood oxygen saturation, blood pressure, cardiac output and autonomic function [3]. The use of PPG for non-contact physiological measurements has been widely investigated in the literature [4,5,6,7,8]. One common device based on principles of PPG is the pulse oximeter, a contact device that can detect the oxygen saturation of the blood and the heart rate by simply exploiting the changes in blood volume in the micro-circulation of the human tissues [9].
Although less-invasive than ECG, the pulse oximeter and other dedicated light sources (e.g., red or infra-red wavelengths) still require direct contact to the skin, hence they could bring discomfort. For this reason, in the last several years, the market has witnessed the continuous spread of new devices and software systems that allow contact-less monitoring of the main vital parameters, e.g., heart rate, oxygen saturation and respiratory rate. Recent works have shown that pulse measurements can be acquired using digital cameras with normal ambient light as the illumination source and applying image processing algorithms. A technical literature review of such solutions based on video imaging is provided in [10,11]. Starting from the pioneer work of Verkruysse et al. [8], several works showed that a video captured using a consumer-grade camera contains a rich enough plethysmographic signal to measure vital parameters using image processing and blind source separation, as described by Poh [12]. In [6], a charge coupled device (CCD) camera for the acquisition of the person’s face is used to extract the heart rate and the respiratory rate. In [13], a non-invasive real-time heart rate monitoring system is proposed based on the Microsoft device Kinect™ version 2.0. In [14], a real-time monitoring system is proposed where a webcam is used to measure the heart rate of car drivers.
All of these non-invasive solutions are effective but difficult to employ in domestic scenarios. Comfort and ease of use are primary criteria for adequate monitoring systems and personalized health services. For this reason, solutions to support the daily management of diseases are steadily growing [15,16]. Nevertheless, in many cases, these monitoring solutions require expensive or cumbersome devices, thus preventing their large-scale adoption in personal health care. Conversely, there is a need for low-cost monitoring solutions that are easy to use, accurate, and can be easily employed in domestic or ambulatory settings. In [17], a very easy-to-use solution is proposed based on a mobile phone to detect the color change signal for non-invasive assessing of physiological parameters. However, the use of mobile devices turns out to be quite uncomfortable for elderly people, who maximally require constant monitoring of vital parameters.
In this paper, we propose an innovative solution for non-contact monitoring of vital signs that satisfies both low-cost and comfort requirements and acts as a decision-making system to support medical diagnosis of cardiovascular disease. The proposed monitoring system is based on a see-through mirror provided with a camera to acquire video frames of the mirrored face of the person. Signals coming from the RGB channels of face video frames are processed in accordance to photoplethysmography in order to evaluate the heart rate, the breath rate and the oxygen saturation in blood. As an additional vital sign, the color of lips is automatically detected using clustering-based color quantization. The developed mirror-based system provides a contact-less way to measure vital parameters without any effort more than being in front of a mirror. It is a cheap device that is easy to use, lending itself very well for domestic use as well as for telemedicine applications. Moreover, unlike other existing contact-less monitoring solutions, that are oriented only to measure vital parameters, our solution integrates an intelligent component that provides for a support to medical diagnosis of cardiovascular disease. The intelligent component uses fuzzy IF-THEN rules to infer a level of cardiovascular risk starting from the vital parameters acquired by the smart mirror. The risk assessment provided by the fuzzy rule-based system represents immediate feedback for the patient as well as valid support for clinicians in the diagnosis of possible cardiovascular diseases.
2. Materials and Methods
The proposed system is a smart device that acquires the face of the subject in front of the mirror, processes the signals coming from the face image and estimates values of four vital parameters, namely hearth rate, breath rate, blood oxygen saturation and color of lips. These parameters are sent in input to a fuzzy inference system which returns a cardiovascular risk level using fuzzy rules defined with the help of a physician.
2.1. Architecture
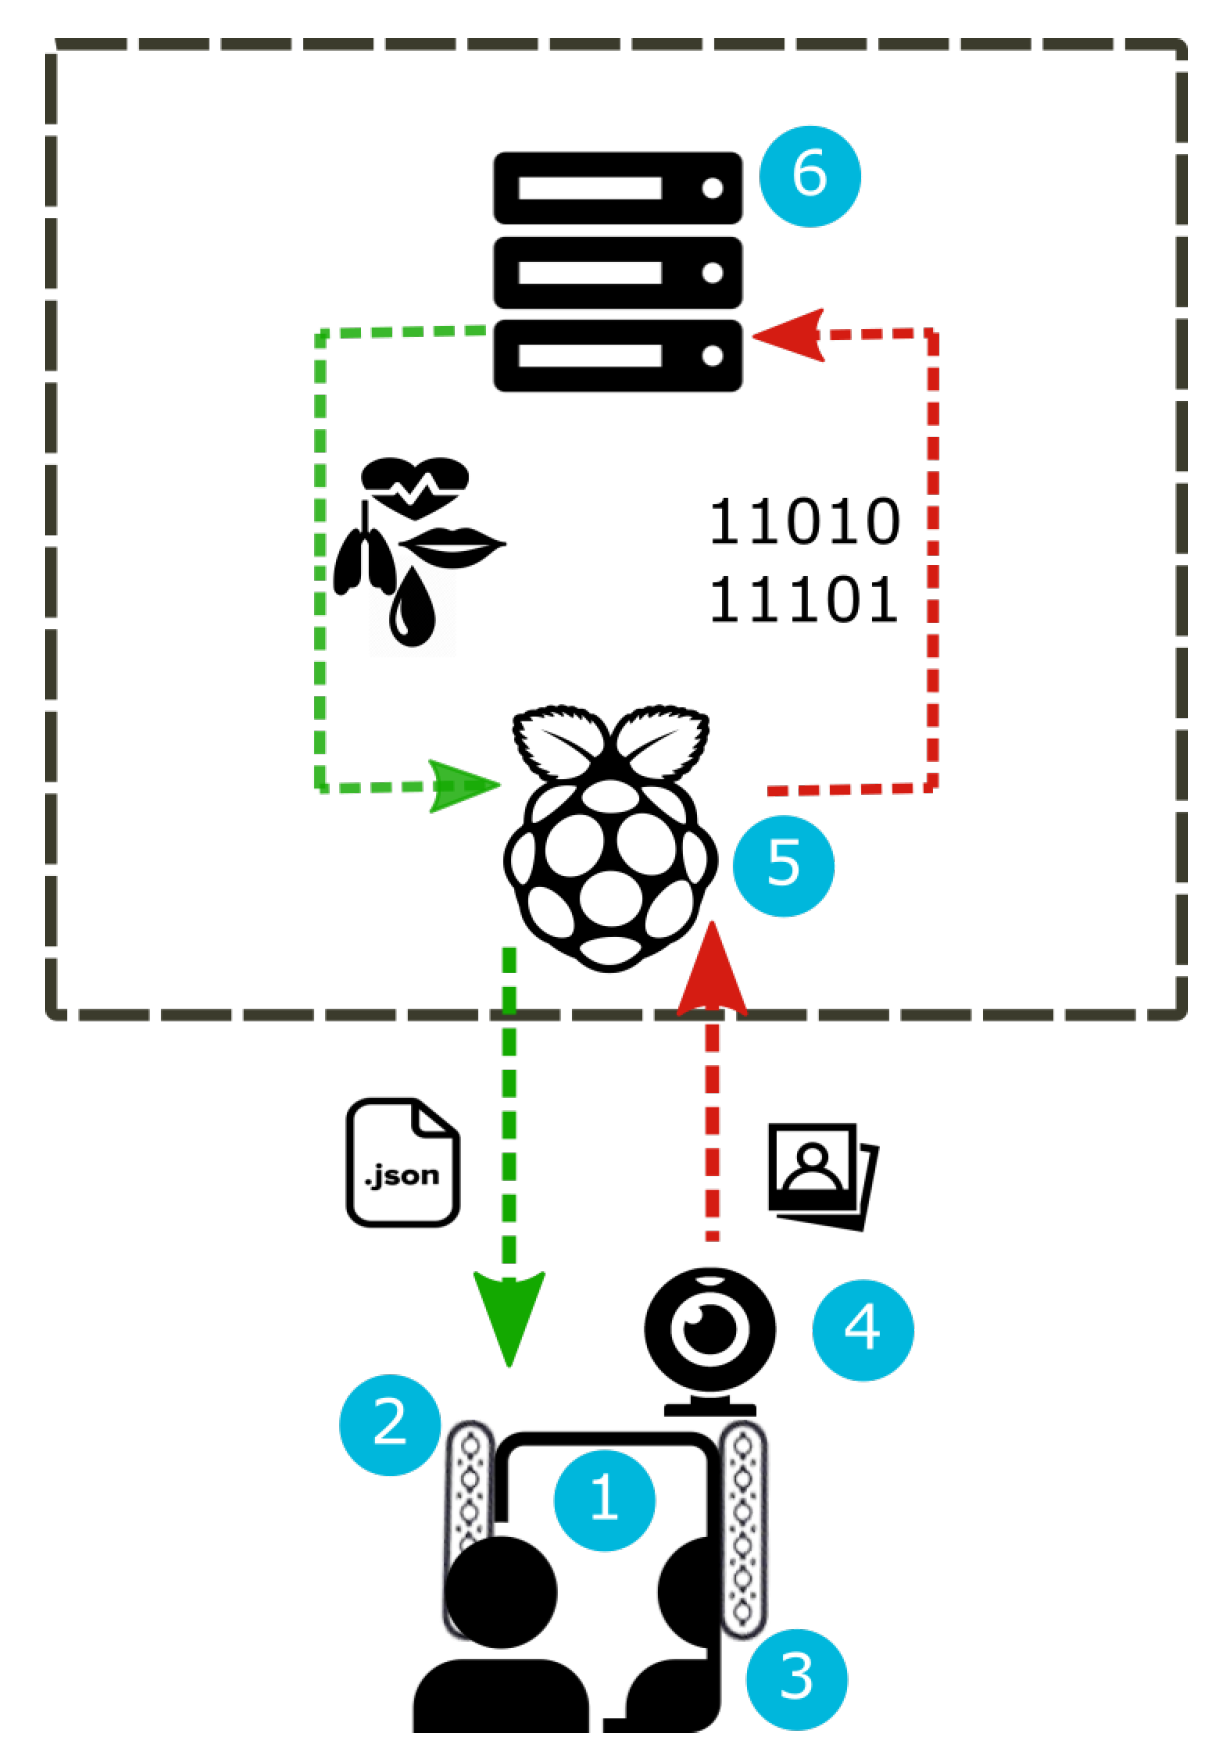
The hardware architecture of the proposed system includes different components that are cheap and easily available on the market (Figure 1). The principal component is a see-through mirror ①. It is a 12 × 12 3 mm thick acrylic film that is partially reflective and partially transparent. Light always passes equally in both directions; however, when one side is brightly lit and the other one is kept dark, the darker side becomes difficult to see from the brightly lit side because it is masked by the much brighter reflection of the lit side. Our idea is to put a monitor in the darker side so that the output of the system can be displayed through the mirror. The lighting conditions of the working environment play a crucial role for the acquisition of a good video stream and for the subsequent estimation of vital parameters. For this reason, we equip the mirror film with a wood frame and we apply two strips of white LED lights on the right and left side of the frame ②. Each strip is composed of 18 LED lights and has the following characteristics: 12 V, 6.0 W, 0.5 A and 120 beam angle. The monitor ③ behind the see-through mirror is used to show vital parameter values resulting from video frame processing. An high-definition (HD) camera ④ is integrated with the see-through mirror to record high-quality video frames. We adopted the Microsoft LifeCam that is quite small (3.44 length, 1.57 width) and it is provided with autofocus and with a HD 1080p sensor that guarantees high sharpness and quality of the acquired image. A client/server architecture completes the hardware equipment of our system. The client is a Raspberry Pi board ⑤ with a CPU Quad Core 1.2 GHz Broadcom BCM2837 64bit, four USB ports, 1 GB RAM, Micro SD for the boot of the operating system and data storage. The client sends frames to the server that processes them to analyze RGB signals. In the current prototypical version of the system, the server ⑥ is a desktop computer equipped with CPU Intel(R) Core(TM) i5-5200 2.20 GHz 64 bit, 4 GB RAM and 500 GB hard disk.
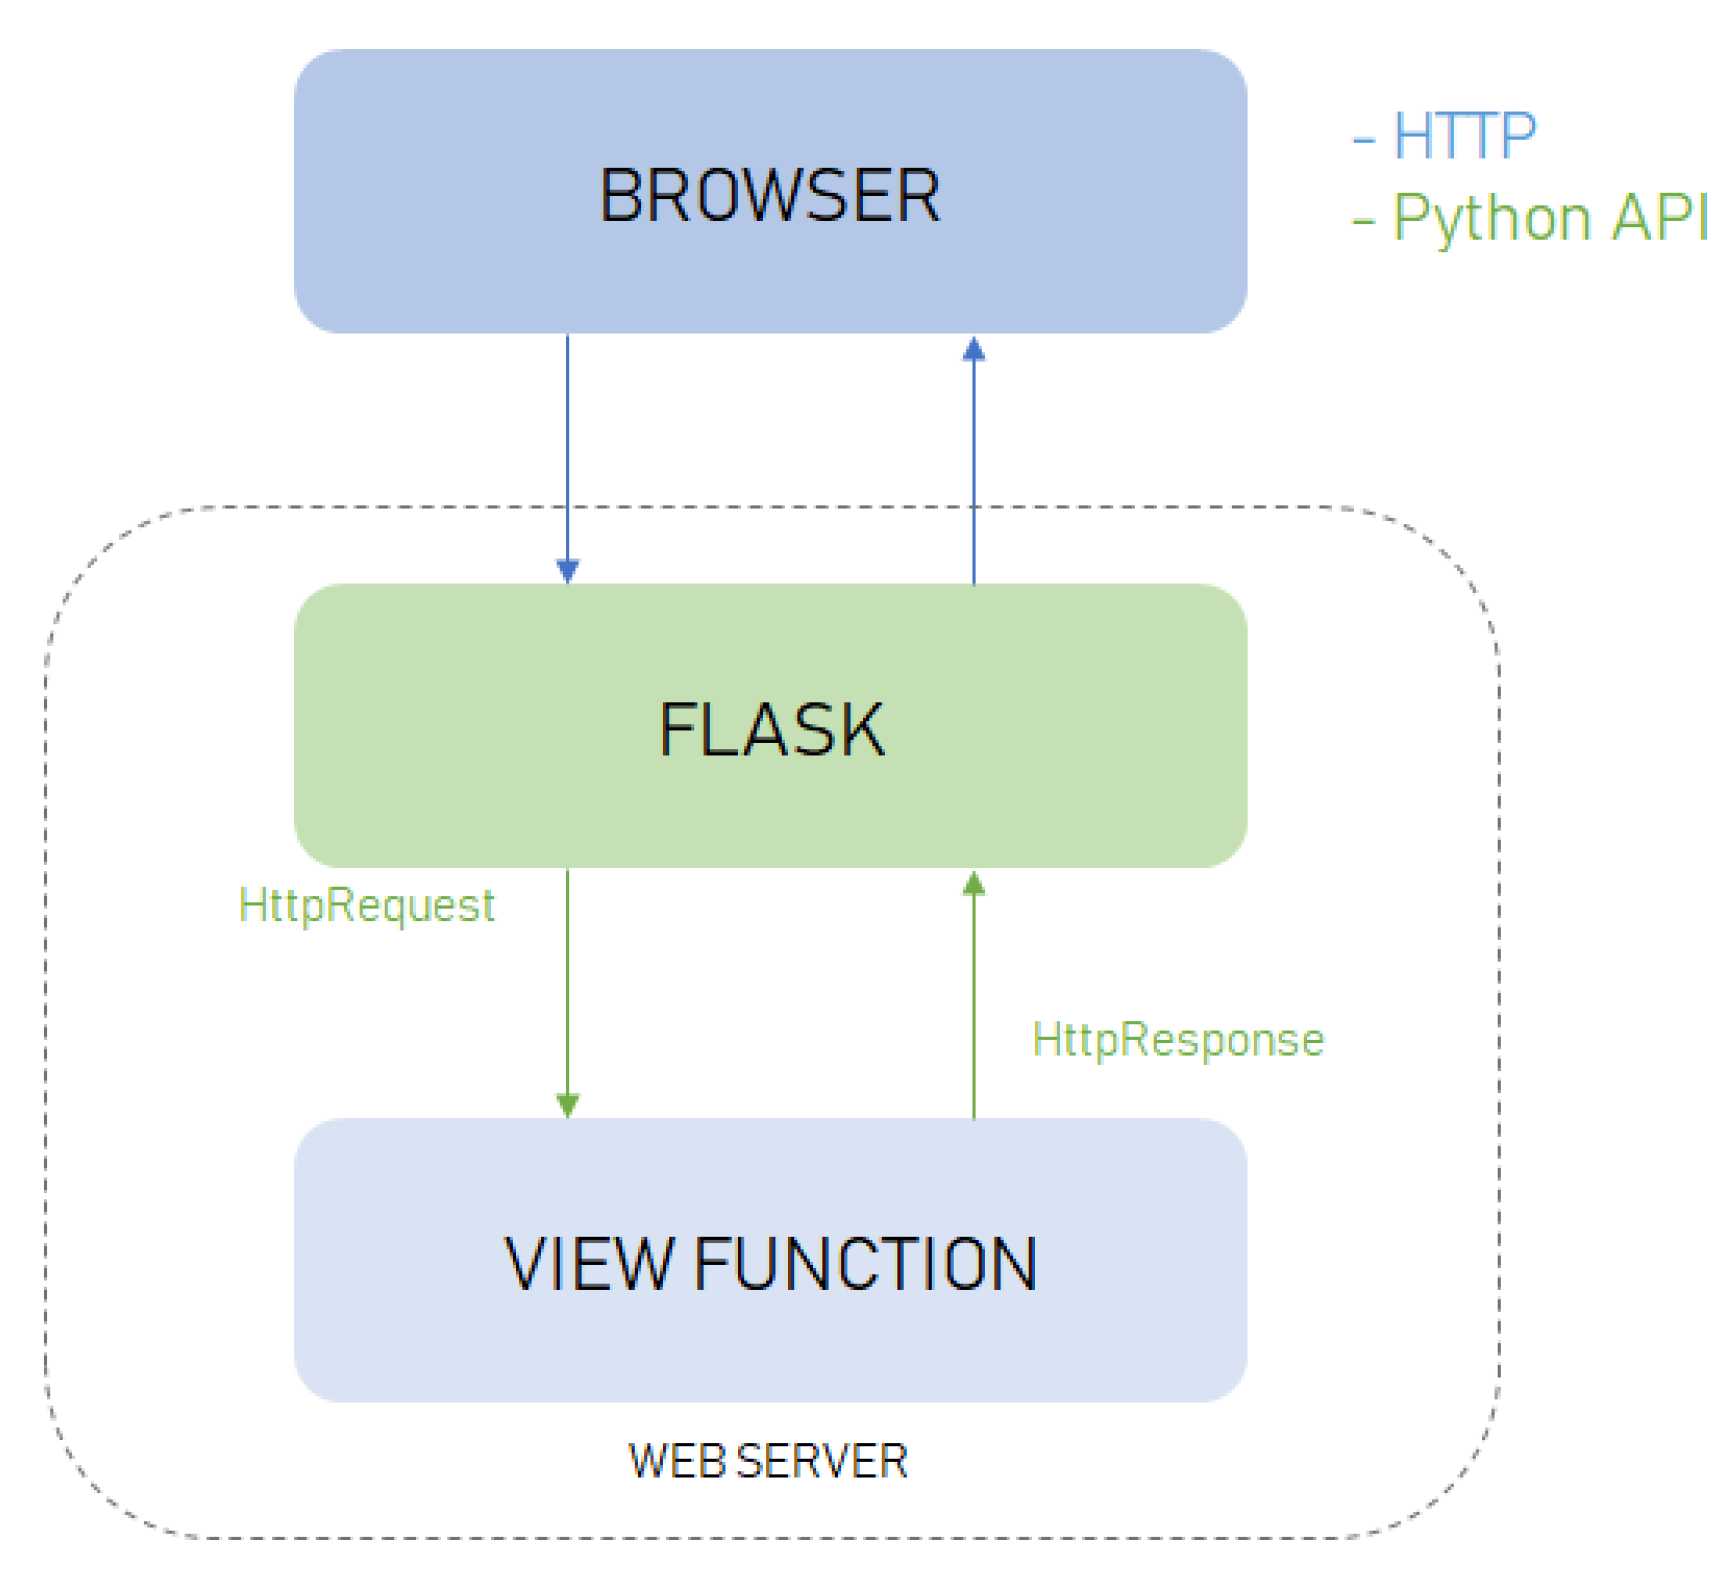
All of the methods underlying our system have been implemented in Python 3.6 (www.python.org/downloads/release/python-360/) using the OpenCV library (https://opencv.org/) useful to activate the HD camera, to detect the person’s face and to acquire, process and analyze the signals from the RGB channels of each frame. The software architecture of the system (Figure 2) includes a front-end and a back-end module. The front-end module manages the graphical interface and the user–system interaction. Data coming from the front-end are processed by the back-end module that outputs the results. The back-end is a Web Service implemented in Flask (http://flask.pocoo.org/) which is a micro web framework compatible with Python 3.6. Flask is based on the toolkit Werkzeug and the template engine Jinja2, both based on the BSD (Berkeley Software Distribution) open source license. The tool Werkzeug (http://werkzeug.pocoo.org/) includes various utilities for WSGI (Web Server Gateway Interface) applications and a transmission protocol that establishes and describes communications and interactions between servers and web applications. The front-end was developed using the engine template Jinja2, which enables the creation of HTML or XML files that are sent to the client via HTTP. Jinja2 (http://jinja.pocoo.org/) is based on the HMTL markup language and the Javascript and Ajax scripting languages. These scripting languages enable the acquisition of the video frames from the camera and the composition of a POST request to send data to the Web Service. The Web Service provides the result in JSON format. The Client/Server communication is realized using the Ajax scripting language that, combined with the HTML language, enables the exchange of data in background between the browser and the Web Service (Figure 2).
2.2. Evaluation of Vital Parameters
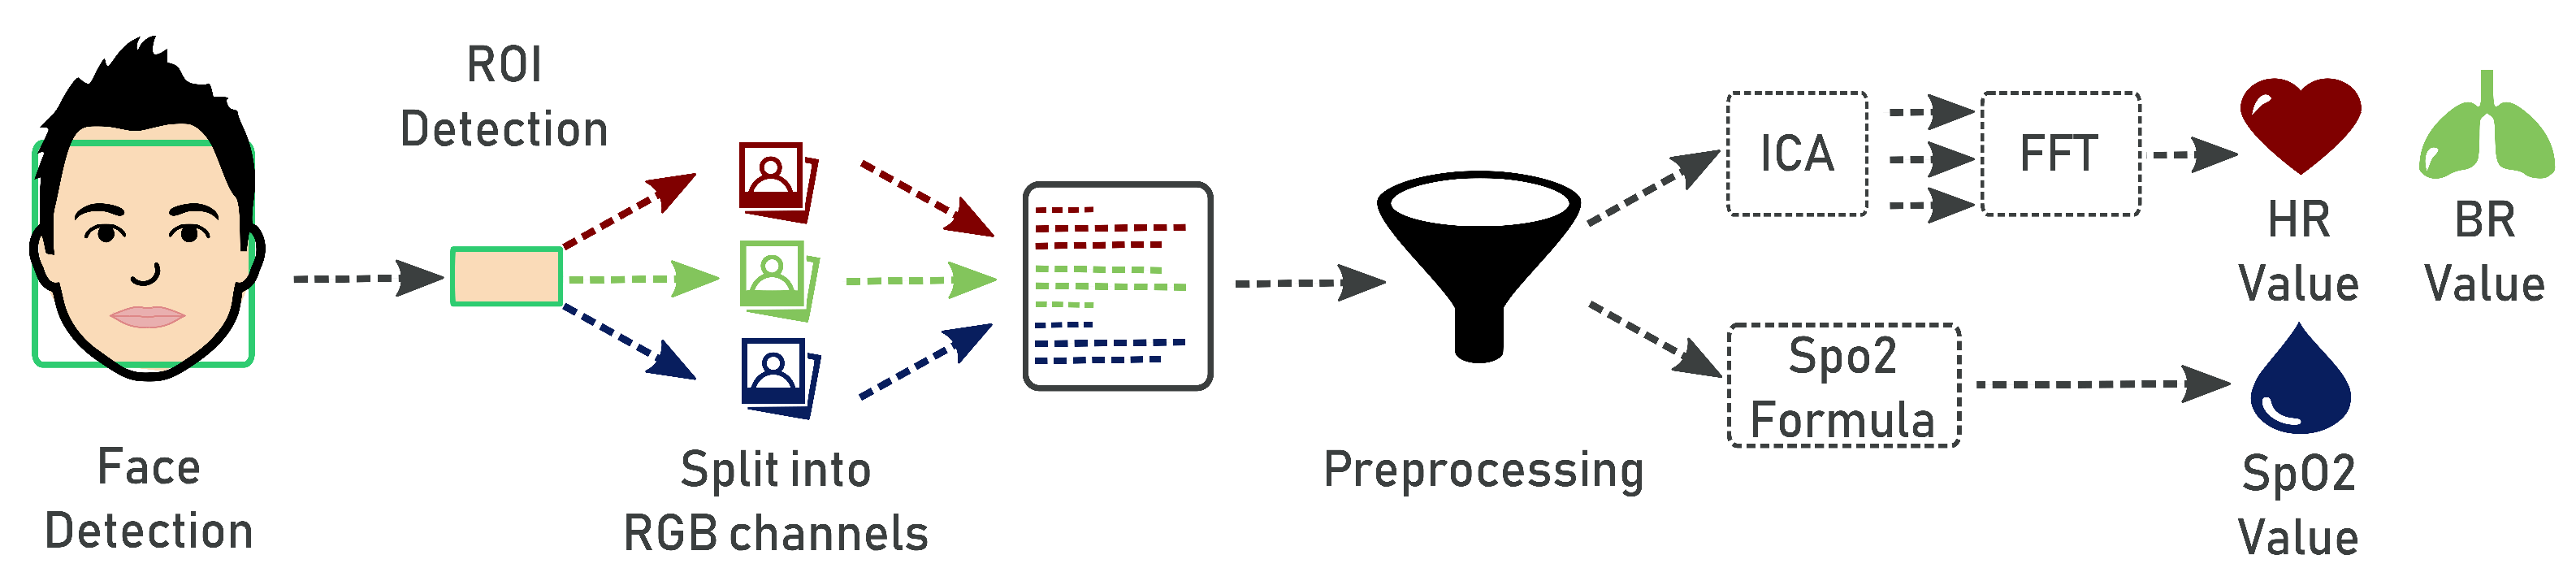
The proposed system is able to measure four vital parameters, namely heart rate, breath rate, blood oxygen saturation and color of lips. The pipeline (Figure 3) to compute heart rate, breath rate and blood oxygen saturation values includes the following steps:
- 1.
- The first step is face detection. The frames are acquired in real-time through the camera and represented in 24-bit RGB color with 3 channels × 8 bits/channel with resolution of pixel. At the start, we perform a preliminary acquisition cycle of 40 s. This is necessary to avoid the initial distortion due to the start of the camera. Afterwards, the camera acquires a video frame every 5 s. The frame acquisition phase was developed using the WebRTC (Web Real-Time Communications) API (https://webrtc.org/). WebRTC is a technology that allows applications and web pages to capture audio or video streams and to exchange data among different browsers, being a cross-platform technology. To detect the face within the video frames, we used the pre-trained frontal face detector available with the Python library Dlib (http://dlib.net/). This detector is based on a modified linear support vector machine (SVM) combined with histogram of oriented gradients (HOG) [18]. Given the detected face, we apply a predictive model that provides a set of 68 facial landmarks given in the form of coordinates. This model was obtained in [19] by training an ensemble of regression trees on images from the iBUG 300-W dataset (https://ibug.doc.ic.ac.uk/resources/300-W/).
- 2.
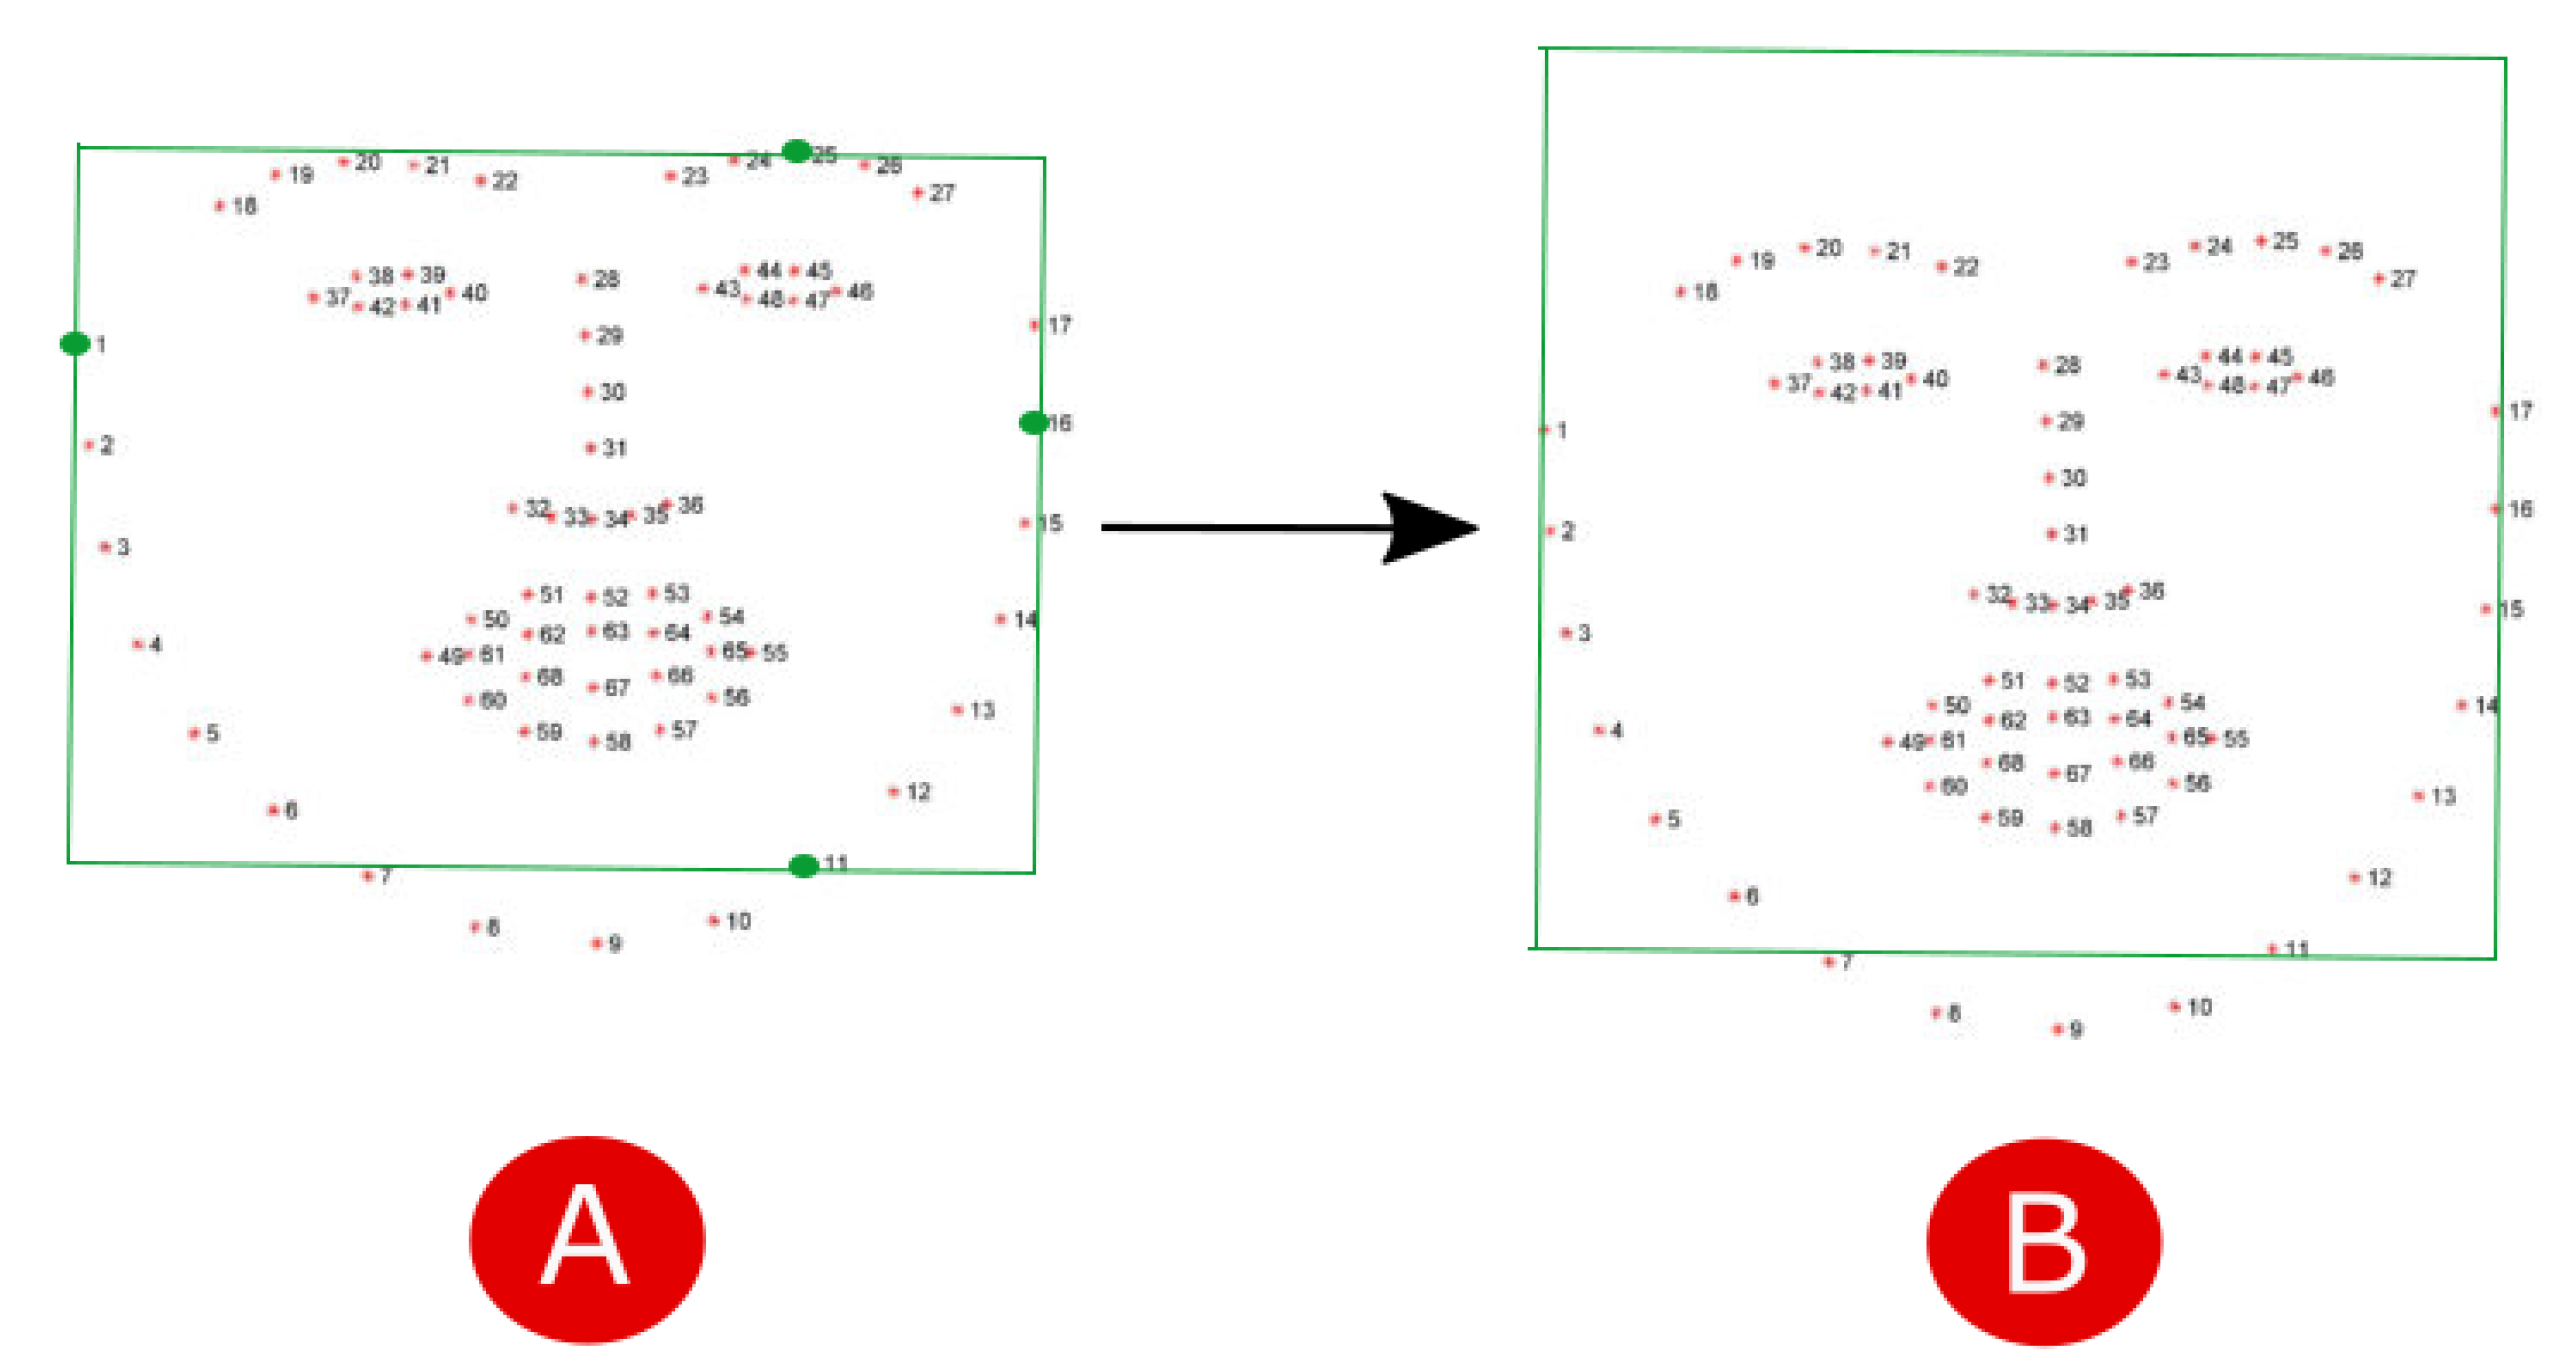
- In the second step, given the face region identified by landmarks, we localize the region of interest (ROI) corresponding to a region with a strong passage of blood modulation, so as to enable evaluation of heart rate, breathing and oxygen saturation by means of photoplethysmography. According to [20], the most suitable areas for the detection of heart rate are the forehead and cheeks. To simplify the computation we decided to consider only the forehead. A rectangle centered in the forehead of size pixels was considered. To locate the ROI, we firstly construct a bounding box including the face by considering the landmarks 1-11-16-25 as vertexes (Figure 4A). Then, in order to include the forehead, we build an enlarged rectangle by augmenting the height of the bounding box of 20 pixels (Figure 4B).
- 3.
- The next step is the analysis of the signals coming from the forehead ROI marked in each frame. The ROI is separated into the three RGB channels and spatially averaged over all pixels to yield a red, blue and green measurement value for each frame. The acquired average signals are composed of N data, being N the number of frames, hence we obtain a matrix with dimensions.
- 4.
- Since the values in the RGB components are easily disturbed by the motion and fluctuations in image lightness, they can not be directly used for the skin color analysis. Indeed, the signals coming from the detected ROI pick up a mixture of the reflected plethysmographic signal along with other sources of fluctuations in light due to artifacts such as motion and changes in ambient lighting conditions. Therefore, the noisy signals are improved through a preprocessing phase involving linear interpolation, detrend [21], normalization and band-pass filtering. Since high-frequency noise may occur in the image signals, we apply a filter based on the frequency characteristics of the heart rate to reduce the disturbance. The adopted frequency of the band-pass filter was fixed between 0.6 and 4 Hz (corresponding to heart rate [36, 240]/bpm) for heart rate estimation.
- 5.
- In order to evaluate the hearth rate and the breath rate, the independent source signals from each multivariate signal (i.e., color channel) should be uncovered. To do this, we apply Independent Component Analysis (ICA) [22] as a blind source separation technique. In conventional ICA, the number of recoverable sources cannot exceed the number of observations, thus we assume three underlying source signals [23]. We use the FastICA method available in the Scikit-learn Python library (http://scikit-learn.org/stable/). Then, the spectral analysis of the components is applied in order to represent the distribution of the power of the signal itself. To perform spectral analysis, we use the Fast Fourier Transform (FFT) implemented in the Python Numpy library (http://www.numpy.org/). In order to select the component containing the strongest signal, we apply the periodogram function that calculates the spectral density of each component. Given the selected component, we find the frequency corresponding to the maximum peak’s intensity in the same band of the filter , which corresponds to the range [51 to 210 bpm] of the heart rate. Likewise, we find the frequency corresponding to the maximum peak’s intensity in the same band of the filter , which corresponds to the range [9 to 30 bpm] of the breath rate. Finally, we obtain the value of the heart rate () and breath rate (), meant as average beats per minute, by multiplying the frequency values and by 60, namely and .
- 6.
- Blood saturation indicates the intensity of oxygen in blood and is defined as:where is the oxygenated hemoglobin, and is the deoxygenated hemoglobin. According to [24], an estimation of can be obtained by considering the cardiovascular pulse wave signal at two different wavelengths, hence, by comparing the red and blue bands, the blue band representative of the infrared wavelength being used in traditional pulse oximeter calculations. The standard deviations of the red and blue bands at each time point are used as the pulsatile alternating current () component, while the non-pulsatile direct current () component is computed as the red and blue band mean intensities at each time point. Oxygen saturation is then computed as follows:where we fix and according to the empirical evaluation made in [24].
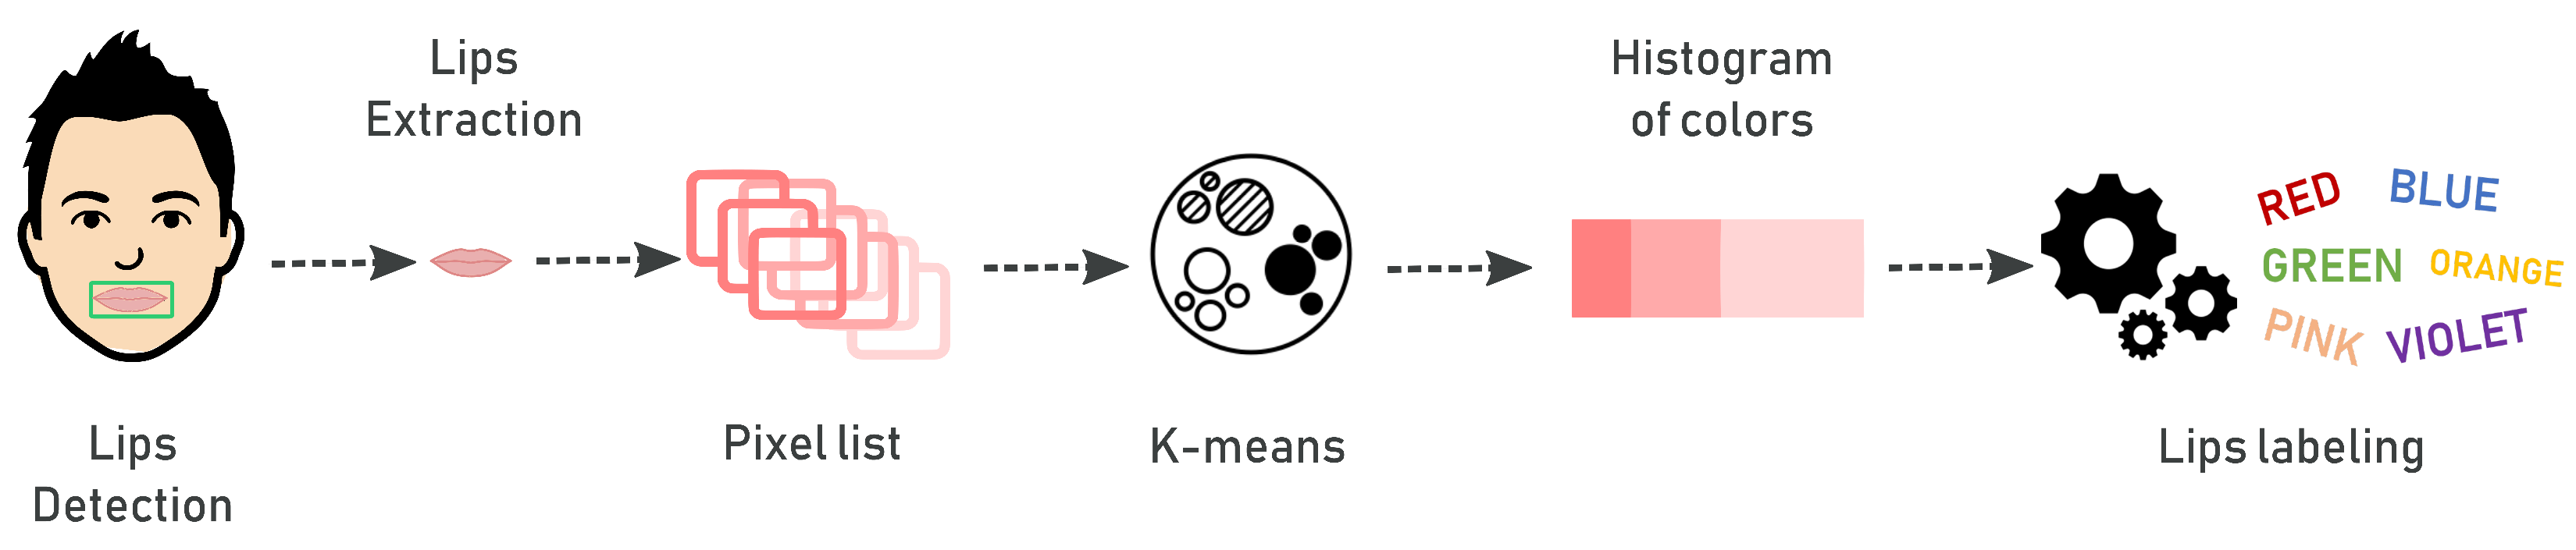
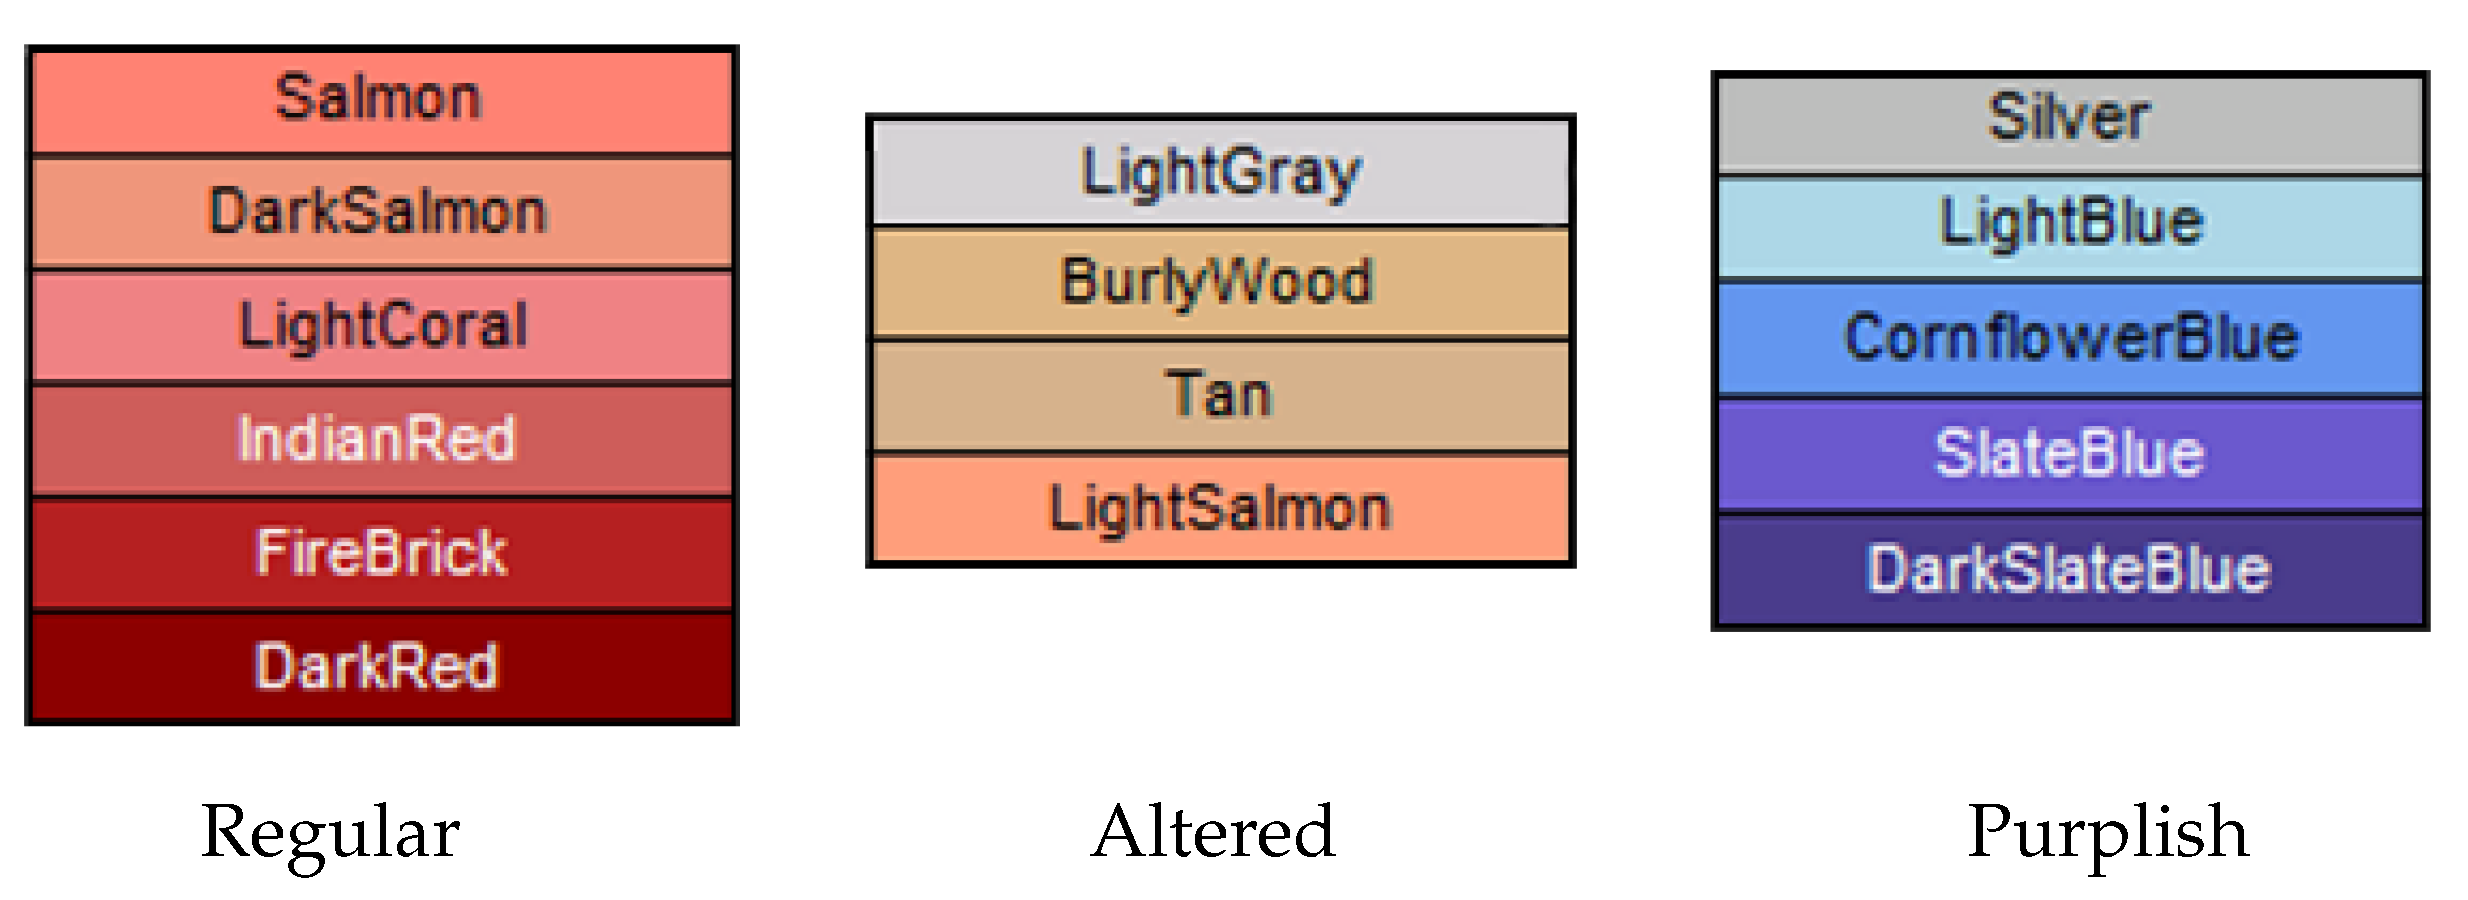
As an additional vital sign, we consider the color of lips that can be useful to assess a health condition. Normal people show lips with a pinkish nuance, while altered states or illness may provoke a modification of this color. In particular, lips appearing purplish or bluish can refer to cardiovascular or respiratory disorders. We perform automatic detection of the lips color by means of image processing techniques applied to a specific ROI extracted from the image of the patient’s face. The general pipeline shown in Figure 5 describes the steps to extract the color of lips. After face detection, we apply a mask (covering the landmarks from 49 to 68) on the face image, so that the ROI of the lips is detected and isolated. Then, we process the ROI to identify the dominant color and classify it as “regular”, “altered” or “purplish” (these three color categories were suggested by the physician). The K-Means clustering with is applied to perform color quantization and to detect the dominant color in the ROI. The result provided by the K-Means algorithm is a histogram containing the percentages of the three main colors expressed in RGB format. The RGB value of the dominant color is converted into a hexadecimal value that is subsequently associated with a label with the help of the library “” (http://chir.ag/projects/name-that-color/). After labeling, we classify the color of the lips as “regular”, “altered” or “purplish” using the classification scheme described in Figure 6.
2.3. Risk Assessment by Fuzzy Rules
The development of intelligent systems to support medical diagnosis is a difficult task because both the information and the reasoning used by clinicians for drawing conclusions about patients’ health are inherently uncertain and vague. Fuzzy logic is a powerful tool for representing and handling this uncertainty, leading to fuzzy systems that can support decisions in medical diagnosis. Fuzzy logic has been widely used for medical diagnosis due to its capacity to express, in a formal way, approximate concepts and reasoning, which strongly characterize the medical field [25,26,27,28,29,30,31,32,33,34,35,36,37,38]. Specifically, using fuzzy logic, the knowledge of the medical expert can be easily formalized in terms of linguistic fuzzy rules [39]. Each fuzzy rule is an IF-THEN statement involving linguistic variables. In our case, fuzzy rules are defined to support the diagnosis of cardiovascular disease by assessing a risk level according to the measured vital signs. Each rule has the form:
where the linguistic variables , , , represent respectively the measured vital signs, namely the heart rate, the breath rate, the oxygen saturation in blood and the color of lips, and the output variable RiskLevel represents the level of risk for cardiovarcular disease. The terms and B are the linguistic values related to the variables. Indeed, linguistic variables are variables whose values are not numbers but words or sentences in a natural or artificial language [40]. For example, the values of the linguistic variable are linguistic terms such as Bradycardia, Normal, and Tachycardia. Using linguistic terms rather than precise numbers, the knowledge of the doctor can be easily formalized and transferred into the decision-making system. Table 1 summarizes the input variables and the associated linguistic values. For the output variable RiskLevel, we consider four values, namely Low, Medium, High, and Very High. Table 2 reports some fuzzy rules defined with the help of a doctor.
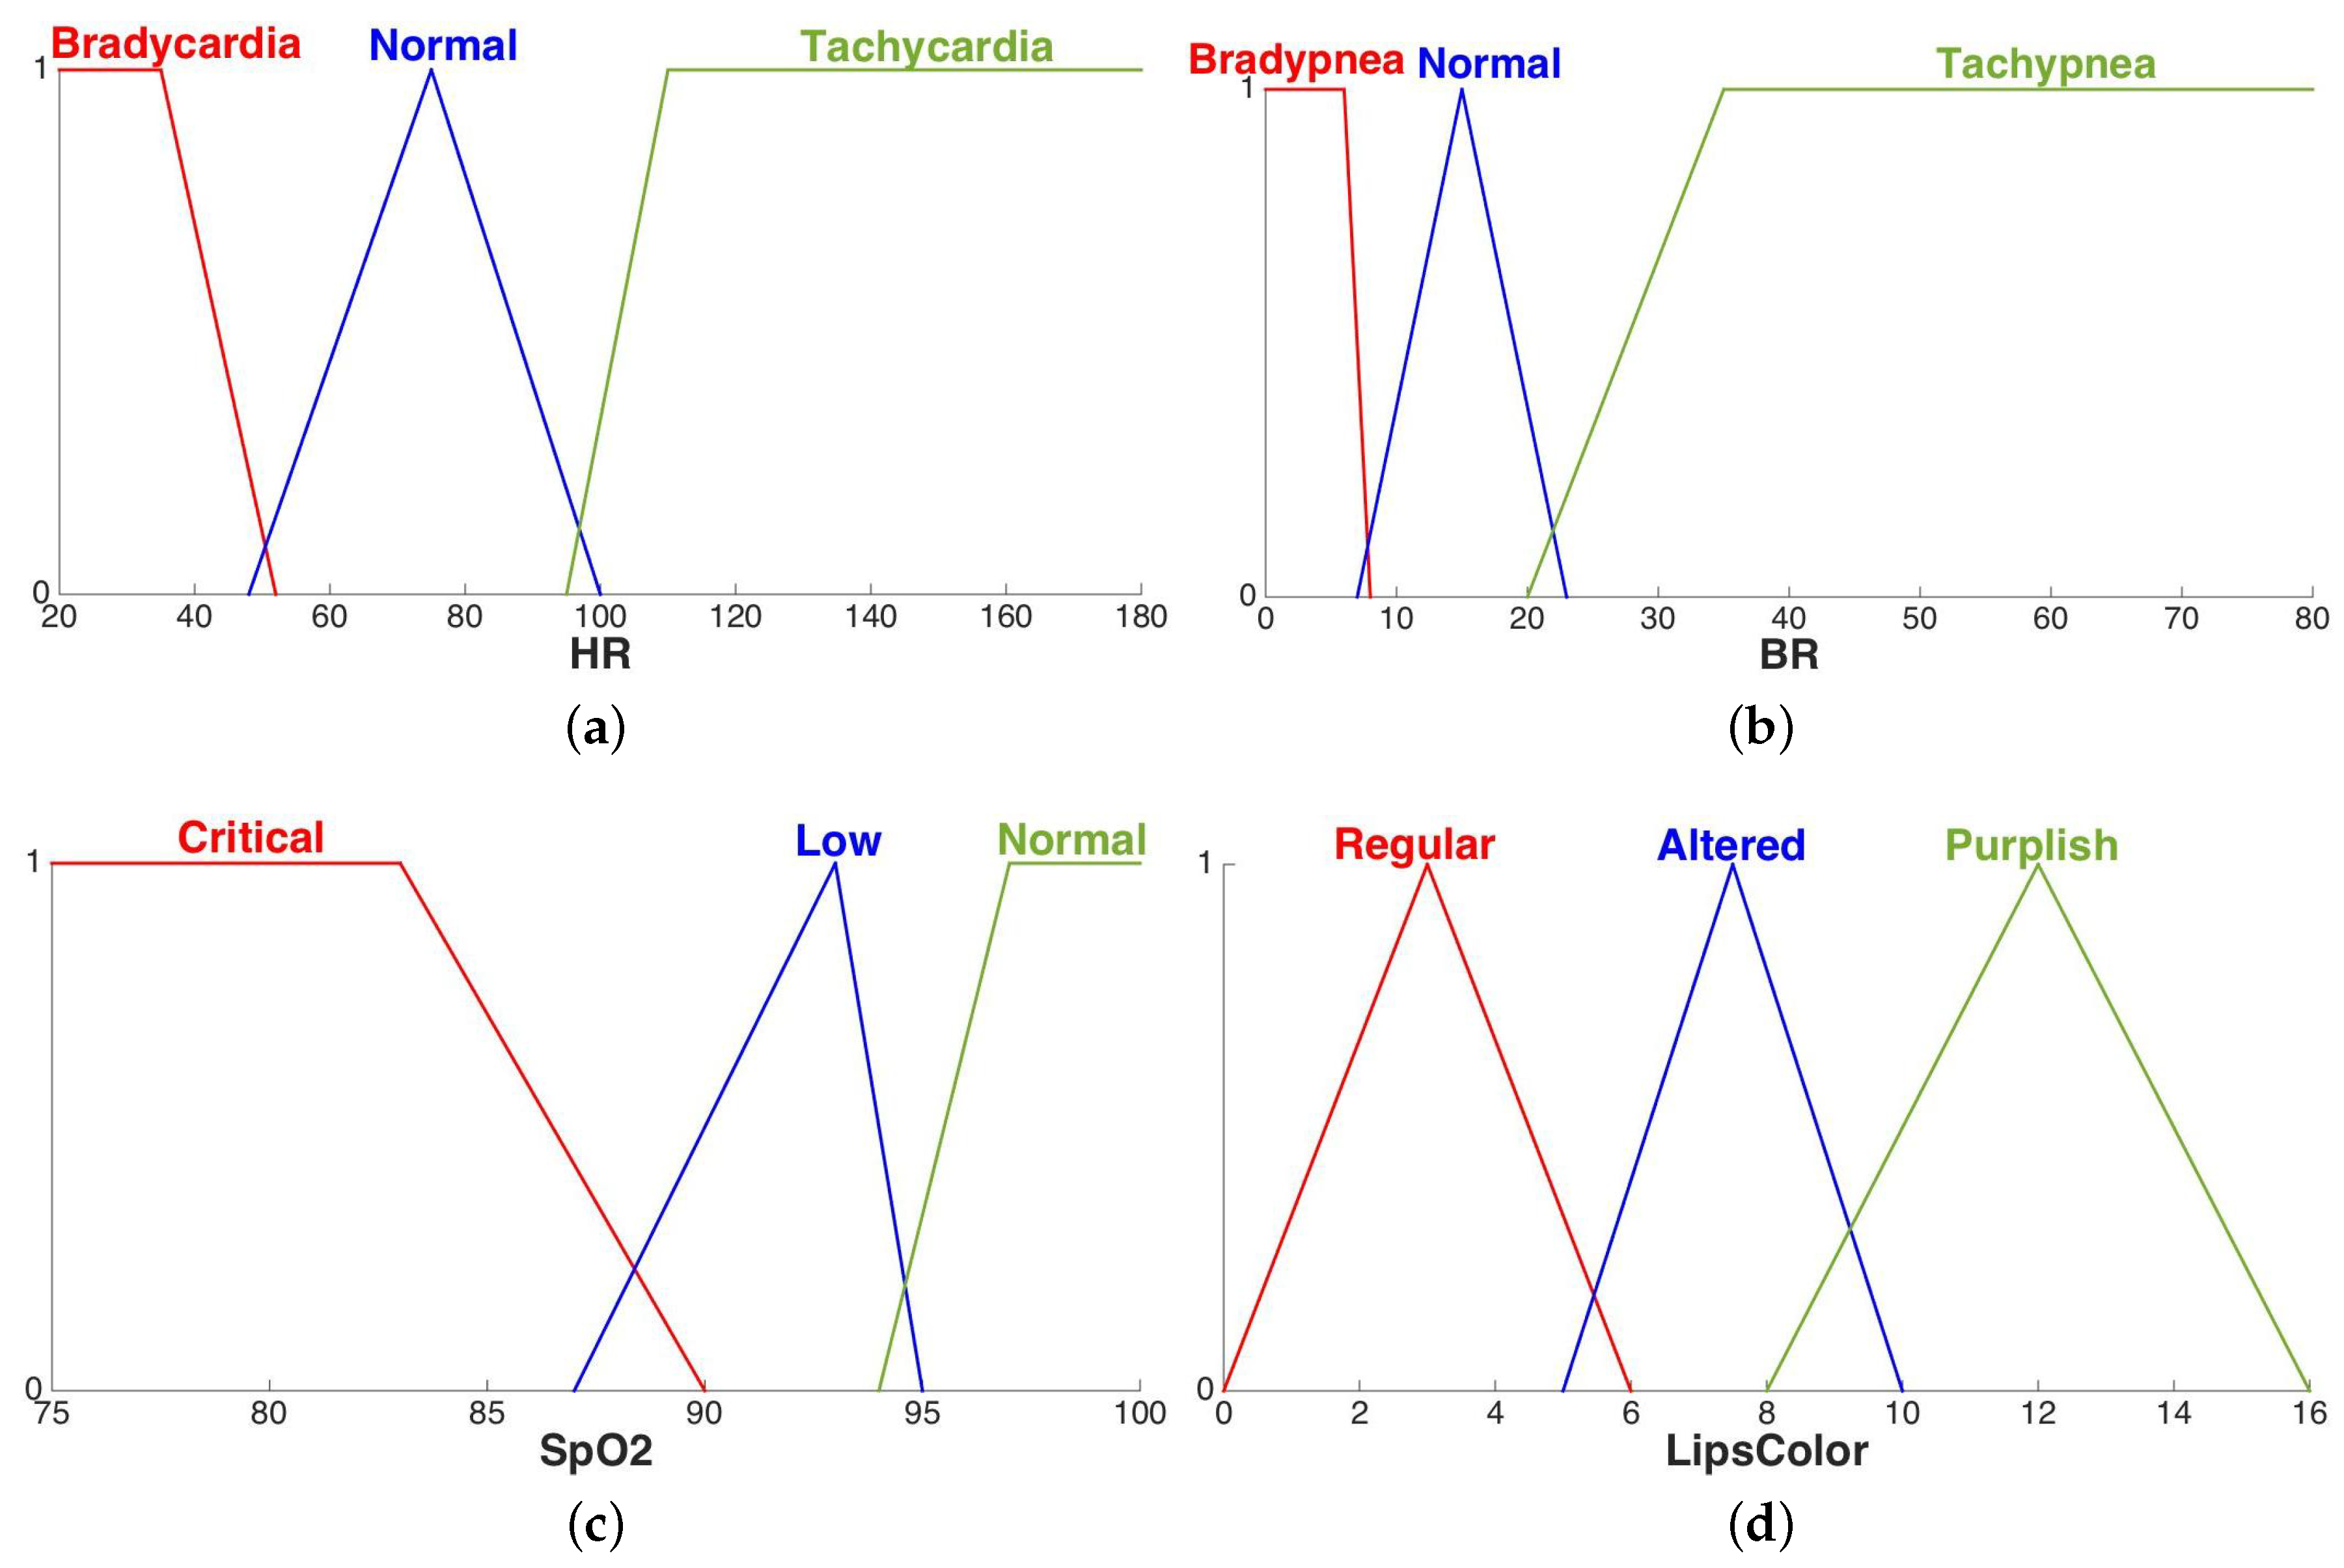
Linguistic terms used in fuzzy rules are described by fuzzy sets [41]. A fuzzy set is defined by a membership function which maps the variable domain in the interval . Figure 7 depicts the fuzzy sets defined for each input fuzzy variable in accordance with the clinician. For example, in Figure 7a, the linguistic variable HR can assume three values: Bradycardia, Normal, Tachycardia. The meaning of the Normal fuzzy set is the following: if the patient’s heart rate is then the membership value is , which means that the patient certainly has a normal heart rate. If the measured heart rate is in , then it can be considered normal with some degree in and the degree increases as the heart rate increases. On the contrary, if the heart rate measurement is in the interval , the membership degree to fuzzy set Normal decreases as the heart rate increases. Using fuzzy sets, we are able to translate the medical linguistic concepts in the numerical field, preserving the uncertainty typical of the human reasoning. With the help of a doctor, a fuzzy rule was defined for each combination of input and output fuzzy values, resulting in a total amount of 81 rules.
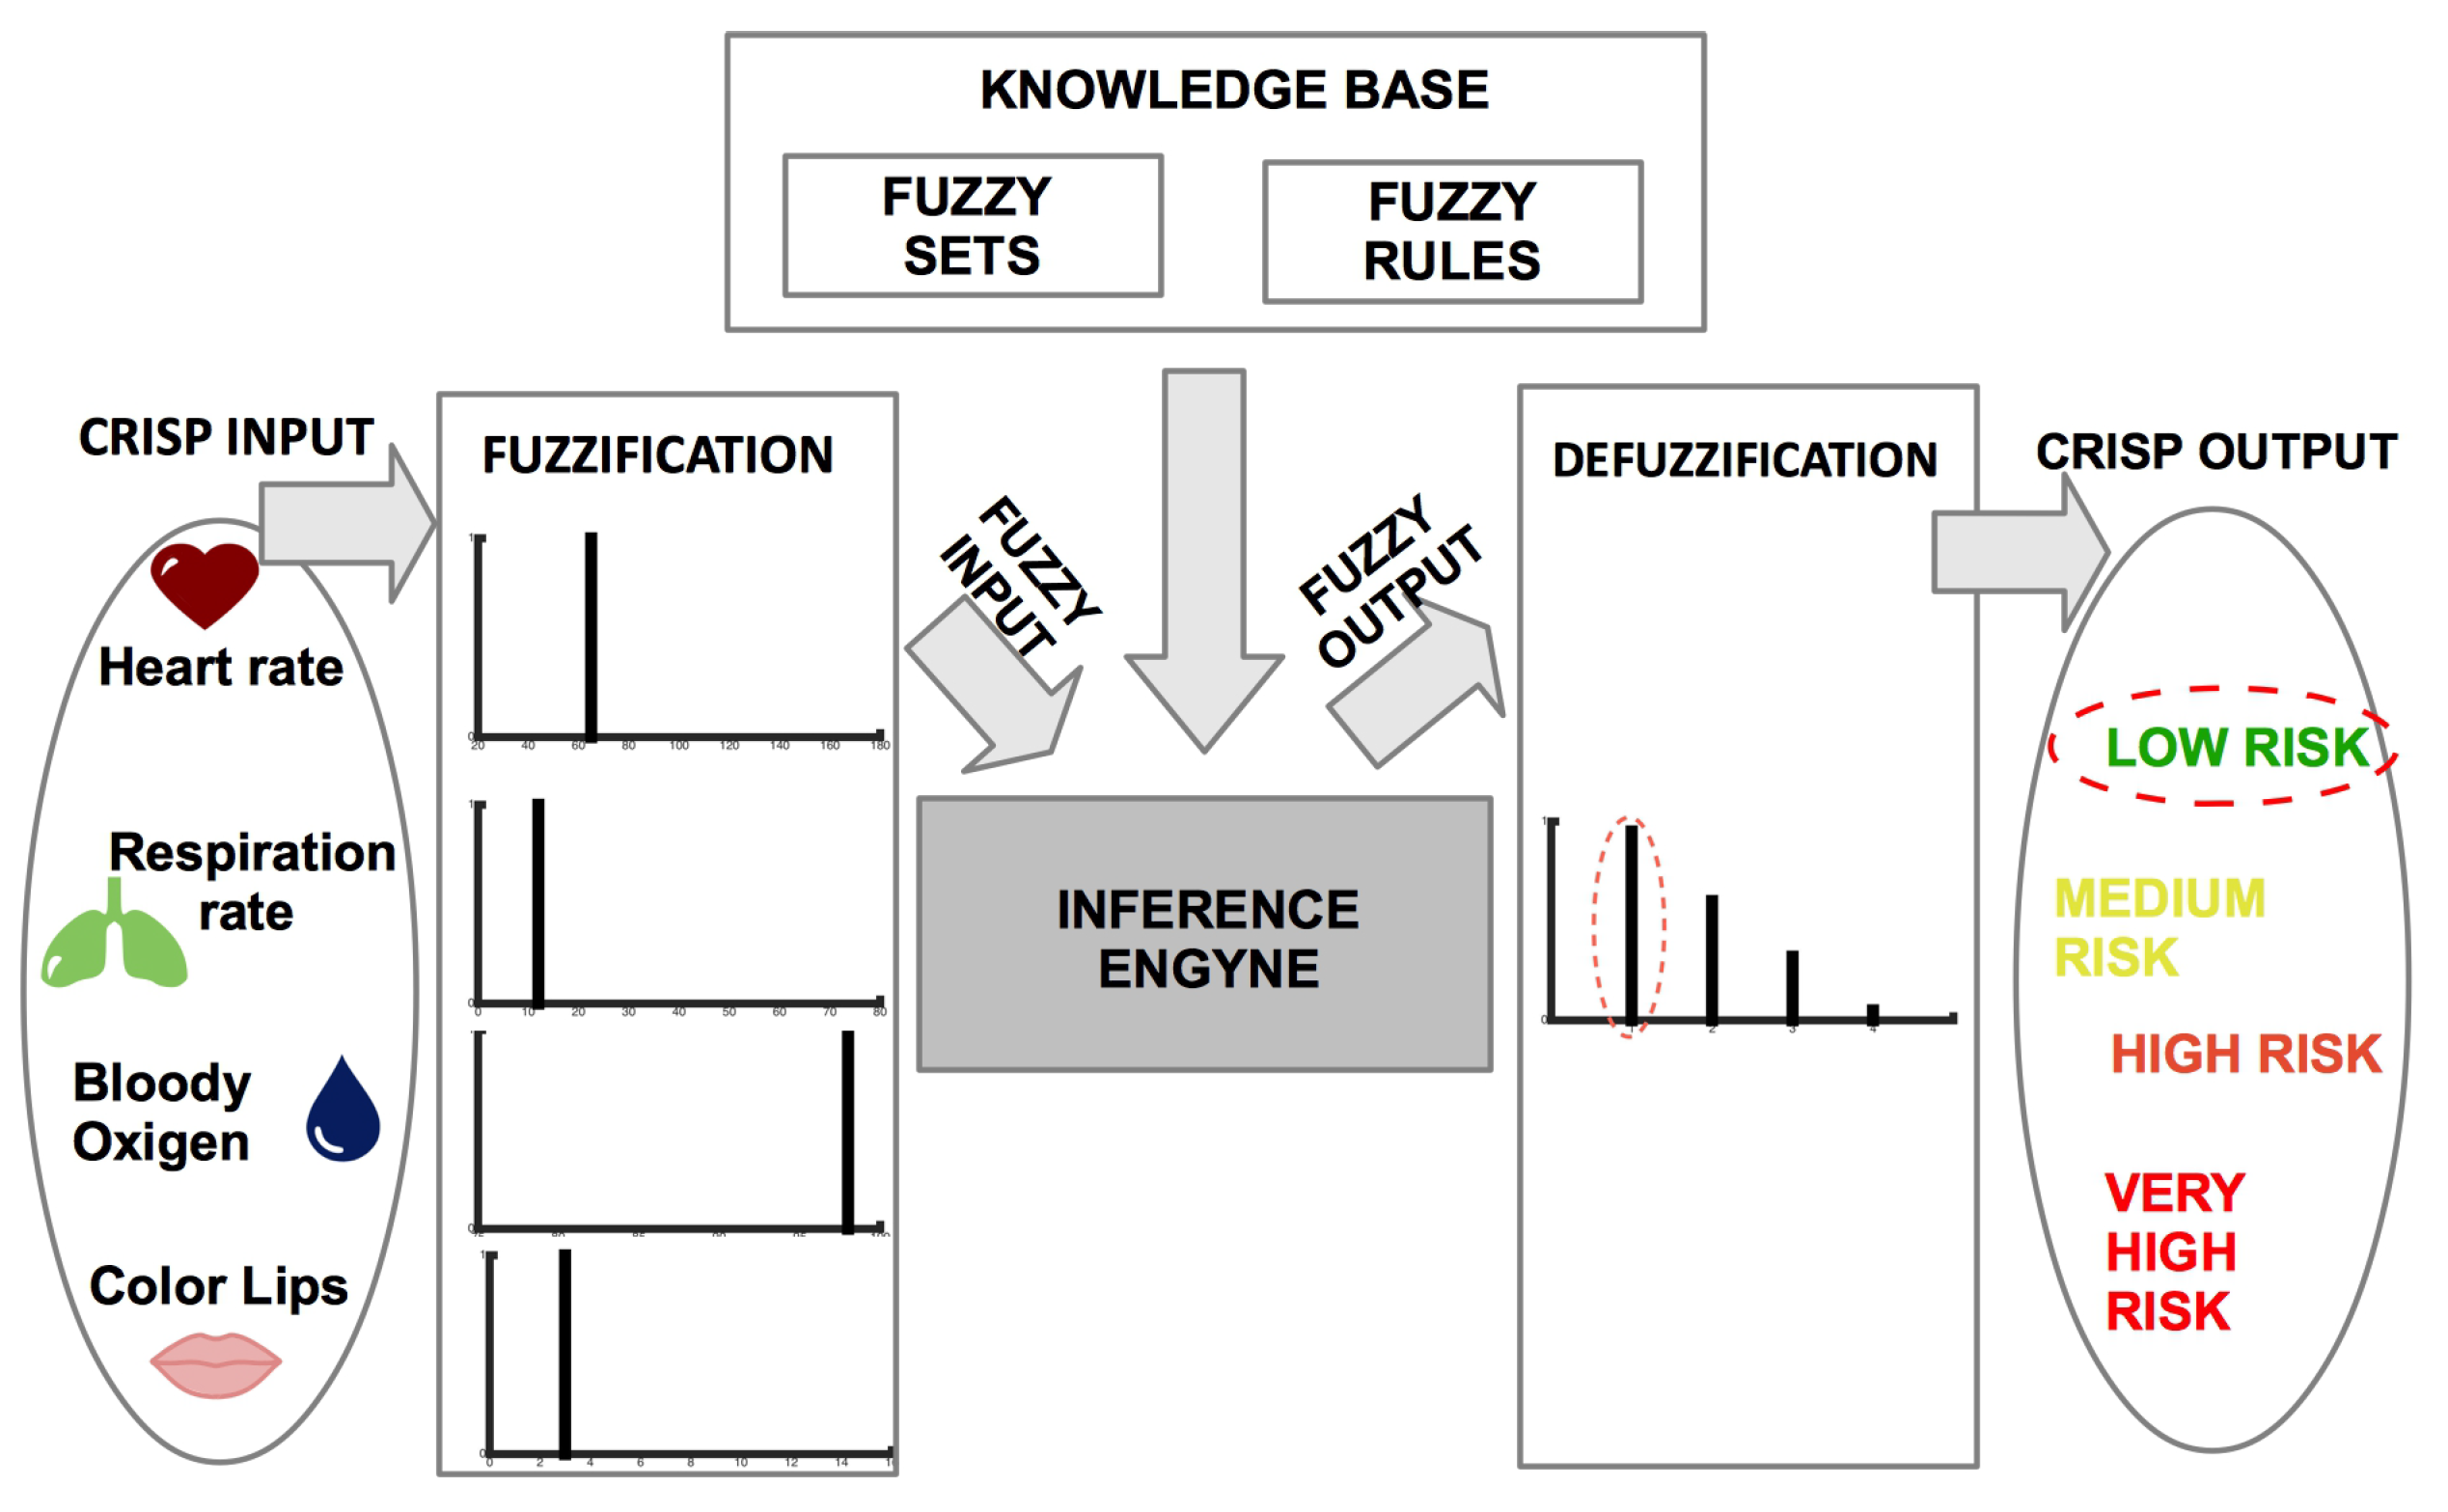
Fuzzy rules represent the knowledge base of a fuzzy inference system (FIS) that uses fuzzy set theory to infer outputs (in our case classes of risk) from inputs (vital signs measurements). The FIS is composed of four modules Fuzzification module, Inference engine, Knowledge base, Defuzzification module, as depicted in Figure 8. The vital signs measurements are expressed as crisp numbers, hence they need to be fuzzified (translated in fuzzy sets) to be computed by the fuzzy inference engine. Given the knowledge base, and the fuzzy input, the inference engine compares the input with the linguistic terms in the premise parts of the fuzzy rules, and combines the results of the rules that match with the input. The resulting fuzzy output is defuzzified to produce a crisp output that corresponds to the suggested level of cardiovascular risk. The FISDeT tool [42] was used to define the knowledge base and apply the fuzzy inference process.
3. Application and Results
The main application of the proposed mirror-based system is in the field of Personal Healthcare. It was designed as a smart device to be installed mainly in a home environment, especially in rooms where a mirror is typically placed (bathroom, living room, bedroom). A possible scenario in home environment is the following. Emma is a middle-age lady who suffers from hypertension and needs to monitor her vital parameters with regular frequency. Every morning, once woken up, she goes to the bathroom to carry out daily actions such as brushing her teeth or combing her hair. While making these actions, Emma looks at herself in the mirror to monitor her vital signs. Hence, she can check her health status just looking at herself in the mirror, with no need of additional devices. The possibility to check the personal health status through the simple gesture of looking at oneself in a mirror is especially useful and comfortable for elderly people who may have difficulty to auto-monitor their vital parameters through the use of the digital pulse oximeter or other contact devices. Another possible application of the smart mirror could be in public environments such as pharmacies that currently offer monitoring and prevention services such as weight control. Using the smart mirror, every customer entering in the pharmacy can easily check his health status with no need of contact devices.
To test the effectiveness of the proposed mirror-based system, we carried out two sessions of experiments. The first session was devoted to check the efficacy of our system in measuring vital signs as compared to a standard measurement device. The second session was aimed to evaluate the assessment of cardiovascular risk made by the fuzzy system as compared to the diagnosis made by a clinician.
3.1. Evaluation of Vital Parameters
To test the efficacy of vital sign measurement we carried out two experiments aimed to compare our contact-less device with a common pulse oximeter. In the first experiment we involved healthy people having different characteristics. A total of 25 participants (19 males, 6 females) with age ranging from 18 to 65 years and varying skin colors (Africans and Caucasians) were enrolled for this study. In the second experiment we considered old persons suffering from cardiovascular problems (hypertension, heart disease, …) and undergoing pharmacological treatment. This sample included 10 subjects (five females and five males) with age ranging from 66 to 96 years.
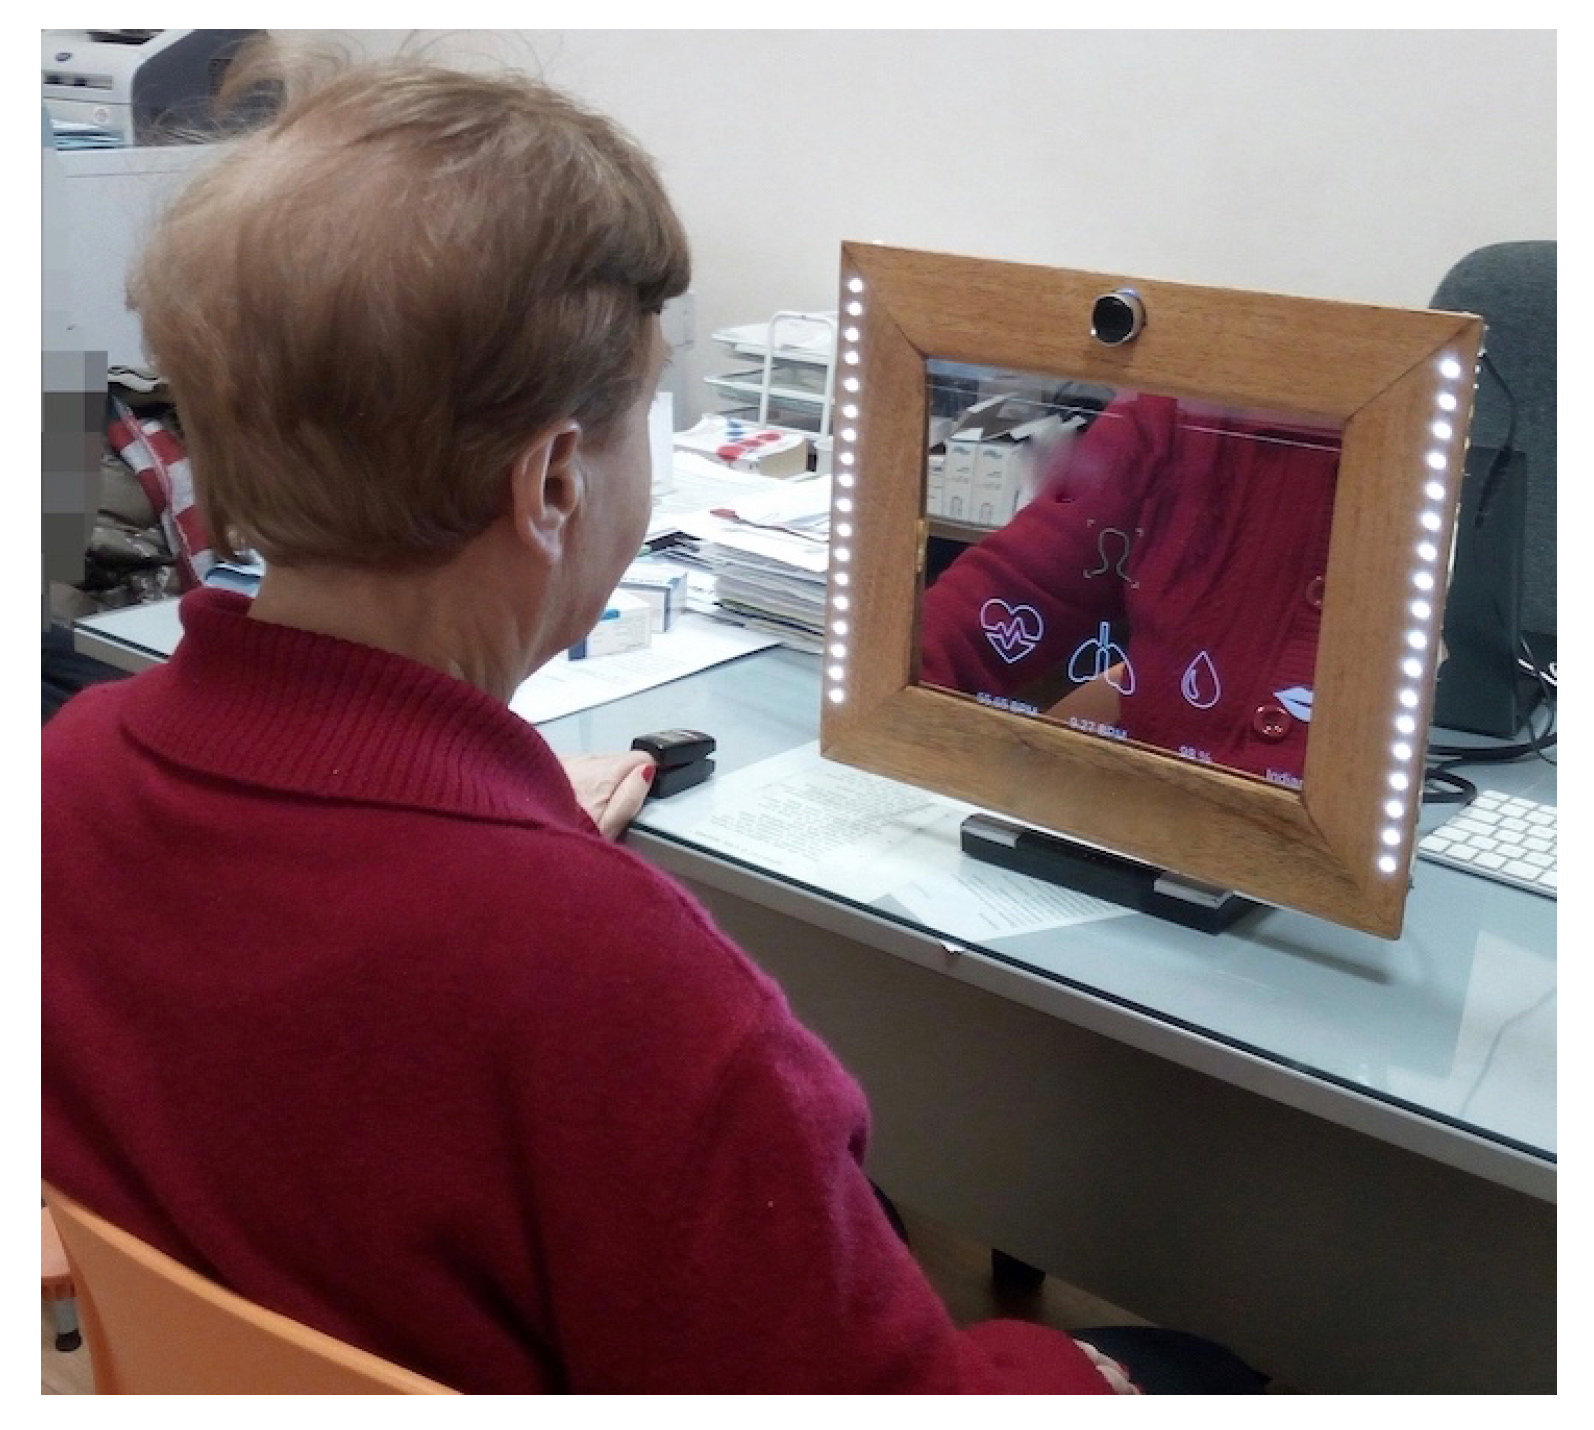
In each test, we used the mirror-based system to measure the heart rate and the blood oxygen saturation while the subject was sitting in front of the mirror for 1 min. Each subject was required to mirror herself keeping her head as still as possible, resting in state of spontaneous breathing. During the tests, each subject was asked to wear a Finger tip Pulse Oximeter in order to collect simultaneously baseline values of and to be compared with the values acquired through our mirror-based system. The experiments were conducted indoors and with a normal amount of sunlight as the only source of natural illumination. LEDs attached to the mirror frame integrated the light source. Figure 9 show the experimental setup. Participants were seated at a table in front of the mirror at a distance of approximately 50 cm from the integrated HD camera. The video frame acquisition phase had a duration of 60 s for each subject. During the first seconds of video acquisition, participants were asked to sit still and stare at the mirror.
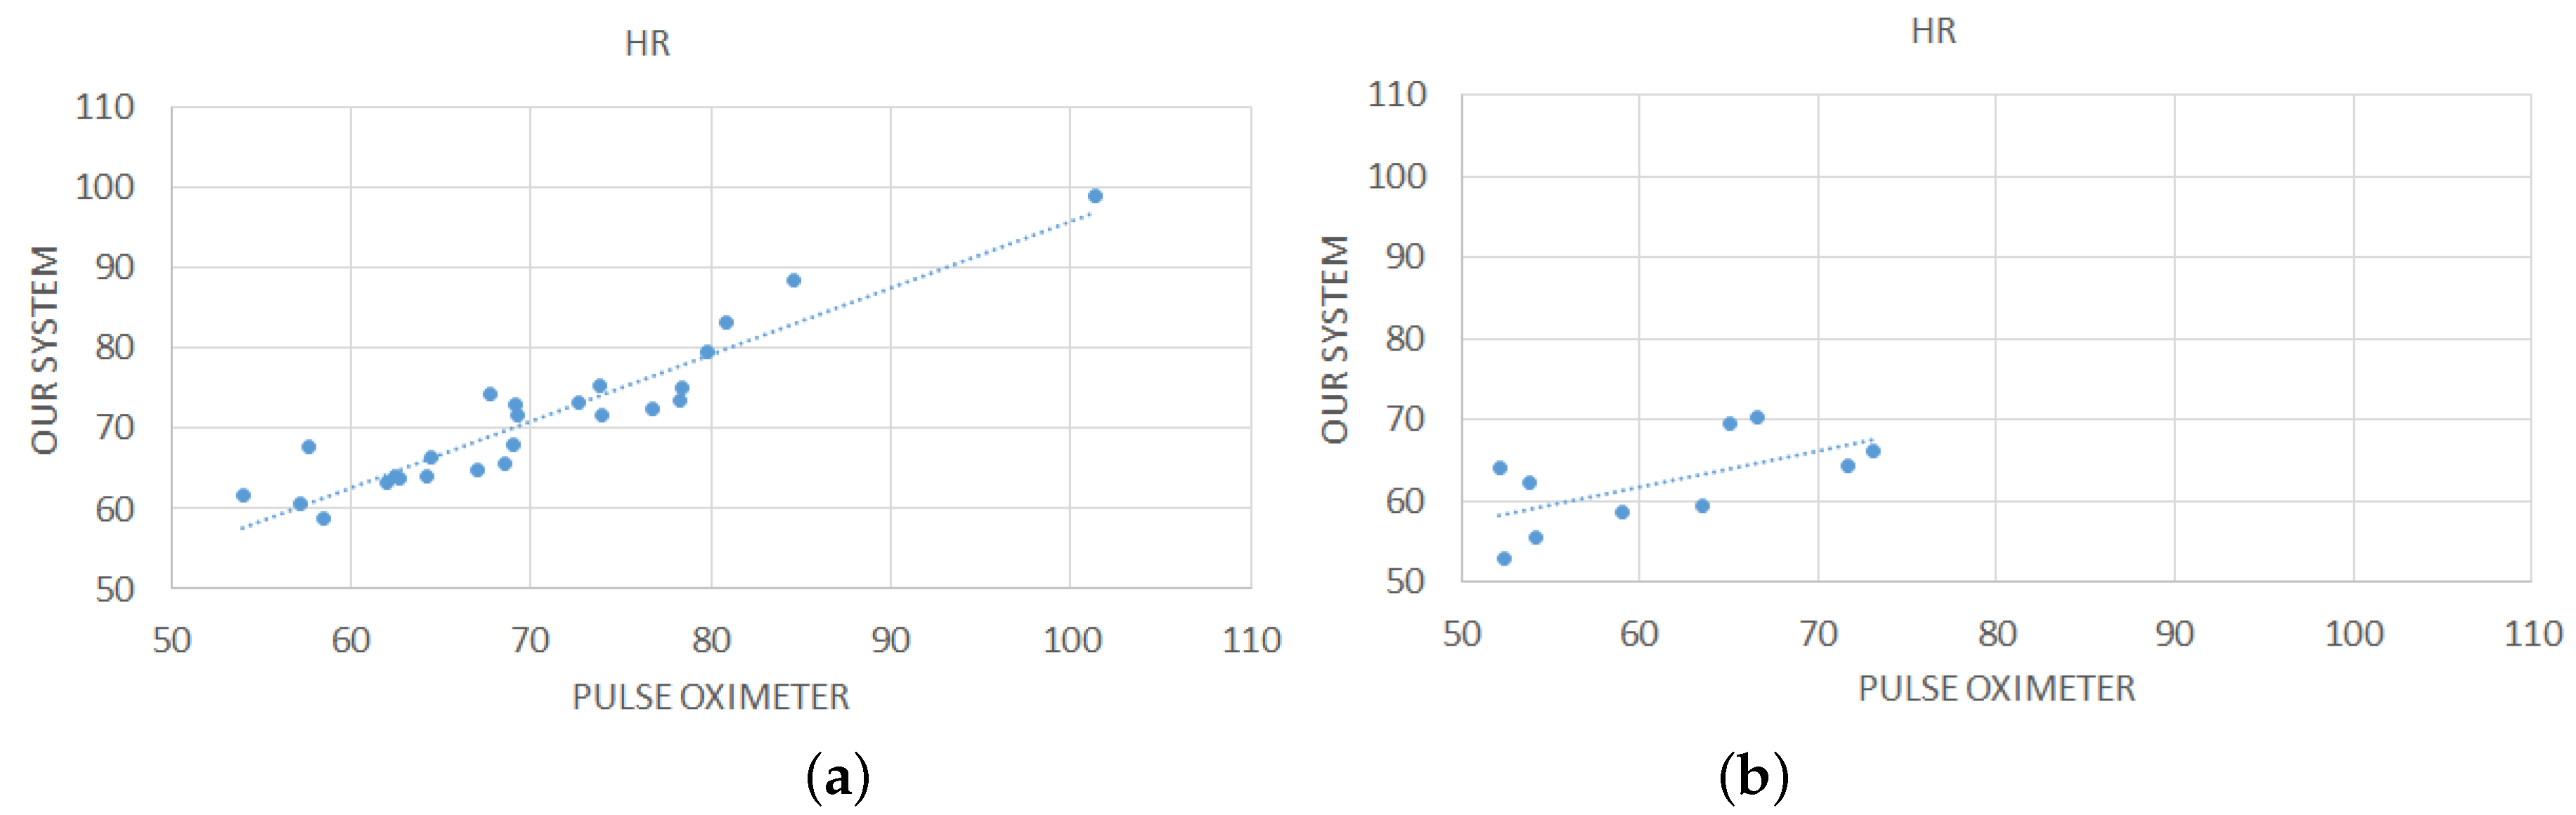
Figure 10 shows the obtained average values of detected by our mirror-based system in comparison with those detected by the pulse oximeter, for each test conducted; a linear trend line has been added for better understanding the graph. Table 3 shows the statistics computed on the difference between the pulse oximeter and our device. It can be seen that, in most cases, the measurements of our contact-less device are comparable to those of the pulse oximeter. Actually, in case of healthy people, a high correlation coefficient (0.94) was found between the measures made by our device and those made by the pulse oxymeter. However, it can be seen that for unhealthy people, there is some discrepancy between the values estimated by our system and the values detected by the pulse oximeter. Actually, a lower correlation coefficient (0.62) was obtained in this case. The causes of this discrepancy should be found in sudden and abrupt movements of the head. Indeed, some of the elderly people involved in the tests had neurological problems and therefore they had difficulty in remaining calm and still in front of the device. However, the average difference is always within 5 bpm which is an acceptable error margin according to the literature [12,43].
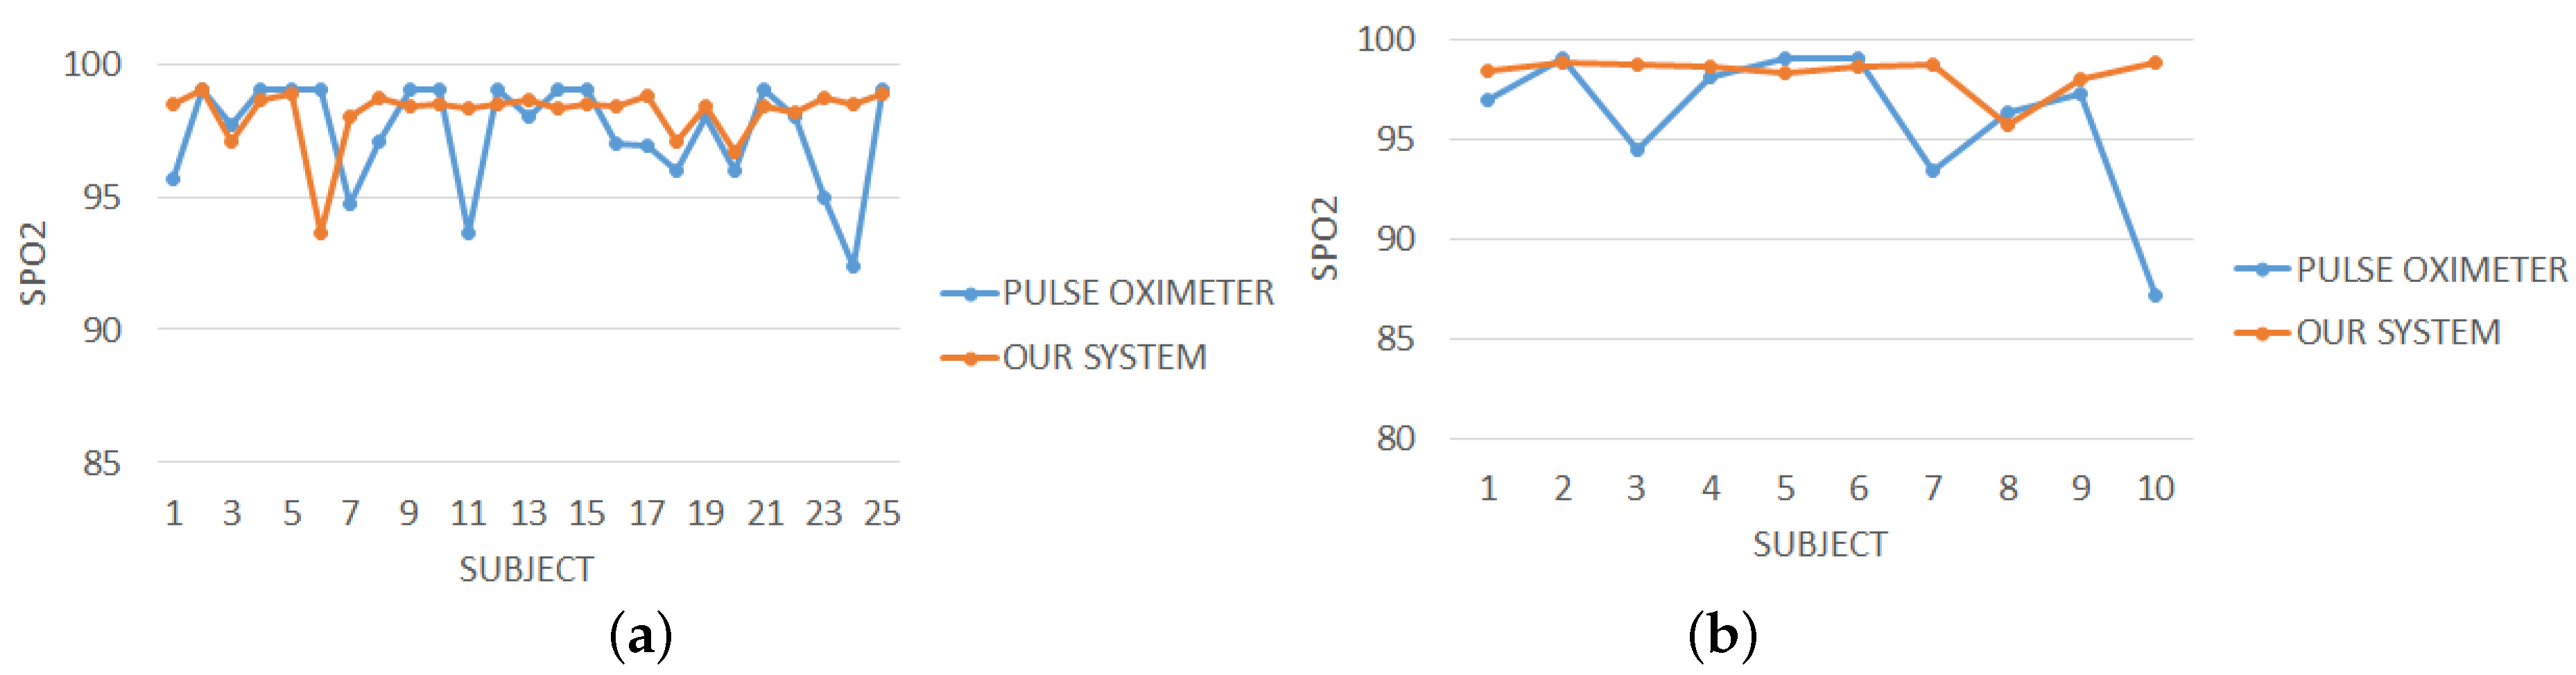
Figure 11 plots the average values of measured by our system compared to those of the pulse oximeter on both healthy people and people suffering from cardiovascular disease. It can be seen that there are differences between our device and the pulse oximeter not only for unhealthy people (due to abrupt head movements as explained above) but also for healthy people. These discrepancies were confirmed by a low value of the correlation coefficient computed on the measurements obtained by the two devices. A possible cause of wrong measurements made by our device is the use of Equation (1) to estimate the value of . This formula uses two parameters (A and B) that influence the approximation of . In the preliminary version of the system, we fixed these parameters using the values given by the literature [24]. We are confident that a fine-tuning of these parameters (that is currently under study) will improve the quality of the estimates.
The overall outcome of these preliminary experiments is that the proposed contact-less system can adequately compute the vital parameters of normal people and the measurements are not influenced by differences in terms of gender, age and other features (beard, mustache, glasses, foundation creams) of the testers. There were some problems in measuring the parameters for old people since some of the subjects had difficulty in keeping the head steady. Actually, one major limitation of the current prototypical version of our system is its high sensitivity to abrupt head movements. We are currently working to integrate a face tracker into the system in order to overcome this limitation.
3.2. Risk Assessment by Fuzzy Rules
The second session of experiments was aimed to test the effectiveness of the fuzzy rule-based system in simulating the decision of the expert.
A patient dataset was constructed by measuring and collecting the four vital signs (, , and color of lips) for 116 persons. Table 4a reports some samples from the dataset. In order to label the dataset, we involved a second doctor, different from the doctor responsible of building the fuzzy knowledge base. This was done to have a different expert opinion and make more reliable the validation process. For each patient, we asked the doctor to observe the measured vital signs and assign a risk label, on the basis of his knowledge and experience (Table 4b). This labeled dataset represents the ground truth to assess the correctness of the diagnosis results obtained by the developed FIS. As it can be seen from the statistics in Table 5, we obtained an unbalanced dataset, since the individuals who underwent the screening were mostly healthy persons. This is a common situation in medical problems.
For each subject in the patient dataset, we applied the inference of fuzzy rules in order to obtain a risk label (Low, Medium, High, or Very High). The inferred labels were compared to the labels provided by the human expert and the results were evaluated in terms of the following classification measures computed for each class label c:
- Accuracy, i.e., the ratio of correct discriminations w.r.t. class c:
- Positive Predictive Value, i.e., the ratio of correctly classified samples w.r.t. those identified as pertaining to class c:
- Negative Predictive Value, i.e., the ratio of correctly classified samples w.r.t. those identified as not pertaining to class c:
- True Positive Rate, i.e., the ratio of samples correctly classified as belonging to class c w.r.t. those actually belonging to class c:
- True Negative Rate, i.e., the ratio of samples correctly classified as not belonging to class c w.r.t. those actually not belonging to class c:
where TP, TN, FP and FN are true positive, true negative, false positive, and false negative, respectively. Table 6a reports the values of these measures evaluated for each class. It can be observed how the TBR and NPV values are generally greater than those of TPR and PPV. This means that the knowledge embedded into the FIS is more effective in determining the non-membership to each class than the sensitivity to each specific risk level. This could be related to the fact that the dataset was unbalanced while fuzzy rules were crafted for a more general setting.
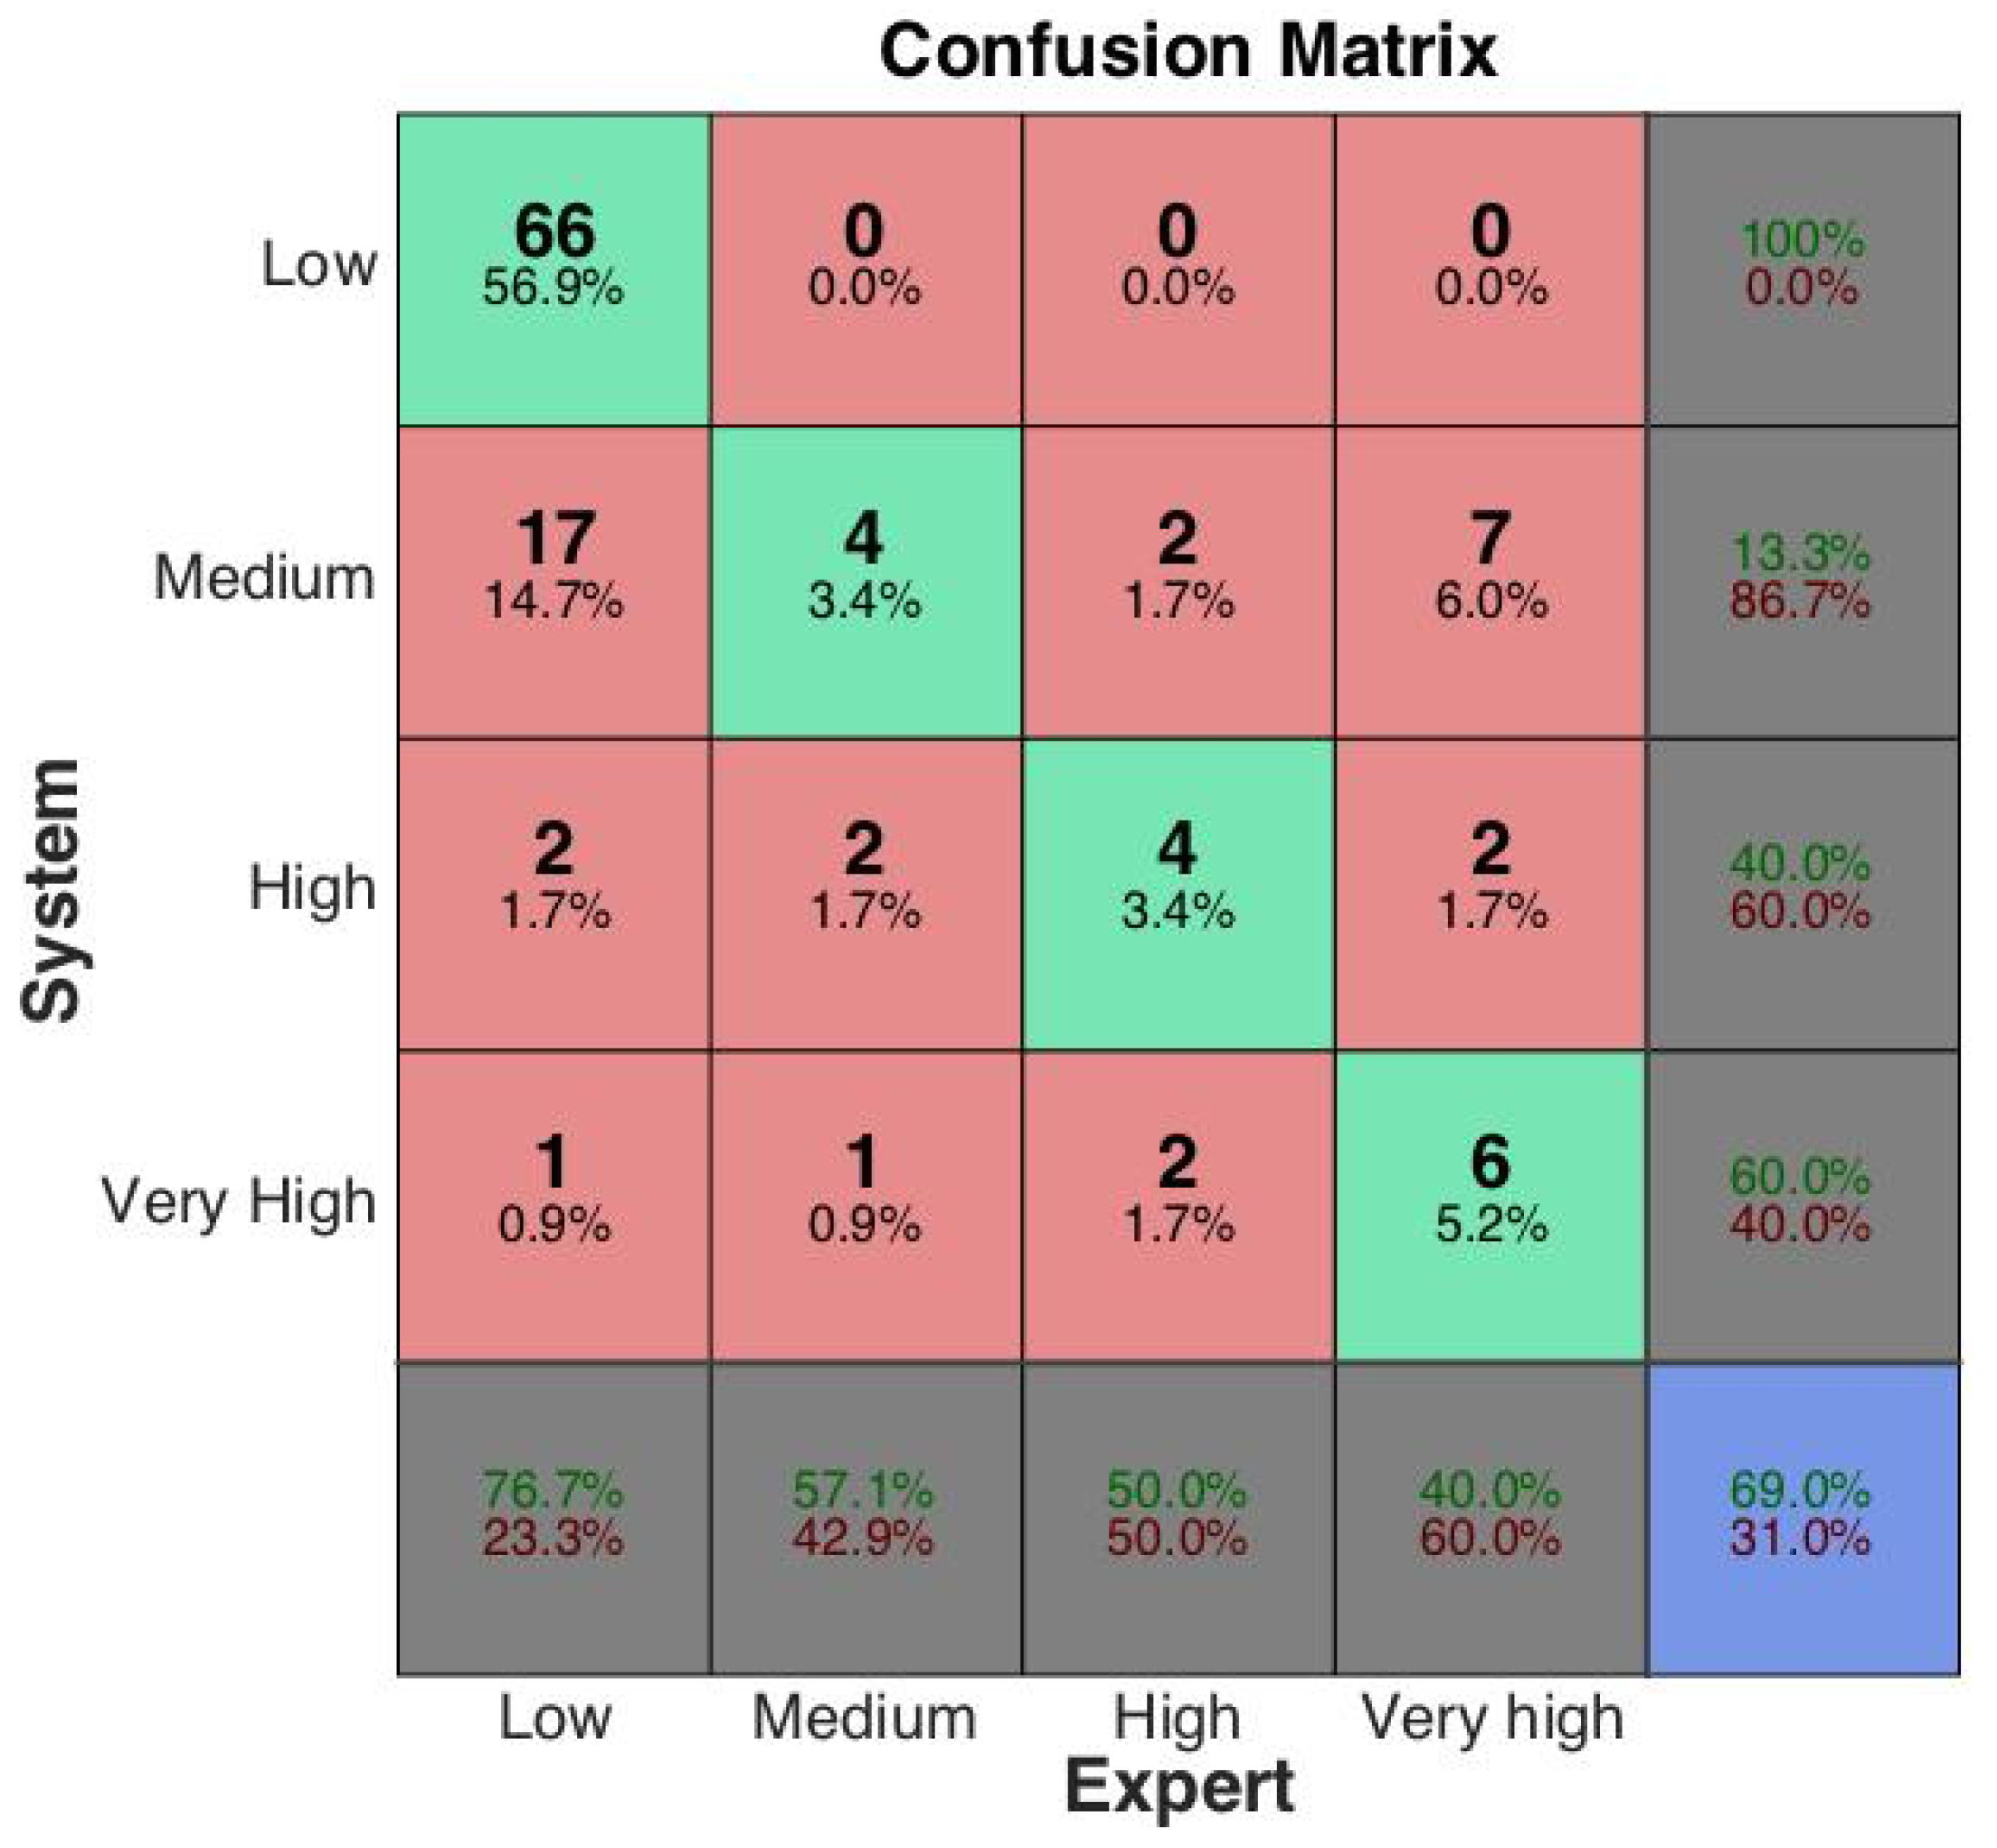
The obtained results can be further analyzed by considering the information conveyed by the overall confusion matrix depicted in Figure 12 where the classes are ranked from Low to Very High risk level. From the analysis of the confusion matrix, we can argue that only 66 out of 86 low risk samples have been correctly identified. However, almost every misclassified low risk sample has been associated with the most similar class (Medium). The same argument goes with the misclassification of medium risk samples (only one case has been shifted toward a very high risk) and high risk samples. Hence, most of misclassified samples are related to adjacent classes and, in most cases, the misclassifications produced by the fuzzy system represent an overestimation of the risk level. In medical contexts, this can be read as a problem with reduced harm, the opposite occurrence being regarded as the cause of much more serious consequences. Only the management of the Very High class is somewhat troublesome since 7 out of 15 cases have been incorrectly related to a medium risk level. This result is most likely caused by the imbalance of the dataset, which includes few cases of patients with different levels of cardiovascular illness. Conversely, fuzzy rules were crafted having in mind a more general setting where all the risk levels are covered. To better assess the classifier, more data of ill subjects should be collected. These additional data will be useful not only to better assess the classification results but also to refine the fuzzy rule base by applying suitable machine learning methods.
4. Conclusions
The development of non-invasive and low cost solutions for the monitoring of physiological parameters is one of the main areas of research in the field of biomedical engineering. The goal is to create solutions that are easy to use, accurate and applicable both at home and in clinics. Among the huge number of works emerging in this field, to our knowledge, our work is the first attempt to create a non-invasive contact-less solution that is able to simultaneously evaluate vital parameters and predict cardiovascular risk, based on real-time video processing and fuzzy inference rules. Moreover, to our knowledge, the idea of using a mirror-based device to make the monitoring system more inclusive and comfortable is completely new in the literature. We emphasize that the key features of the proposed solution are its inclusiveness and usability. Using such a system, a person can monitor vital signs at home in a very comfortable way, without requiring additional medical devices that are often invasive, cumbersome or even expensive. The proposed solution represents an innovative smart object that can be of valuable interest in the field of Personal Healthcare. It was intended to be used daily by people for regular personal monitoring of vital signs. For this reason, it was designed to be a device to stay on a fixed support or to be hung on a wall. It was not designed as a mobile device for Pervasive Healthcare, i.e., for constant real-time monitoring made by a person at any time and in any place. Nevertheless, some future developments of our solution can be foreseen to reduce the size of the device so that a person can easily carry it everywhere. For example, the proposed solution could be exported to mobile devices such as smart phones or tablets in the form of an application in order to further increase scalability and applicability in several domains of interest.
Despite the proposed system is a proof-of-concept of a methodology that is still under refinement, yet preliminary results showed the efficacy of the mirror-based device in measuring vital signs and the reliability of its intelligent component based on fuzzy rules in simulating the decision of the medical expert. Future works are devoted to refine the underlying methods by acquiring more data, especially of ill people, and integrating them with more information such as demographic features (age and sex) and information coming from the patient’s history and the family history. We plan to continue the study with larger scale tests on patients affected by cardiovascular diseases by using machine learning methods in order to automatically learn fuzzy rules from data.
Author Contributions
Conceptualization, V.P., G.Z. and G.C. (Giovanna Castellano); Formal Analysis, V.P. and G.Z.; Investigation, V.P., G.Z. and G.C. (Gabriella Casalino); Methodology, G.C. (Giovanna Castellano), V.P. and G.Z.; Software, V.P. and G.Z.; Supervision, G.C. (Giovanna Castellano); Validation, V.P. and G.Z.; Writing—Original Draft, G.C. (Gabriella Casalino) and G.C. (Giovanna Castellano); Writing—Review and Editing, G.C. (Gabriella Casalino), G.C. (Giovanna Castellano), V.P. and G.Z.
Funding
This research received no external funding.
Acknowledgments
The authors are thankful to Ilaria Engaddi from “Istituti Milanesi Martinitt e Stelline e Pio Albergo Trivulzio” (Milan, Italy) for providing her knowledge and expertise useful to define the fuzzy rule base.
Conflicts of Interest
The authors declare no conflict of interest.
References
- Cook, S.; Togni, M.; Schaub, M.C.; Wenaweser, P.; Hess, O.M. High heart rate: A cardiovascular risk factor? Eur. Heart J. 2006, 27, 2387–2393. [Google Scholar] [CrossRef] [PubMed]
- Pavlidis, I.; Dowdall, J.; Sun, N.; Puri, C.; Fei, J.; Garbey, M. Interacting with human physiology. Comput. Vis. Image Understand. 2007, 108, 150–170. [Google Scholar] [CrossRef]
- Allen, J. Photoplethysmography and its application in clinical physiological measurement. Physiol. Meas. 2007, 28, R1. [Google Scholar] [CrossRef] [PubMed]
- Wieringa, F.P.; Mastik, F.; van der Steen, A.F. Contactless multiple wavelength photoplethysmographic imaging: A first step toward “SpO2 camera” technology. Ann. Biomed. Eng. 2005, 33, 1034–1041. [Google Scholar] [CrossRef] [PubMed]
- Humphreys, K.; Ward, T.; Markham, C. Noncontact simultaneous dual wavelength photoplethysmography: A further step toward noncontact pulse oximetry. Rev. Sci. Instrum. 2007, 78, 044304. [Google Scholar] [CrossRef] [PubMed] [Green Version]
- Takano, C.; Ohta, Y. Heart rate measurement based on a time-lapse image. Med. Eng. Phys. 2007, 29, 853–857. [Google Scholar] [CrossRef]
- Zheng, J.; Hu, S.; Chouliaras, V.; Summers, R. Feasibility of imaging photoplethysmography. In Proceedings of the International Conference on BioMedical Engineering and Informatics (BMEI 2008), Sanya, China, 27–30 May 2008; Volume 2, pp. 72–75. [Google Scholar]
- Verkruysse, W.; Svaasand, L.O.; Nelson, J.S. Remote plethysmographic imaging using ambient light. Opt. Express 2008, 16, 21434–21445. [Google Scholar] [CrossRef]
- Garbey, M.; Sun, N.; Merla, A.; Pavlidis, I. Contact-free measurement of cardiac pulse based on the analysis of thermal imagery. IEEE Trans. Biomed. Eng. 2007, 54, 1418–1426. [Google Scholar] [CrossRef]
- Rouast, P.V.; Adam, M.T.; Chiong, R.; Cornforth, D.; Lux, E. Remote heart rate measurement using low-cost RGB face video: A technical literature review. Front. Comput. Sci. 2016, 1–15. [Google Scholar] [CrossRef]
- Hassan, M.; Malik, A.S.; Fofi, D.; Saad, N.; Karasfi, B.; Ali, Y.S.; Meriaudeau, F. Heart rate estimation using facial video: A review. Biomed. Signal Process. Control 2017, 38, 346–360. [Google Scholar] [CrossRef]
- Poh, M.Z.; McDuff, D.J.; Picard, R.W. Non-contact, automated cardiac pulse measurements using video imaging and blind source separation. Opt. Express 2010, 18, 10762–10774. [Google Scholar] [CrossRef]
- Bosi, I.; Cogerino, C.; Bazzani, M. Real-time monitoring of heart rate by processing of Microsoft Kinect™ 2.0 generated streams. In Proceedings of the International Multidisciplinary Conference on Computer and Energy Science (SpliTech), Split, Croatia, 13–15 July 2016; pp. 1–6. [Google Scholar]
- Zhang, Q.; Wu, Q.; Zhou, Y.; Wu, X.; Ou, Y.; Zhou, H. Webcam-based, non-contact, real-time measurement for the physiological parameters of drivers. Measurement 2017, 100, 311–321. [Google Scholar] [CrossRef]
- Kwon, S.; Kim, H.; Park, K.S. Validation of heart rate extraction using video imaging on a built-in camera system of a smartphone. In Proceedings of the Annual International Conference of the IEEE on Engineering in Medicine and Biology Society (EMBC2012), San Diego, CA, USA, 28 August–1 September 2012; pp. 2174–2177. [Google Scholar]
- Lewandowska, M.; Rumiński, J.; Kocejko, T.; Nowak, J. Measuring pulse rate with a webcam—A non-contact method for evaluating cardiac activity. In Proceedings of the Federated Conference on Computer Science and Information Systems (FedCSIS2011), Szczecin, Poland, 18–21 September 2011; pp. 405–410. [Google Scholar]
- Scully, C.G.; Lee, J.; Meyer, J.; Gorbach, A.M.; Granquist-Fraser, D.; Mendelson, Y.; Chon, K.H. Physiological parameter monitoring from optical recordings with a mobile phone. IEEE Trans. Biomed. Eng. 2012, 59, 303–306. [Google Scholar] [CrossRef] [PubMed]
- Dalal, N.; Triggs, B. Histograms of oriented gradients for human detection. In Proceedings of the IEEE Computer Society Conference on Computer Vision and Pattern Recognition (CVPR 2005), San Diego, CA, USA, 20–25 June 2005; Volume 1, pp. 886–893. [Google Scholar]
- Kazemi, V.; Sullivan, J. One millisecond face alignment with an ensemble of regression trees. In Proceedings of the IEEE Conference on Computer Vision and Pattern Recognition, Columbus, OH, USA, 23–28 June 2014; pp. 1867–1874. [Google Scholar]
- Challoner, A. Photoelectric plethysmography for estimating cutaneous blood flow. Non-Invasive Physiol. Meas. 1979, 1, 125–151. [Google Scholar]
- Tarvainen, M.P.; Ranta-Aho, P.O.; Karjalainen, P.A. An advanced detrending method with application to HRV analysis. IEEE Trans. Biomed. Eng. 2002, 49, 172–175. [Google Scholar] [CrossRef] [PubMed]
- Casalino, G.; Del Buono, N.; Mencar, C. Subtractive Initialization of Nonnegative Matrix Factorizations for Document Clustering. In Lecture Notes in Computer Science, Proceedings of the Fuzzy Logic and Applications, Trani, Italy, 29–31 August 2011; Fanelli, A., Pedrycz, W., Petrosino, A., Eds.; Springer: Berlin/Heidelberg, Germany, 2011; Volume 6857, pp. 188–195. [Google Scholar]
- Casalino, G.; Del Buono, N.; Mencar, C. Part-based data analysis with masked non-negative matrix factorization. In Lecture Notes in Computer Science, Proceedings of the Computational Science and Its Applications, Guimarães, Portugal, 30 June–3 July 2014; Springer: Cham, Switzerland, 2014; Volume 8584, pp. 440–454. [Google Scholar]
- Kong, L.; Zhao, Y.; Dong, L.; Jian, Y.; Jin, X.; Li, B.; Feng, Y.; Liu, M.; Liu, X.; Wu, H. Non-contact detection of oxygen saturation based on visible light imaging device using ambient light. Opt. Express 2013, 21, 17464–17471. [Google Scholar] [CrossRef]
- Singh, S.; Kumar, A.; Panneerselvam, K.; Vennila, J.J. Diagnosis of arthritis through fuzzy inference system. J. Med. Syst. 2012, 36, 1459–1468. [Google Scholar] [CrossRef]
- Efosa, I.; Akwukwuma, V. Knowledge-based fuzzy inference system for sepsis diagnosis. Int. J. Comput. Sci. Inf. Technol. IJCSITY 2013, 1, 1–7. [Google Scholar] [CrossRef]
- Sabri, N.; Aljunid, S.; Salim, M.; Badlishah, R.; Kamaruddin, R.; Malek, M.A. Fuzzy Inference System: Short Review and Design. Int. Rev. Autom. Control 2013, 6, 441–449. [Google Scholar]
- Phuong, N.H.; Kreinovich, V. Fuzzy logic and its applications in medicine. Int. J. Med. Inform. 2001, 62, 165–173. [Google Scholar] [CrossRef] [Green Version]
- Tyagi, P.K.; Gupta, N.K.; Gupta, S. Diagnosis of Pulmonary Tuberculosis using fuzzy Inference System. In Proceedings of the Second International Innovative Applications of Computational Intelligence on Power, Energy and Controls with their Impact on Humanity (CIPECH2016), Ghaziabad, India, 18–19 November 2016; pp. 3–7. [Google Scholar]
- Thakur, S.; Raw, S.N.; Sharma, R. Design of a fuzzy model for thalassemia disease diagnosis: Using mamdani type fuzzy inference system (FIS). Int. J. Pharm. Pharm. Sci. 2016, 8, 356–361. [Google Scholar]
- Paramita, A.; Mustika, F.A. Diagnosis Of the Diabetes Mellitus disease with Fuzzy Inference System Mamdani. J. Math. 2017, 1, 126–133. [Google Scholar]
- Rana, M.; Sedamkar, R. Design of Expert System for Medical Diagnosis Using Fuzzy Logic. Int. J. Sci. Eng. Res. 2013, 4, 2914–2921. [Google Scholar]
- Walia, N.; Singh, H.; Tiwari, S.K.; Sharma, A. A decision support system for tuberculosis diagnosability. Int. J. Soft Comput. 2015, 6. [Google Scholar] [CrossRef]
- Khanale, P.; Ambilwade, R. A fuzzy inference system for diagnosis of hypothyroidism. J. Artif. Intell. 2011, 4, 45–54. [Google Scholar] [CrossRef]
- De Medeiros, I.B.; Machado, M.A.S.; Damasceno, W.J.; Caldeira, A.M.; dos Santos, R.C.; da Silva Filho, J.B. A Fuzzy Inference System to Support Medical Diagnosis in Real Time. Procedia Comput. Sci. 2017, 122, 167–173. [Google Scholar] [CrossRef]
- Dagar, P.; Jatain, A.; Gaur, D. Medical diagnosis system using fuzzy logic toolbox. In Proceedings of the 2015 International Conference on Computing, Communication & Automation (ICCCA2015), Noida, India, 15–16 May 2015; pp. 193–197. [Google Scholar]
- Adlassnig, K.P. Fuzzy set theory in medical diagnosis. IEEE Trans. Syst. Man Cybern. 1986, 16, 260–265. [Google Scholar] [CrossRef]
- Alonso, J.; Castiello, C.; Lucarelli, M.; Mencar, C. Modeling interpretable fuzzy rule-based classifiers for medical decision support. In Data Mining: Concepts, Methodologies, Tools, and Applications; IGI Global: Hershey, PA, USA, 2013; pp. 1064–1081. [Google Scholar]
- Zadeh, L. Fuzzy logic and soft computing: Issues, contentions and perspectives. Proc. IIZUKA 1994, 94, 1–2. [Google Scholar]
- Zadeh, L.A. The concept of a linguistic variable and its application to approximate reasoning—I. Inf. Sci. 1975, 8, 199–249. [Google Scholar] [CrossRef]
- Zadeh, L.A. Fuzzy sets. Inf. Control 1965, 8, 338–353. [Google Scholar] [CrossRef] [Green Version]
- Castellano, G.; Castiello, C.; Pasquadibisceglie, V.; Zaza, G. FISDeT: Fuzzy Inference System Development Tool. Int. J. Comput. Intell. Syst. 2017, 10, 13–22. [Google Scholar] [CrossRef]
- Lam, A.; Kuno, Y. Robust heart rate measurement from video using select random patches. In Proceedings of the IEEE International Conference on Computer Vision, Santiago, Chile, 7–13 December 2015; pp. 3640–3648. [Google Scholar]
Figure 1.
Hardware architecture.

Figure 2.
Software architecture.

Figure 3.
Pipeline to measure heart rate, breath rate and blood oxygen saturation.

Figure 4.
Computation of the bounding box including (A) the face and (B) the forehead.

Figure 5.
Pipeline to detect the color of lips.

Figure 6.
Categories for the color of lips.

Figure 7.
Fuzzy sets of the linguistic variables related to the vital signs: heart rate (a), breath rate (b), oxygen saturation in blood (c), color of lips (d).
Figure 7.
Fuzzy sets of the linguistic variables related to the vital signs: heart rate (a), breath rate (b), oxygen saturation in blood (c), color of lips (d).

Figure 8.
Inference process of the developed FIS.

Figure 9.
Experimental set-up.

Figure 10.
Comparison between measurements computed by our contact-less system and the pulse oximeter for the 25 healthy subjects (a) and for the 10 subjects suffering from cardiovascular disease (b).
Figure 10.
Comparison between measurements computed by our contact-less system and the pulse oximeter for the 25 healthy subjects (a) and for the 10 subjects suffering from cardiovascular disease (b).

Figure 11.
Comparison between measurements computed by our contact-less system and the pulse oximeter for all the 25 healthy subjects (a) and for all the 10 subjects suffering from cardiovascular disease (b).
Figure 11.
Comparison between measurements computed by our contact-less system and the pulse oximeter for all the 25 healthy subjects (a) and for all the 10 subjects suffering from cardiovascular disease (b).

Figure 12.
Confusion matrix.


Table 1.
Values for all input linguistic variables.
| Linguistic Variables | Range | Fuzzy Values |
|---|---|---|
| Bradycardia | ||
| Normal | ||
| Tachycardia | ||
| Bradypnea | ||
| Normal | ||
| Tachypnea | ||
| Critical | ||
| Low | ||
| Normal | ||
| Regular | ||
| Altered | ||
| Purplish |
Table 2.
Extract of the fuzzy rule base.
| Rule No. | Antecedent | Consequent | |||
|---|---|---|---|---|---|
| 1 | Normal | Normal | Normal | Regular | Low |
| 2 | Normal | Bradypnea | Normal | Regular | Medium |
| 3 | Normal | Tachypnea | Critical | Regular | High |
| 4 | Tachycardia | Tachypnea | Critical | Regular | VeryHigh |
| … | |||||
| 81 | Tachycardia | Tachypnea | Low | Purplish | VeryHigh |
Table 3.
Mean absolute error and standard deviation obtained by comparing our contact-less system and the pulse oximeter.
Table 3.
Mean absolute error and standard deviation obtained by comparing our contact-less system and the pulse oximeter.
| All Subjects | Healthy Subjects | Unhealthy Subjects | |
|---|---|---|---|
Table 4.
Some samples from the created dataset.
| (a) Measurements of Vital Signs. | | | (b) Expert Diagnosis. | |||||
|---|---|---|---|---|---|---|---|
| | | Subject | ||||||
| S1 | 73.0 | 10.7 | 98.9 | 12 | | | S1 | Low |
| S2 | 98.3 | 9.4 | 98.4 | 12 | | | S2 | Medium |
| S3 | 136.6 | 9.0 | 94.0 | 12 | | | S3 | Very High |
| S4 | 79.1 | 10.8 | 93.6 | 1 | | | S4 | Medium |
| S5 | 88.4 | 21.2 | 98.0 | 1 | | | S4 | Medium |
| … | … | … | … | … | | | … | … |
| S116 | 70.8 | 31.4 | 92.0 | 1 | | | S116 | High |
Table 5.
Statistics of classes in the created dataset.
| Low Risk | Medium Risk | High Risk | Very High Risk | |
|---|---|---|---|---|
| No. Subjects | 86 | 7 | 8 | 15 |
Table 6.
Classification results.
| (a) Evaluation Measures Derived for Each Risk Class. | | | (b) TP, TN, FP, FN for Each Risk Class. | |||||||||
|---|---|---|---|---|---|---|---|---|---|---|---|
| Risk Class | ACC | TNR | TPR | PPV | NPV | | | Risk Class | TP | TN | FP | FN |
| Low | 0.83 | 1.00 | 0.77 | 1.00 | 0.60 | | | Low | 66 | 30 | 0 | 20 |
| Medium | 0.75 | 0.76 | 0.57 | 0.13 | 0.96 | | | Medium | 4 | 83 | 26 | 3 |
| High | 0.91 | 0.94 | 0.50 | 0.40 | 0.96 | | | High | 4 | 102 | 6 | 4 |
| Very High | 0.88 | 0.96 | 0.40 | 0.60 | 0.91 | | | Very High | 6 | 97 | 4 | 9 |
© 2018 by the authors. Licensee MDPI, Basel, Switzerland. This article is an open access article distributed under the terms and conditions of the Creative Commons Attribution (CC BY) license (http://creativecommons.org/licenses/by/4.0/).
Share and Cite
MDPI and ACS Style
Casalino, G.; Castellano, G.; Pasquadibisceglie, V.; Zaza, G. Contact-Less Real-Time Monitoring of Cardiovascular Risk Using Video Imaging and Fuzzy Inference Rules. Information 2019, 10, 9. https://doi.org/10.3390/info10010009
AMA Style
Casalino G, Castellano G, Pasquadibisceglie V, Zaza G. Contact-Less Real-Time Monitoring of Cardiovascular Risk Using Video Imaging and Fuzzy Inference Rules. Information. 2019; 10(1):9. https://doi.org/10.3390/info10010009
Chicago/Turabian StyleCasalino, Gabriella, Giovanna Castellano, Vincenzo Pasquadibisceglie, and Gianluca Zaza. 2019. "Contact-Less Real-Time Monitoring of Cardiovascular Risk Using Video Imaging and Fuzzy Inference Rules" Information 10, no. 1: 9. https://doi.org/10.3390/info10010009
Note that from the first issue of 2016, this journal uses article numbers instead of page numbers. See further details here.