
Saliency-Enabled Coding Unit Partitioning and Quantization Control for Versatile Video Coding


1
Department of Information Engineering, Shanghai Maritime University, NO.1550, Haigang Ave., Shanghai 201306, China
2
Department of Electrical and Electronics Engineering, Tokushima University, 2-24, Shinkura-cho, Tokushima 770-8501, Japan
3
Department of Systems and Computer Engineering, Carleton University, Ottawa, ON K1S 5B6, Canada
*
Author to whom correspondence should be addressed.
Information 2022, 13(8), 394; https://doi.org/10.3390/info13080394
Submission received: 1 July 2022
/
Revised: 16 August 2022
/
Accepted: 17 August 2022
/
Published: 19 August 2022
(This article belongs to the Special Issue Signal Processing Based on Convolutional Neural Network)
Abstract
:The latest video coding standard, versatile video coding (VVC), has greatly improved coding efficiency over its predecessor standard high efficiency video coding (HEVC), but at the expense of sharply increased complexity. In the context of perceptual video coding (PVC), the visual saliency model that utilizes the characteristics of the human visual system to improve coding efficiency has become a reliable method due to advances in computer performance and visual algorithms. In this paper, a novel VVC optimization scheme compliant PVC framework is proposed, which consists of fast coding unit (CU) partition algorithm and quantization control algorithm. Firstly, based on the visual saliency model, we proposed a fast CU division scheme, including the redetermination of the CU division depth by calculating Scharr operator and variance, as well as the executive decision for intra sub-partitions (ISP), to reduce the coding complexity. Secondly, a quantization control algorithm is proposed by adjusting the quantization parameter based on multi-level classification of saliency values at the CU level to reduce the bitrate. In comparison with the reference model, experimental results indicate that the proposed method can reduce about 47.19% computational complexity and achieve a bitrate saving of 3.68% on average. Meanwhile, the proposed algorithm has reasonable peak signal-to-noise ratio losses and nearly the same subjective perceptual quality.
1. Introduction
After the development of digital, high definition, and ultra-high definition, video is gradually moving towards intelligence, expanding from traditional broadcasting applications to various fields such as video communication, telemedicine, and security surveillance. Video coding is one of the core technologies for video applications, mainly exploring the theory of efficient representation and compression methods for digital video, reducing the overhead required for video transmission and storage. Recently, the joint video experts team (JVET) under the ITU-T video coding experts group (VCEG) and ISO/IEC moving picture experts group (MPEG) launched a state-of-the-art video compression standard called H.266/versatile video coding (VVC) [1]. Compared to the H.265/high efficiency video coding (HEVC), which is the previous generation video compression standard, the H.266/VVC achieves about 50% bitrate saving while maintaining the same subjective visual quality. The block-based hybrid coding framework from HEVC was adopted by VVC [2]. For VVC, a variety of new coding techniques were adopted, such as the quad-tree plus multi-type tree (QTMT) structure of coding unit (CU) partition, intra sub-partitions (ISP), cross-component linear model (CCLM), the affine motion compensation prediction, and so on [3]. These new techniques introduced in VVC achieve large gains over HEVC in coding efficiency; however, the complexity of VVC is also increased sharply. As measured in the reference software VTM [4], the encoding complexity of VVC is on average 10 times higher than HEVC, making VVC far from practical applications. Bitrate is the number of bits transmitted or processed per unit time. One of the tasks of video encoding is to minimize the bitrate of transmission while keeping the video quality basically unchanged; therefore, it is necessary to significantly reduce the computational complexity and bitrate of VVC, while keeping the desirable coding efficiency.
Based on a deeper understanding of the perceptual features of the human visual system (HVS) and a higher performance computation model, perceptual video coding (PVC) can further improve the efficiency of video coding by eliminating the perceptual redundancy during video compression. The perceptual models in previous works have been divided into three categories: the visual sensitivity model, the visual attention model, and the mixed coding model. The main idea of the visual sensitivity model is to improve coding performance through the difference in distortion sensitivity of various visual signals in HVS [5]. There are three main coding methods based on visual sensitivity: the just noticeable distortion (JND) model-based coding method [6], which measures the human eye’s sensitivity to distortion in different regions of the video, the structural similarity (SSIM) coding method [7], which uses structural information metrics as an approximation to perceptual quality, and the frequency domain weighted quantization coding method [8], which dynamically adjusts the quantization weights according to the human eye’s sensitivity to different characteristic of coding units. Depending on whether or not the central concave feature of the HVS is considered, visual attention-based coding methods can be divided into two categories: region of interest (ROI)-based coding methods and coding methods based on a combination of ROI and central concave features. ROI mainly employs visual perception analysis to identify regions of interest and thus control the coding quality of regions of interest and non-regions of interest respectively by adjusting the coding parameters. The central concave feature dynamically adjusts the coding quality of the region according to the distance from the point of view. The integration of the central concave feature into the ROI-based coding method can better eliminate visual redundancy and improve the subjective perception of the video. Hybrid coding methods are a combination of visual sensitivity and visual attention coding methods, and their coding results can further improve the subjective quality of the video; however, the hybrid coding method requires a combination of the visual model method and the signal-driven method to tap into the perceptual redundancy of the video, so the computational complexity is high.
As an important ROI extraction technique, video saliency detection processes salient and non-salient regions separately by finding the part of each video frame that attracts the most attention. By allocating more bits to the salient regions to reduce distortion and fewer bits to the non-salient regions to optimize the compression ratio, it provides better perceptual quality without increasing the total number of bits. It can be applied as a basic module in many vision tasks, such as video object segmentation, scene rendering, object tracking, and so on. Saliency models can be broadly divided into two categories: human eye fixation prediction or salient object detection. Depending on the type of input, they can be further categorized into static saliency models and dynamic saliency models. Static models take still images as input, while dynamic models work on video sequences. Areas of visual saliency are usually represented by saliency maps. In these maps, images are generated such that regions with high-valued pixels represent high saliency on the original image, while regions with low-valued pixels express low saliency. With the rapid development of deep learning, the combination of deep learning and saliency models can overcome many drawbacks of traditional saliency algorithms. For example, cumbersome hand-crafted features, slow speed (due to time-consuming optical flow computation), and low prediction accuracy (due to the limited representability of low-level features).
Over the years, plenty of contributions have been made to improve the coding efficiency of intra partitioning and quantization process in VVC. The different approaches adopted by the former researchers are illustrated in Section 2. Although various optimization algorithms of VVC have achieved good results in previous work, the research on the combination of fast coding unit division and quantization control guided by saliency has not been carried out. In order to further improve the coding efficiency of VVC, we propose a novel VVC optimization scheme compliant PVC framework. The main contributions of our work are as follows:
- First, we use a fully convolutional network to extract the static saliency results of video frames as a prior for another fully convolutional network consisting of frame pairs as input, and finally obtain accurate temporal saliency estimates. Unlike advanced video applications such as motion detection, video saliency requires no consideration of multi-scale oriented long-time spatiotemporal features. Short-time spatiotemporal features obtained using a combination of two full convolutional networks are sufficient without considering the complex optical flow computation and the construction of spatiotemporal fusion layers.
- Based on the obtained video saliency results, we propose a CU Splitting scheme, including the redetermination of QTMT Splitting depth and the execution decision of ISP. After the CU is determined to be a salient region and the CU size of 32 × 32 is satisfied, we use the Scharr operator to extract gradient features to decide whether to split this CU by QT, thus terminating the asymmetric rectangular partition. If the condition of the previous step is not satisfied, the variance of each sub-CU variance is calculated so that only one of the five QTMT partitions is selected for partitioning. If the CU is judged to be a non-salient region, the continuous division of the 32 × 32 block is directly terminated. For the ISP mode, if the CU is determined to be non-salient, decide whether to skip ISP mode in combination with the texture complexity of the block; if the block is determined to be salient, the CU is subjected to the ISP operation normally.
- After saliency detection and CU partitioning, we propose a quantization control scheme at the CU level. Firstly, the salient value of each CU is calculated based on the salient result obtained in the pre-processing stage, and then the saliency values of each CU is processed at a hierarchical level. Finally, the QP parameters of the CU are adjusted according to the set saliency levels. The three modules are progressive, thus reducing the computational complexity and bitrate without compromising the perceptual quality.
The rest of this paper is organized as follows. In Section 2, a brief introduces the related work of CU division and quantization control. Section 3 describes VVC optimization scheme compliant PVC framework in details. In Section 4, the experimental results are provided. Finally, Section 5 concludes the paper.
2. Related Works
In this section, we give a brief overview of recent works in three lines: saliency detection, CU partitioning, and quantization control.
2.1. Saliency Detection
As an important technology of ROI, salient target detection can be generally divided into traditional salient target detection and deep-learning-based salient target detection. Traditional saliency target detection mainly uses human intuition or heuristic priors, such as using chromaticity comparison [9], background comparison [10], and boundary point priors [11], etc., to detect objects by manually extracting features. In [12], Leborán et al. propose a computational dynamic adaptive whitening saliency (AWS-D) based on the assumption that perceptual relevant information is carried by high-order statistical structures. Through whitening, they completely remove the second-order information (correlations and variances) of the data, gaining access to the relevant information. Fang et al. [13] propose an algorithm to detect visual saliency from video signals by combining both spatial and temporal information and statistical uncertainty measures. The spatial and temporal saliency maps are merged into one using a spatiotemporally adaptive entropy-based uncertainty weighting approach; however, manually extracting features is very time-consuming. In recent years, the development of deep learning has greatly promoted the research on salient object detection, and salient object detection based on deep learning has been continuously proposed. A famous architecture for training CNNs for action recognition in videos is proposed in [14], which incorporates two-stream convolutional networks for learning complementary information on appearance and motion. Moreover, Nevrez et al. [15] combine both forward and backward features to the CNN model for providing sufficient information on the selected features. The object-to-motion CNN model proposed by Jiang et al. includes two subnets of objectless and motion that are trained in an end-to-end manner [16]. The objectless and object motion information is used to predict the intra saliency of videos. Inter saliency is computed by means of a structure-sensitive ConvLSTM architecture.
2.2. CU Partitioning
As the core of the coding layer, the block partition structure achieves great coding performance gain benefiting from the flexible block sizes. Specifically, the coding tree unit (CTU) is first partitioned by a quad-tree (QT). The quad-leaf nodes can then be further partitioned by a multitype tree (MTT) structure. There are four partition types in the MTT structure, including vertical binary tree partition (BV), horizontal binary tree splitting (BH), vertical ternary tree splitting (TV), and horizontal ternary tree splitting (TH). Figure 1 shows the five possible partition structures for a QT node. It is noted that a QT node can be partitioned by all five patterns, but an MT node can no longer be partitioned by QT, only MT nodes are allowed regardless of whether the sub-block shape of the MT node is square or not. Depending on the encoding parameters and the split type, the CU size is changed from a maximum 128 × 128 to a minimum 8 × 4 or 4 × 8. In addition, to address the problem that the correlation between samples in the natural image decreases with the increasing distance, an intra sub-partition (ISP) coding mode has been proposed in VVC, which divides the luma block horizontally or vertically into 4 or 2 equal size sub-partitions, with each contains at least 16 samples. The minimum sub-partition size and the maximum block size that can be used with the ISP coding mode are 4 × 8 (or 8 × 4) and 64 × 64, respectively. If the block size is larger than 4 × 8 (or 8 × 4), the corresponding block will be divided into four sub-partitions. If the size of a block is equal to 4 × 8 (or 8 × 4), the corresponding block is divided into two sub-partitions. The two cases are shown in Figure 1. There is a high degree of complexity to search for the optimal CU partitioning using the QTMT structure and ISP model in VVC, so it is necessary to find an efficient method to guide CU partitioning.
Research aimed at the reduction in CU partitioning complexity has been conducted extensively. Shen et al. [17] developed a dynamic CU depth range decision approach for fast intra-prediction, exploits the texture property, and coding information from the neighboring CUs. Then, texture homogeneity and spatial correlation are utilized to skip some CU sizes. Yang et al. [18] designed a low complexity CU partition pipeline by skipping unnecessary partition modes and intra-prediction processes, which is modeled as a multi-binary-classification process based on statistical analysis. Global and local edge complexities in several directions are utilized in [19] to decide the partition of a CU. By analyzing edge types existing in each CU and its four sub-CUs, the CU will be decided as partitioning CU, non-partitioning CU, or undetermined CU for each depth level. Recently, the learning-based methods have attracted more and more attention and have made significant improvements in performance. Fu et al. [20] adopt the Bayesian decision rule to eliminate the redundant selection of QTMT. The split types and intra prediction modes of sub-CUs are adopted as the input features. Early skip for vertical split including BV and TV is first conducted, then is the early skip for TH. In [21], Xu et al. propose an early terminated hierarchical CNN (ETH-CNN) to reduce the intra coding complexity. With the hierarchical CU partition map adoption and specific network framework, ETH-CNN achieves higher prediction accuracy. A CNN-oriented fast QTBT partition decision scheme is introduced in [22] for inter coding. This method analyzes the QTBT in a statistical way, which effectively guides us to design the structure of CNN. Although CNN-based methods do not need the handcrafted features, they take an additional computational burden to encoder due to complex network computing, and they cannot make good use of the important spatial correlations of video.
2.3. Quantization Control
In the latest video coding standard VVC, block-wise QP adaptation (QPA) based on the human visual system can improve the subjective coding quality for humans as the final observer, when CTUs covering non-salient regions are transmitted at a lower visual quality [23]. For video domains such as surveillance, conference, and autonomous driving, a large amount of visual redundancy exists due to high target and background differentiation. By dynamically adjusting the QP values of the target and background regions, the coding efficiency can be greatly improved. In the saliency-based video compression method, the saliency model is used to split the salient and non-salient regions, and the two regions are then treated with different QP schemes, which significantly improves the compression efficiency while maintaining the perceptual quality of the salient regions. At this stage, the coding efficiency of VVC in particular domains is prevented from being effectively put to use by its extremely high computational complexity. We attempt to effectively combine saliency detection, CU partitioning theory, and block-wise quantization control. Our proposed algorithm aims to significantly reduce the computational complexity and bitrate of coding while keeping the subjective quality of the video largely unchanged.
The quantization control mainly changes the video coding output rate by adjusting the form of the quantization parameter(QP), to adapt to the change in the bandwidth. Quantitative control research around perception theory is also gradually launched. In [24], different coding parameters (e.g., ME search range) were allocated to ROI and non-ROI parts. In [25,26], rate-distortion was optimized by adapting the distortion degree computation methods to different patterns. Jiang et al. [27] proposed a coding scheme based on a spatiotemporal saliency detection model to obtain spatiotemporal saliency by fusing spatial saliency obtained from Markov chains and temporal saliency obtained from the Lucas–Kande (LK) algorithm. The quantization parameters are then adjusted according to the obtained saliency map to reduce the bitrate. Sanaz et al. [28] utilize the predicted just noticeable distortion (JND) levels of the JND estimator and the visual importance of video frames to assign QPs, to achieve quantization control over CTU. Kristian et al. [23] made the overlapping decision of the target region and CTU extracted by the real-time object detection network YOLO to obtain the salient region, perform QP adjustment on the coding block, and save up to 29% of the bitrate with the same detection accuracy under the VVC coding architecture; however, this method handles video saliency relatively crudely, and only distinguishes between saliency and non-saliency, and does not perform multi-level division of the obtained saliency.
3. Proposed Perceptual Coding Scheme
3.1. System Overview
Figure 2 shows the traditional video coding framework and the proposed perceptual video coding framework. As shown in Figure 2a, the traditional video coding framework directly obtains the final bitstream through five basic steps of CU partition, intra/inter prediction, transform, quantization, and entropy encode after inputting video frames. Different from the traditional video coding framework, the perceptual video coding framework adds a new perceptual module on this basis, as shown in Figure 2b. After inputting video frames, a fully convolutional network-based saliency model is used as a perceptual model to generate a saliency map, which happens in the preprocessing stage of video coding. The saliency map serves as a guide for CU division and quantization control to achieve a more efficient and low-complexity coding process.
3.2. Implementation of the Visual Saliency Model
In this paper, a video saliency object detection model via fully convolutional networks proposed in the [29] is employed and is also implemented in VTM 12.0 to estimate VS map. The model learns in an end-to-end manner and generates pixel-level saliency mapping directly through a fully convolutional network.
The proposed deep video saliency network consists of two modules for capturing spatial and temporal saliency information, respectively. The dynamic saliency model explicitly combines the saliency estimation of the static saliency model to directly generate spatiotemporal saliency inference without the need for time-consuming optical flow computation. On the other hand, in order to solve the problem of training deep video saliency models in the absence of sufficiently large pixel-level annotated video data. A new data augmentation technique is proposed to simulate video training data from existing datasets of annotated images, enabling the network to learn different saliency information and preventing overfitting with a limited number of training videos.
Therefore, the VS model is embedded in VTM 12.0 in C++ implementation, and there are two parts to the introduction of VS model in this paper. The first part introduces deep networks for video saliency detection, and the second part introduces methods for synthetic video data generation. A detailed description of this algorithm can be found in [29]. A brief description of the implementation of the two steps is described below.
3.2.1. Deep Networks for Video Saliency Detection
The static saliency reflects the spatial characteristics of the video, while the dynamic saliency reflects the temporal characteristics of the video. The effective combination of the two is beneficial to the construction of the final saliency map. This method is different from the previous method by simply constructing a fusion layer of static and dynamic networks to obtain spatiotemporal saliency results, but by taking the results of static saliency networks as priors of dynamic saliency networks, thus avoiding time-consuming fusion Layer construction and optical flow calculation. Unlike high-level video applications such as action detection, the dynamic saliency network takes frame pairs as input, and obtains the final saliency result in a short-term space-time memory way, without considering the complex and time-consuming multi-scale feature-oriented long-term video information, which is in line with our usual application scenarios.
The static saliency detection network takes a single frame of image as input, adopting multi layer convolution networks that transforms the input image to multidimensional feature representation, then applying a stack of deconvolution networks for upsampling the feature extracted from the convolution networks. Because we expect to obtain a specific value for measuring saliency, and according to the characteristics of the sigmoid function, which can meet our needs. On the top of the network, a convolutional layer with a 1 × 1 kernel is adopted for mapping the feature maps into a precise saliency prediction map through a sigmoid activation unit. We use the sigmoid layer for pred so that each entry in the output has a real value in the range of 0 and 1. Convolutional layer is defined on shared parameters (weight vector and bias) architecture and has translation invariance characteristics. The activation function is used in the convolutional network to add nonlinear factors to improve the expressive ability of the network. At the same time, compared with other activation functions, rectified linear unit (ReLU) has the characteristics of simple calculation, preventing gradient dispersion and sparse activation; therefore, ReLU is applied after each convolutional layer to improve the feature representation ability. Additionally, convolutional layers are often followed by some form of non-linear down-sampling (e.g., max pooling). This results in robust feature representation which tolerates small variations in the location of the input feature map. Due to the stride of convolutional and feature pooling layers, the output feature maps are coarse and reduced resolution. As shown in Figure 3, multi-layer deconvolution networks are put on the top of the convolution networks for up sampling the coarse feature map. Due to the use of convolutional layers and deconvolutional layers in the fully connected network, the input images of different resolutions can obtain the same size output image, which is the basis of the subsequent coding unit division and quantization control algorithm. Figure 3 shows the 224 × 224 size network process, the static saliency network for other resolution images is similar.
For training, all the parameters are learned via minimizing a loss function, which is computed as the errors between the probability map and the ground truth. During training, convolutional layers are initialized with the weights in the first five convolutional blocks of VGGNet [30], which was originally trained over 1.3 million images of the ImageNet dataset [31]. The parameters of remaining layers are randomly initialized. Based on this, the network was trained on the MSRA10K [32] and the DUT-OMRON [10] datasets with 100K iterations for saliency detection in static scenes. Dynamic video saliency network is also initialized from the VGGNet network. For the first convolutional layer, we use Gaussian initialization due to a different input channel from VGGNet. Benefiting from proposed video data synthesis approach, we can employ images and annotations from existing saliency segmentation datasets for training video saliency model. The images and masks from MSRA10K and DUT-OMRON datasets are used to generate more than 150K video slits. Then, we combine simulated video data with real video data from exiting video segmentation datasets [33,34] for generating an aggregate video saliency training set. The whole video saliency model is trained for 300K iterations. The network considers the imbalance between the number of salient and non-salient pixels, and thus trains the parameters by computing a weighted cross-entropy loss. Given a training sample consisting of an image I with size h × w × 3, and a ground truth saliency map , the network produces a saliency probability map . For any given training sample, the training loss on network prediction P is thus given by
where and ; refers to the ratio of salient pixels in ground truth G. The network trains the proposed architecture in an end-to-end manner. During training, stochastic gradient descent (SGD) is used to minimize the weighted cross-entropy loss in Equation (1). Our purpose in defining the loss function is to measure how close the predicted output P is to the actual value of G. When , if is closer to 1, then the loss is close to 0. If is closer to 0, then the loss is very large. When , the situation is opposite. That is, SGD exploits the relationship between the saliency pixel ratio in G and the actual saliency estimate to minimize the weighted cross-entropy loss.
As shown in Figure 4, the structure of the final spatiotemporal saliency network is similar to the above static saliency network, which is based on FCN and includes multi-layer convolution and deconvolution nets. The training set consists of a collection of synthetic and real video data. By simulating video training data from existing annotated image data sets, which enables the network to learn different saliency information and prevents overfitting with the limited number of training videos. More specifically, we feed successive pairs of frames and from the training set into this network to capture dynamic saliency. The static saliency estimate P of the frame detected by the static saliency network is then fed into the dynamic saliency network as saliency priors indicative of potential salient regions. Finally, the dynamic saliency network directly generates the final spatiotemporal saliency estimate of the frame , which is achieved via exploring dynamic saliency cues and leveraging static saliency prior from the static saliency network. After obtaining the video saliency estimate for the frame , we keep iterating this process for the next frame until reaching the end of the video sequence.
3.2.2. Synthetic Video Data Generation
The approach generates a large amount of video data (150K paired frames) from existing image datasets, and associates these annotated video sequences with existing video data to learn deep video saliency networks. The simulated video data are easily accessible and rapidly generated, close to realistic videos, and present various motion patterns, and deformations, accompanied with automatically generated annotations and optical flow.
The video saliency network takes frame pairs as input, instead of the whole video sequence. That means it can simulate diverse but very short video sequences (only two frames in length) via fully utilizing well-labeled large-scale image datasets. A pair of frames is generated from the training samples of the existing image saliency dataset, presenting different motion patterns, different distortions, and smoothing transformations so as to approximate the real video signal. is inferred by simulating the correspondence between I and . Let x = (x, y) denote a point position, the correspondence between and I can be represented as an optical flow field via:
where the optical flow field v directly represents the pixel-level motion information between two neighboring frames; u is the vertical movement displacement and v is the horizontal movement displacement. The synthetic optical flow field is initialized by considering various motion features in real video sequences. The resulting optical flow field is smoother and better simulates real motion patterns. Another synthesized frame of the frame pair is obtained by the original frame I and the optical flow field .
Those synthesized video data, combined with real video samples from existing video segmentation datasets, are fed into model for learning general dynamic saliency information without over-fitting. A VS map estimated by the above model for test sequence BasketballDrill is shown in Figure 5. In the VS map, the brighter area representing this region will attract more attention from the audience. VS map is used as the direction to control distortion and resource allocation in perceptual coding. The saliency map obtained through the preprocessing stage of video coding can well guide the CU division and the allocation of quantization parameters.
3.3. Perceptual Fast CU Partition
VVC improves coding efficiency by introducing many new technologies, but it also leads to a large increase in computational complexity, especially for the division module of coding units. With goal-oriented thinking, this part applies the saliency theory to the CU division module and designs a set of fast algorithms around QTMT and ISP in combination with the texture complexity of the block. Section 3.3.1 is mainly designed around decision of CU split depth. First, the saliency of the current block is determined by calculating the saliency value of the coding unit. The saliency value is calculated by the fully connected network-based saliency object detection module in Section 3.2. Different division strategies are performed according to the saliency of the block. If the current block is judged to be salient region, the further division is carried out through theories such as the Scharr operator and variance. If the current block is determined to be non-salient region, the division of the block is skipped directly. The process of skipping the division greatly reduces the encoding time, but the encoding quality will be lost, especially in the rich details in the non-salient areas. To this end, we introduce the ISP skipping algorithm in Section 3.3.2 and implement different ISP strategies for salient and non-salient regions by combining the texture complexity of the block. On the one hand, ISP can well improve the loss of coding quality caused by skipping block division directly in Section 3.3.1 of the non-salient region. On the other hand, by skipping the blocks with simple textures in non-salient regions, the computational complexity caused by the ISP itself can be greatly reduced. Coding efficiency in video coding is usually represented by coding quality and bitrate, while computational complexity in video coding is usually measured by encoding time. The purpose of video coding is to make a trade-off between the two. It is not possible to only consider coding efficiency and ignore complexity, which is difficult to put into practical application. It is also impossible to blindly pursue low complexity and ignore coding quality, which will greatly affect the user experience. The combination of the two algorithms can well balance the relationship between encoding quality and computational complexity.
3.3.1. QTMT Partition Mode Decision
The basis of our work is the official document [3] published by JVET and the relevant reference software VTM-12.0. The VTM supports both symmetric and asymmetric partitions, which means the width and the height of a CU can be either the same or different. The use of QTMT segmentation for blocks of different nature can greatly improve coding efficiency. According to the paper [35,36], for the distribution of CU partition modes, the amount of 32 × 32, 16 × 16, and 8 × 8 modes are close and much higher than mode 64 × 64. At the same time, considering that directly deciding the division of 64 × 64 CU may lead to a huge loss of coding performance, we do not consider the division decision of 64 × 64 in this work. To tradeoff between coding efficiency and computational complexity, this paper selects a 32 × 32 block as the basic unit to select a suitable partition mode from five QTMT partition modes.
To design a feasible fast block partitioning algorithm, we combine saliency theory and traditional methods for computing the texture complexity of blocks, as shown in Figure 6. Specifically, the salient regions in the video frame are first extracted according to Section 3.2, and the blocks are divided by the original RDO-based strategy until the size of the block is 32 × 32. By judging the saliency value of the block, it is decided whether to divide the block in the next step. By terminating further partitioning of the CU, all five partitioning modes will be skipped and time will be greatly saved. If the threshold condition is met, the next step is judged. This method can implement different division strategies for salient regions and non-salient regions to meet practical application requirements. Second, we use the Scharr operator to extract gradient features. These features are used to decide whether to select QT as a partition of the CU. If so, the other four partitions will be skipped. This step will prematurely terminate all MT partitions. Finally, according to the variance of each sub-CU, one partition structure is selected from the five QTMT structures as the final partition.
- Early Termination-Based Saliency
For videos in specific scenarios such as conferences and surveillance, different partitioning strategies for salient target areas and non-salient areas can balance the relationship between user-perceived quality and computational complexity. In fact, CU partition has a high correlation with texture and movement complexity in video frames. Based on the optimal CU partition in VVC, a CU tends to be split into smaller CUs (i.e., 8 × 8 and 16 × 16) to achieve more precise prediction when it is relatively complex. In the same way, it is unnecessary to do mode decisions in small depth for CUs with low complexity. The CU tends to be split into larger CUs (i.e., 32 × 32) when it is smooth with a lower VS value. To be more specific, the non-ROI regions in the video may have small depth and larger CU sizes while highly salient regions with complex textures may be partitioned with smaller CU sizes.
where N is CU size and is the saliency value of the pixel within a CU.
The parameter is the threshold for distinguishing salient and non-salient blocks in a video frame. There is no simple use of 0 and non-0 to simply distinguish saliency and non-salience, it is considered that some blocks will contain both salient and non-salient areas. The division of the threshold can balance the relationship between the quality of the edge of the saliency region and the computational complexity. Based on the statistics and experiment, we empirically obtained .
If the size of the block is 32 × 32 and the value of is between 0 and , we consider the current block to be a non-salient block and use the direct skip division operation. If the size of the block is 32 × 32 and the value is between and 1, we consider the current block to be a salient block and perform further division processing, as shown in step B and step C below.
- B.
- Choosing QT Based on Gradient
With the advent of more and more high-resolution and detail-rich videos, in order to calculate the texture complexity of CUs and compare them with each other, it is necessary to highlight the texture regions more. As a gradient operator, the Scharr operator has higher coefficients and larger texture weights, which further enhances edge features and obtains clearer information. It is better than the sober operator in this regard, so the Scharr operator is selected to calculate CU the texture complexity and shown in Equations (4)–(6).
In Equations (4)–(6), and represent the Scharr operator in the horizontal and vertical directions, respectively; W and H are the width and height of the current CU, respectively. A is the 3 × 3 raw pixel matrix centered on the point currently being computed; represents the horizontal gradient; represents the vertical gradient; represents the total gradient of the block. For pixels in the top row, bottom row, leftmost column, and rightmost column, we pad the pixels outside the CU with their nearest pixel value within the CU.
We use the ratio of and to signify a tendency that the area is a horizontal texture or a vertical texture. We divide the bigger one and by the other and if the quotient is smaller than a threshold , it means the overall gradients in the horizontal and the vertical direction are similar and we can view the texture of this block as smooth. QT partitioning works well with features that are both horizontally and vertically symmetrical styles. For this case, and should not be small, so we add a condition that if and are both larger than a threshold , then the CU is directly partitioned by QT without processing any MT partitions. If step A is said to be a termination of all partition structures, then step B can be viewed as a termination of all the MT partition structures, where rectangular partitions can be directly excluded. The judgment condition of step B is: if the following three conditions are met or , , , then select QT and skip MT.
We take BDBR and time savings into account for the selection of and thresholds. The line chart of BDBR and time saving as a function is shown in Figure 7. In our algorithm, cannot be too large since the probability of a CU being partitioned by QT cannot be too high. If is set as a large value, it means almost all the CUs will be partitioned by QT and the prediction program will not proceed into step C. To ensure good performance, choose a value with a slope that varies significantly before and after. The line chart of BDBR and time saving as a function of is shown in Figure 7. In the figure, we can see that BDBR fluctuates with the changing of , but its changes are not drastic when is in a certain range. So, we select corresponding to the smallest BDBR, which is 30,000. So finally, we set (, ) as (2.6, 30,000).
- C.
- Choosing the Final Partition Mode Based on Variance of Variance
Blocks are divided into sub-blocks with relatively different textures from each other, which means that different textures are likely to be divided into different sub-blocks for better prediction performance; therefore, the variance difference between each sub-block tends to be large. Distinguishing blocks with different texture differences by computing variance is a good way to differentiate.
If the 32 × 32 CU does not satisfy the conditions in steps A and B, the variance of each of its sub-CUs will be calculated separately for all five partitioning conditions. For each QTMT partition, the variance of the original pixels of each sub-CU is first calculated to obtain a set of variances. The variance of the variance set is then calculated to derive five values. Each value corresponds to a partition. The largest variance is selected and the corresponding partition is chosen as the unique partition of the current CU. The computational expressions for the QT and four MT partitions are shown in Equations (7)–(9).
In the equation, each denominator of the first fraction to the right of the equation represents the number of sub-CUs when using the corresponding partition structure. k represents the index of the sub-CU. For instance, the value of k of the left part and the right part in a BH partition are 1 and 2, respectively. , , and are the widths, height, and the mean value of pixels of the sub-CU. , , , , and are the mean values of the variances of all the sub-CUs under corresponding partition conditions.
The judgment condition of step C is: if max(, , , , ) = , then select n(n = QT, BH, BV, TH, TV). For example, if the maximum of the five variances is , then select BV as the final partition.
3.3.2. Early Termination of ISP
The above-mentioned fast CU division algorithm greatly saves coding time by simplifying the operation of non-salient regions and rapidly dividing salient regions, but it also sacrifices the coding quality of some non-salient regions, especially those belonging to non-salient regions and the complex texture blocks. ISP is a CU division algorithm proposed by VVC. By further dividing the coding unit, each sub-partition can use adjacent samples located at the shortest possible distance for prediction to improve coding efficiency. ISP can well optimize our proposed fast CU division algorithm, but ISP also brings a lot of computational complexity while improving the prediction accuracy.
To balance the relationship between coding quality and computational complexity brought by ISP partitioning, we design an ISP skipping algorithm based on saliency theory. By adopting different ISP processing strategies for the salient target area and the non-salient area, the visual quality of the target area can be further improved. At the same time, since the ISP processing of the non-salient area is reduced, a lot of coding time can be saved. Specifically, we obtain the saliency value of each block before ISP execution through the pixel-level saliency results obtained by the saliency target detection network based on the fully connected network in Section 3.2 and the division of the blocks by the fast partition algorithm in Section 3.3.1. The calculation formula is shown in Equation (3). Considering that some CU may contain both salient regions and non-salient regions, in order to balance the edge quality and computational complexity of the salient regions, the threshold of the above-mentioned quick CU division step A is also used to fuzzy divide the saliency area. If the saliency value of the current block is between 0 and , it indicates that the coding unit belongs to the non-salient region. If the saliency value of the current block is between and 1, it indicates that the coding unit belongs to the saliency target region. The specific value is the same as in step A above.
When the CU is determined to be a non-salient region, we need to further determine the texture complexity of the CU. To determine whether a CU has a simple texture or a complex texture, an appropriate metric is required. This section adopts the existing method, which uses the interval sampling method to calculate all pixel values instead of calculating all pixel values [37]. This method is improved based on mean absolute deviation (MAD). Odd points are sampled from odd rows of pixel points, and even points are sampled from even rows of pixel points. This sampling method can not only reduce the calculation by half but also accurately measure the texture complexity. The calculation formula of texture complexity (TC) used in this section is shown in Equation (10).
where and are the width and height of CU, respectively, and is the luma value of the pixel at , and is the average of all sampled pixels.
According to the value of , CUs in non-salient regions will be divided into two categories: simple texture and complex texture. When is less than a given threshold , the current CU is classified as a simple texture. When is greater than , the CU is divided into complex textures. is the threshold for judging the texture complexity of CUs.
The threshold plays a key role in the proposed algorithm. By selecting an appropriate threshold, the coding efficiency can be improved. The algorithm selects the threshold of CU texture complexity through the probability density of . The algorithm directly uses the established threshold . If , it is determined that the current CU is a simple texture. Otherwise, if , the CU is determined to be a complex texture.
In general, if the CU is determined to be non-salient and the texture complexity of the block is simple, indicating that the CU belongs to a non-target area with simple texture, the ISP processing is skipped directly. If the CU is determined to be non-salient and the texture complexity of the block is complex, it indicates that the CU belongs to the non-target area with complex texture. In order to better retain the detailed information, ISP processing is performed. If the coding unit is determined to be a salient region, indicating that the coding unit belongs to the target region, the division of the ISP is normally performed.
3.4. Saliency-Based Quantization Control Algorithm
The quantization parameter in the quantization process directly determines the coding precision and coding compression ratio of the video frame. The smaller the , the weaker the degree of quantization, the more bits consumed, and the better the video quality obtained; on the contrary, the larger the , the higher the degree of quantization, the fewer bits consumed, and the better the visual quality obtained. In the H.266/VVC standard, is used to determine the quantization step, and the setting range of is 0–51. In order to perform ROI coding more efficiently, people combine perceptual coding theory and the quantization control process [23,27]. On the one hand, most of these methods use traditional methods of calculating saliency and do not apply theories such as deep learning, so the overall effect is not good [27]. On the other hand, there is no more accurate hierarchical design for the obtained saliency results, but the saliency and non-saliency regions are simply set to 1 and 0 for quantization, which may lead to poor coding quality [23]. Considering these two reasons, we make the following improvements to the traditional quantitative control.
After the above-mentioned fully connected network-based salient target detection module and coding unit fast division algorithm, we obtain the final coding unit division. Based on this, we further propose a block-based quantization control algorithm. By adopting different quantization control strategies for salient and non-salient regions, a better balance between video coding quality and output bitrate is achieved. For saliency target regions, reduce the value of to achieve more accurate coding quality with a smaller quantization step size. For non-salient regions, increase the value of to control the number of bits consumed by a larger quantization step size. The salient region is the region we are concerned with, so improving the coding quality of the salient region while controlling the number of bits consumed by the non-salient region is a balancing practical solution. Specifically, the saliency value of the coding unit is first calculated according to Equation (3). Then, according to the threshold set in advance, the CU is divided into different attributes in a hierarchical setting idea. As shown in Figure 8, if the saliency value of the coding unit is between 0 and a, it belongs to very low complexity. If the saliency value of CU is between a and b, it belongs to low complexity. If the saliency value of CU is between b and c, it belongs to medium complexity. If the saliency value of CU is between c and 1, it belongs to high complexity. According to the different intervals corresponding to the significance values of the coding units, there are four different complexity levels. We design different adjustment strategies for four different complexity levels, so as to adapt to the content of different videos more accurately and effectively.
When the complexity level is high, the corresponding image can be encoded as foreground. Conversely, when the complexity level is low, the corresponding image can be encoded as the background. In the perceptual video coding process, the foreground needs to increase the allocated bitrate resources, while the background needs to reduce the allocated bitrate resources; therefore, the foreground code is quantized with a high , and the background is quantized with a low . On the basis of the complexity level corresponding to the CU saliency value, the setting quantized parameters can be dynamically adjusted in the encoding process. When is the default quantized parameter, and the has four values (22, 27, 32, and 37) in H.266/VVC reference software. Thus, the saliency-based quantization control algorithm is shown in Algorithm 1. By using the proposed method, more image distortion is introduced to CUs with a low saliency while less to CUs with a high saliency.
| Algorithm 1 Saliency-based quantization control algorithm. |
|
4. Experimental Results
4.1. Objective Experimental Results
To evaluate the objective performance of the proposed algorithm, we implement it using VVC test model version 12.0 (VTM 12.0). Tests are conducted for “all intra” configuration in which CABAC is used as the entropy coder. A total of 22 common test sequences belong to six categories with various resolutions: A1 (3840 × 2160), A2 (3840 × 2160), B (1920 × 1080), C (832 × 480), D (416 × 240), and E (1280 × 720). The encoding parameters take the recommended setting by the JVET comment test condition (CTC) configurations [38] under QP = 22, 27, 32, and 37, respectively. Coding efficiency is evaluated by Bjontegarrd Delta PSNR (BD-PSNR) and Bjontegarrd Delta bitrate(BDBR) according to Reference [39]. In order to more intuitively represent the reduction in the average bitrate, we introduce Bitrate Saving (BS) in the final result. Time-saving (TS) is used to measure the reduction in computational complexity. For the complexity generated by generating the saliency map, we did not add this complexity to the metric since the process is performed in the preprocessing stage. The negative value of TS in the table represents the reduced time, and the larger the value, the better the effect. The negative BD-PSNR in the table represents the lost PSNR, and the larger the absolute value, the worse the effect. The calculation formulas of BS and TS are shown in Equations (11) and (12):
where and are the bitrates using the H.266/VVC reference software and the proposed method with different . is the total coding time of the proposed algorithm and is the total coding time of the original algorithm in VTM12.0. The positive and negative values represent increments and decrements, respectively.
Table 1 shows the individual evaluation results of the two strategies of QTMT partition mode decision (QPMD) and early termination of ISP (ETOI), as well as the comprehensive evaluation results after combining the two strategies. QPMD can achieve about 44.67% encoding time saving, and BDBR increases by about 1.08%. It can be also observed that a consistent gain is obtained overall sequences with a minimum of 32.75% on “BQSquare” and a maximum of 52.11% on “BQTerrace”. The coding time reduction using QPMD is particularly high for high-resolution sequences, such as “BQTerrace” and “Kimono”. As far as the ETOI strategy is concerned, 6.61% coding time has been reduced with a maximum of 9.41% in “BasketballDrill” and a minimum of 4.29% in “BlowingBubbles”. Meanwhile, the average BDPSNR drop with 0.029 dB and the average increase in BDBR with 0.11% is not noticeable. It can be found that the proposed combination of QPMD and ETOI saves 50.14% coding running time on average, the maximum is 59.46% (Kimono), and the minimum is 41.56% (PartyScene). “Kimono” contains fewer motion scenes and has clearer textures, so it saves more time than other test videos. Meanwhile, the coding efficiency loss is small in Table 1. The average BDBR increase is 1.25% with a minimum of 0.49 % in “RaceHorses” and the average BDPSNR decrease is 0.095 dB with a minimum of 0.074 dB in “RaceHorses”; therefore, the proposed algorithm can reduce a lot of intra prediction time and has good RD performance.
In Table 2, we compare previous fast algorithms [35] on QTMT and efficient intra partitioning based on deep feature fusion and probability estimation [40] with our proposed QPMD method. It is noted that we did not combine the ETOI methods for comparison, owing to the improvement of ISP will greatly affect the results of the comparison of these methods. We use TS/BDBR to comprehensively evaluate the performance of the three algorithms. For the FQPD algorithm, the average BDBR and time savings are 1.63% and 49.27%, respectively. For the DFFPE algorithm, the average BDBR and time savings are 1.40% and 55.59%, respectively. In contrast, the average BDBR and time saving of our proposed QPMD method are 1.08% and 45.10%, respectively. From the final TS/BDBR results, our proposed QPMD algorithm outperforms the FQPD and DFFPE algorithm.
For individual experiments with quantitative control, we selected five test sequences of different resolutions. The five test sequences were the “Tango2” sequence with a resolution of 3840 × 2160, the “ParkScene” sequence with a resolution of 1920 × 1080, the “FourPeople” sequence with a resolution of 1280 × 720, the “BasketballDrill” sequence with a resolution of 832 × 480, and the “RaceHorses” sequence with a resolution of 416 × 240. The test results are shown in Table 3, compared to the H.266/VVC reference software with four QP values of 22, 27, 32, and 37. It shows that the proposed quantitative control algorithm can achieve 2.15–9.08% Bitrate-Reduction for the test sequences. The formula for bitrate savings is shown in Equation (14). At the same time, the average PSNR loss is controlled at 0.16–1.05%. The formula for average PSNR loss is shown in Equation (13). The average time saving is 0.33%, which indicates that the quantization control algorithm reduces the bitrate while keeping the PSNR loss and computational complexity basically unchanged. At the same time, we calculated the average value of the indicators under different QP values for different video resolutions. As can be seen from Table 3, both the average PSNR-Loss and the average bitrate reduction remain at a stable level. The more non-target area occupies, the more bitrate is reduced. For example, the Bitrate-Reduction in the sequences “FouePeople” and “RaceHorses” are 6.33% and 6.65%. It is also observed in Table 3 that the bitrate reduction values are usually decreased as the QP value increases for the proposed method. This is because the distortions introduced by quantization errors are high enough at high QP values.
where and are the bitrates using the H.266/VVC reference software and the proposed method.
where and are the bitrates using the H.266/VVC reference software and the proposed method.
Furthermore, the comparative results with previous work are shown in Table 4. Relevant concepts regarding D-MOS are described in the subjective experimental Section 4.2. For Jiang’s work [27], the average bitrate saving and Delta MOS are 3.3%, 0.2, respectively. For Zhu’s work [41], the average bitrate saving and Delta MOS are 3.9%, 0.1, respectively. In contrast, the average bitrate can be reduced by 4.9% and the Delta MOS is 0.1 for the quantization control scheme. From this comparison, it can be observed that the proposed method is better than other two methods.
The fast CU division algorithm processes the video frame processed by the saliency model to obtain the final block division size. The quantization control algorithm dynamically adjusts the QP value according to the saliency level of the final block. We combine the two algorithms as a whole and use the advantages of the two algorithms to reduce the computational complexity and bitrate. Besides AI configuration, the coding experiments are also conducted under low delay P (LDP) and random access (RA) configuration. The experimental results are shown in Table 5, the bitrate can be reduced by 3.68% while the Bjontegarrd Delta PSNR loss is only 0.124 dB on average. Meanwhile, compared with the baseline algorithm, the method achieves an average time saving of 47.19%. In both LDP and RA configurations, bitrate saving and encoding time reductions are slightly worse than AI configurations. This is because our experiments mainly revolve around intra prediction, including CU partition and quantization control; therefore, our experimental scheme chooses AI configuration instead of LDP and RA configuration. For videos in which the target area and non-target area are clearly distinguished and the texture of the background area is relatively simple, our algorithm can perform better. The maximum time reduction is 56.14% in “Kimono” of class B video and the minimum is 38.62% in “BlowingBubbles” of class D video. For the sequences “BQMall” and “FourPeople”, the time savings are also as high as 55.38% and 54.29%, while the BS is reduced by 3.11% and 2.85%. The comparison results show that the combination of these two algorithms can reduce the computational complexity and bitrate very well.
The comparison of the RD performance of the proposed method with VTM 12.0 in the test video is shown in Figure 9. It is observed that the proposed scheme can achieve consistent performance in terms of RD performance compared with VTM 12.0.
4.2. Subjective Experimental Results
To assess the subjective quality differences among VVC reference software VTM 12.0 and the proposed algorithm for each test sequence, the double stimulus continuous quality scale (DSCQS) method is used in our subjective quality evaluation test. The subjects are presented with pairs of video sequences, where the first sequence is the H.266/VVC reference video and the second sequence is the video with the proposed method. A total of 30 naive viewers participated in the test event, all receiving the correct levels of vision and color vision. Viewers were asked to mark their visual quality scores on the response form with the quality rating scale defined in Table 6. The subjective evaluation of video quality is evaluated by the difference mean opinion score (MOS) average Delta MOS (D-MOS), which is calculated as
where and are the measured MOS values from the sequence encoded by the H.266/VVC reference software VTM 12.0 and the proposed method.
The smaller the absolute DMOS value, the closer the subjective quality is to the original VTM12.0. The subjective quality test results are shown in Table 7. As can be seen from Table 7, the MOS values of our proposed method are very close to VTM12.0, and most of the DMOS absolute values are less than 0.1. This means that our proposed method has almost the same perceptual quality as the original VVC software VTM12.0.
To sum up, from the objective and subjective test results, compared with the H.266/VVC reference model, the proposed perceptual video coding scheme can achieve a higher compression effect under the condition of subjective and objective quality balance.
5. Conclusions
The VVC optimization scheme consisting of a perceptual fast CU division algorithm and quantitative control algorithm is proposed in this paper. We use a video salient object detection model via fully convolutional networks to obtain saliency maps in the preprocessing stage of video encoding. Based on the computed saliency values at the CU level, we propose a fast CU partition scheme, including the redetermination of the CU division depth by calculating Scharr operator and variance, as well as the executive decision for intra sub-partitions, to alleviate intra encoding complexity. Furthermore, a quantization control algorithm is proposed by adjusting the quantization parameter based on multi-level classification of saliency values at the CU level to reduce the bitrate. The experiment results show that the proposed perceptual methods in this paper achieve significant time reduction and bitrate saving with minimal coding efficiency loss and perceptual quality loss.
Author Contributions
Conceptualization, W.L. and X.J.; methodology, W.L. and X.J.; software, W.L.; validation, W.L. and X.J.; formal analysis, W.L. and J.J.; writing—original draft preparation, W.L.; writing—review and editing, W.L. and X.J.; visualization, W.L.; supervision, X.J., T.S. and F.R.Y.; funding acquisition, X.J. All authors have read and agreed to the published version of the manuscript.
Funding
This research was funded by National Natural Science Foundation of China grant number 61701297.
Institutional Review Board Statement
Not applicable.
Informed Consent Statement
Not applicable.
Data Availability Statement
Not applicable.
Conflicts of Interest
The authors declare no conflict of interest. The funders had no role in the design of the study; in the collection, analyses, or interpretation of data; in the writing of the manuscript; or in the decision to publish the results.
References
- Bross, B.; Chen, J.; Liu, S. Versatile Video Coding (Draft 5). Document: JVET-N1001-v10 Geneva, 19–27 March 2019. Available online: https://jvet-experts.org/ (accessed on 19 June 2022).
- Lim, S.C.; Kim, D.Y.; Kang, J. Simplification on Cross-Component Linear Model in Versatile Video Coding. Electronics 2020, 9, 1885. [Google Scholar] [CrossRef]
- Chen, J.; Ye, Y.; Kim, S. Algorithm description for Versatile Video Coding and Test Model 12 (VTM 12). Document: JVET-U2002-v1 Brussels, 6–15 January 2021. Available online: https://jvet-experts.org/ (accessed on 19 June 2022).
- Alshina, E.; Chen, J. Algorithm Description for Versatile Video Coding and Test Model 1 (VTM 1). Document JVET-Jl002-v2 San Diego, US, 10–20 April 2018. Available online: https://jvet-experts.org/ (accessed on 19 June 2022).
- Bae, S.H.; Kim, J.; Kim, M. HEVC-based perceptually adaptive video coding using a DCT-based local distortion detection probability model. IEEE Trans. Image Proc. 2016, 25, 3343–3357. [Google Scholar] [CrossRef] [PubMed]
- Kim, J.; Lee, D.Y.; Jeong, S.; Cho, S. Perceptual Video Coding using Deep Neural Network Based JND Model. In Proceedings of the 2020 Data Compression Conference (DCC), Snowbird, UT, USA, 24–27 March 2020; p. 375. [Google Scholar]
- Xiang, G.; Jia, H.; Wei, K.; Yang, F.; Li, Y.; Xie, X. Rate SSIM Based Preprocessing for Video Coding. In Proceedings of the 2020 IEEE International Conference on Consumer Electronics (ICCE), Las Vegas, NV, USA, 4–6 January 2020; pp. 1–5. [Google Scholar]
- Zheng, J.; Zhen, X. Perceptual based adaptive frequency weighting for subjective quality improvement. In Proceedings of the 2012 IEEE International Conference on Signal Processing, Communication and Computing (ICSPCC 2012), Hong Kong, China, 12–15 August 2012; pp. 349–352. [Google Scholar]
- Cheng, M.M.; Mitra, N.J.; Huang, X.; Torr, P.H.; Hu, S.M. Global contrast based salient region detection. IEEE Trans. Pattern Anal. Mach. Intell. 2015, 37, 569–582. [Google Scholar] [CrossRef] [PubMed]
- Yang, C.; Zhang, L.; Lu, H.; Ruan, X.; Yang, M.H. Saliency Detection via Graph-Based Manifold Ranking. In Proceedings of the 2013 IEEE Conference on Computer Vision and Pattern Recognition, Portland, OR, USA, 23–28 June 2013; pp. 3166–3173. [Google Scholar]
- Jiang, Z.; Davis, L.S. Submodular Salient Region Detection. In Proceedings of the IEEE Conference on Computer Vision and Pattern Recognition, Portland, OR, USA, 23–28 June 2013; pp. 2043–2050. [Google Scholar]
- Leborán, V.; García-Díaz, A.; Fdez-Vidal, X.R.; Pardo, X.M. Dynamic Whitening Saliency. IEEE Trans. Pattern Anal. Mach. Intell. 2017, 39, 893–907. [Google Scholar] [CrossRef]
- Fang, Y.; Wang, Z.; Lin, W.; Fang, Z. Video Saliency Incorporating Spatiotemporal Cues and Uncertainty Weighting. IEEE Trans. Image Process. 2014, 23, 3910–3921. [Google Scholar] [CrossRef]
- Simonyan, K.; Zisserman, A. Two-stream convolutional networks for action recognition in videos. arXiv 2014, arXiv:1406.2199v1. [Google Scholar]
- Imamoglu, N.; Oishi, Y.; Zhang, X.; Ding, G.; Fang, Y.; Kouyama, T.; Nakamura, R. Hyperspectral Image Dataset for Benchmarking on Salient Object Detection. In Proceedings of the 2018 Tenth International Conference on Quality of Multimedia Experience (QoMEX), Cagliari, Italy, 29 May–1 June 2018; pp. 1–3. [Google Scholar]
- Jiang, L.; Xu, M.; Wang, Z. Predicting video saliency with object-to-motion CNNand two-layer convolutional LSTM. arXiv 2017, arXiv:1709.06316. [Google Scholar]
- Shen, L.; Zhang, Z.; Liu, Z. Effective CU Size Decision for HEVC Intracoding. IEEE Trans. Image Process. 2014, 23, 4232–4241. [Google Scholar] [CrossRef]
- Yang, H.; Shen, L.; Dong, X.; Ding, Q.; An, P.; Jiang, G. Low-Complexity CTU Partition Structure Decision and Fast Intra Mode Decision for Versatile Video Coding. IEEE Trans. Circuits Syst. Video Technol. 2020, 30, 1668–1682. [Google Scholar] [CrossRef]
- Huade, S.; Fan, L.; Huanbang, C. A fast CU size decision algorithm based on adaptive depth selection for HEVC encoder. In Proceedings of the 2014 International Conference on Audio, Language and Image Processing, Shanghai, China, 7–9 July 2014; pp. 143–146. [Google Scholar]
- Fu, T.; Zhang, H.; Mu, F.; Chen, H. Fast CU partitioning algorithm for H.266/VVC intra-frame coding. In Proceedings of the 2019 IEEE International Conference on Multimedia and Expo (ICME), Shanghai, China, 8–12 July 2019; pp. 55–60. [Google Scholar]
- Xu, M.; Li, T.; Wang, Z.; Deng, X.; Yang, R.; Guan, Z. Reducing Complexity of HEVC: A Deep Learning Approach. IEEE Trans. Image Process. 2018, 27, 5044–5059. [Google Scholar] [CrossRef]
- Galpin, F.; Racapé, F.; Jaiswal, S.; Bordes, P.; Léannec, F.L.; François, E. CNN-Based Driving of Block Partitioning for Intra Slices Encoding. In Proceedings of the 2019 Data Compression Conference (DCC), Snowbird, UT, USA, 26–29 March 2019; pp. 162–171. [Google Scholar]
- Fischer, K.; Fleckenstein, F.; Herglotz, C.; Kaup, A. Saliency-Driven Versatile Video Coding for Neural Object Detection. In Proceedings of the ICASSP 2021—2021 IEEE International Conference on Acoustics, Speech and Signal Processing (ICASSP), Toronto, ON, Canada, 6–11 June 2021; pp. 1505–1509. [Google Scholar]
- Wang, M.; Zhang, T.; Liu, C.; Goto, S. Region-of-interest based dynamical parameter allocation for H.264/AVC encoder. In Proceedings of the Picture Coding Symposium, Chicago, IL, USA, 6–8 May 2009. [Google Scholar]
- Wang, X.; Su, L.; Huang, Q.; Liu, C. Visual perception based Lagrangian rate distortion optimization for video coding. In Proceedings of the 18th IEEE International Conference on Image Processing, Brussels, Belgium, 11–14 September 2011; pp. 1653–1656. [Google Scholar]
- Wang, H.; Zhang, D.; Li, H. A rate-distortion optimized coding method for region of interest in scalable video coding. Adv. Multimedia 2015, 2015, 1–11. [Google Scholar] [CrossRef]
- Jiang, X.; Song, T.; Zhu, D.; Katayama, T.; Wang, L. Quality-Oriented Perceptual HEVC Based on the Spatiotemporal Saliency Detection Model. Entropy 2019, 21, 165. [Google Scholar] [CrossRef] [PubMed]
- Nami, S.; Pakdaman, F.; Hashemi, M.R. Juniper: A Jnd-Based Perceptual Video Coding Framework to Jointly Utilize Saliency and JND. In Proceedings of the 2020 IEEE International Conference on Multimedia Expo Workshops (ICMEW), London, UK, 6–10 July 2020; pp. 1–6. [Google Scholar]
- Wang, W.; Shen, J.; Shao, L. Video Salient Object Detection via Fully Convolutional Networks. IEEE Trans. Image Process. 2018, 27, 38–49. [Google Scholar] [CrossRef] [PubMed]
- Simonyan, W.; Zisserman, A. Very deepconvolutional networks for large-scale image recognition. arXiv 2014, arXiv:1409.1556. [Google Scholar]
- Russakovsky, O.; Deng, J.; Su, H. ImageNet large scale visual recognition challenge. Int. J. Comput. Vis. 2015, 115, 211–252. [Google Scholar] [CrossRef]
- Liu, T.; Sun, J. Learning to detect a salient object. IEEE Trans. Pattern Anal. Mach. Intell. 2010, 33, 353–367. [Google Scholar]
- Brox, T.; Malik, J. Object segmentation by long term analysis of point trajectories. In European Conference on Computer Vision; Springer: Berlin/Heidelberg, Germany, 2010; pp. 282–295. [Google Scholar]
- Li, F.; Kim, T.; Humayun, A. Video segmentation by tracking many figure-ground segments. In Proceedings of the 2013 IEEE International Conference on Computer Vision (ICCV), Washington, DC, USA, 1–8 December 2013; pp. 2192–2199. [Google Scholar]
- Fan, Y.; Chen, J.; Sun, H.; Katto, J.; Jing, M. A Fast QTMT Partition Decision Strategy for VVC Intra Prediction. IEEE Access 2020, 8, 107900–107911. [Google Scholar] [CrossRef]
- Zhon, X.; Shi, G.; Zhon, W.; Duan, Z. Visual saliency-based fast intra coding algorithm for high efficiency video coding. J. Electron. Imaging 2017, 26, 013019. [Google Scholar]
- Liu, Z.; Dong, M.; Guan, X.H.; Zhang, M.; Wang, R. Fast ISP coding mode optimization algorithm based on CU texture complexity for VVC. EURASIP J. Image Video Process. 2021, 2021, 1–14. [Google Scholar] [CrossRef]
- Bossen, F.; Boyce, J.; Suehing, X.; Li, X.; Seregin, V. JVET Common Test Conditions and Software Reference Configurations for SDR Video. Document: JVET-N1010 Geneva, 19–27 March 2019. Available online: https://jvet-experts.org/ (accessed on 19 June 2022).
- Bjontegaard, G. Calculation of average PSNR difference between RD-curves. In Proceedings of the 13th VCEG-M33 Meeting, Austin, TX, USA, 2–4 April 2001. [Google Scholar]
- Zhao, T.; Huang, Y.; Feng, W.; Xu, Y. Efficient VVC Intra Prediction Based on Deep Feature Fusion and Probability Estimation. arXiv 2022, arXiv:2205.03587v1. [Google Scholar]
- Zhu, L.; Zhang, Y.; Li, N. Deep Learning-Based Intra Mode Derivation for Versatile Video Coding. arXiv 2022, arXiv:2204.04059v1. [Google Scholar]
Figure 1.
Five division modes of QTMT and two examples of ISP.
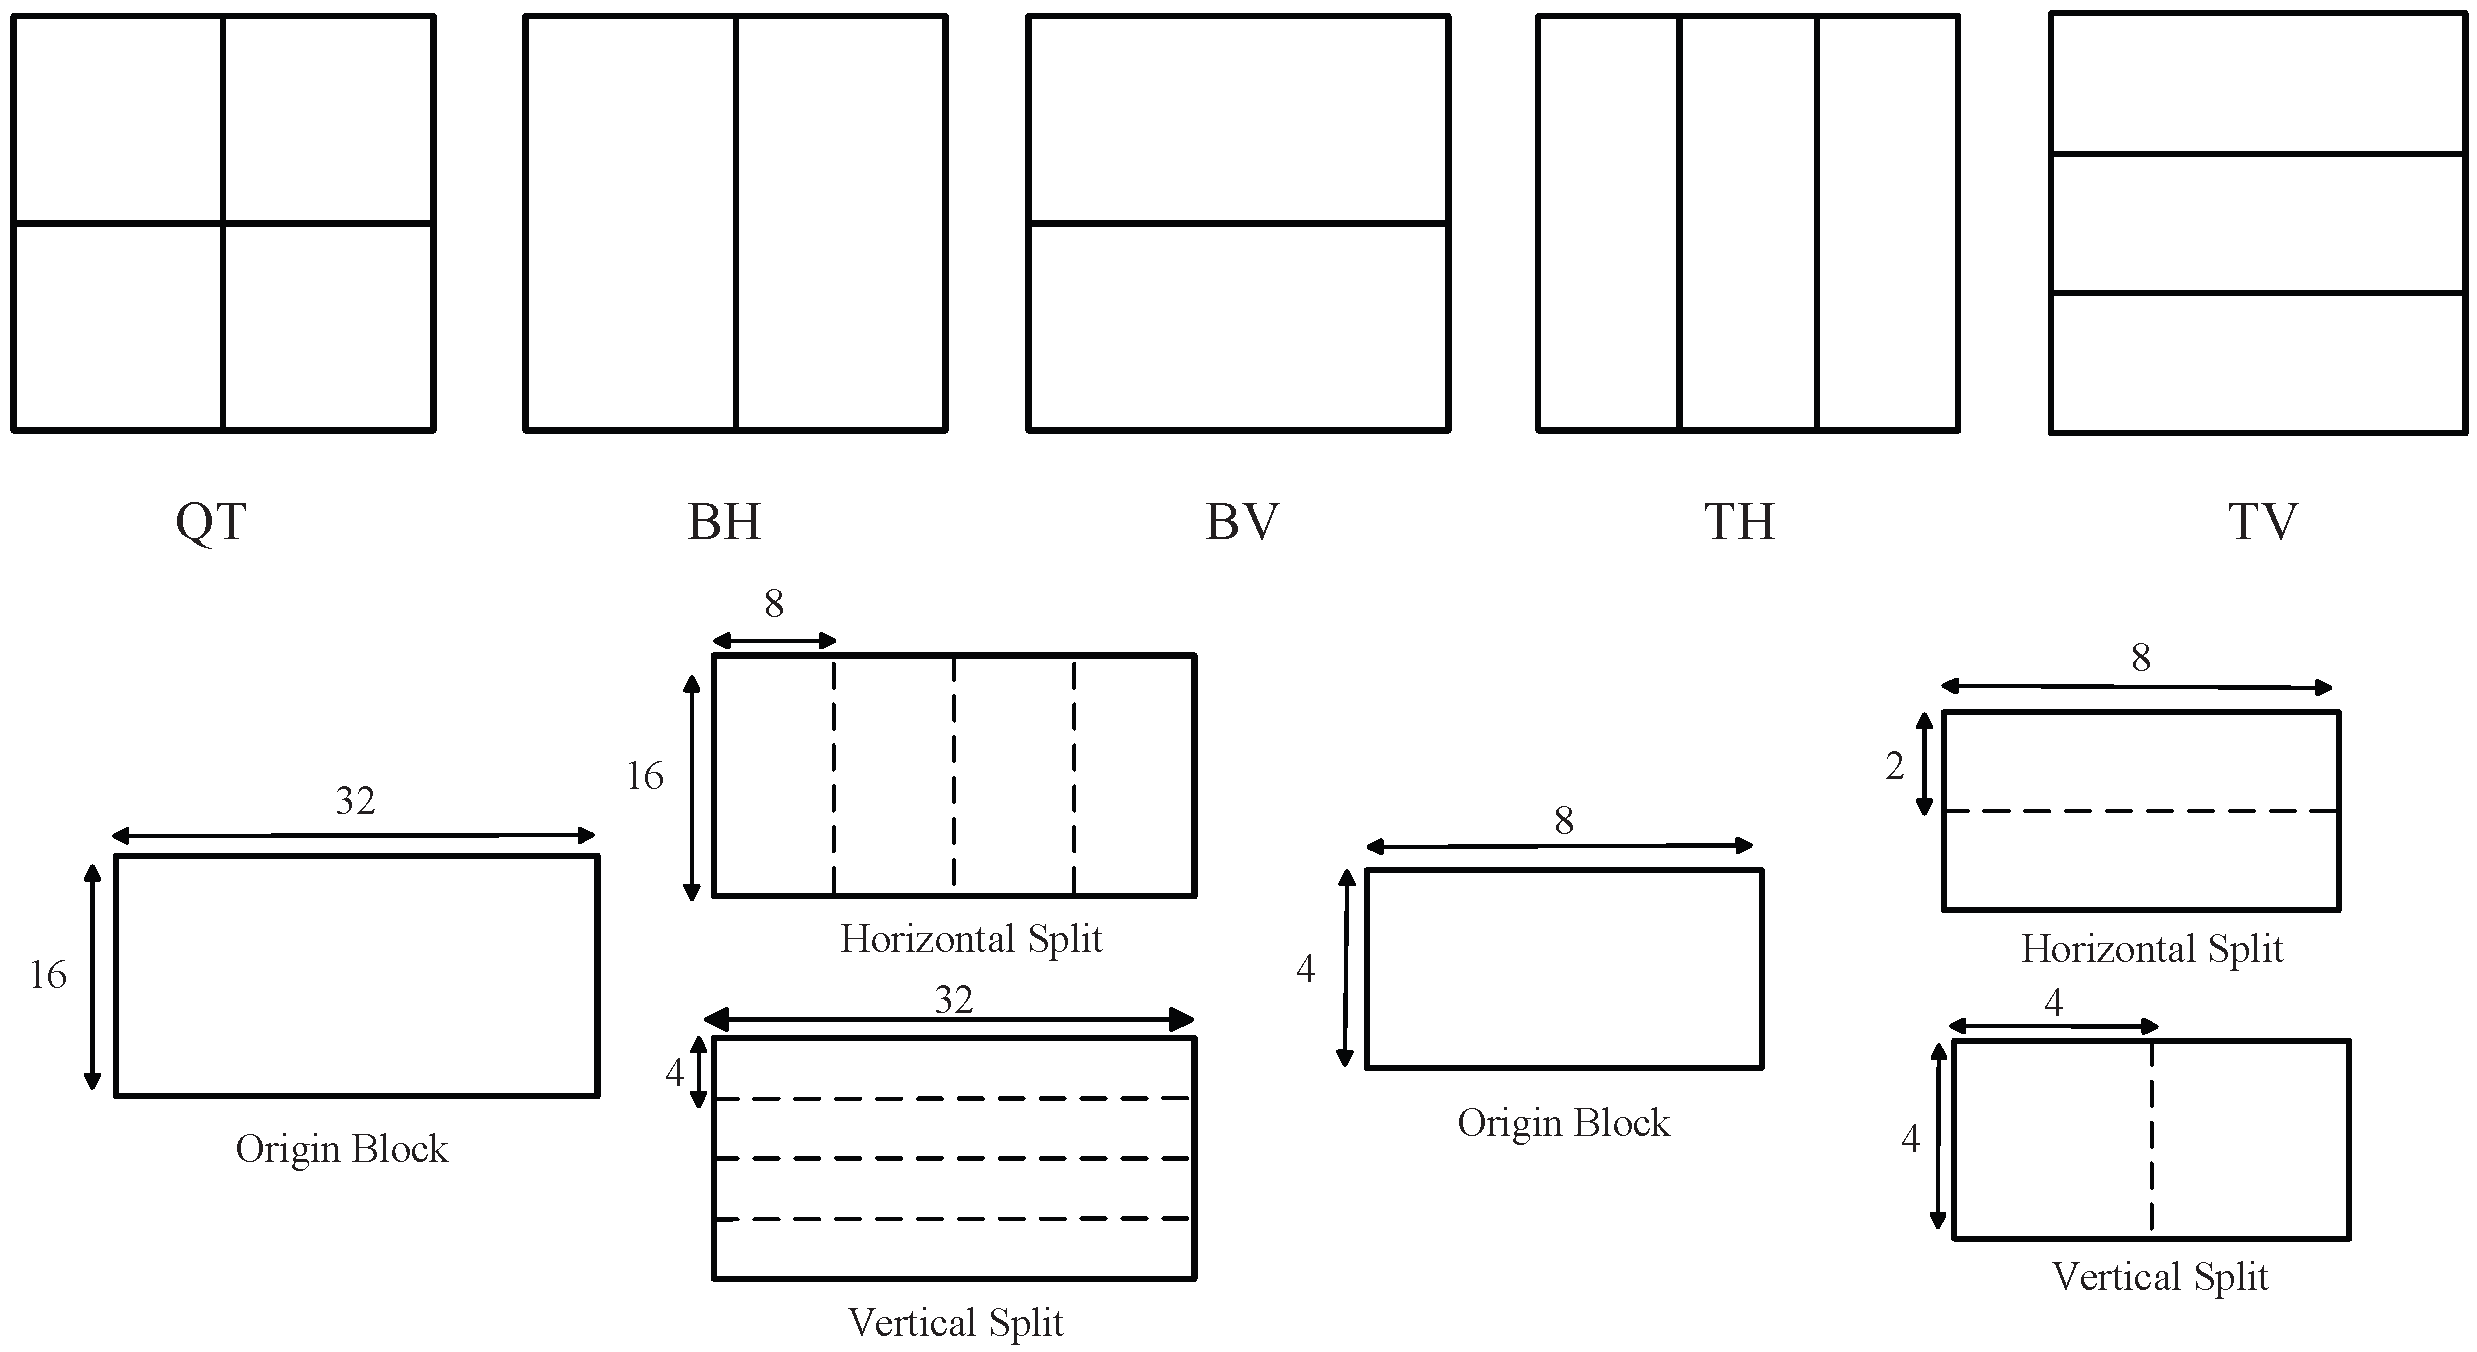
Figure 2.
Traditional video coding framework and proposed perceptual video coding framework.

Figure 3.
Illustration of network for static saliency detection.

Figure 4.
Illustration of our network for dynamic saliency detection.

Figure 5.
VS map of Basketball and Kimono sequence.

Figure 6.
Flowchart of fast CU partitioning algorithm.

Figure 7.
Training results of two thresholds concerning both BDBR and time saving.

Figure 8.
Mapping relationship between the saliency range and complexity grade.

Figure 9.
RD performance of the proposed method. (a) RD of “PartyScene”. (b) RD of “FourPeople”.


Table 1.
Performance of the QPMD and ETOI algorithm.
| Class | Sequence | QPMD | ETOI | QPMD + ETOI | ||||||
|---|---|---|---|---|---|---|---|---|---|---|
| BDBR (%) | BDPSNR | TS (%) | BDBR (%) | BDPSNR | TS (%) | BDBR (%) | BDPSNR | TS (%) | ||
| A1 | Tango2 | 1.33 | −0.051 | −43.98 | 0.04 | −0.032 | −7.35 | 1.52 | −0.097 | −53.53 |
| FoodMarket4 | 0.62 | −0.077 | −46.53 | 0.07 | −0.041 | −7.24 | 0.94 | −0.125 | −56.07 | |
| Campfire | 0.95 | −0.058 | −42.67 | 0.12 | −0.038 | −6.58 | 1.39 | −0.084 | −49.67 | |
| A2 | CatRobot | 1.05 | −0.045 | −49.07 | 0.05 | −0.035 | −6.11 | 1.21 | −0.109 | −56.66 |
| DaylightRoad2 | 0.43 | −0.036 | −41.19 | 0.09 | −0.029 | −8.13 | 0.77 | −0.086 | −50.73 | |
| ParkRunning3 | 0.82 | −0.109 | −49.66 | 0.12 | −0.032 | −8.45 | 1.28 | −0.069 | −57.64 | |
| B | BasketballDrive | 0.99 | −0.072 | −38.73 | 0.07 | −0.039 | −6.36 | 1.25 | −0.118 | −42.56 |
| BQTerrace | 1.72 | −0.083 | −52.11 | 0.12 | −0.027 | −4.47 | 1.68 | −0.094 | −48.19 | |
| Cactus | 2.25 | −0.114 | −42.06 | 0.14 | −0.032 | −5.39 | 2.37 | −0.127 | −48.91 | |
| Kimono | 1.44 | −0.041 | −51.47 | 0.08 | −0.019 | −6.23 | 1.83 | −0.096 | −59.46 | |
| ParkScene | 0.57 | −0.163 | −46.72 | 0.06 | −0.021 | −5.62 | 0.64 | −0.103 | −43.17 | |
| C | BasketballDrill | 1.12 | −0.027 | −47.38 | 0.24 | −0.029 | −9.41 | 1.26 | −0.085 | −52.11 |
| BQMall | 0.77 | −0.047 | −51.46 | 0.10 | −0.042 | −7.43 | 1.17 | −0.099 | −58.19 | |
| PartyScene | 1.09 | −0.052 | −37.62 | 0.08 | −0.023 | −8.21 | 1.15 | −0.087 | −41.56 | |
| RaceHorsesC | 1.34 | −0.057 | −50.52 | 0.04 | −0.020 | −5.72 | 1.22 | −0.083 | −48.39 | |
| D | BasketballPass | 1.16 | −0.093 | −44.27 | 0.09 | −0.018 | −6.07 | 0.84 | −0.108 | −52.01 |
| BlowingBubbles | 1.13 | −0.081 | −38.51 | 0.01 | −0.031 | −4.29 | 1.06 | −0.095 | −44.56 | |
| BQSquare | 0.36 | −0.059 | −32.75 | 0.18 | −0.029 | −6.08 | 0.57 | −0.091 | −39.24 | |
| RaceHorses | 0.54 | −0.032 | −36.87 | 0.15 | −0.025 | −5.39 | 0.49 | −0.074 | −41.65 | |
| E | FourPeople | 1.31 | −0.034 | −49.26 | 0.19 | −0.034 | −6.75 | 1.55 | −0.087 | −53.19 |
| Johnny | 2.07 | −0.063 | −47.39 | 0.12 | −0.029 | −6.22 | 1.97 | −0.094 | −50.24 | |
| KristenAndSara | 0.78 | −0.038 | −42.55 | 0.16 | −0.023 | −7.93 | 1.37 | −0.081 | −55.32 | |
| Average | 1.08 | −0.065 | −44.67 | 0.11 | −0.029 | −6.61 | 1.25 | −0.095 | −50.14 | |
Table 2.
Coding performance of the proposed QPMD algorithm compared to DFFPE and FQPD.
| Class | Sequence | FQPD [35] | DFFPE [40] | Proposed QPMD | ||||||
|---|---|---|---|---|---|---|---|---|---|---|
| BDBR (%) | TS (%) | TS/BDBR | BDBR (%) | TS (%) | TS/BDBR | BDBR (%) | TS (%) | TS/BDBR | ||
| A1 | Tango2 | - | - | - | 1.33 | −67.02 | −50.39 | 1.33 | −43.98 | −33.07 |
| FoodMarket4 | - | - | - | 0.97 | −53.17 | −54.81 | 0.62 | −46.53 | −75.05 | |
| Campfire | - | - | - | 1.56 | −57.32 | −36.74 | 0.95 | −42.67 | −44.92 | |
| A2 | CatRobot | - | - | - | 1.63 | −63.18 | −38.76 | 1.05 | −49.07 | −46.73 |
| DaylightRoad2 | - | - | - | 1.23 | −62.88 | −51.12 | 0.43 | −41.19 | −95.79 | |
| ParkRunning3 | - | - | - | 0.88 | −59.52 | −67.64 | 0.82 | −49.66 | −60.56 | |
| B | BasketballDrive | 3.28 | −59.35 | −18.09 | 1.53 | −60.35 | −39.44 | 0.99 | −38.73 | −39.12 |
| BQTerrace | 1.08 | −45.30 | −41.94 | 1.16 | −56.19 | −48.44 | 1.72 | −62.11 | −36.11 | |
| Cactus | 1.84 | −52.44 | −28.50 | 1.78 | −62.98 | −35.38 | 2.25 | −42.06 | −18.69 | |
| Kimono | 1.93 | −59.51 | −30.83 | 0.93 | −67.04 | −72.09 | 1.44 | −51.47 | −35.74 | |
| ParkScene | 1.26 | −51.84 | −41.14 | 1.47 | −59.66 | −40.59 | 0.57 | −46.72 | −81.96 | |
| C | BasketballDrill | 1.82 | −48.48 | −26.64 | 1.99 | −48.91 | −24.58 | 1.12 | −40.06 | −35.77 |
| BQMall | 1.87 | −52.47 | −28.06 | 2.02 | −51.22 | −25.36 | 0.77 | −51.46 | 66.83 | |
| PartyScene | 0.26 | −38.62 | −148.54 | 0.87 | −49.86 | −57.31 | 1.09 | −49.37 | −45.29 | |
| RaceHorsesC | 0.88 | −49.05 | −55.74 | 1.27 | −49.98 | −39.35 | 1.34 | −53.52 | −39.94 | |
| D | BasketballPass | 1.95 | −47.70 | −24.46 | 1.54 | −43.62 | −28.32 | 1.16 | −44.27 | −38.16 |
| BlowingBubbles | 0.47 | −40.35 | −85.85 | 0.91 | −39.74 | −43.67 | 1.13 | −38.51 | −34.08 | |
| BQSquare | 0.19 | −31.95 | −168.16 | 0.79 | −45.31 | −57.35 | 0.36 | −32.75 | −90.97 | |
| RaceHorses | 0.54 | −41.69 | −77.20 | 1.09 | −48.93 | −44.89 | 0.54 | −36.87 | −68.28 | |
| E | FourPeople | 2.70 | −57.57 | −21.32 | 1.97 | −58.45 | −29.67 | 1.31 | −49.26 | −37.60 |
| Johnny | 3.22 | −56.88 | −17.66 | 2.05 | −59.37 | −28.96 | 2.07 | −47.39 | −22.89 | |
| KristenAndSara | 2.78 | −55.11 | −19.82 | 1.90 | −58.21 | −30.64 | 0.78 | −34.55 | −44.29 | |
| Average | 1.63 | −49.27 | −30.23 | 1.40 | −55.59 | −39.71 | 1.08 | −45.10 | −41.75 | |
Table 3.
Performance comparison of quantization control algorithm and VVC reference software.
| Sequence | PSNR (dB) | Bitrate (kbps) | PSNR-Loss (%) | Bitrate-Reduction (%) | Time-Saving (%) | |||
|---|---|---|---|---|---|---|---|---|
| QP | VTM12.0 | Proposed | VTM12.0 | Proposed | ||||
| Tango2 (3840 × 2160) | 22 | 42.53 | 42.14 | 20,453.24 | 19,318.37 | 0.92 | 5.55 | 2.63 |
| 27 | 39.25 | 38.91 | 9862.77 | 9340.74 | 0.87 | 5.29 | 1.14 | |
| 32 | 36.86 | 36.67 | 5363.15 | 5124.33 | 0.52 | 4.45 | 0.82 | |
| 37 | 35.13 | 34.99 | 2147.82 | 2096.51 | 0.40 | 2.39 | −1.87 | |
| Average | 38.44 | 38.18 | 9456.7 | 8969.99 | 0.68 | 5.15 | 0.68 | |
| ParkScene (1920 × 1080) | 22 | 42.98 | 42.53 | 5969.62 | 5619.67 | 1.05 | 5.86 | 2.94 |
| 27 | 40.21 | 39.88 | 3123.58 | 2968.39 | 0.82 | 4.97 | 1.13 | |
| 32 | 37.59 | 37.35 | 1638.48 | 1576.05 | 0.64 | 3.81 | −1.47 | |
| 37 | 34.92 | 34.74 | 819.55 | 788.90 | 0.52 | 3.74 | −1.20 | |
| Average | 38.93 | 38.63 | 2887.81 | 2738.25 | 0.77 | 5.18 | 0.35 | |
| FourPeople (1280 × 720) | 22 | 45.54 | 45.27 | 3381.30 | 3074.26 | 0.59 | 9.08 | 0.25 |
| 27 | 43.21 | 43.03 | 2067.96 | 1982.41 | 0.42 | 4.14 | −1.82 | |
| 32 | 40.61 | 40.52 | 1278.90 | 1250.38 | 0.22 | 2.23 | −2.63 | |
| 37 | 37.71 | 37.65 | 782.88 | 766.05 | 0.16 | 2.15 | −3.19 | |
| Average | 41.77 | 41.62 | 1877.76 | 1768.28 | 0.36 | 6.33 | −1.85 | |
| BasketballDrill (832 × 480) | 22 | 43.52 | 43.29 | 2225.65 | 2101.77 | 0.53 | 5.57 | 4.21 |
| 27 | 40.38 | 40.21 | 1170.70 | 1112.98 | 0.42 | 4.93 | 0.77 | |
| 32 | 37.56 | 37.46 | 614.05 | 599.80 | 0.27 | 2.32 | −0.94 | |
| 37 | 35.13 | 35.07 | 339.40 | 331.65 | 0.17 | 2.28 | −1.36 | |
| Average | 39.15 | 39.01 | 1087.45 | 1036.55 | 0.36 | 4.68 | 0.67 | |
| RaceHorses (416 × 240) | 22 | 43.52 | 43.15 | 615.27 | 562.17 | 0.85 | 8.63 | 2.33 |
| 27 | 39.57 | 39.33 | 384.84 | 361.17 | 0.61 | 6.15 | 2.54 | |
| 32 | 35.88 | 35.72 | 223.62 | 215.26 | 0.45 | 3.74 | 1.18 | |
| 37 | 32.60 | 32.48 | 120.12 | 115.89 | 0.37 | 3.52 | 1.15 | |
| Average | 37.89 | 37.67 | 335.96 | 313.62 | 0.58 | 6.65 | 1.80 | |
| Total Average | 39.24 | 39.02 | 3129.15 | 2965.34 | 0.56 | 5.23 | 0.33 | |
Table 4.
Comparison of rate and Delta MOS values.
| Sequence | Jiang [27] | Zhu [41] | Proposed | |||
|---|---|---|---|---|---|---|
| BS (%) | D-MOS | BS (%) | D-MOS | BS (%) | D-MOS | |
| BQTerrace | 5.9 | 0.1 | 6.8 | 0.1 | 7.2 | 0.1 |
| ParkScene | 3.3 | 0.1 | 4.1 | 0.1 | 4.5 | 0.0 |
| BasketballDrill | 1.8 | 0.3 | 0.9 | 0.2 | 3.7 | 0.1 |
| RaceHorsesC | 2.1 | 0.1 | 3.8 | 0.1 | 4.3 | 0.2 |
| Average | 3.3 | 0.2 | 3.9 | 0.1 | 4.9 | 0.1 |
Table 5.
Performances of the overall algorithm under AI, LDP, and RA configurations.
| Class | Sequence | AI Configuration | LDP Configuration | RA Configuration | ||||||
|---|---|---|---|---|---|---|---|---|---|---|
| BDPSNR | BS (%) | TS (%) | BDPSNR | BS (%) | TS (%) | BDPSNR | BS (%) | TS (%) | ||
| A1 | Tango2 | −0.134 | 3.23 | −46.24 | −0.142 | 3.16 | −45.36 | −0.145 | 3.07 | −45.24 |
| FoodMarket4 | −0.151 | 2.98 | −48.37 | −0.153 | 2.84 | −47.42 | −0.162 | 2.92 | −46.69 | |
| Campfire | −0.117 | 4.12 | −41.33 | −0.121 | 4.29 | −40.29 | −0.116 | 4.33 | −40.17 | |
| A2 | CatRobot | −0.145 | 3.64 | −49.26 | −0.154 | 3.13 | −48.64 | −0.147 | 3.27 | −48.92 |
| DaylightRoad2 | −0.093 | 3.71 | −46.11 | −0.095 | 3.52 | −44.88 | −0.099 | 3.36 | −44.54 | |
| ParkRunning3 | −0.082 | 3.66 | −48.87 | −0.092 | 3.91 | −49.29 | −0.103 | 3.67 | −46.76 | |
| B | BasketballDrive | −0.142 | 4.09 | −40.32 | −0.151 | 3.87 | −40.13 | −0.154 | 3.91 | −39.95 |
| BQTerrace | −0.163 | 5.18 | −45.57 | −0.172 | 4.85 | −44.61 | −0.165 | 4.64 | −45.07 | |
| Cactus | −0.158 | 4.37 | −45.24 | −0.164 | 4.16 | −44.54 | −0.154 | 3.96 | −44.27 | |
| Kimono | −0.147 | 3.92 | −56.14 | −0.151 | 3.61 | −54.32 | −0.157 | 3.95 | −54.12 | |
| ParkScene | −0.159 | 3.17 | −40.62 | −0.146 | 3.02 | −39.37 | −0.141 | 2.88 | −40.09 | |
| C | BasketballDrill | −0.098 | 2.61 | −44.03 | −0.083 | 2.48 | −45.12 | −0.086 | 2.65 | −44.83 |
| BQMall | −0.146 | 3.11 | −55.38 | −0.152 | 3.27 | −54.67 | −0.161 | 3.04 | −54.24 | |
| PartyScene | −0.062 | 3.64 | −52.74 | −0.071 | 3.38 | −54.58 | −0.073 | 3.17 | −55.21 | |
| RaceHorsesC | −0.153 | 4.23 | −54.16 | −0.144 | 3.81 | −53.36 | −0.135 | 3.92 | −52.85 | |
| D | BasketballPass | −0.135 | 2.97 | −48.39 | −0.142 | 2.64 | −47.72 | −0.145 | 2.57 | −46.39 |
| BlowingBubbles | −0.091 | 3.49 | −38.62 | −0.099 | 3.10 | −39.28 | −0.104 | 2.83 | −40.23 | |
| BQSquare | −0.124 | 4.52 | −40.27 | −0.135 | 4.24 | −39.31 | −0.127 | 4.01 | −38.56 | |
| RaceHorses | −0.113 | 3.17 | −43.25 | −0.123 | 3.06 | −42.15 | −0.131 | 3.23 | −41.37 | |
| E | FourPeople | −0.094 | 2.85 | −54.29 | −0.108 | 3.21 | −53.67 | −0.109 | 3.46 | −52.09 |
| Johnny | −0.105 | 4.21 | −48.81 | −0.112 | 3.98 | −47.39 | −0.121 | 3.74 | −46.86 | |
| KristenAndSara | −0.109 | 4.01 | −50.06 | −0.115 | 3.87 | −49.02 | −0.117 | 3.63 | −48.77 | |
| Average | −0.124 | 3.68 | −47.19 | −0.128 | 3.52 | −46.60 | −0.130 | 3.46 | −46.24 | |
Table 6.
MOS of scale.
| Scale | MOS |
|---|---|
| Excellent | 100 to 80 |
| Good | 80 to 60 |
| Fair | 60 to 40 |
| Poor | 40 to 20 |
| Bad | 20 to 0 |
Table 7.
Results of DSCQS test.
| Class | Sequence | QP = 22 | QP = 27 | QP = 32 | QP = 37 |
|---|---|---|---|---|---|
| DMOS | DMOS | DMOS | DMOS | ||
| A1 | Tango2 | 0.06 | 0.08 | 0.16 | 0.14 |
| FoodMarket4 | 0.04 | 0.09 | 0.15 | 0.12 | |
| Campfire | 0.07 | 0.15 | 0.13 | 0.08 | |
| A2 | CatRobot | 0.09 | 0.12 | 0.08 | 0.15 |
| DaylightRoad2 | 0.07 | 0.06 | 0.09 | 0.11 | |
| ParkRunning3 | 0.06 | 0.04 | 0.11 | 0.06 | |
| B | BasketballDrive | 0.07 | 0.01 | 0.02 | 0.08 |
| BQTerrace | 0.06 | 0.08 | 0.09 | 0.02 | |
| Cactus | 0.08 | 0.17 | 0.08 | 0.12 | |
| Kimono | 0.11 | 0.13 | 0.15 | 0.17 | |
| ParkScene | 0.08 | 0.15 | 0.18 | 0.09 | |
| C | BasketballDrill | 0.07 | 0.08 | 0.08 | 0.15 |
| BQMall | 0.07 | 0.09 | 0.07 | 0.13 | |
| PartyScene | 0.07 | 0.08 | 0.09 | 0.15 | |
| RaceHorsesC | 0.08 | 0.10 | 0.12 | 0.13 | |
| D | BasketballPass | 0.09 | 0.07 | 0.03 | 0.07 |
| BlowingBubbles | 0.01 | 0.02 | 0.04 | 0.06 | |
| BQSquare | 0.03 | 0.06 | 0.07 | 0.08 | |
| RaceHorses | 0.09 | 0.08 | 0.09 | 0.11 | |
| E | FourPeople | 0.09 | 0.08 | 0.08 | 0.15 |
| Johnny | 0.08 | 0.01 | 0.03 | 0.09 | |
| KristenAndSara | 0.12 | 0.13 | 0.15 | 0.17 | |
| Average | 0.07 | 0.09 | 0.10 | 0.11 |
Publisher’s Note: MDPI stays neutral with regard to jurisdictional claims in published maps and institutional affiliations. |
© 2022 by the authors. Licensee MDPI, Basel, Switzerland. This article is an open access article distributed under the terms and conditions of the Creative Commons Attribution (CC BY) license (https://creativecommons.org/licenses/by/4.0/).
Share and Cite
MDPI and ACS Style
Li, W.; Jiang, X.; Jin, J.; Song, T.; Yu, F.R. Saliency-Enabled Coding Unit Partitioning and Quantization Control for Versatile Video Coding. Information 2022, 13, 394. https://doi.org/10.3390/info13080394
AMA Style
Li W, Jiang X, Jin J, Song T, Yu FR. Saliency-Enabled Coding Unit Partitioning and Quantization Control for Versatile Video Coding. Information. 2022; 13(8):394. https://doi.org/10.3390/info13080394
Chicago/Turabian StyleLi, Wei, Xiantao Jiang, Jiayuan Jin, Tian Song, and Fei Richard Yu. 2022. "Saliency-Enabled Coding Unit Partitioning and Quantization Control for Versatile Video Coding" Information 13, no. 8: 394. https://doi.org/10.3390/info13080394
Note that from the first issue of 2016, this journal uses article numbers instead of page numbers. See further details here.