
Developing Integrated Performance Dashboards Visualisations Using Power BI as a Platform


1
CEOS.PP, ISCAP, Polytechnic of Porto, LIACC University of Porto, 4200-465 Porto, Portugal
2
CEOS.PP, ISCAP, Polytechnic of Porto, OSEAN, University of Madeira, 4465-004 Porto, Portugal
3
ISCAP, Polytechnic of Porto, 4465-004 Porto, Portugal
*
Authors to whom correspondence should be addressed.
Information 2023, 14(11), 614; https://doi.org/10.3390/info14110614
Submission received: 24 October 2023
/
Revised: 7 November 2023
/
Accepted: 11 November 2023
/
Published: 15 November 2023
(This article belongs to the Special Issue Artificial Intelligence (AI) for Economics and Business Management)
Abstract
:The rapid advance of business technologies in recent years has made knowledge an essential and strategic asset that determines the success or failure of an organisation. Access to the right information in real time and with high selectivity can be a competitive advantage in the business environment. Business intelligence systems help corporate executives, business managers, and other operational workers make better and more informed business decisions. This study aimed to assess the impact of using business intelligence tools on the decision-making process in organisations, specifically in sales marketing. The methodology applied to realise the study’s objective was the Vercellis methodology. A set of data available on the sales marketing website SuperDataScience was used to implement a set of pressing KPIs for the business decision-making process in the area. Using these data, a complete business intelligence system solution was implemented. A data warehouse was created using the ETL (extract–transform–load) process, and the data were then explored using a set of dynamics dashboards with a view of the business metrics. The results showed the use of business intelligence systems that allow the integration and transformation of data from various sources stored in data warehouses, where it is possible to implement KPIs and carry out quick, concise, easy-to-interpret graphical analyses. This paper contributes to a better understanding of the importance of data-integrated dashboard visualisation for the decision-making process.
1. Introduction
Technological development has grown exponentially in recent decades and affected business models [1]. One of the aspects to be improved is adopting technology that focuses on management, including strategic intelligence needs, with the use of business intelligence (BI). With BI, all company departments are expected to manage existing data and obtain quality information to optimise decision-making, resulting in functional financial benefits for the company and managers [2].
The cloud BI solution is an asset that can be harnessed, developed and used as a tool that can help generate more excellent value in collecting, analysing and disseminating information to improve and better support the decision-making process [3].
BI uses visualisation to present intangible data to end users. Decision-makers can view real-time results and analyse organisational performance [4].
Dashboards provide a synthesised, aggregated and interactive way of visualising information critical to business decision-makers and can proactively alert them to existing problems. At the strategic level, through business intelligence systems, it is possible to define the main goals (the organisation’s strategic key performance indicators) and objectives and to monitor them [5,6].
Establishing and monitoring key activities is crucial for companies to improve business performance. Such a task starts by defining these key activities represented by the key performance indicators (KPIs). Key performance indicators help companies measure how they are achieving their main goals and strategies. Detecting what is not going so well in critical operations is also helpful in correcting the activities generating the losses and identifying areas for improvement.
Business analysts and the decision-making elements need to obtain this information in an understandable and dynamic representation. Usually, this involves a performance dashboard with all the company’s vital KPIs represented.
According to [7], “A performance dashboard is a multilayered application built on a business intelligence and data integration infrastructure that enables organisations to measure, monitor, and manage business performance more effectively”.
Key performance indicators use integrated data through powerful expressions to expose in an understandable way sales results, marketing campaigns, pricing strategies, etc. To obtain the integrated data, a business intelligence solution is needed that integrates all the data into a unique repository called a data warehouse, recurring to use powerful expressions for further dashboarding exploration.
The adoption rate of BI technologies by SMEs (small and medium enterprises) is still low (lower than 22%), according to [8,9,10]. Decision-makers need to be made aware of the strategic advantages of adopting these tools.
Akbar et al. [11] after identifying the needs of the business, presented an implementation study of BI systems for sales, intending to produce reports in the form of interactive dashboard visualisation that store managers can use to make better decisions. Adriansyah and A. Y. Ridwan [12] presented a study that measures the direct impact of the development of production in the leather industry using eco-friendly criteria. It concluded that the best tool to control this process is the dashboard. They compared the process performance using and not using the eco-compatibility criteria. Halim et al. [13] presented a study that aims to assess the degree of customer reaction satisfaction, responding to increasingly high expectations and market competitiveness, using internal and external data (i.e., online reviews) collected from six restaurants. They concluded that the use of graphic dashboards facilitates decision-making by restaurant managers, highlighting, in particular, the time saved in the decision-making process [11,12,13], and they are unanimous on the advantages of using BI tools to support the decision-making process by managers. The study we will be presenting will also look at the advantages of using BI tools in a different context.
This study aims to explore a BI solution using the Power BI tool and its ability to integrate data, analyse data, and visualise information that allows managers to make appropriate decisions to support the decision-making process in the sales area simply by using reports and dashboards. The use of business intelligence puts organisations at the forefront of innovation by turning raw data into insights that improve business performance by sustaining better decisions. Using empirical data from a sales use case, it was once again possible to demonstrate the potential of applying BI tools. From a set of disaggregated data on a spreadsheet, after implementing the ETL process, it was possible to develop integrated performance dashboard visualisation with Power BI as a platform.
2. Theoretical Background
The use of BI platforms is now a top priority for many managers. The use of BI systems has become a strategic initiative and is now recognised by CIOs and business leaders as fundamental to company efficiency and innovation. They provide the ability to analyse business information to support and improve management decision-making across various business activities.
2.1. Business Intelligence
According to Kimball [14], the business intelligence concept is a digital tool with mechanisms that help the user collect, process, store and organise a large amount of data to assist in decision-making processes and interpret relevant information. It includes two primary activities: getting data in and getting data out. Getting data in, traditionally called data warehousing, involves moving data from a set of source systems into an integrated data warehouse. The enterprise resource planning (ERP), customer relationship management (CRM), and supply chain management (SCM) tools databases are examples of different sources [15]. The second activity, BI, consists of business users and applications accessing data analytics. Figure 1 presents the BI framework [16] proposed by Watson and Wixom.
Data that flow in the organisation are more granular and produced in much larger volumes than ever before. The extract, transform, and load process helps to integrate these data and ensure their validity and usefulness to an organisation. Typically, the transformation process occurs in the data staging area [17], where the data are cleaned, transformed, and loaded into the data warehouse.
The ETL process is very complex, and its execution is usually time-consuming.
In addition, the tool cleanses the data before storing it in the data warehouse and preparing it for BI tasks. These are the back-end processes of a traditional BI system. When data are available in a central data warehouse, different levels of media servers are used for data analysis, which serves as the basis for decision reports used by decision-makers [18].
The limitations of implementing the BI can be summarised as internal, external, and technical factors. Berhane et al. [19] and Gudfinnsson et al. [20] identified internal factors, and stated that there may be limitations in the knowledge of their employees in the use of BI tools without adequate training for them. There is also a tendency for the organisation’s employees to use existing tools and processes instead of this kind of information system, even if this takes longer to run. Regarding external factors, the same authors emphasised that when external IT consultants exist, difficulties may arise in obtaining the necessary support for using BI concerning organisational processes. In addition, regarding technical factors, the same authors stated that problems may occur in terms of the quality of the information in this new tool. Difficulties may also arise that cause the information to be manually entered into the system, which will also be a problem considering that there is a possibility that this manual process has errors or failures. Information privacy can be a technical challenge for organisations, as it can cause problems when data are loaded into the BI system [21]. It is, however, necessary that, to maximise their performance, they outline strategies and plans so that the business intelligence tools meet their needs, constantly considering all the challenges and limitations described here.
2.2. Key Performance Indicators (KPIs) for Sales
Technological development has provided organisations with different and new tools, which have proved very useful for improving, modifying and perfecting the practices they use, as well as for setting new objectives and achieving various goals.
Business organisation performance refers to the results or achievements an organisation obtains during its operations [22,23]. It encompasses various aspects that describe an organisation’s success in achieving its goals. The performance of a business organisation is not just limited to financial aspects; it also involves other factors that can impact the organisation’s sustainability and long-term success [24,25].
Management performance measurement based on key performance indicators (KPIs) has been widely applied in organisations. By definition, KPIs are a set of financial and non-financial metrics meant to reflect the dimensions of organisational performance that are most important to the organisation [26].
Performance indicators have specific characteristics known as SMART, i.e., a KPI must be specific, measurable, attributable, realistic and time-bound [27].
KPIs provide targets to help organisations to make better decisions. Key performance indicators from finance and human resources to marketing and sales help every business area move strategically [28].
2.3. Performance Dashboard
A dashboard is a powerful interactive data visualisation and analysis tool, presenting critical KPIs through various visualisations, allowing direct and efficient data exploration more profoundly, with filters and drill-down capabilities.
Dashboards result from BI applications that monitor, examine and control the organisation’s main activities [27,33]. Dashboards present the main business metrics to enable managers to make the right decision and introduce value-added improvements to the business [34,35]. Dashboards are an efficient tool for decision-makers to graphically visualise key performance indicators (KPIs) related to business process activities [36].
Performance dashboards synthesise information collected from different information systems of organisations and build it into various screens for the other players [37].
Data information is synthesised into graphics that increase perception and facilitate conclusion and understanding [38]. A systematic combination and data structuring can be translated into easily understandable visualisations to improve interpretation, comprehension, and decision-making [39]. Eckerson [33] described how users must have different dashboards because they need other functionalities. Executives want to monitor the state of the organisation. Managers analyse information related to company performance and personnel in a more detailed way. Each user needs their KPIs to be added to their dashboard.
Wilbanks and Langford [40] pointed out some advantages of dashboards, such as the ability to evaluate large amounts of data, demonstrate results in an easy-to-interpret layout, provide notifications of metrics that deviate from predefined acceptable levels to reduce adverse events, provide decision-making assistance to improve efficiency and quality and bring data-based decision-making to executive management.
Yigitbasioglu and Velcu [41] carried out an analysis of the design of the dashboards. In their opinion, a graphical form is the most suitable format for presenting sales forecasts. Graphs also reduce information overload when compared to tabular information.
3. Materials and Methods
This study aims to explore Power BI’s ability to integrate data, analyse data and visualise information that allows managers to build appropriate decisions to support the decision-making process in the sales area through the simple use of reports and dashboards.
Considering the problem and the purpose of the study, the following specific objectives are defined:
- -
- To understand the evolution of technology, namely business intelligence, in the context of the digital transformation of companies;
- -
- To implement a BI solution for a case study;
- -
- To understand the importance of using business intelligence to support the decision-making process in organisations.
The study entails applied research using cross-sectional qualitative and quantitative data available on the Web. Vercellis [42] proposed the methodology adopted for implementing the BI platform, which consists of four main phases: analyse, design, plan, and implement and control.
The first phase is the analysis phase, which begins with identifying the organisation’s needs. The needs are recognised through interviews with employees in several departments and the organisation managers. The general objectives and priorities must first be defined, as well as the costs that will result from the application of a business intelligence system and, finally, the benefits that the application of this system will have for the organisation’s development.
The second phase is the design phase, which consists of two subtasks: infrastructure recognition and project macro planning. The infrastructure recognition evaluates the information system’s infrastructure to determine adequately if the infrastructure supports the business intelligence system’s needs and also to determine the information requirements. Afterwards, the project plan will be drawn up using the methodologies for making a project plan, which will define the development phases, the priorities, the deadlines, the expected costs, the functions that will need to be carried out and the resources that will be required to carry out all the steps in the project plan.
The third phase, the planning phase, includes a subtask where the steps that will be carried out in the business intelligence system will be defined and described in more detail. The information previously gathered, which will be included in the new system, will go through an evaluation process, after which it will be possible to have these data in the business intelligence architecture, which includes the creation of a data warehouse/data mart and development of the mathematical models that will be used. Finally, a prototype of the BI system should be created at a low cost and with limited functionalities to uncover any discrepancy between actual needs and the project specifications.
Implementation and control represent the last phase of the methodology and focus on the development of the data warehouse/data mart, which represents the information structure that the business intelligence system will use. The extract, transform and load process occur, and the data are loaded and aggregated into the data warehouse. Finally, the applications that will be used to carry out the necessary analyses and studies are defined, and finally, the system is released for testing and usage in the organisation.
This methodology is used due to several existing studies referencing this methodology, such as [43].
4. Application of the Methodology to a Case Study
Figure 2 presents the application of the methodology to the case study.
4.1. Analysis Phase
The analysis phase is generally carried out through a series of data collections, especially those whose job descriptions are related to the problems that have occurred and the business strategy the company will carry out. The needs are recognised through a series of interviews with employees in several departments and the organisation managers. The general objectives and priorities must first be defined, as well as the costs that will result from the application of a business intelligence system and, finally, the benefits that the application of this system will have for the development of the organization.
In the case of this study, the empirical data were extracted from the web because obtaining accurate data from an organisation was impossible. Not having access to accurate data, a strategy of searching for datasets on the web was adopted. There are several repositories of datasets on the web for dealing with BI tools, such as Kaggle, Google Trends, and Data World. The dataset was collected in April 2023. In Google Scholar, we applied the following strategy: TOPIC: (dataset) AND (sales) AND (business intelligence) AND (XLS). With this search, we found several dataset repositories and immediately obtained 10 sites with data that allowed us to implement sales marketing KPIs. After analysing the datasets available on the first 10 sites, we used the sales marketing dataset (https://www.superdatascience.com/pages/tableau) (accessed on 2 April 2023).
The dataset studied was taken from SuperDataScience, an online educational platform that allows you to use various datasets to carry out studies for educational use only. The data are stored in the Microsoft Office Excel tool and contains information on sales related to furniture, office supplies and technology, which were realised in Europe between 2011 and 2014.
The dataset used is called AmazingMartEU2 and is available in Excel format. The Excel file consists of three spreadsheets.
Dataset Characterisation
The AmazingMartEU2 dataset comprises two Excel worksheets, a list of orders and an order breakdown, as shown in Figure 3.
Each list of orders is characterised by an order ID, the order date, the city, the country, the segment (home office, consumer or corporate), the shipping date, the shipping mode (economy plus, economy, priority) and the state.
Each list of orders may have several products, like Order AZ-2011-2918397, highlighted in Figure 3, which has three different products with different quantities. This information is registered in the order breakdown worksheet, which is identified by several fields, namely the order ID, the product name, the discount, the sales, the profit, the quantity, the category (office supplies, furniture, technology) and the subcategory (paper, bookcases, chairs, etc.) of the respective product.
4.2. Design Phase
The second phase involves identifying the prominent business knowledge areas, which include infrastructure recognition and project planning. The infrastructure recognition evaluates the information system’s infrastructure to determine in an adequate manner if the infrastructure supports the business intelligence system’s needs and also to determine the information requirements. Afterwards, the project plan will be drawn up in accordance with the methodologies for making a project plan, which will define the development phases, the priorities, the deadlines, the expected costs, the functions that will need to be carried out and the resources that will be needed to carry out all the steps in the project plan.
The BI tool selected for analysing the data is Power BI Desktop. It is the most widely used tool and ranks first in the Gartner Quadrant [44].
The data in the case study only provide us with information on sales, so this is the business process that will be analysed.
4.3. Planning Phase
The third phase, which is the planning phase, includes a subtask where the steps that will be carried out in the business intelligence system will be defined and described in more detail. The information previously gathered, which will be included in the new system, will go through an evaluation process, after which it will be possible to include these data in the business intelligence architecture, which includes the creation of a data warehouse/data mart and development of the mathematical models that will be used. Finally, a prototype of the BI system should be created at low cost and with limited functionalities in order to uncover beforehand any discrepancy between the actual needs and the project specifications.
After identifying the KPIs we wanted to implement (average order value gross margin, revenue growth rate, monthly sales versus the same period last year (EUR), top sales by series (products), average ticket and cost of goods sold), as defined earlier, and defining the questions to be answered by the BI platform, the data warehouse will be modelled.
The Kimball methodology [14] is used to build the data warehouse and a star schema is implemented. The star schema model is built around a fact table, interlinked with several dimension tables.
After that, it is necessary to define the granularity of the data. For this implementation, the daily granularity is defined regarding the available data of the case study and the KPIs defined. The granularity corresponds to a row in the data warehouse.
The next step regarding the Kimball [14] methodology is to define the dimensions that provide the “who, what, where, when, why, and how” context surrounding a business process.
The date dimension (when), country dimension (who), equipment (how), product, segment, category, subcategory (what), shipping mode (how).
The last step is to identify the facts and measurements that result from a business process event and are almost always numeric.
In the next phase, the implementation and control phase, the architecture of the data warehouse can be visualised in detail (dimension and fact tables).
4.4. Implementation and Control Phase
The Vercellis methodology’s [42] last phase is the implementation and control process, where the development of the data warehouse and the exploration of the data warehouse through dashboards are performed and also a previous task where a version is released and tested. The extract, transform and load process occurs and the data are loaded and aggregated into the data warehouse. Finally, the applications that will be used to carry out the necessary analyses and studies are defined and, finally, the system is released for testing and usage in the organisation.
The software used for the implementation is Microsoft Power BI Desktop, version 2.122.1066.0, because it has been the leader in the Gartner Magic Quadrant during the last few years and has several functionalities used in this implementation besides being a free tool. Some of the main functionalities used [45].
4.4.1. Microsoft Power BI
Microsoft Power BI is a cloud-based business analytical and visualisation tool for business decision-makers to monitor business performance and interact with data to obtain more or less detailed business insights.
Power BI is a software consisting of several tools that allow data analysis, linking data from different sources, as well as creating reports, graphs, visualisations and dashboards, which allow for analysing the performance indicators and metrics that are most relevant to the growth of the organisation and support the decision-making process [46,47,48].
The main advantages are that the tool is low-cost and easy to handle [48], while updates are frequent and present pre-defined graphics that help inexperienced users [46]. It also contains a considerable diversity of graphics/visualisations with appealing designs, allows integration with several data sources and the extraction and transformation of data in a simple way. It also allows integration in the cloud and the use of formulas and DAX expressions (data analysis expressions). Power BI has sophisticated data visualisation features and an intuitive design and integrates excellently with the rest of the Microsoft Office [47]. However, it also has the disadvantage that it only exists for the Windows operating system [48]. Microsoft Power BI has been recognised as the first leader in the analytics and business intelligence platform in the Gartner Magic Quadrant [44].
4.4.2. Extract–Transform–Load
The ETL (extract, transform, and load) process combines data from multiple sources into a large, central repository called a data warehouse. First, data must be extracted from the different sources, cleaned and transformed (usually in the data staging area), and finally, loaded into the data warehouse.
Data are extracted from the two Excel worksheets, list of orders and order breakdown of the dataset. It also extracts data from another Excel file with the dates from 2008 to the present.
Several transformations are applied to the raw data to create the first seven dimensions tables.
DimCountry (IDCountry, Country)
DimCity (IDCity, City)
DimProduct (IDProduct, Product)
DimCategory (IDCategory, Category)
DimSubCategory (IDSubCategory, SubCategory)
DimSegment (IDSegment, Segment)
DimShipMode (IDShipMode, ShipMode)
To all these dimensions are applied several transformation processes, such as removing unneeded columns, removing duplicate values and creating artificial or surrogate keys.
Another dimension table is created with the dates where the source file is an Excel file with the dates.
DimTime (IDData, Date, Year, Month, Day, MonthName, Quarter, QuarterName, WeekDay).
The last transformations are applied to create the fact table FactSales by extracting the data from the already mentioned two Excel worksheets, list of orders and order breakdown. Then, several transformations are used, such as removing unneeded columns, merging tables, searching and returning the right surrogate key, and creating new columns with new calculated measures to sustain the already defined KPIs.
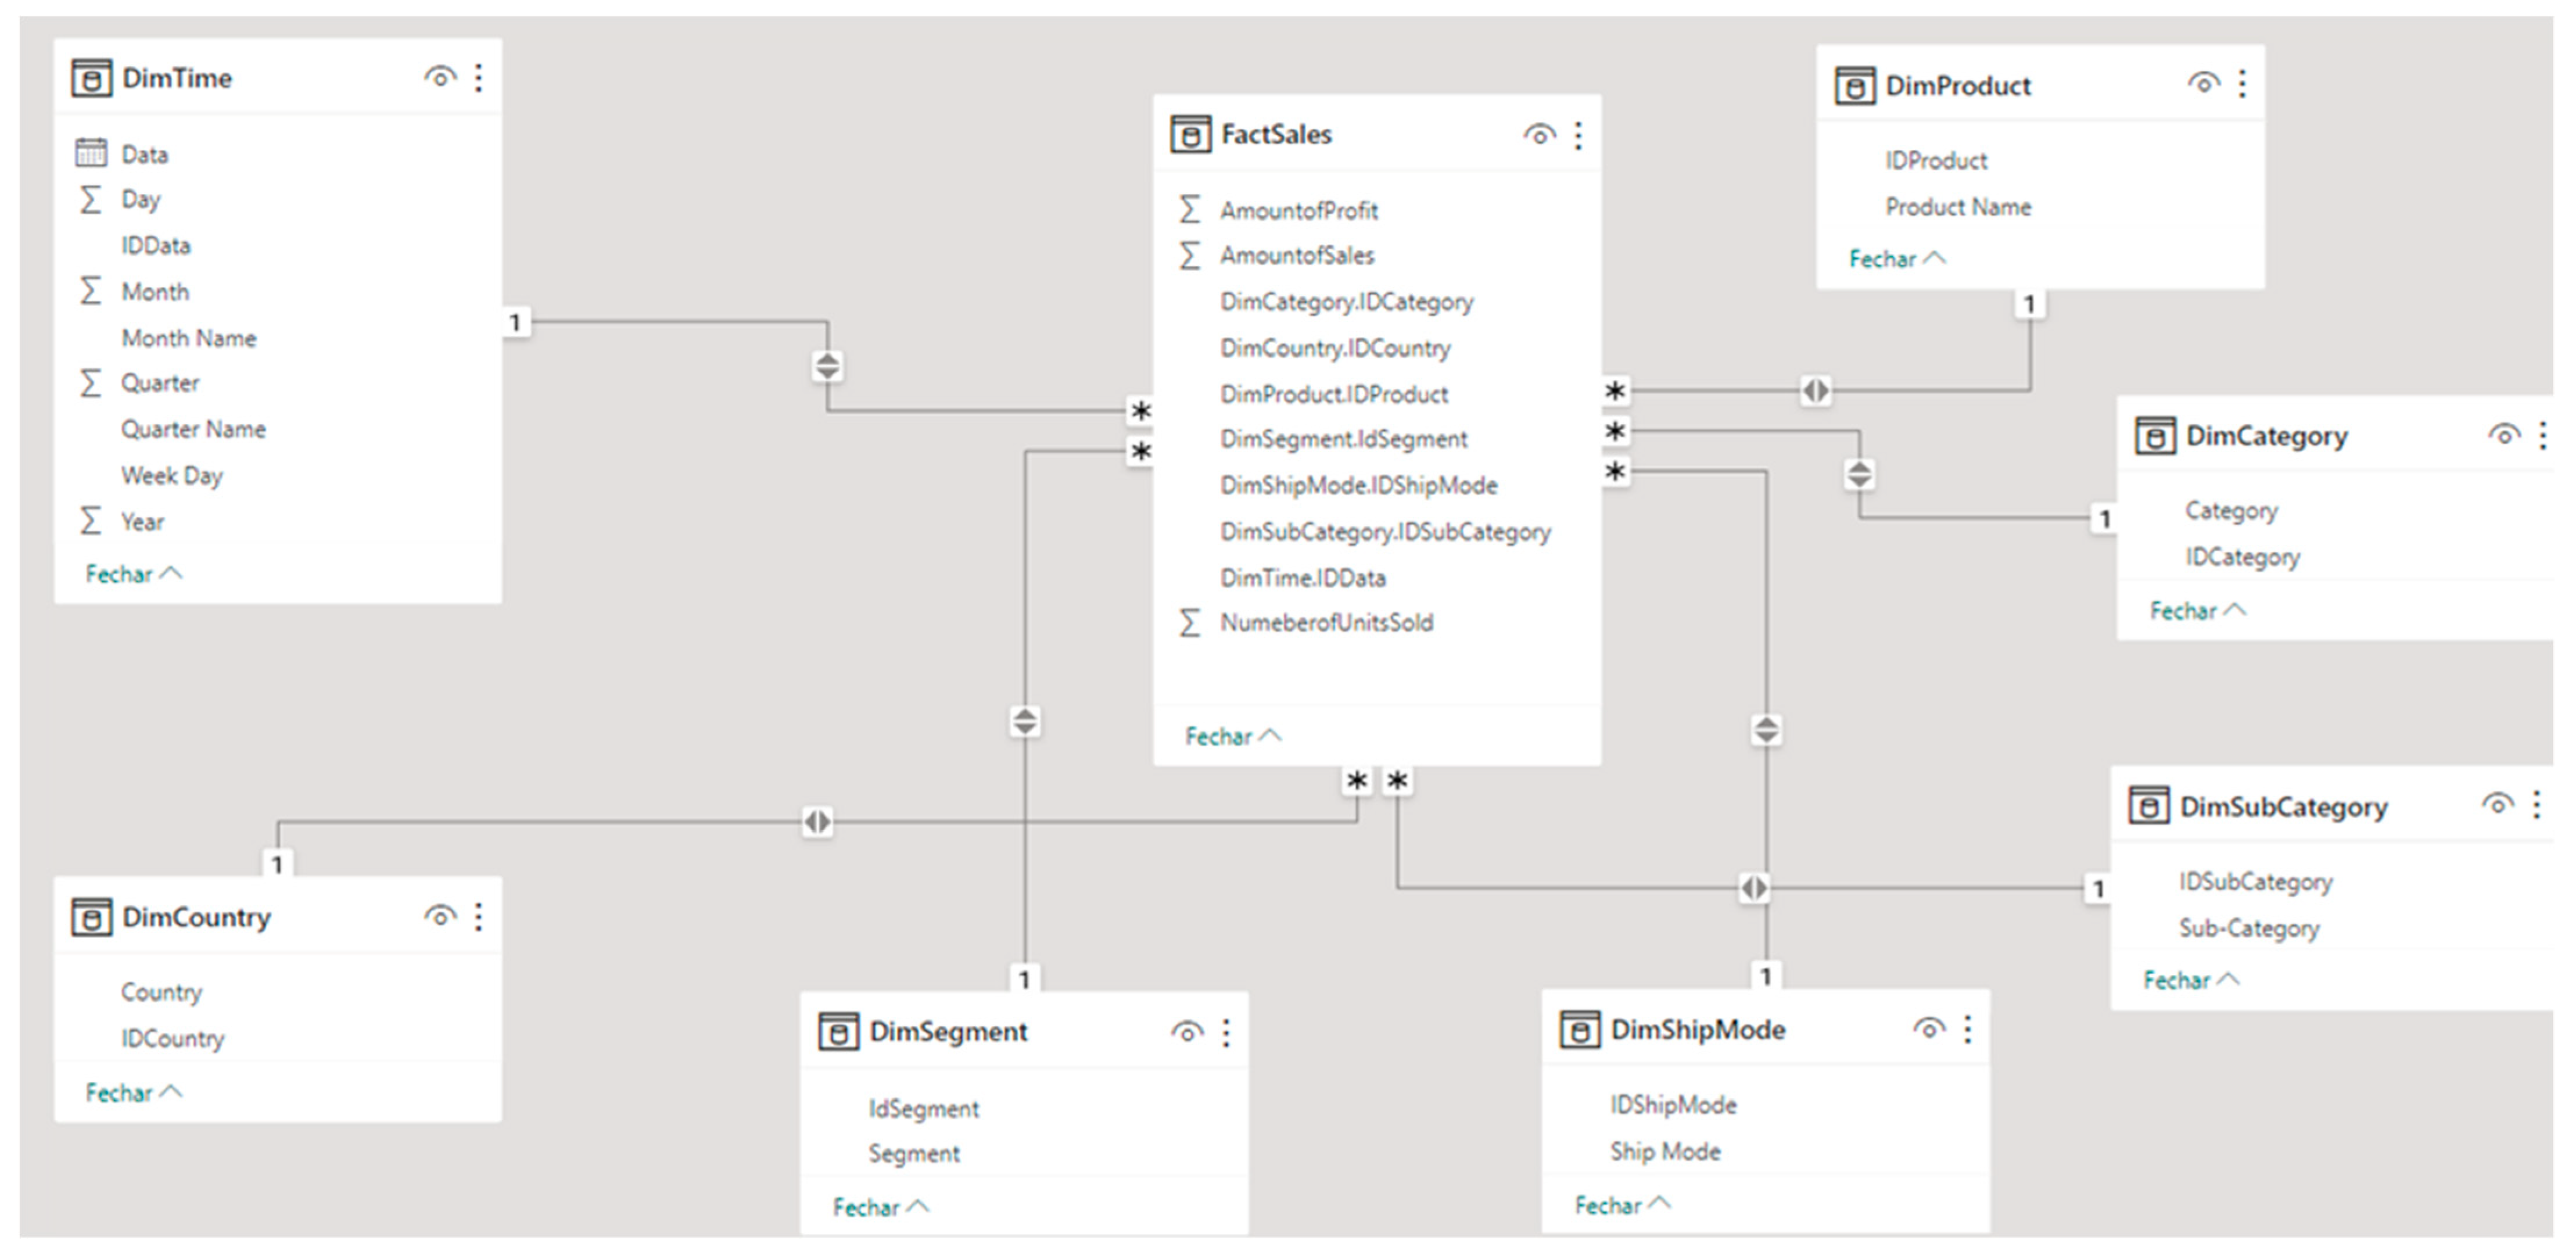
The last step is to create the relationship between the fact table and the dimensions tables, always following the model defined and considering the KPIs defined.
Figure 4 shows the star data model built in Power BI to achieve the KPIs defined.
4.4.3. Exploring the Data Warehouse through Visualisations and Dashboards
Creating a dashboard involves multiple elements that should be considered, such as the required KPIs previously defined, the right combination of visuals and text that accurately represents data, and the information to executives or managers. In addition, visuals should also be clear and lead the managers to understand and interpret the data easily. Visuals are also supposed to be visually attractive, and consistent colour coding has been shown to improve the process of understanding visuals.
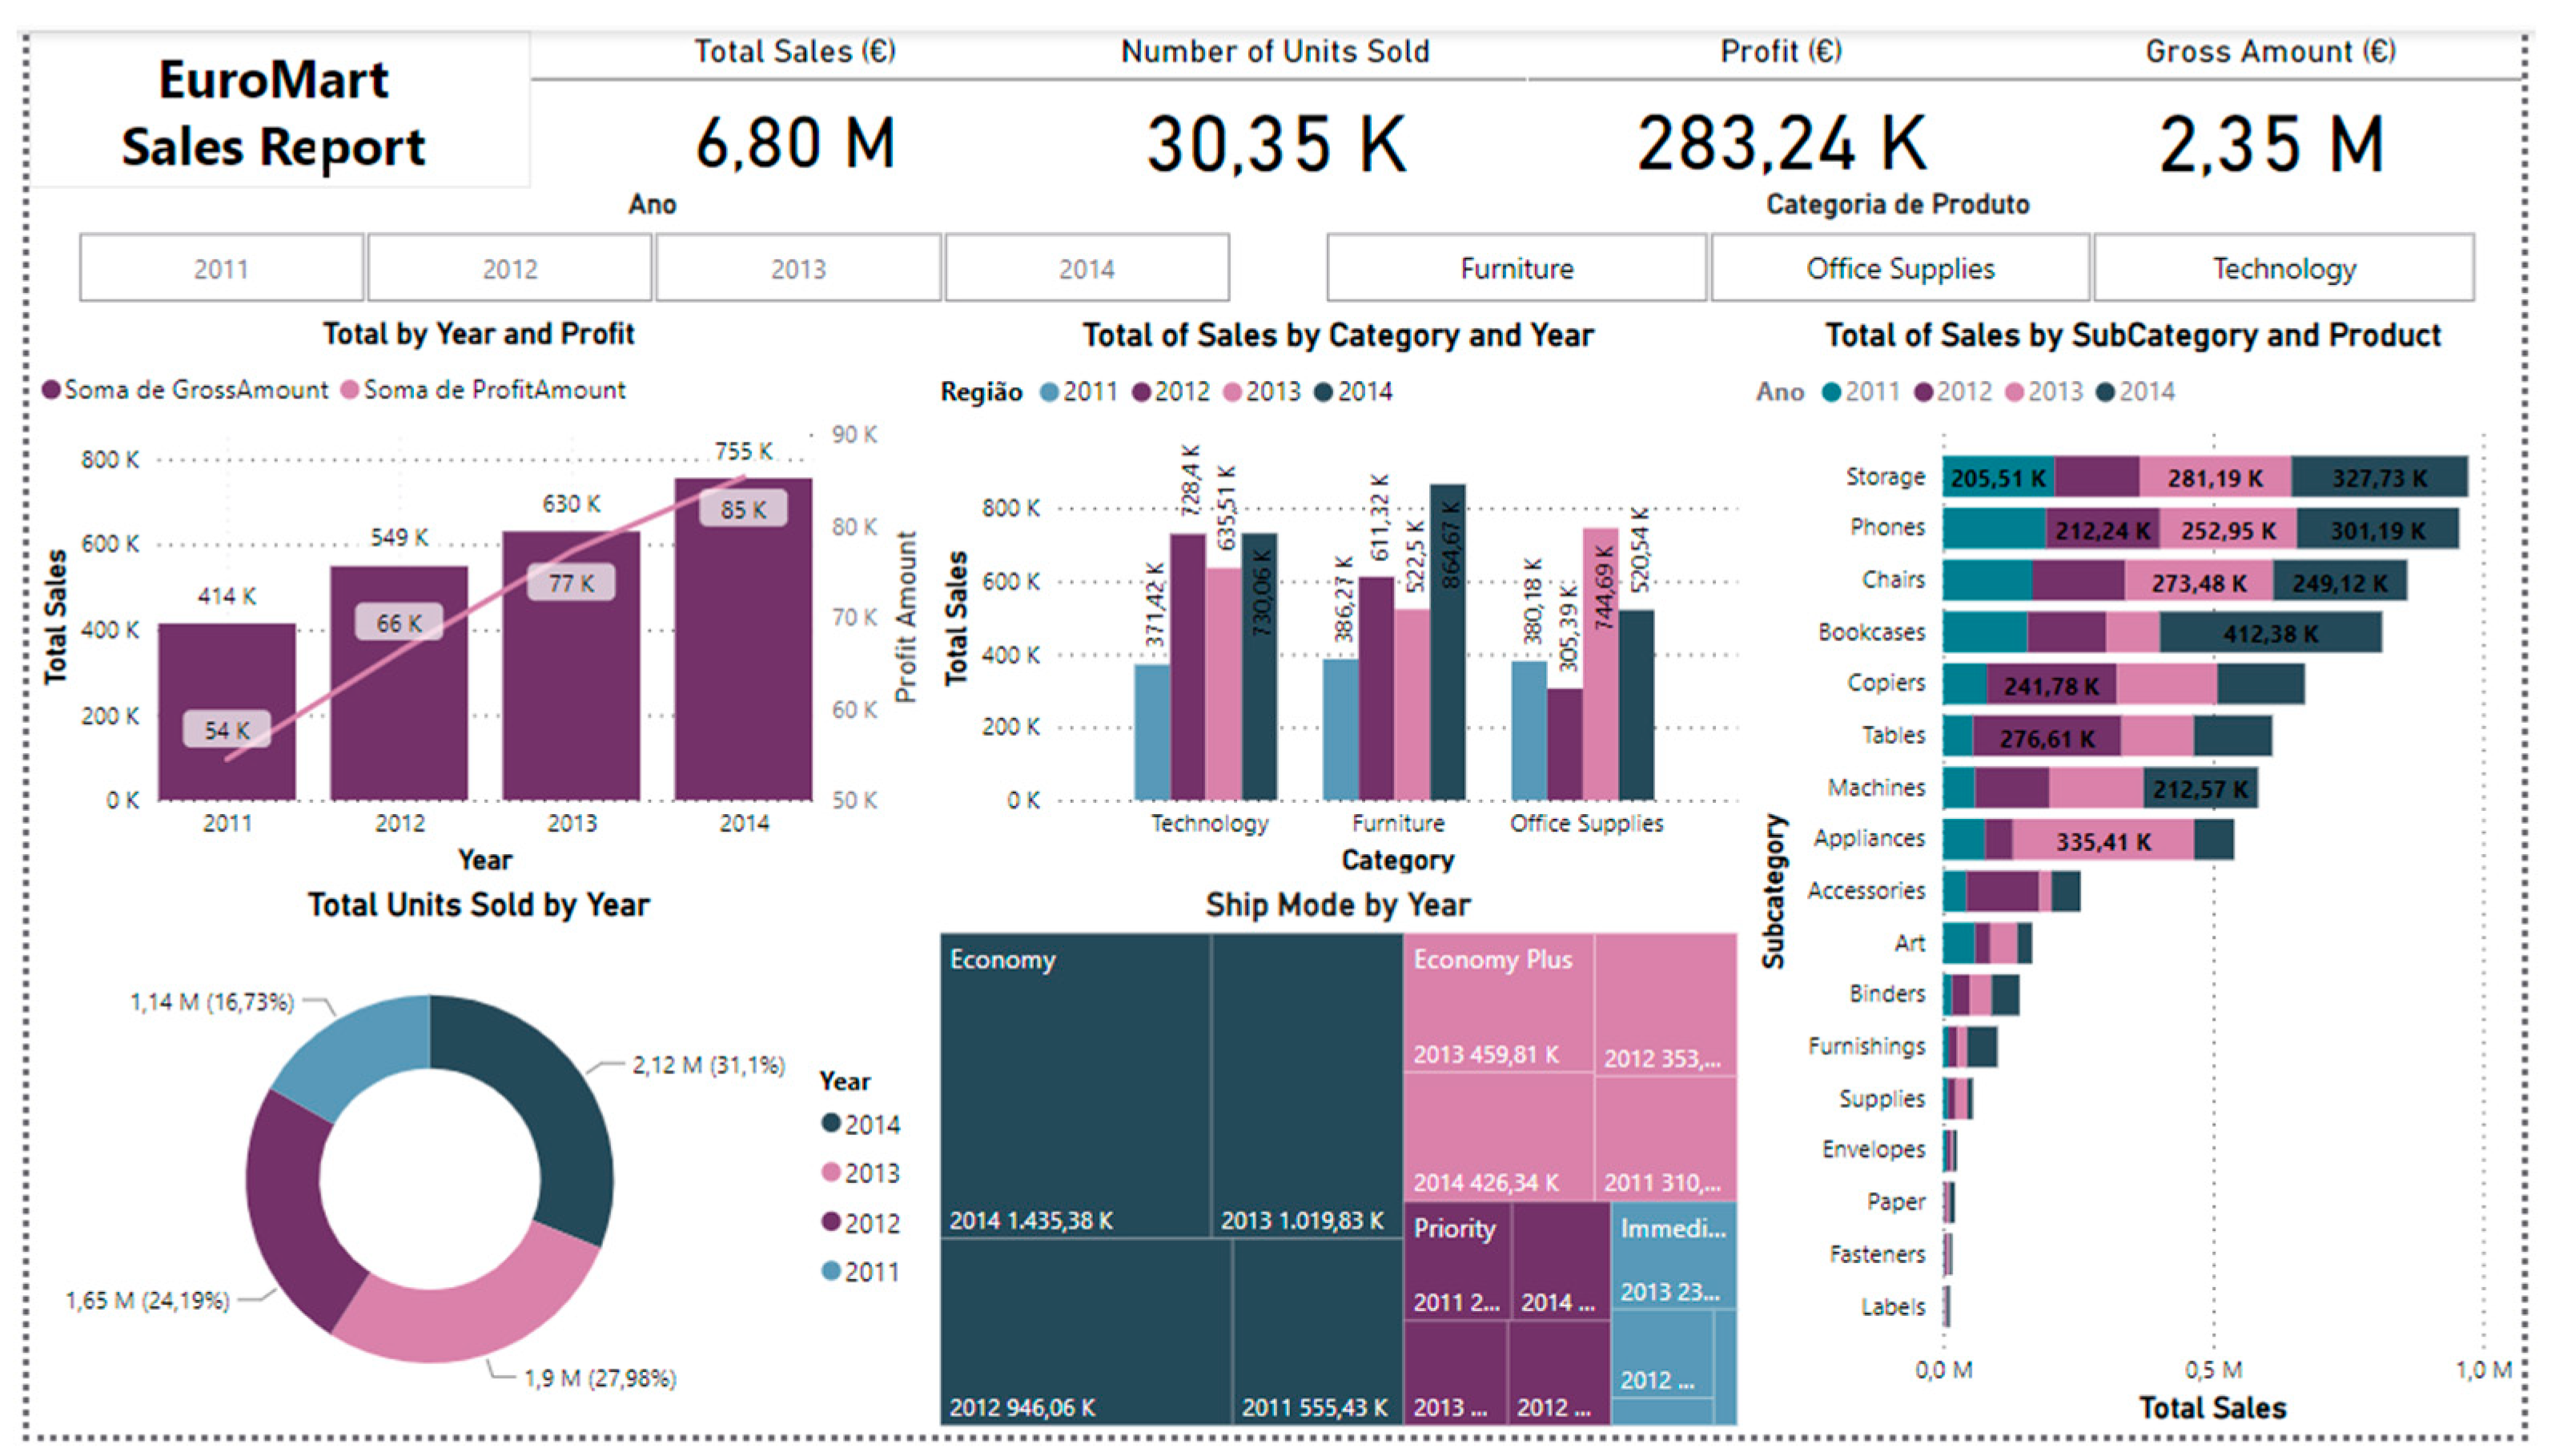
The first dashboard (Figure 5) represents the Euro Mart Sales Report, where the three cards present the total number of products sold (30,35 K), the number of sales and the amount of profit, respectively.
Analysing the map visually, France is the country that sells more, and Denmark is the country that sells less.
Technology is the category that sells the most, followed by office supplies and furniture, which sell less.
The subcategories that sell the most in 2011 are phones, bookcases, storage and appliances; in 2012, phones, copiers, bookcases and storage; in 2013, are appliances, copiers, phones and storage; and in 2014, are copiers, storage, appliances and phones. Labels and fasteners were the ones that sold the least in the four years.
The word cloud shows the products that sell the most: smartphones, fax machines, etc.
Technology sales increase from 2011 to 2014, office supplies rise from 2011 to 2013 and decrease in 2014, and furniture sales decreases from 2011 to 2014.
The economy shipping mode is the most used, followed by the economy plus, priority and immediate.
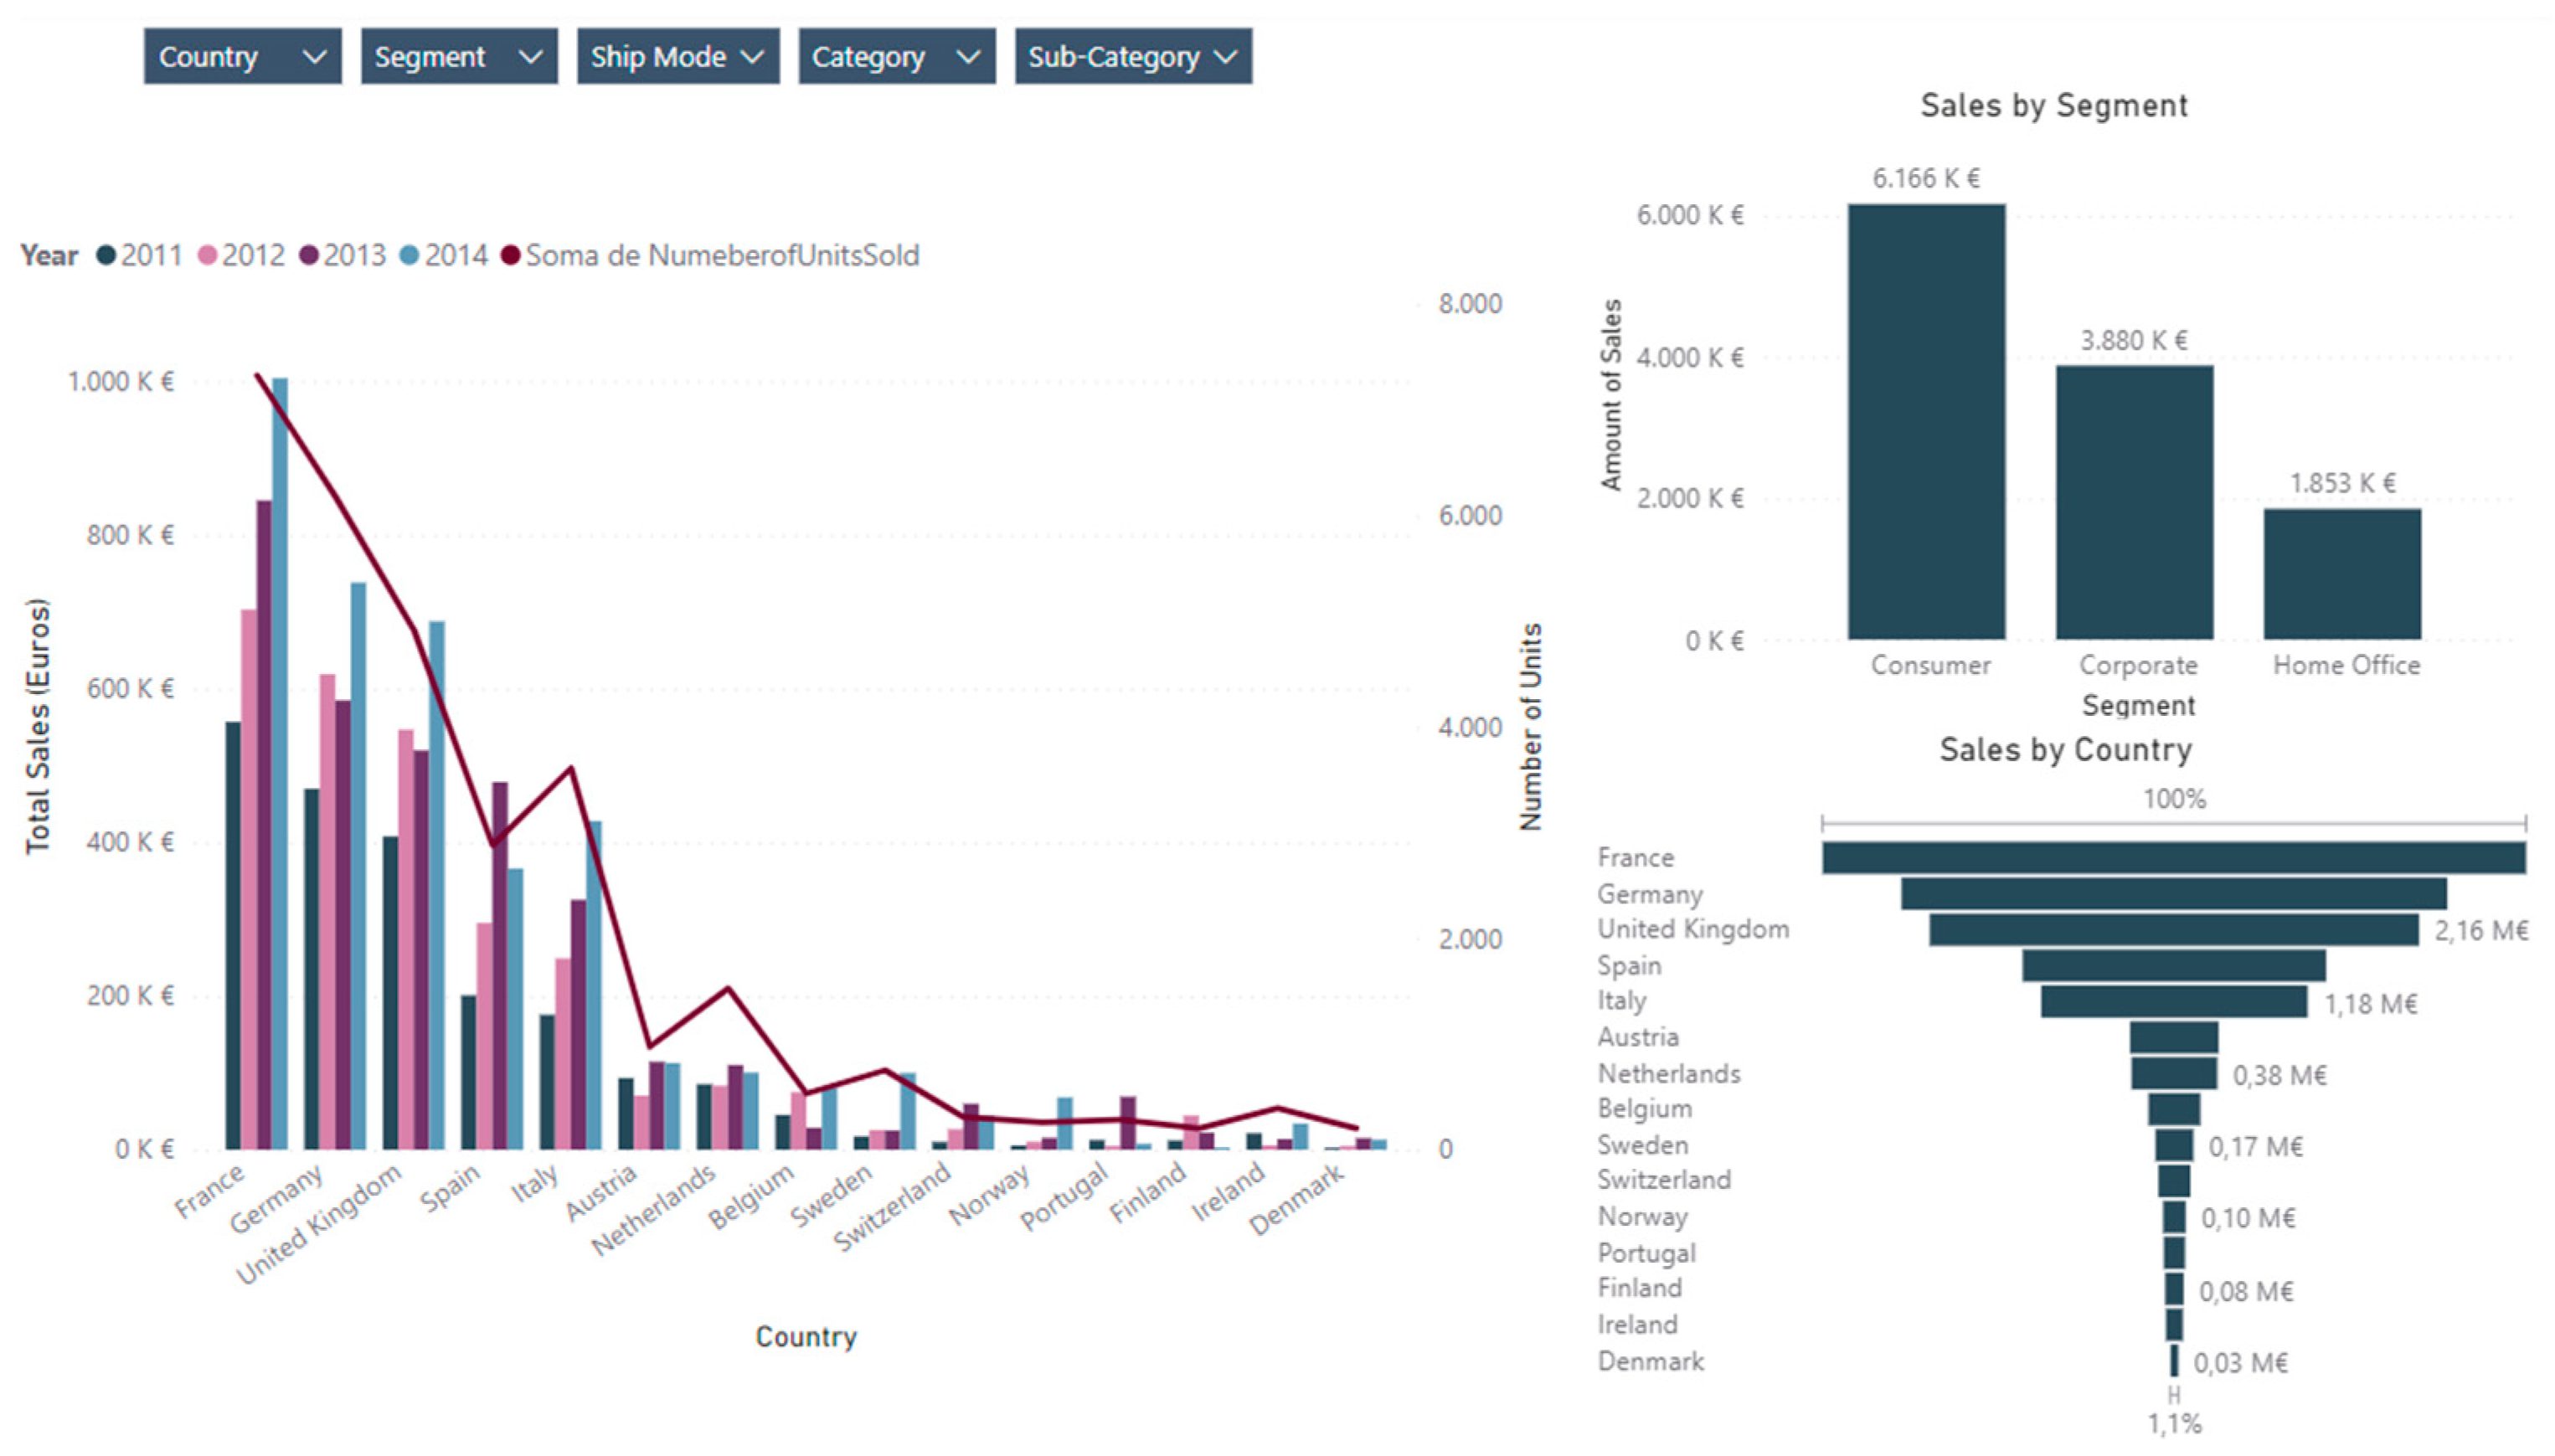
The next dashboard, Figure 6, lets the user interactively apply filters by country, segment, shipping mode, category and subcategory, and it exhibits a visual that shows a comparison between the number of units sold and the amount in euros, from which it is possible to conclude that France is the country that sells more and Denmark is the country that sells less.
The third dashboard in Figure 7 lets the user interactively apply filters by year and selectively by country, within a particular country select the categories sold in that country, then select a particular subcategory and finally select a particular product. Figure 7 shows the 2014 sales in Portugal, specifically sales of “Motorola Signal Booster, Voip” phones, which belong to the subcategory of mobile phones and which in turn belong to the technology category.
After a brief analysis of the dashboard for the year 2012 (Figure 8), we can see that total sales are EUR 1,65 million, profit is EUR 66,223 thousand, total units sold are 7010 thousand and gross sales are EUR 548,880 thousand.
In terms of sales by product category, the technology category has EUR 728,1401.80 million, the furniture category has EUR 611,315.50 million and the office supplies category has EUR 305,386.80 million. In terms of the product subcategory, the subcategory with the most sales in 2012 is tables, with EUR 276,1611.10 million, and the one with the least is labels, with EUR 871.20. The shipping method most used by customers is economy, which accounts for EUR 946,063.40 million of total sales, followed by economy plus with EUR 353,533.10 million, then priority with EUR 187,375.70 million and finally, Immediate with EUR 158,11.90 million.
The fifth dashboard in Figure 9 has four cards referring to the facts of the data warehouse, but in relation to data segmentation, a menu has been created, where it is possible to perform various searches due to the different buttons it contains, these being: Year, NameCity, NameCountry, NameRegion, NameProductc, NameSegment, NameShipMode, NameCategory and finally, NameSub-Category. The first visualisation is made through the map and represents the total sales by country and year, and it is accompanied by a stacked line and column graph representing the number of units sold by country and year and a table representing the profit by country, where it is possible to visualise the different 15 countries and the profit that each one had. On this dashboard, using the available buttons, you can make several analyses simultaneously and understand the total sales by country and year, such as the number of units sold and also the profit. In the stacked line and column graph, the three countries with the most units sold are France with 2,356,000 units sold, Germany with 1,786,000 units sold and the United Kingdom with 1,888,000 units sold.
The countries with the fewest units sold are Finland with 201 units sold, Denmark with 204 units sold and Norway with 261 units sold. As for profit, the countries that make the most profit are the United Kingdom with EUR 90,382, Germany with EUR 86,279 and France with EUR 70,067, while the countries that make a net loss are the Netherlands with EUR −37,188, Sweden with EUR −17,524 and Portugal with EUR −8704.
4.5. Analysis and Discussion of Results
In the previous section, we have presented the main integrated performance dashboard visualisation using Power BI as a platform, where it is possible to find sales by country, sales by category, sales by product, and the most used shipping mode, among others.
We can conclude that the development of systems that enable analysis for decision-making in organisations has increasingly been identified as essential for improving the quantity and quality of information available for strategic decision-making in organisations [49], and monitoring performance indicators (KPIs) plays a vital role in the organisation [48].
About using a BI solution for the implementation of a case study, a solution was developed based on the use of the Vercellis methodology [42], which made it possible, even though the data were not from a real organisation, to create a logical order for the development of a BI system according to the four phases of the methodology and which steps are necessary for the entire working method to be carried out effectively. During the implementation phase of the case study, the BI solution proved extraordinarily advantageous. By aggregating the data to be in sync and have the same values, it was possible to obtain more in-depth analyses and build a better-quality narrative.
Finally, understanding the importance of using business intelligence to support the decision-making process in organisations allowed us to understand how a vast set of data with different characteristics can be interconnected through a data model, which will enable organisations to extract information about their business and help create and define different strategies to assist in decision-making processes.
It can be concluded that the development of a BI solution applied to the sales case study allowed us to carry out several analyses and build visualisations and dashboards that provide a better understanding of the data and contribute to the decision-making processes of organisations, in this case directly assisting the sales marketing department.
5. Conclusions
In today’s increasingly competitive world, organisations are under constant pressure and, as a result, responding quickly to changing conditions, being innovative in meeting their customers’ needs, and how they act in the market are becoming critical success factors. This means that organisations must be agile and frequently make quick (sometimes complex) decisions, whether strategic, tactical or operational [39]. However, making these decisions requires much data, information and knowledge.
This study aimed to explore a business intelligence solution using the Power BI tool’s ability to integrate data, analyse data and visualise information that allows managers to build appropriate decisions to support the decision-making process in the sales area through the simple use of reports and dashboards. So, we can see that through the development of the case study and the transformation of a dataset, it was possible to understand the advantages of using business intelligence tools. They make it possible to create an integrated system of data stored in data warehouses, where it is possible to carry out quick, concise and easy-to-interpret analyses, and the information is updated in real time [50].
The study’s limitations are related to the dataset analysed. On the one hand, it is limited in terms of the data it provide; on the other, it does not present accurate and current data from an organisation. As mentioned above, we used data taken from the web.
For future research, we propose developing a case study with accurate data from an organisation where the business model is related to sales marketing and creating a business intelligence solution and exploring it through different visualisations and dashboards to help the sales marketing department. In this case, it would be possible, after implementing a BI solution in an organisation, to assess the impact that this application could have on the functioning of the organisation’s processes and the improvement and progression of its business model.
This study shows the advantages of using integrated dashboards by using a sales dataset.
Author Contributions
Conceptualization, C.T.G. and M.J.A.G.; methodology, C.T.G. and M.J.A.G.; software, M.I.C.; validation, C.T.G. and M.J.A.G., M.I.C.; formal analysis, C.T.G. and M.J.A.G.; investigation, M.I.C., writing—original draft and preparation M.I.C.; writing—review and editing, C.T.G. and M.J.A.G.; visualization M.I.C.; supervision, C.T.G. and M.J.A.G.; project administration C.T.G. and M.J.A.G.; funding acquisition C.T.G. and M.J.A.G. All authors have read and agreed to the published version of the manuscript.
Funding
This work is financed by Portuguese national funds through FCT—Fundação para a Ciência e Tecnologia, under the project UIDB/05422/2020.
Data Availability Statement
Data are contained within the article.
Conflicts of Interest
The authors declare no conflict of interest.
References
- Kumar, S.; Aithal, P.S. Technology for Better Business in Society. Int. J. Philos. Lang. IJPL 2022, 1, 117–144. [Google Scholar] [CrossRef]
- Moss, L.T.; Atre, S. Business Intelligence Roadmap: The Complete Project Lifecycle for Decision-Support Applications; Addison-Wesley Professional: Boston, MA, USA, 2003. [Google Scholar]
- Jaswal, S. Integrating Business Intelligence With Cloud Computing. In Impacts and Challenges of Cloud Business Intelligence; IGI Global: Hershey, PA, USA, 2021; pp. 41–56. [Google Scholar] [CrossRef]
- Business Intelligence: The Impact on Decision Support and Decision Making Processes. Available online: https://www.diva-portal.org/smash/record.jsf?pid=diva2%3A3599&dswid=-8312 (accessed on 14 October 2023).
- Psarommatis, F.; Danishvar, M.; Mousavi, A.; Kiritsis, D. Cost-Based Decision Support System: A Dynamic Cost Estimation of Key Performance Indicators in Manufacturing. IEEE Trans. Eng. Manag. 2022, 1–13. [Google Scholar] [CrossRef]
- Esteves, D.A. KPI para Controlo e Tomada de Decisão num Negócio de Retalho E-commerce. 2018. Available online: https://repositorio.ucp.pt/bitstream/10400.14/27692/1/KPI%20para%20Controlo%20e%20Tomada%20de%20Decis%C3%A3o%20num%20Neg%C3%B3cio%20de%20Retalho%20E-commerce_Daniel%20Esteves_2018.pdf (accessed on 1 May 2023).
- Eckerson, W.W. Deploying Dashboards and Scorecards; Media, Inc.: Reno, NV, USA, 2006; Available online: http://sophitech.mx/files/1113/7718/8544/TDWI-Best-Practices-Report-Deploying-Dashboards-and-Scorecards.pdf (accessed on 1 May 2023).
- Owusu, A.; Agbemabiasie, G.C.; Abdurrahaman, D.T.; Soladoye, B.A. Determinants of Business Intelligence Systems Adoption in Developing Countries: An Empirical Analysis From Ghanaian Banks. J. Internet Bank. Commer. 2017, 22, 1–25. [Google Scholar]
- Vugec, D.S.; Vukšić, V.B.; Bach, M.P.; Jaklič, J.; Štemberger, M.I. Business intelligence and organizational performance: The role of alignment with business process management. Bus. Process Manag. J. 2020, 26, 1709–1730. [Google Scholar] [CrossRef]
- Kanerika. 5 Business Intelligence Statistics You Need to Know! Kanerika. Available online: https://kanerika.com/blogs/five-business-intelligence-statistics-you-need-to-know/ (accessed on 5 November 2023).
- Akbar, R.; Silvana, M.; Hersyah, M.H.; Jannah, M. Implementation of Business Intelligence for Sales Data Management Using Interactive Dashboard Visualization in XYZ Stores. In Proceedings of the 2020 International Conference on Information Technology Systems and Innovation (ICITSI), Bandung, Indonesia, 19–23 October 2020; pp. 242–249. [Google Scholar] [CrossRef]
- Adriansyah, A.K.; Ridwan, A.Y. Developing Sales Management Sustainability Monitoring based on ERP System. In Proceedings of the 2020 6th International Conference on Interactive Digital Media (ICIDM), Bandung, Indonesia, 14–15 December 2020; pp. 1–5. [Google Scholar] [CrossRef]
- Halim, K.K.; Halim, S. Business Intelligence for Designing Restaurant Marketing Strategy: A Case Study. Procedia Comput. Sci. 2019, 161, 615–622. [Google Scholar] [CrossRef]
- Kimball, R.; Ross, M.; Thornthwaite, W. Relentlessly Practical Tools for Data Warehousing and Business Intelligence, 1st ed.; Wiley: Hoboken, NJ, USA, 2012. [Google Scholar]
- Alaskar, H.F.; Saba, T. Application of Business Intelligence Solution Development and Implementation in a Small-Sized Enterprise. In Proceedings of the 2020 First International Conference of Smart Systems and Emerging Technologies (SMARTTECH), Riyadh, Saudi Arabia, 3–5 November 2020; pp. 183–190. [Google Scholar] [CrossRef]
- Watson, H.J.; Wixom, B.H. The Current State of Business Intelligence. Computer 2007, 40, 96–99. [Google Scholar] [CrossRef]
- Sturdy, A. Consultancy’s Consequences? A Critical Assessment of Management Consultancy’s Impact on Management. Br. J. Manag. 2011, 22, 517–530. [Google Scholar] [CrossRef]
- Sudaryono; Rahardja, U.; Harahap, E.P. Implementation Of Information Planning and Strategies Industrial Technology 4.0 to Improve Business Intelligence Performance on Official Site APTISI. J. Phys. Conf. Ser. 2019, 179, 012111. [Google Scholar] [CrossRef]
- Berhane, A.; Nabeel, M.; Große, C. The Impact of Business Intelligence on Decision-Making in Public Organisations. In Proceedings of the 2020 IEEE International Conference on Industrial Engineering and Engineering Management (IEEM), Singapore, 14–17 December 2020; pp. 435–439. [Google Scholar] [CrossRef]
- Gudfinnsson, K.; Strand, M. Challenges with BI adoption in SMEs. In Proceedings of the 2017 8th International Conference on Information, Intelligence, Systems & Applications (IISA), Larnaca, Cyprus, 27–30 August 2017; pp. 1–6. [Google Scholar] [CrossRef]
- Khan, M.A.; Saqib, S.; Alyas, T.; Rehman, A.U.; Saeed, Y.; Zeb, A.; Zareei, M.; Mohamed, E.M. Effective Demand Forecasting Model Using Business Intelligence Empowered With Machine Learning. IEEE Access 2020, 8, 116013–116023. [Google Scholar] [CrossRef]
- Muhamad, L.F.; Bakti, R.; Febriyantoro, M.T.; Kraugusteeliana, K.; Ausat, A.M.A. Do Innovative Work Behavior And Organizational Commitment Create Business Performance: A Literature Review. Community Dev. J. J. Pengabdi. Masy. 2023, 4, 713–717. [Google Scholar] [CrossRef]
- Sutrisno, S.; Ausat, A.M.A.; Permana, B.; Harahap, M.A.K. Do Information Technology and Human Resources Create Business Performance: A Review. Int. J. Prof. Bus. Rev. 2023, 8, 14. [Google Scholar] [CrossRef]
- Ausat, A.M.A. The Application of Technology in the Age of Covid-19 and Its Effects on Performance. Apollo J. Tour. Bus. 2023, 1, 14–22. [Google Scholar] [CrossRef]
- Ausat, A.M.A.; Peirisal, T. Determinants of E-commerce Adoption on Business Performance: A Study of MSMEs in Malang City, Indonesia. J. Optimasi Sist. Ind. 2021, 20, 104–114. [Google Scholar] [CrossRef]
- Parmenter, D. Key Performance Indicators–Developing, Implementing and Using Winning KPIs, 4th ed.; Wiley: New York, NY, USA; Available online: https://davidparmenter.com/key-performance-indicators-developing-implementing-and-using-winning-kpis-fourth-edition/ (accessed on 17 October 2023).
- Ferreira, R.G. Definição e Monitorização de Indicadores Chave de Desempenho (KPI) para Controlo de Operações na Indústria Corticeira. 2019. Available online: https://repositorio-aberto.up.pt/bitstream/10216/122396/2/353386.1.pdf (accessed on 10 June 2023).
- Bhatti, M.; Awan, H.; Razaq, Z. The key performance indicators (KPIs) and their impact on overall organizational performance. Qual. Quant. 2014, 48, 3127–3143. [Google Scholar] [CrossRef]
- Cabaço, N.M.M. Integração de Business Intelligence Com Enterprise Resource Planning Numa PME. Master’s Thesis, Coimbra Polytechnic, Coimbra, Portugal, 2021. Available online: https://comum.rcaap.pt/handle/10400.26/38858 (accessed on 14 May 2023).
- Jusoh, R.; Ibrahim, D.N.; Zainuddin, Y. The performance consequence of multiple performance measures usage: Evidence from the Malaysian manufacturers. Int. J. Product. Perform. Manag. 2008, 57, 119–136. [Google Scholar] [CrossRef]
- Cristea, C.; Cristea, M. KPIs for Operational Performance Assessment in Flexible Packaging Industry. Sustainability 2021, 13, 3498. [Google Scholar] [CrossRef]
- Kostin, K.B.; Steinbiß, K.; Petrinovic, O. Determining the KPIs of the German engineering industry based on the evaluation of contemporary business models. Strateg. Manag. 2021, 26, 3–36. [Google Scholar] [CrossRef]
- Eckerson, W.W. Performance Dashboards: Measuring, Monitoring, and Managing Your Business, 2nd ed.; Wiley: New York, NY, USA, 2011. [Google Scholar]
- Wexler, S.; Shaffer, J.; Cotgreave, A. The Big Book of Dashboards: Visualizing Your Data Using Real-World Business Scenarios; John Wiley & Sons: Hoboken, NJ, USA, 2017. [Google Scholar]
- Rasmussen, N.; Chen, C.Y.; Bansal, M. Business Dashboards: A Visual Catalog for Design and Deployment; John Wiley & Sons: Hoboken, NJ, USA, 2009. [Google Scholar]
- Dyczkowski, M.; Korczak, J.; Dudycz, H. Multi-criteria evaluation of the intelligent dashboard for SME managers based on scorecard framework. In Proceedings of the 2014 Federated Conference on Computer Science and Information Systems, Warsaw, Poland, 7–10 September 2014; pp. 1147–1155. [Google Scholar] [CrossRef]
- Pauwels, K.; Ambler, T.; Clark, B.H.; LaPointe, P.; Reibstein, D.; Skiera, B.; Wierenga, B.; Wiesel, T. Dashboards as a Service: Why, What, How, and What Research Is Needed? J. Serv. Res. 2009, 12, 175–189. [Google Scholar] [CrossRef]
- Marcial, D.E.; Peña, L.D.; Montemayor, J.; Dy, J. The Design of a Gamified Responsible Use of Social Media. Front. Educ. 2021, 6. Available online: https://www.frontiersin.org/articles/10.3389/feduc.2021.635278 (accessed on 21 October 2023). [CrossRef]
- Heer, J.; Bostock, M.; Ogievetsky, V. A Tour through the Visualization Zoo: A survey of powerful visualization techniques, from the obvious to the obscure. Queue 2010, 8, 20–30. [Google Scholar] [CrossRef]
- Wilbanks, B.A.; Langford, P.A. A review of dashboards for data analytics in nursing. Comput. Inform. Nurs. CIN 2014, 32, 545–549. [Google Scholar] [CrossRef]
- Yigitbasioglu, O.M.; Velcu, O. A review of dashboards in performance management: Implications for design and research. Int. J. Account. Inf. Syst. 2012, 13, 41–59. [Google Scholar] [CrossRef]
- Vercellis, C. Business Intelligence: Data Mining and Optimization for Decision Making; John Wiley & Sons: Hoboken, NJ, USA, 2011. [Google Scholar]
- Surlisa Widjaja and Tuga Mauritsius, THE DEVELOPMENT OF PERFORMANCE DASHBOARD VISUALIZATION WITH POWER BI AS PLATFORM | Source Details | Scope Database. Available online: https://sdbindex.com/Documents/index/00000002/00000-41045 (accessed on 21 October 2023).
- Magic Quadrant Research Methodology. Gartner. Available online: https://www.gartner.com/en/research/methodologies/magic-quadrants-research (accessed on 4 August 2023).
- Viktorović, M.; Yang, D.; de Vries, B.; Baken, N. Semantic web technologies as enablers for truly connected mobility within smart cities. Procedia Comput. Sci. 2019, 151, 31–36. [Google Scholar] [CrossRef]
- Microsoft, ‘O que é Power BI?-Power BI’. Available online: https://learn.microsoft.com/pt-pt/power-bi/fundamentals/power-bi-overview (accessed on 31 March 2023).
- Becker, L.T.; Gould, E.M. Microsoft Power BI: Extending Excel to Manipulate, Analyze, and Visualize Diverse Data. Ser. Rev. 2019, 45, 184–188. [Google Scholar] [CrossRef]
- Ferrari, A.; Russo, M. Introducing Microsoft Power BI; Pearson: London, UK, 2016. [Google Scholar]
- Harms, T. Benefits and Barriers of Self-Service Business Intelligence Implementation in Micro-Enterprises: A Case of ABC Travel & Consulting. Master’s Thesis, Univerza v Ljubljani, Ljubljana, Slovenia, 2018. Available online: https://run.unl.pt/handle/10362/64817 (accessed on 6 August 2023).
- Perdigão, S.S. Uma Solução de Business Intelligence para a área de Recursos Humanos da U.Porto. November 2021. Available online: https://repositorio-aberto.up.pt/handle/10216/138505 (accessed on 24 October 2023).
Figure 1.
Wixom and Watson’s business intelligence framework.

Figure 2.
Vercellis methodology applied to the use case.

Figure 3.
Excel sales data.

Figure 4.
Sales star model implemented in Power BI.

Figure 5.
Euro Mart Sales Report dashboard (by country, shipping mode, category report).

Figure 6.
Euro Mart Sales Report dashboard (with filters).

Figure 7.
Euro Mart Sales Report dashboard (decomposition tree with filters).

Figure 8.
Euro Mart Sales Report dashboard (profit, gross amount and number of units).

Figure 9.
Euro Mart Sales Report dashboard (country analyses).


Table 1.
Sales KPIs.
| KPIs/Metrics | Description (Maths Formula) | Analysis Examples |
|---|---|---|
| Number of units “Are business products selling?” | The number of units sold is the sum of all the quantities that can be analysed by month, quarter, year and even by day, depending on the granularity declared in the DW fact table. | Which countries order more? Which products sell more? Which brands sell more? |
| Sales volume “Is business steadily growing?” | The sales volume represents the sum of all the sales (quantity x price) that can be analysed by month, quarter, year and even by day, depending on the granularity declared in the DW fact table. | What are the daily, weekly, monthly, quarterly, and annual sales? What are the target countries? |
| Gross/net profit “Is the business profitable?” | The gross/net profit is the sum of all the product profits that can be analysed by month, quarter, year and even by day, depending on the granularity declared in the DW fact table. | Which are the most profitable products? Which are the most profitable brands? |
| Number of orders “Is the business increasing the number of orders?” | The number of orders is the sum of all the orders that can be analysed monthly, quarterly, yearly and even daily, depending on the granularity declared in the DW fact table. | Number of monthly orders? |
| Customer churn rate “Is the business losing customers?” | The percentage of customers who stop doing business with a company over some time. | How many customers are we losing in a period? |
| Customer retention rate “Is the business maintaining customers?” | The percentage of customers who continue to do business with a company over a given period. | How many customers does a company retain in a period? |
| Number of complaints | How many complaints in a period? |
Disclaimer/Publisher’s Note: The statements, opinions and data contained in all publications are solely those of the individual author(s) and contributor(s) and not of MDPI and/or the editor(s). MDPI and/or the editor(s) disclaim responsibility for any injury to people or property resulting from any ideas, methods, instructions or products referred to in the content. |
© 2023 by the authors. Licensee MDPI, Basel, Switzerland. This article is an open access article distributed under the terms and conditions of the Creative Commons Attribution (CC BY) license (https://creativecommons.org/licenses/by/4.0/).
Share and Cite
MDPI and ACS Style
Gonçalves, C.T.; Gonçalves, M.J.A.; Campante, M.I. Developing Integrated Performance Dashboards Visualisations Using Power BI as a Platform. Information 2023, 14, 614. https://doi.org/10.3390/info14110614
AMA Style
Gonçalves CT, Gonçalves MJA, Campante MI. Developing Integrated Performance Dashboards Visualisations Using Power BI as a Platform. Information. 2023; 14(11):614. https://doi.org/10.3390/info14110614
Chicago/Turabian StyleGonçalves, Célia Talma, Maria José Angélico Gonçalves, and Maria Inês Campante. 2023. "Developing Integrated Performance Dashboards Visualisations Using Power BI as a Platform" Information 14, no. 11: 614. https://doi.org/10.3390/info14110614
Note that from the first issue of 2016, this journal uses article numbers instead of page numbers. See further details here.