
Integrated Attack Tree in Residual Risk Management Framework

1
Institute of Future Transport and Cities, Coventry University, Coventry CV1 5FB, UK
2
Department of Computer Science, Swansea University, Swansea SA1 8EN, UK
*
Author to whom correspondence should be addressed.
Information 2023, 14(12), 639; https://doi.org/10.3390/info14120639
Submission received: 12 September 2023
/
Revised: 26 October 2023
/
Accepted: 18 November 2023
/
Published: 29 November 2023
(This article belongs to the Special Issue Feature Papers in Information in 2023)
Abstract
:Safety-critical cyber-physical systems (CPSs), such as high-tech cars having cyber capabilities, are highly interconnected. Automotive manufacturers are concerned about cyber attacks on vehicles that can lead to catastrophic consequences. There is a need for a new risk management approach to address and investigate cybersecurity risks. Risk management in the automotive domain is challenging due to technological improvements and advances every year. The current standard for automotive security is ISO/SAE 21434, which discusses a framework that includes threats, associated risks, and risk treatment options such as risk reduction by applying appropriate defences. This paper presents a residual cybersecurity risk management framework aligned with the framework presented in ISO/SAE 21434. A methodology is proposed to develop an integrated attack tree that considers multiple sub-systems within the CPS. Integrating attack trees in this way will help the analyst to take a broad perspective of system security. Our previous approach utilises a flow graph to calculate the residual risk to a system before and after applying defences. This paper is an extension of our initial work. It defines the steps for applying the proposed framework and using adaptive cruise control (ACC) and adaptive light control (ALC) to illustrate the applicability of our work. This work is evaluated by comparing it with the requirements of the risk management framework discussed in the literature. Currently, our methodology satisfies more than 75% of their requirements.
1. Introduction
A few decades ago, vehicles were equipped with a few simplistic electronic modules, such as electronic control units (ECUs), as they were considered standalone mechanical machines that did not need to communicate with each other or the environment. Nowadays, vehicles communicate with each other and with roadside infrastructure. This has become possible as modern cars are now equipped with approximately 100 or more ECUs that, among other things, enable vehicles to perform vehicle-to-vehicle (V2V) and vehicle-to-infrastructure (V2I) communications. As a result, there is a complex integration of these ECUs with sensors and communication technologies using multiple in-vehicle networks, including a controller area network (CAN). On the other hand, ECUs rely on inputs from sensors such as tyre pressure monitoring sensors (TPMS), acceleration, and wheel speed sensors to perform the respective operation. To achieve V2V and V2I, we also need communication technologies such as Bluetooth, WIFI, 4G/5G, etc. This integration of sensors and wireless communication leads us toward more complex and vulnerable systems because every new technological interface introduces a new attack surface in a system. Several published attacks on a vehicle [1,2] show that it is possible to exploit these attack surfaces that compromise a vehicle’s operational safety. Moreover, it is possible to attack a vehicle’s core function, such as brakes and engine, as discussed in [3]. Chrysler, Tesla, and BMW found multiple vulnerabilities that can be exploited and affect the car’s core functionality [1,2,4].
These issues force us to consider cybersecurity aspects from the start of the development lifecycle of a vehicle. The standard ISO/SAE 21434 [5] was recently designed to address these issues; it requires managing and maintaining cybersecurity activities in a distributed environment. It also documents continual cybersecurity activities and provides information about considering aspects of cybersecurity in the concept, development, production, and operational phases of a vehicle. Clause 15 of ISO/SAE 21434 [5] contains requirements for threat analysis and risk assessment (TARA) that help to identify threats and evaluate the cybersecurity risk.
Standards provide guidelines that are followed in the process of design and development. Systematic frameworks specifying vulnerabilities and threats are essential to evaluate a system’s security as they look at the information and interactions that can influence a system. Considering this, one can develop different security objectives, calculate risk, and identify appropriate countermeasures. A security framework is built to correlate the features in an organised manner. Instead of brainstorming sessions and group discussions, the security framework that systematically evaluates threats and risks to a system is preferred, and such evaluation needs to be performed early in the design and development phases.
This work is an extension of our previous work [6], in which a framework was proposed that calculates the risk to an automotive system and evaluates the residual risk left after applying appropriate defences. There are various threat modelling models, such as attack trees [7], SAHARA [8], FMVEA [9], etc. According to [10], a framework should be able to handle risk propagation as the risk of attack on any asset changes as an attacker gains further access to a system. To address this problem, an integrated attack tree-based approach is proposed that is generic and applicable to CPSs. Integrated attack trees present a bird’s-eye view of the possible ways to compromise a system. This work is evaluated by applying our method on ACC and ALC as the use cases. This paper includes the following contributions:
- Definition of steps for applying the proposed residual cybersecurity risk management framework.
- A method to generate an integrated attack tree for multiple attacks using a system diagram.
- A method to convert an attack tree to a K-partite graph.
- An algorithm to generate an integrated attack tree from a system diagram and an algorithm for generating a K-partite graph from an attack tree.
The rest of this paper is structured as follows. Section 2 discusses the background, which includes the requirements of the risk management framework and describes automotive standards and security models. This section also discusses different methods to generate attack trees. Section 3 describes the case studies, i.e., ACC and ALC. Section 4 explains the residual risk management framework and briefly discusses the steps required to implement it. Section 5 provides a step-by-step guide for implementing the proposed framework. Section 6 and Section 7 contain the discussion and conclusion, respectively.
2. Background
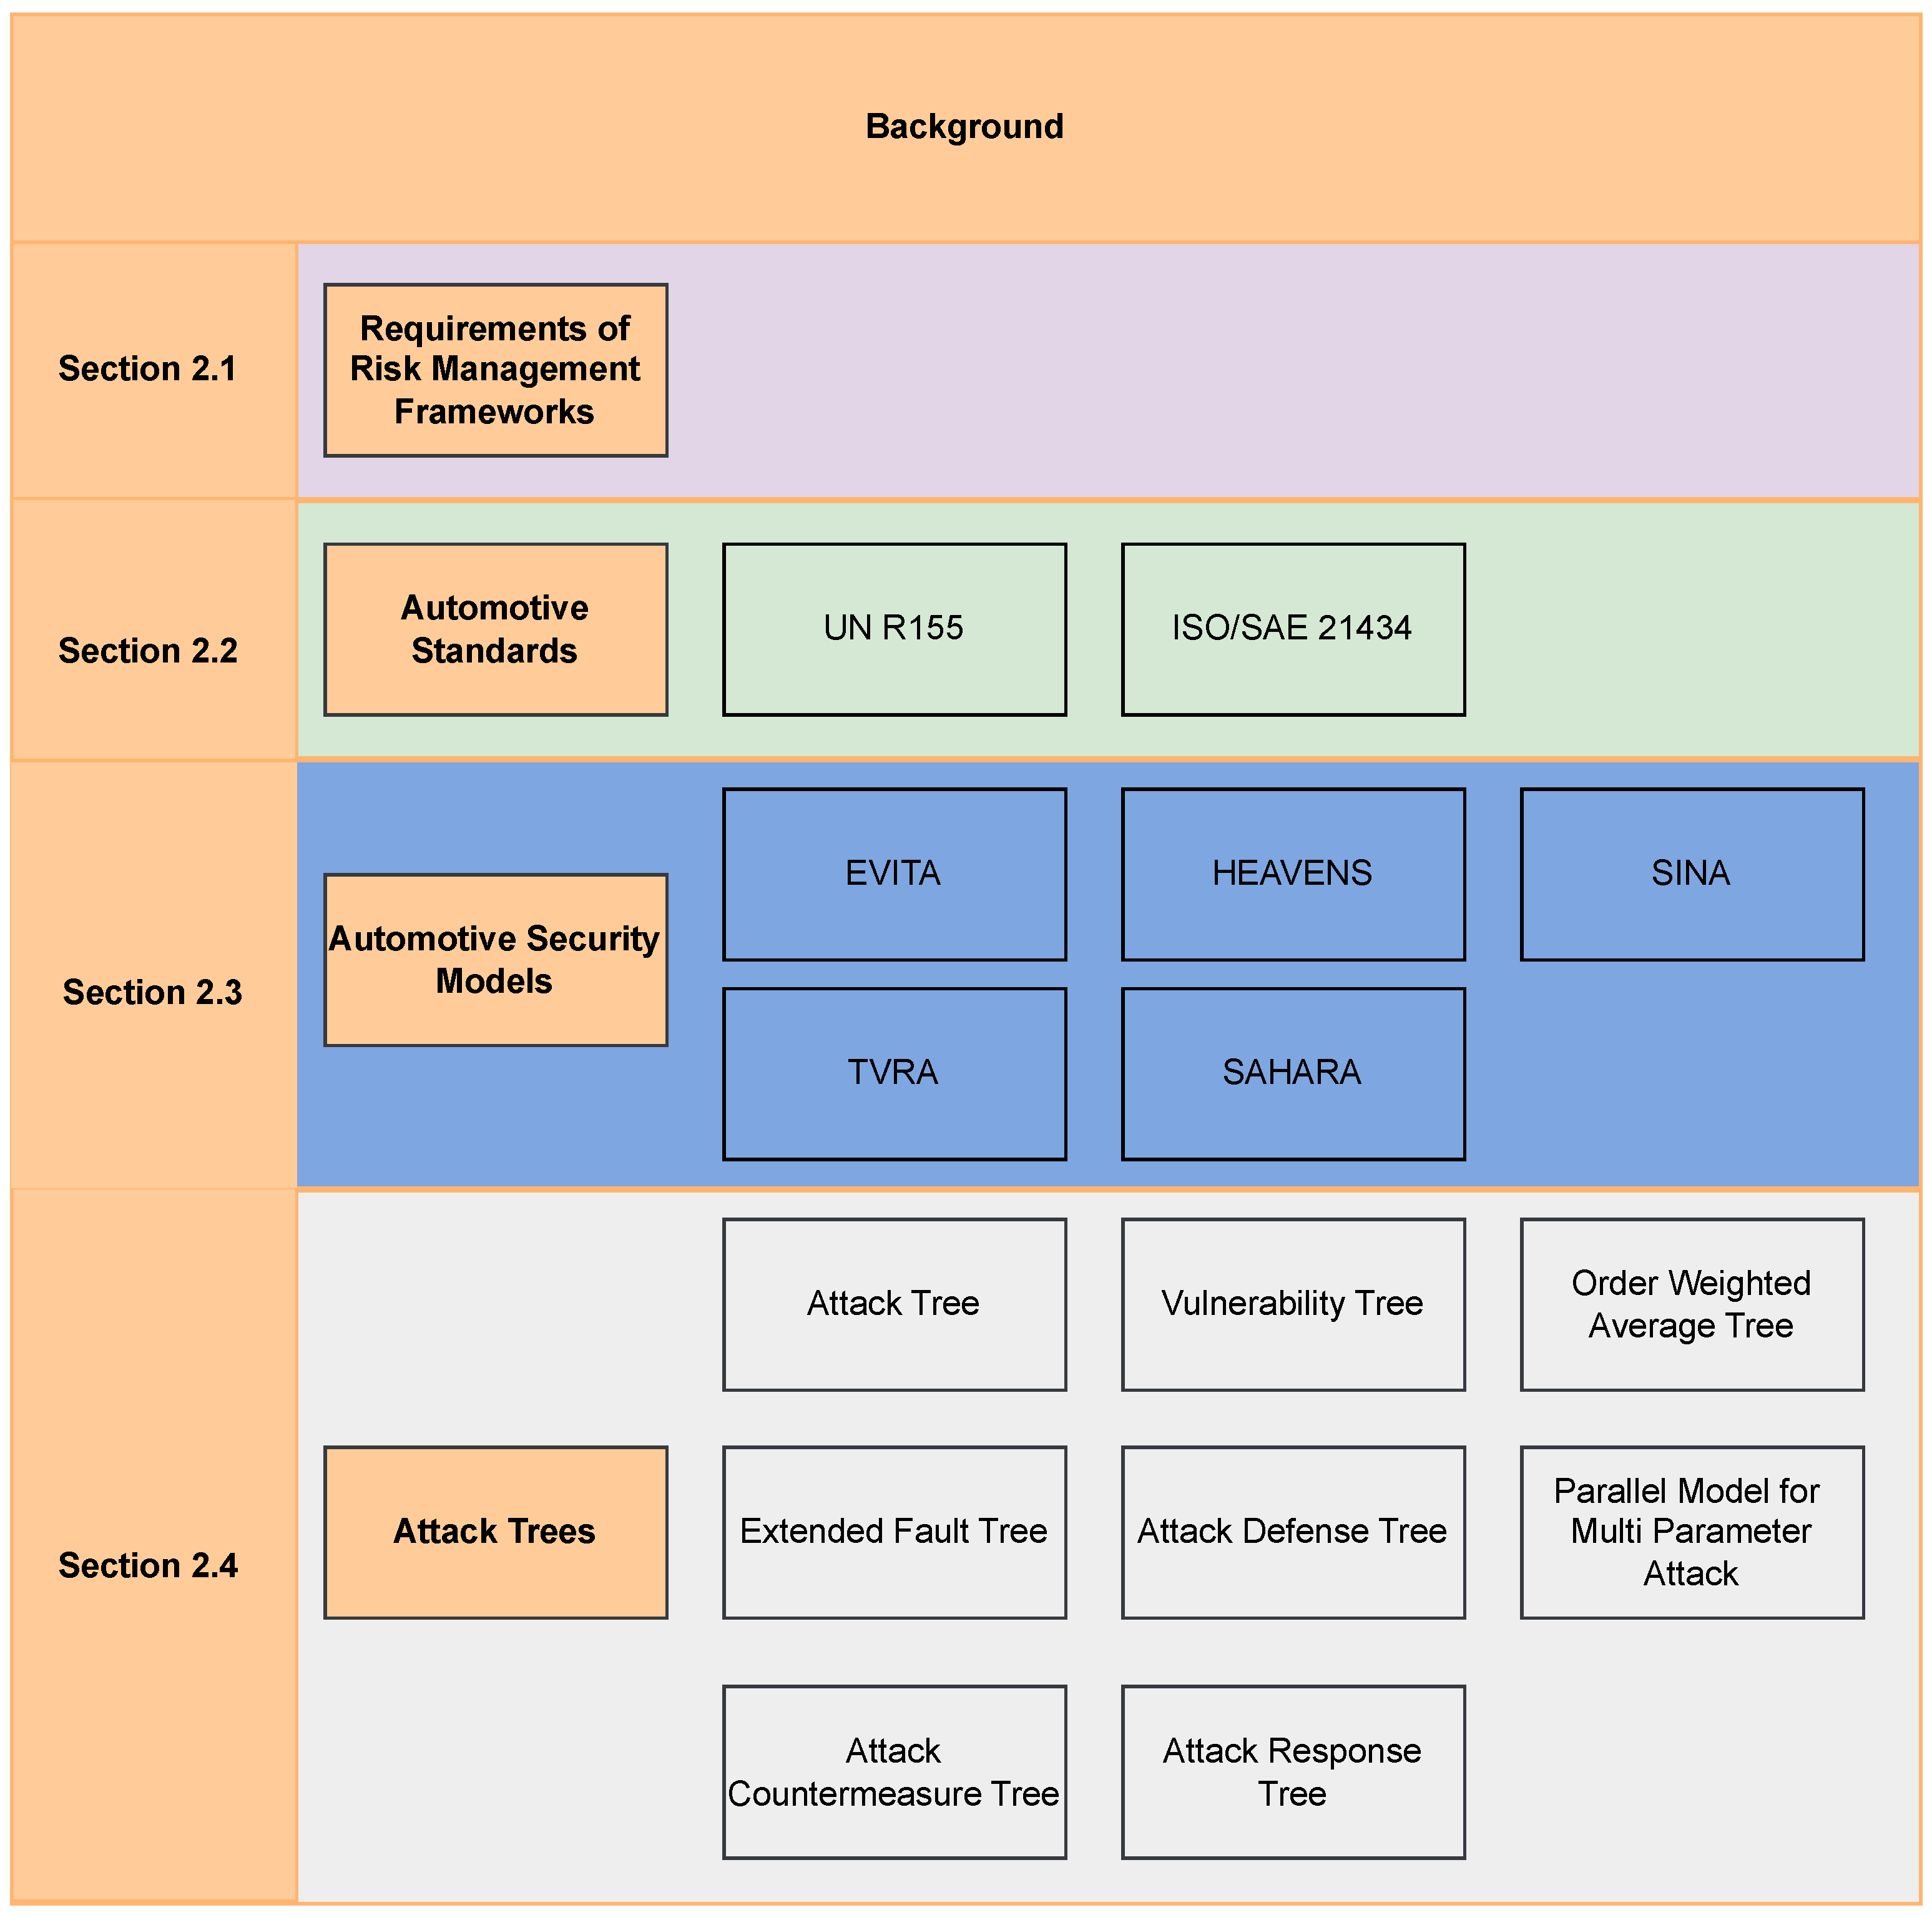
In this section, we present some background regarding our research. We begin with the risk management framework requirements and the available standards considering cybersecurity aspects in the automotive industry. We present a brief overview of security models for automotive cybersecurity and discuss different attack trees. The background structure is displayed in Figure 1.
2.1. Requirements of a Risk Management Framework
The introduction of modern technologies in vehicles revolutionised the automotive industry. Modern vehicles can also be considered as CPSs. Risk assessment is required to design any CPS so that the manufacturer can identify threats and their impact that will eventually help in risk management. Therefore, different risk management frameworks (RMFs) are proposed to build a robust, secure, resilient system. There are a few requirements to develop an RMF, which are outlined in [5,11] and reproduced below.
- Consistent and unified: It must adopt consistent processes within a comprehensive and unified framework, ensuring that risk is managed effectively, efficiently, and coherently across an organisation.
- Abstraction: It should support the abstraction of entities involved in the risk management process [14]. In turn, it should unleash a general approach not bound to any particular domain, permitting wide applicability.
- Scalability: It must support scalable qualitative risk management regardless of the size and complexity of the organisation.
- Automation: It should support parametrisation and automation of different phases of its execution [14].
- Ranking: It must provide simple yet intuitive indicators measuring the results of the risk management framework with respect to the risk criteria of the organisation.
- Assurance integration: It must integrate the risk management process with assurance techniques. Assurance techniques evaluate the effectiveness of the countermeasures operated by the organisation to minimise the risk and enable a realistic view thereof [11].
- Continuous Process: It should support a continuous risk management process, enabling prompt reactions to any change in the organisation and implemented countermeasures.
- Propagation: It should manage risk propagation between resources under the assumption that, in case an adverse event happens, its impact propagates to different resources [15].
2.2. Automotive Standards
Considering the cybersecurity aspect of the automotive domain, two major standards are available: ISO/SAE 21434 and UN R155. A brief overview of both standards is as follows.
2.2.1. UN R155 [16]
The United Nations Economic Commission for Europe (UNECE) is one of the five regional commissions that is under the jurisdiction of the United Nations Economic and Social Council. The Original Equipment Manufacturers (OEMs) of the automotive industry in countries under the UNECE group must comply with UN R155 [16]. It covers two aspects: First, establishing a cyber security management system (CSMS) for addressing organisational processes and policies. A CSMS helps to manage cyber risk throughout the entire life cycle of the vehicle. Second, the required documentation process and compliance certification for CSMSs to approve new cars in the market.
UN R155 [16] has three parts. Part A describes vulnerabilities, threats, and attack methods in a table. It discusses 32 threats categorized based on different attack surfaces, i.e., communication channels, back-end servers, update procedures, etc. Part B is a list of mitigation actions for the threat related to a vehicle. It provides high-level solutions that need to be performed to secure a system. Part C is a list of actions against threats originating from outside the vehicle, such as for the car manufacturers’ server and unauthorised access to the back-end server.
2.2.2. ISO/SAE 21434 [5]
This standard was released in late 2021. It aims to provide cybersecurity guidelines in engineering vehicles’ electrical and electronic systems. This standard also guides OEMs and their suppliers with recommendations for handling cybersecurity risk during the design, production, and operational phases. ISO/SAE 21434 [5] consists of 15 clauses and 8 annexes in which different requirements (RQ), work products (WP), and recommendations (RC) are provided. In Clause 5, the standard provides guidance and instruction about strong cybersecurity culture and procedure for sharing information in <RQ-05-06> and <RQ 05-09>, respectively. Clause 7 discusses the distribution of responsibilities to reduce cybersecurity risk. Continuous activity monitoring and evaluation are addressed in Clause 8. Clauses 9–12 give information about different phases in the product development lifecycle, including item definition, cybersecurity goals, integration and verification, and validation. Clause 13 defines an incident response plan and other remedial measures in the event of any cybersecurity incident arising.
Clause 15 is about TARA, where the first step is to identify assets and their damage scenarios, as discussed in <RQ-15-01>,<RQ-15-02>. In <RQ-15-03>. It is instructed to identify threat scenarios, and for that purpose, suggested methods are EVITA, STRIDE, TVRA, or PASTA. The next step of TARA is impact rating, which can be categorized based on safety, operational, financial, and privacy <RQ-15-04>. Different impact ratings are classified as severe, major, moderate, and negligible. Attack feasibility rating is determined using either a potential-based approach, an attack-vector-based approach, or CVSS, as mentioned in <RQ-15-10>. Lastly, risk value determination is based on the risk matrix formula discussed in <RQ-15-16>. Risk treatment decisions are based on four options: risk reduction, risk avoidance, risk retaining, and risk sharing. ISO/SAE 21434 is the first ISO standard in automotive cybersecurity, so automotive companies must use it to comply with the cybersecurity requirements of modern vehicles.
2.3. Automotive Security Models
Security in automotive is different from IT security as it directly impacts the safety of humans and the roadside environment. There are several research projects that consider security in the transportation system. Projects like PRESERVE [17], EVITA [18], and OVERSEE [19] were launched to ensure the security of the transportation system. We are going to discuss some projects and security models that are developed to address automotive cybersecurity issues, Table 1 provides the summary of these models.
2.3.1. EVITA
E-Safety Vehicle Intrusion Protected Applications (EVITA) [18] have a security process and model proposed to analyse the risk to the vehicular IT system [20]. In the security process, the security requirements of a system are defined through a set of use cases. Risk is defined as the possibility of a successful attack and its impact if it is successful. The attack potential is calculated using the Common Methodology for Information Technology Evaluation (CEM) [21].
Values for feasibility or likelihood depend on different parameters, such as access to the target and available information, the expertise and required tools, time of completion, or elapsed time of the attack. Attack paths to secure any objective can be identified using attack trees, whereas damage potential in the automotive domain is assessed according to four factors: safety, financial, operational, and privacy in the automotive domain. This risk assessment approach provides developers and manufacturers with structured methods to balance security risk and cost so that appropriate decisions are taken.
2.3.2. HEAVENS
Healing Vulnerabilities to Enhance Software Security and Safety (HEAVENS) is funded by VINNOVA, and its duration was from April 2013 to March 2016. HEAVENS studied tools and methods for evaluating the security of automotive electrical and electronics systems (EE) [22]. HEAVENS provides an outline to model a framework to analyse threats and assess the risk to an EE system. In addition, it is possible to derive security requirements and measures using HEAVENS. The distinctive feature of this project is that it extended the classic CIA triad model to eight security attribute objectives applied to the automotive domain. Threat analysis is accomplished using STRIDE, whereas threat level and the likelihood of threats are determined using CEM, like EVITA [23]. The impact is calculated like EVITA, again using safety, financial, operational, and privacy. The security level is derived from the impact and threat level that guides risk management.
2.3.3. SINA
Security in Networked Automotive (SINA) [24] is designed to analyse and identify security issues in the connected vehicular system. SINA utilised a data flow diagram as STRIDE to analyse the system. It is more concerned about connected vehicles; therefore, they defined an entity named communication zone as boundaries in the communication network. Threats are categorized into seven different classes. SINA considers tampering, denial of service, and information disclosure as STRIDE. There are some other specific threat types for SINA, such as “creation of additional data on the communication channel”, “eavesdropping on the communication channel”, “modification of transient information as it is exchanged in the data flow”, and lastly, “blocking the data flow”. Threats are enumerated using a model-based approach based on DFDs; moreover, attack trees are built based on the most severe threat. The effects of the risk are evaluated based on safety, and other factors such as financial, operational, and privacy are not considered.
2.3.4. SAHARA
Security-Aware Hazard and Risk Analysis (SAHARA) [8] is designed to analyse the safety and security of a vehicle for earlier development phases. Threats are classified as STRIDE and considered as Hazard Analysis and Risk Assessment (HARA) for safety analysis. The impact of a threat is quantified based on resources, threat criticality, and knowledge. SAHARA considered the high criticality of threats instead of estimating the likelihood of threats. Highly critical threats can violate safety goals. If the safety goal is breached, threats are handed over to safety analysis again; this ensures the eventual development of a safe system.
2.3.5. TVRA
The European Telecommunication Standard Institute proposes a Threat Vulnerability and Risk Analysis Method (TVRA). This method was developed for the telecommunication industry. Later on, it was adopted for vehicle-to-vehicle (V2V) communication platforms [25]. The target of the TVRA is to identify threats and risks to the communication of V2V and vehicle-to-infrastructure (V2I) in the intelligent transportation system. Five security objectives are considered in TVRA: confidentiality, integrity, availability, authenticity, and accountability. Threats are manipulation, interception, denial of service, and repudiation of messages. The potential of a threat is evaluated based on equipment, opportunity, expertise, time, and knowledge.
There are numerous other cyber RMFs in the automotive domain, such as [26], in which the authors present a simplified method for dynamically managing security risks in the context of CAVs. It focuses on identifying the most critical attacks that require attention in terms of monitoring and adapting to changes in the environment. The proposed approach captures changes in risk as CAVs transition to new environments. It incorporates a knowledge-based system and a comprehensive risk assessment, including identifying potential attacks, critical components, and vulnerable attack surfaces and re-evaluating mitigation measures. In another work [27], the authors combine various potential attack vectors and efficiently consider the resources available to attackers. It permits an examination of the onboard architecture to identify previously overlooked attack combinations, thereby strengthening the security of connected and autonomous vehicles (CAVs). However, it should be noted that this work needs an in-depth analysis of the scalability of the method. A PIER framework was proposed in [28], which focuses on enhancing the robust safety and security of CAVs. It introduces a novel feature to the cybersecurity risk assessment framework, which includes factors such as exposure and recovery, in addition to the traditional consideration of probability and impact. Furthermore, the study considers over-the-air software updates for collision avoidance systems. Additionally, the work needs an explanation regarding the practical application of these findings in real-world environments. It predominantly relies on the assumption that implementing security requirements effectively mitigates risks but does not provide guidance on how to implement them. The work [29] introduces a method for security risk analysis that entails establishing a mathematical model to evaluate risk values based on severity, probability, and human control. It considers both human capabilities and the level of vehicle automation to perform a comprehensive security risk analysis. The SINADRA framework was proposed in [30], designed to tackle the challenges of ensuring the safety of autonomous vehicles through the facilitation of dynamic risk assessment. This approach proposes a model-based methodology incorporating probabilistic runtime risk monitors while utilising tactical situational awareness and considering human risk assessment with uncertain knowledge. This approach employs a Bayesian network-based method to balance residual risk and driving performance in real time. However, it is important to note that using a Bayesian network can be computationally demanding. The probabilistic model, with its inherent uncertainties in the risk assessment process, may require greater consistency. Furthermore, it is of utmost importance to assess the collection of environmental knowledge and evaluate how accurately it is acquired and utilized. It is worth mentioning here that in the above-mentioned security models and RMFs only, SINADRA [30] considers the residual risk after applying the countermeasures, whereas it is for autonomous vehicles while assuming the environmental variables with the Bayesian network. We are considering residual risk in RMF while utilising a holistic view of the attack tree that will help analysts make better decisions about the automotive system’s security level.
2.4. Attack Tree
Attack trees are used as a part of our approach; thus, it is vital to have an overview of available methods to generate attack trees. Table 2 provides a summary of a few well-known attack tree models. Therefore, a brief overview of the different attack trees is provided in this section.
Attack trees are represented in a tree structure, as the name suggests. It is an AND/OR tree structure that graphically assesses the system’s security. In the attack tree formalism, an attacker goal is placed at the top root of a tree, and subsequent subgoals are either disjunctive (denoted by OR) or conjunctive (denoted by AND). This recursive process is continued until we reach basic actions. In 2005, Mauw and Oostdijk formalised attack trees by characterising the semantics and transformation using their proposed framework [31]. Weiss [32] suggested a quantification method in which values are assigned to the leaf nodes, and different functional operators are proposed to calculate the cost, time, and required skill level [33,34].

Table 2.
Summary of types of attack trees.
| Tree Type | Attack or Defense | Main Purpose | Connector | Short Description |
|---|---|---|---|---|
| Attack Tree (AT) [33] | Attack | Security Model | AND, OR | The primary visual structure of the attack tree was proposed in 1994 by Schiener. It includes the representation of attack steps in the form of a tree with different conjunction or disjunction. |
| Augmented Tree [35] | Attack | Security Model | AND, OR | Provides a probabilistic measure of how much an attacker can compromise a system. |
| Augmented Vulnerability Tree [36] | Attack | Risk | AND, OR | Combines fault trees, attack trees, and cause–consequence diagrams. This was used to compute the financial risk to a computer-based information system. |
| Ordered Weighted Average (OWA) [37] | Attack | Quantitative | OWA operator | Changes the AND and OR nodes to OWA nodes, quantifiers such as most, some, half, etc. It is well suited to model uncertainty where the number of actions that need to be satisfied is unknown. |
| Parallel Model for Multi-Parameter Attack [38] | Attack | Quantitative | AND, OR | Provides a method for quantitative analysis when several interdependent parameters are considered for an attack. It was believed that the attacker always chooses the most profitable attack. |
| EFT [39] | Attack | Unification | AND, OR, merge gates | Combines deliberate acts from attack trees and random failures from fault trees. |
| Attack Defence Tree (ADT) [40] | Both | Security Model | AND, OR, countermeasure | Involves both types of nodes (attack and defence). It is a combination of an attack tree and a protection tree. The proposed formalism allows putting a child node of an opposite type. |
| Attack Countermeasure Tree (ACT) [41] | Both | Security Model | AND, OR, count leaves | Has three distinct classes: attack events, detection events, and mitigation events. Automated generation of ACT is accomplished using a minimal cut set that helps to determine possible ways of attacking, defending and identifying the most critical component in a system. |
| Attack Response Tree (ART) [42] | Both | Intrusion Detection | AND, OR, response | Part of the response and recovery system in the intrusion detection system. To automate and provide instantaneous response to intrusion with minimal delay. |
Vulnerability trees are meant to depict the hierarchical interdependence of different vulnerabilities in a system. A vulnerability tree is very similar to an attack tree; instead, it considers vulnerability as the root event. In 2008, the authors of [36] extended the vulnerability tree model to develop an augmented vulnerability tree. They used attack trees, fault trees, vulnerability trees, and cause–consequence diagrams to evaluate the financial risk that any computer-based information system faces. This evaluation is the numeric value called the degree of security. In [43], augmented vulnerability trees are used to evaluate the security of the SCADA system. There are also augmented trees that provide a probabilistic measure of the attacker’s progress to complete an attack successfully [35]. Different variants are later proposed, such as one augmented attack tree that tells the probability of a successful attack and another that considers the quality of detectability [44].
In [37], the authors proposed the ordered weighted average (OWA) in which the AND/OR nodes of an attack tree are replaced with OWA nodes. If there is a need to model uncertainties and reason about situations in which actions are required to be satisfied are unknown, OWA is quite a suitable option. In 2005, researchers from different institutes in Estonia published seven follow-up papers from 2006 to 2013 that discuss the parallel model for a multiparameter attack tree [38,45,46,47,48,49]. The reason for analysing multiparameter attack trees is that, previously, attack tree quantitative analysis was performed using one specific attribute, such as the cost or feasibility of an attack. In the real environment, interactions between multiple parameters play a vital role. The model assumes the attacker will only consider those paths whose cost is less than their benefits. Multiparameter attack’s expected outcomes are gains to the attacker when an attack becomes successful, the probability of getting caught, the likelihood of success, and the cost of an attack. The proposed methods involve game theory [50] or some high-time complexity models [45]. This approach was used to evaluate the security of the E-voting system in [51].
The extended fault tree (EFT) [39] was presented in 2007, and it is a combination of deliberate security actions captured by the attack tree and random failures caught by the fault tree. EFTs and attack trees are structurally very similar. The difference comes in the type of event that can be modelled. In the attack tree, only malicious attackers’ actions are modelled, whereas in the EFT, the primary action can include accidental failures, security events, and non-malicious activities. Logically, AND/OR gates are explicitly represented as classical fault trees. The step-by-step method to construct the EFT is presented in [52]. An example of chemical plants is analysed using the EFT in which different failure and attack scenarios are generated in [52]. The attack defense tree (ADT) allows security situations in which we can model two opposing players, such as an attacker and a defender [40]. In the ADT, both attacks and defences are present in the tree. The formalism of the tree allows a node to have one opposite kind of child node. Roy and Kim proposed an attack counter measure tree (ACT) in 2010 [41,53]. It is used to model attacks and defences. The ACT is different from the defence tree because it allows it to place countermeasures at any tree node. The ACT involves three classes, attack, mitigation, and detection event. Identification of attack countermeasures is performed using the automated generation of the minimal cut set. Border gateway protocol attacks in the SCADA were studied in which malicious insider attacks were modelled using the ACT [54].
The attack response tree (ART) was proposed in 2009 [42]. It was developed to automate the intrusion response system. The proposed approach is a stochastic game between a leader (response and recovery engine) and a follower (attacker). Attack trees differ from attack response trees as they are built to display applicable ways to achieve an attack successfully. On the other hand, in the attack response tree, the root contains consequences that could be of the three classic security properties (Confidentiality, Integrity, Availability) [55]. It is a probabilistic verification of the security property to identify whether it has been violated.
3. Case Study
In this work, two primary automotive systems are considered as use cases: ACC and ALC. A brief introduction of these systems is as follows.
3.1. Adaptive Cruise Control
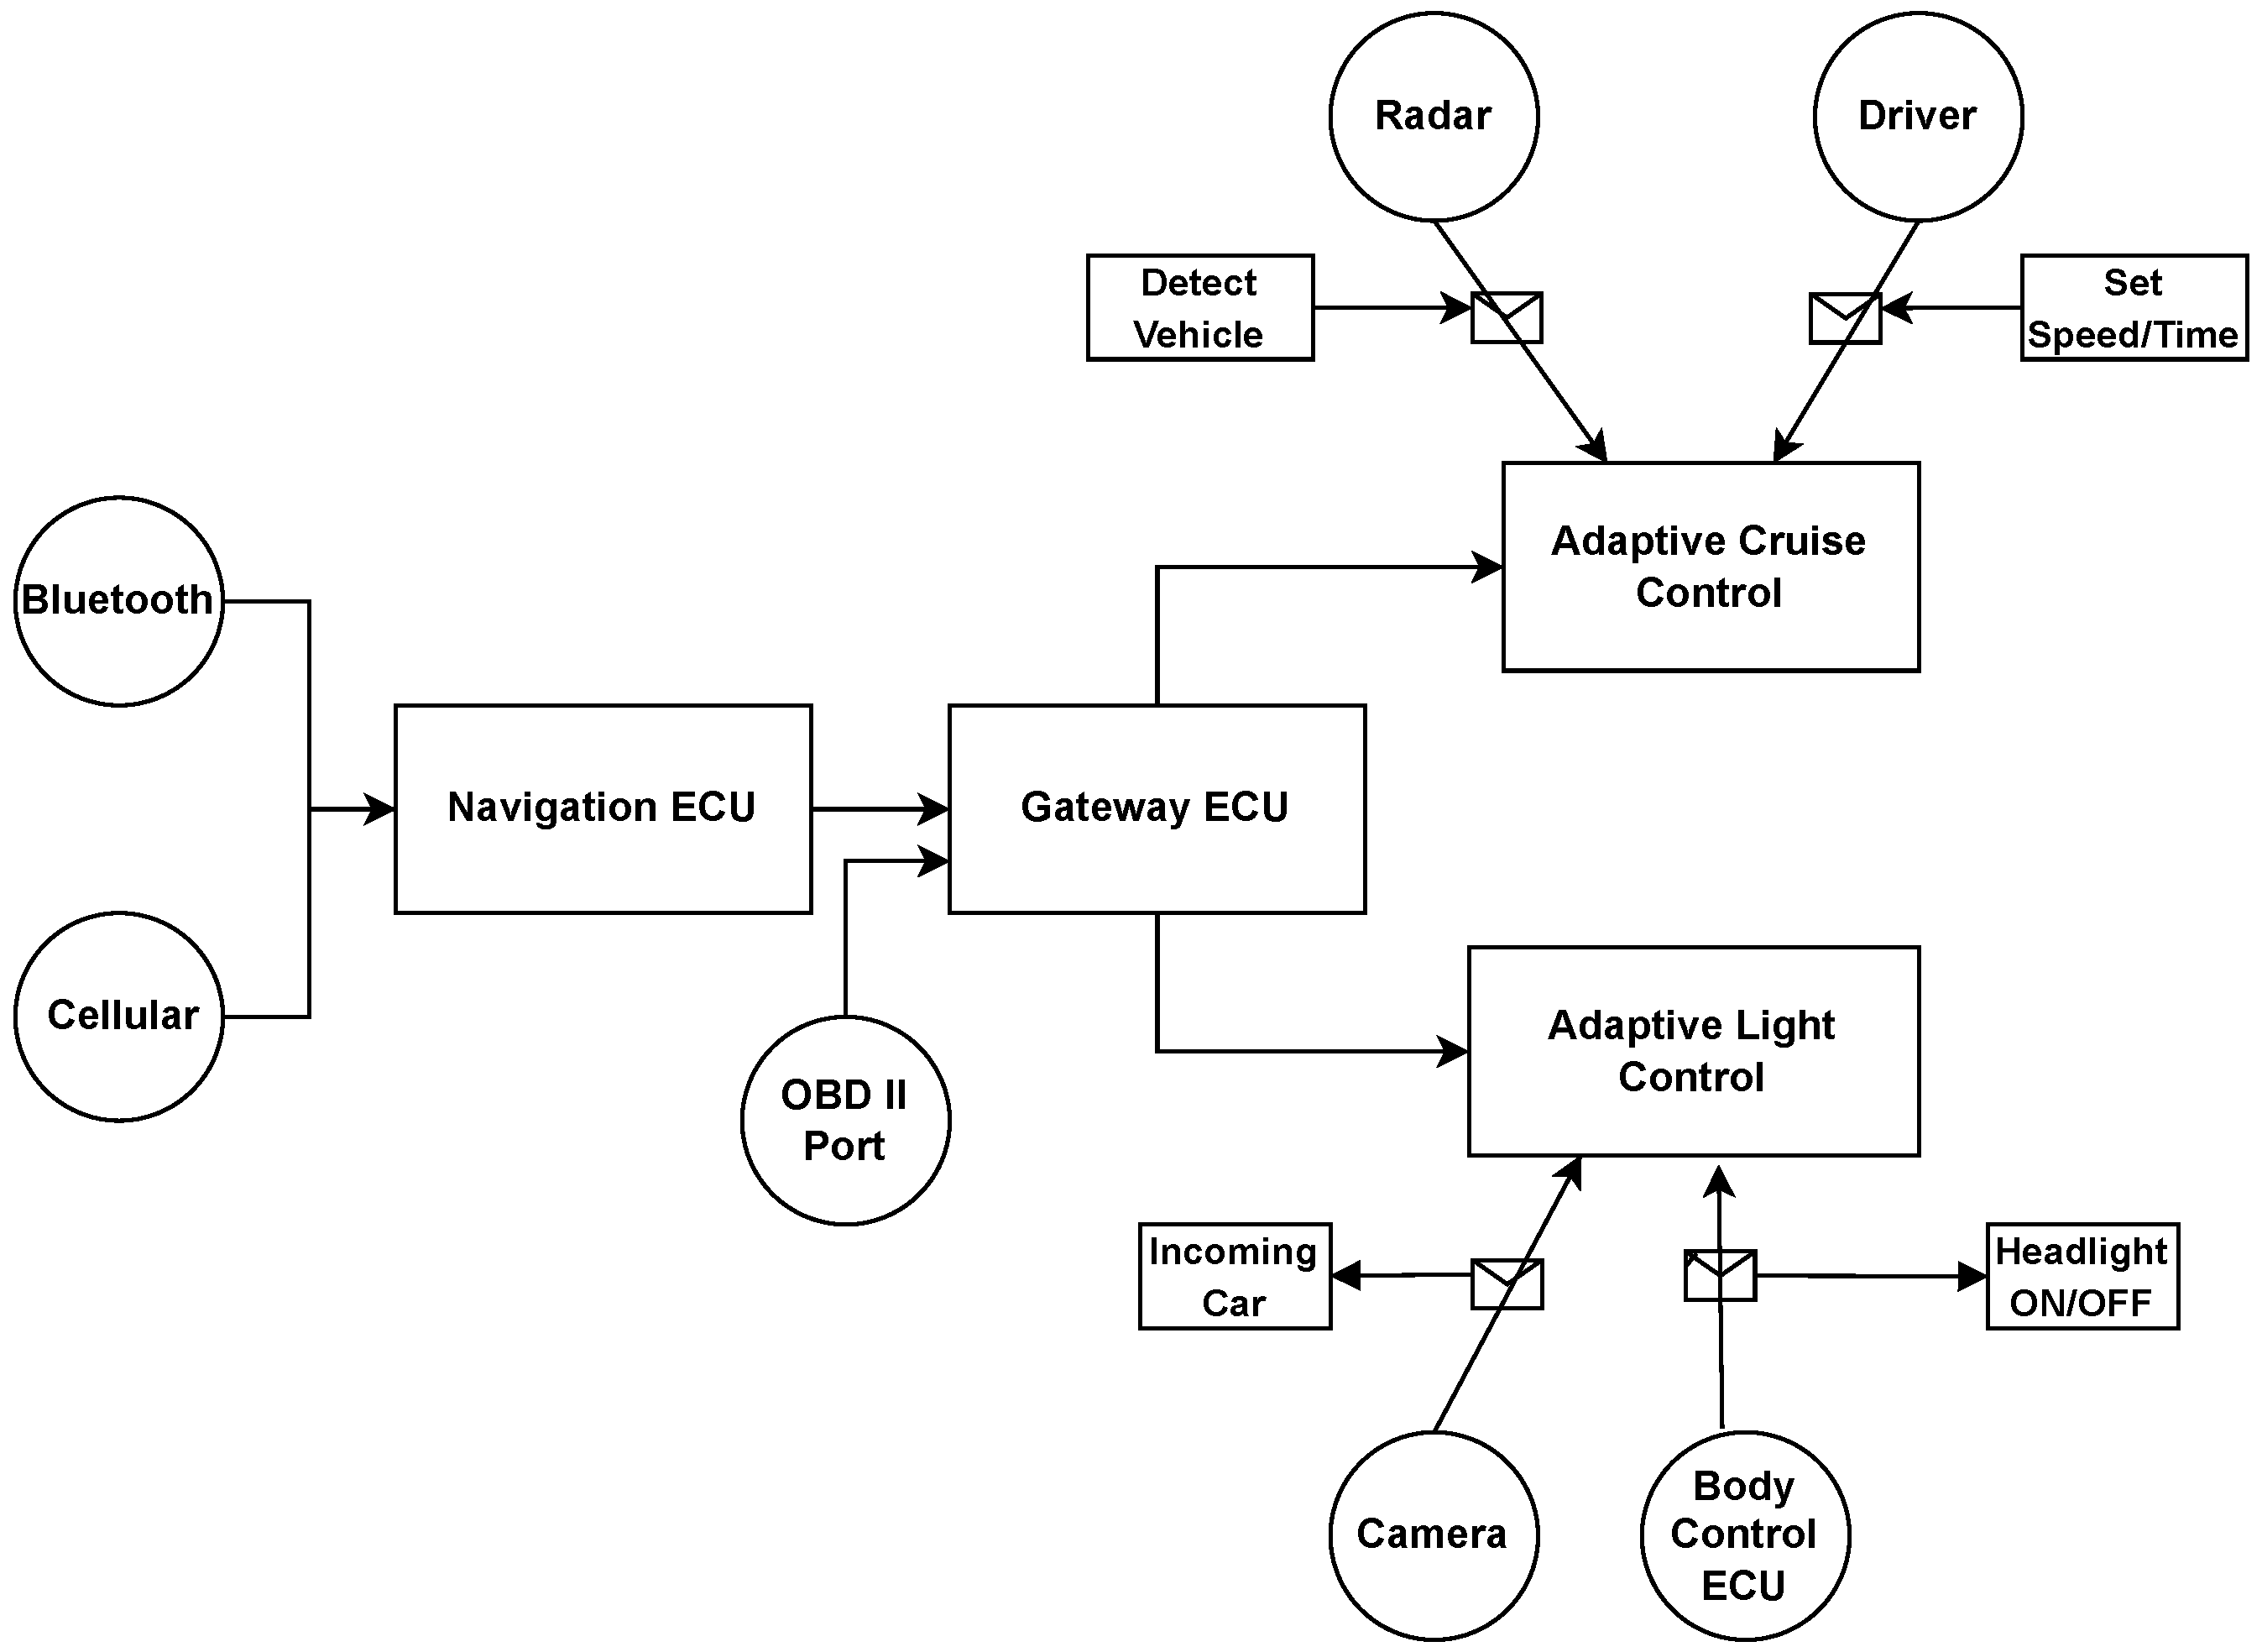
ACC is now a critical feature of modern vehicles. It is an extension of traditional cruise control. The cruise control system adjusts vehicle velocity and follows the car ahead while automatically controlling speed to maintain the distance with the vehicle ahead. The cruise control system has radar, Lidar, or video camera that helps detect and maintain distance from the vehicle in front. The user sets the vehicle’s velocity if there is no vehicle immediately in front. The system architecture of the ACC can be split into four major parts, as shown in Figure 2, signal collecting, signal processing, signal actuating, and signal display.
The switch control turns the ACC ON or OFF. If the switch is turned ON and the driver sets the headway, then the module depends on the ACC. The range sensor tries to find the vehicle in front. If there is no car in front, it follows the user-set velocity, which controls speed and the engine control module. The distance control module is activated if the next object runs slow or too close, allowing it to maintain the user-set distance. The ACC turns off if a switch is turned off or the brake or accelerator pedal is touched [56].
Figure 2.
Adaptive cruise control architecture [56].
Figure 2.
Adaptive cruise control architecture [56].

3.2. Adaptive Light Control
It is challenging to drive a car without proper lighting. The conventional headlight illuminates the road ahead but does not illuminate the bends and blind spots. It is a principal reason for an accident as well. Another problem is that incoming cars with high-intensity white lights cause discomfort to an on-coming driver. Therefore, ALC systems are introduced. These contain a gyroscope, servo motors, and a light sensor or camera to detect the upcoming vehicle. The gyroscope is used for levelling the headlight according to the road, whereas the servo motor is used for rotating the headlights so that blind spots and curved roads can be appropriately seen by the driver [57].
4. Methodology
This section will present our proposed residual risk management framework and approach to combining attack trees, including algorithms and examples.
4.1. Residual Risk Management Framework
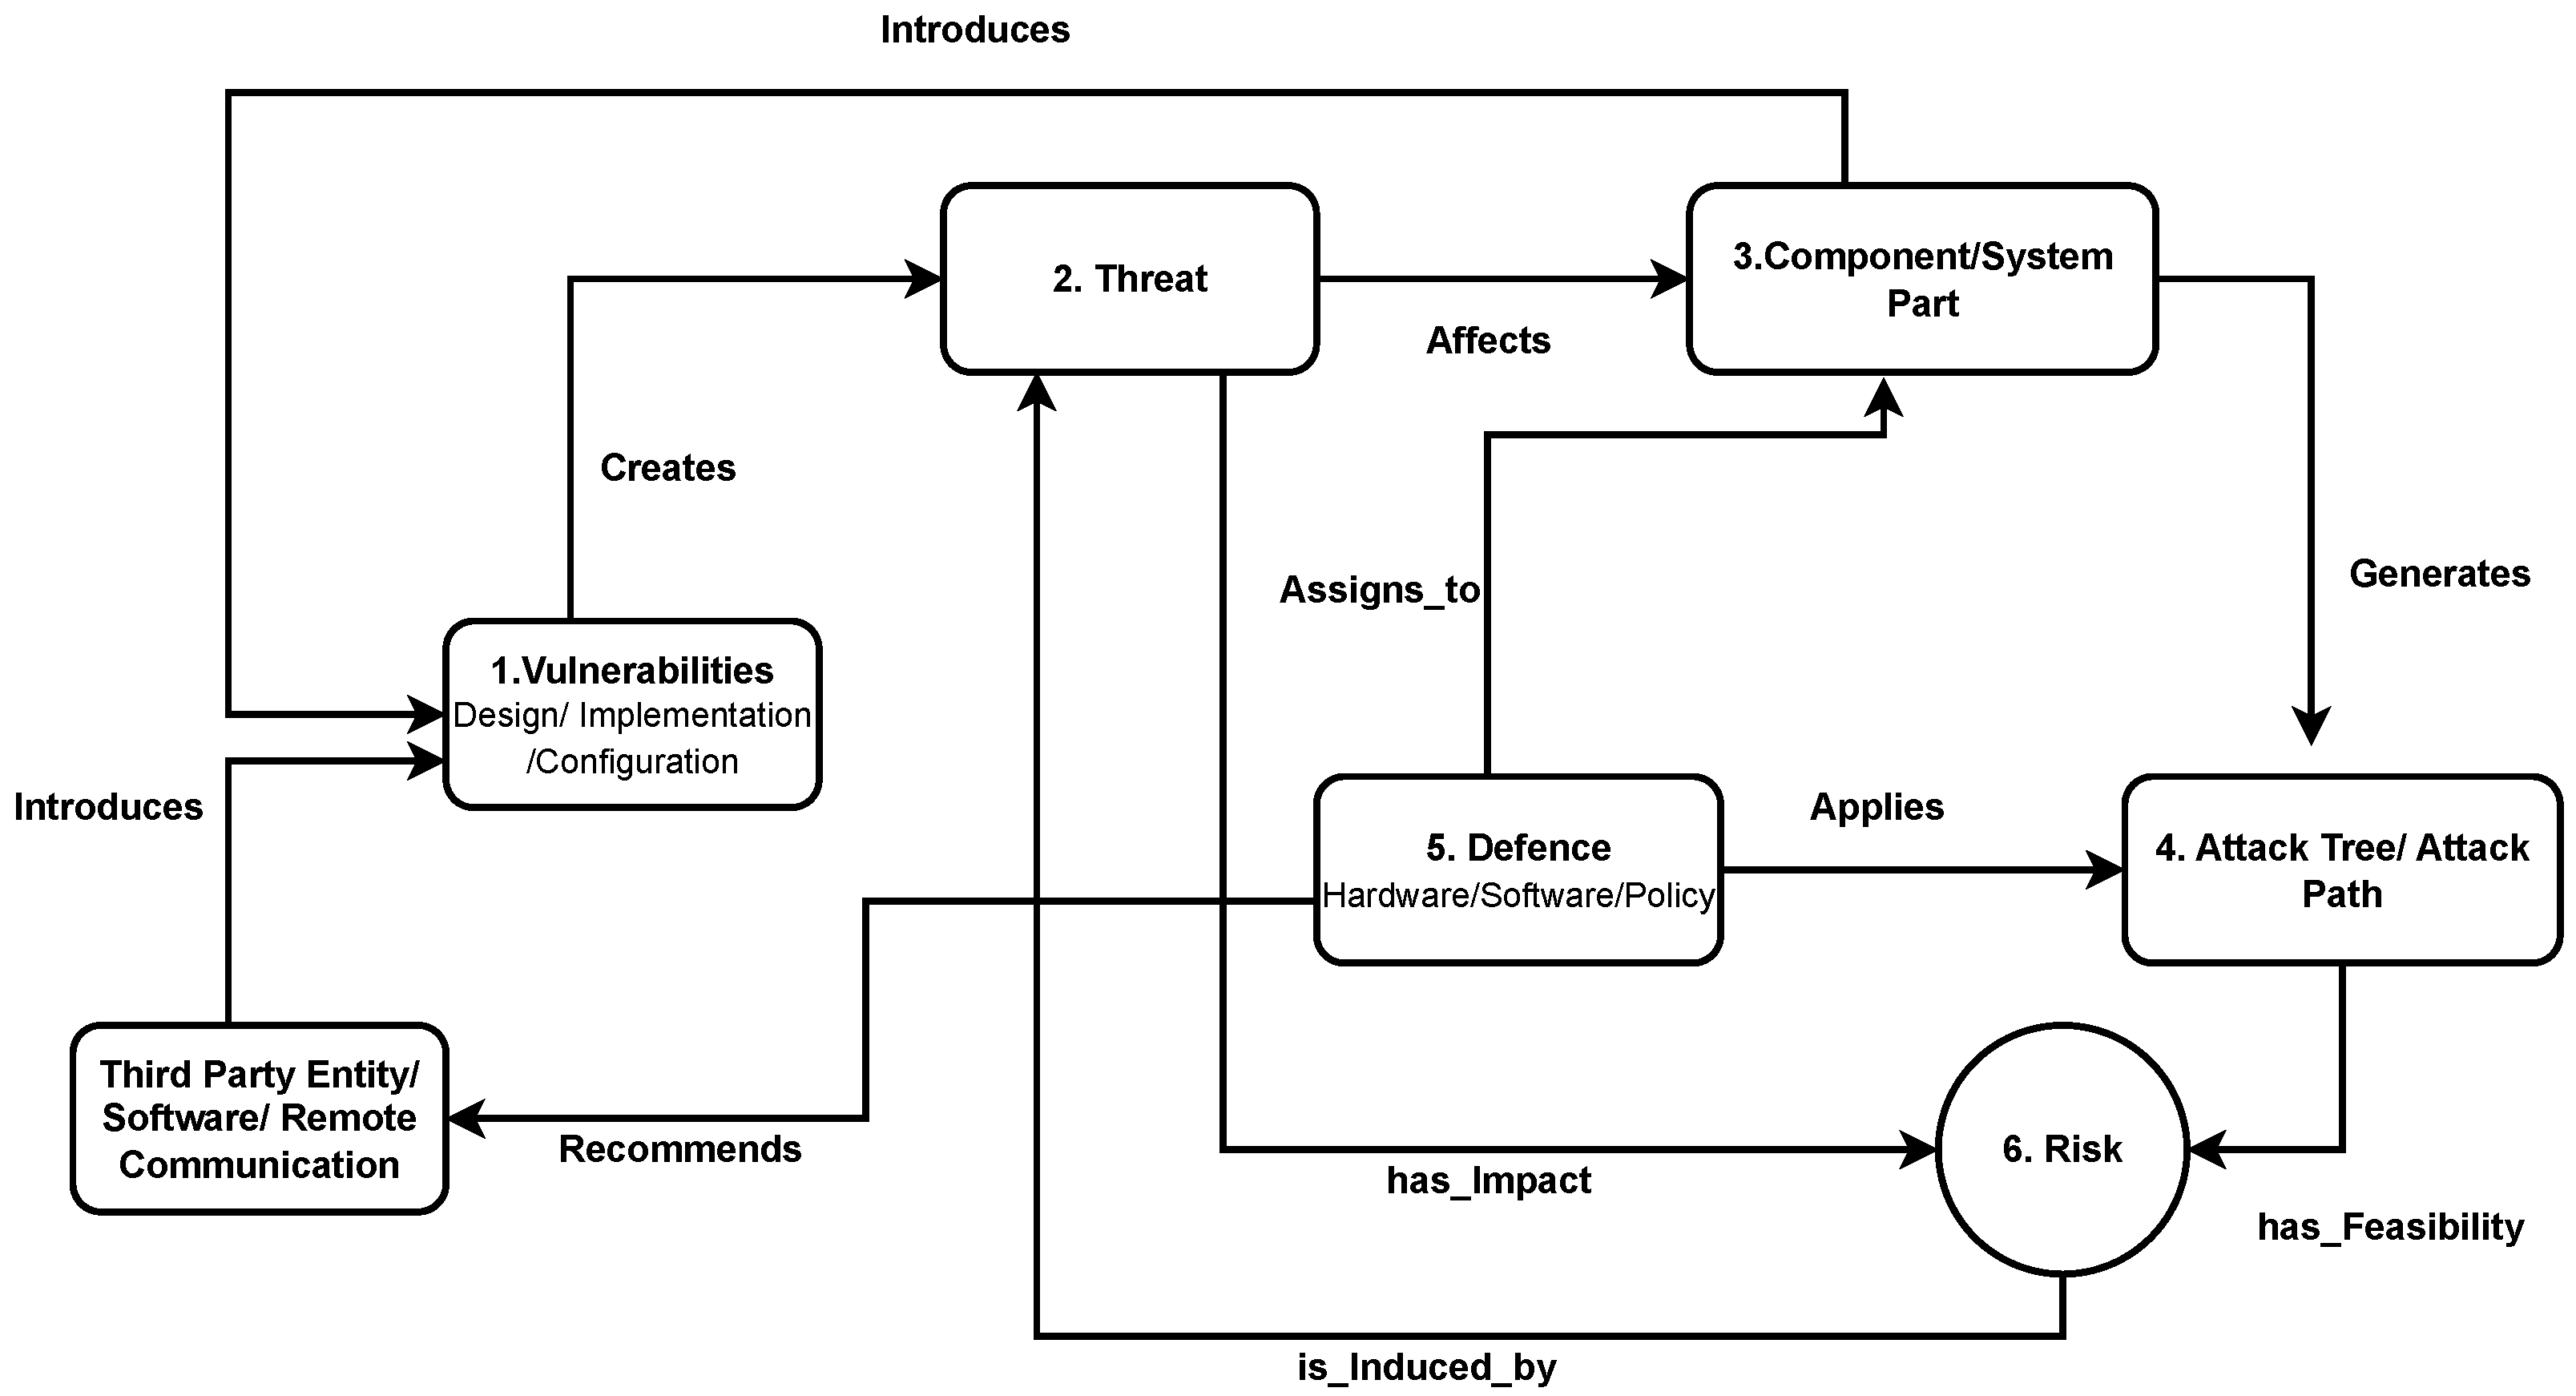
This section describes the proposed residual risk assessment framework for automotive systems based on ISO/SAE 21434. The framework is based on the taxonomy shown in Figure 3, and the explanation of each entity is as follows.
Vulnerabilities: The automotive system is the composition of multiple integrated components produced by different members of the OEM supply chain. It is difficult to maintain the same level of assurance in such a widespread industry; that is why there is always a possibility of weaknesses in a system design, implementation, or configuration. A weakness will become a vulnerability when someone can manipulate it. Vulnerabilities create threats when someone exploits them, as shown by the direct link in Figure 3.
Threats: It is essential to understand that a threat affects a specific component. For example, a remote GPS spoofing attack requires broadcasting a signal synchronised to the GPS. Later the spoofed signal’s power is increased, and the target position is moved away from the original location. This threat is possible due to the vulnerability that GPS devices are programmed to follow high-power signals. Every threat has an impact that is used to calculate the risk.
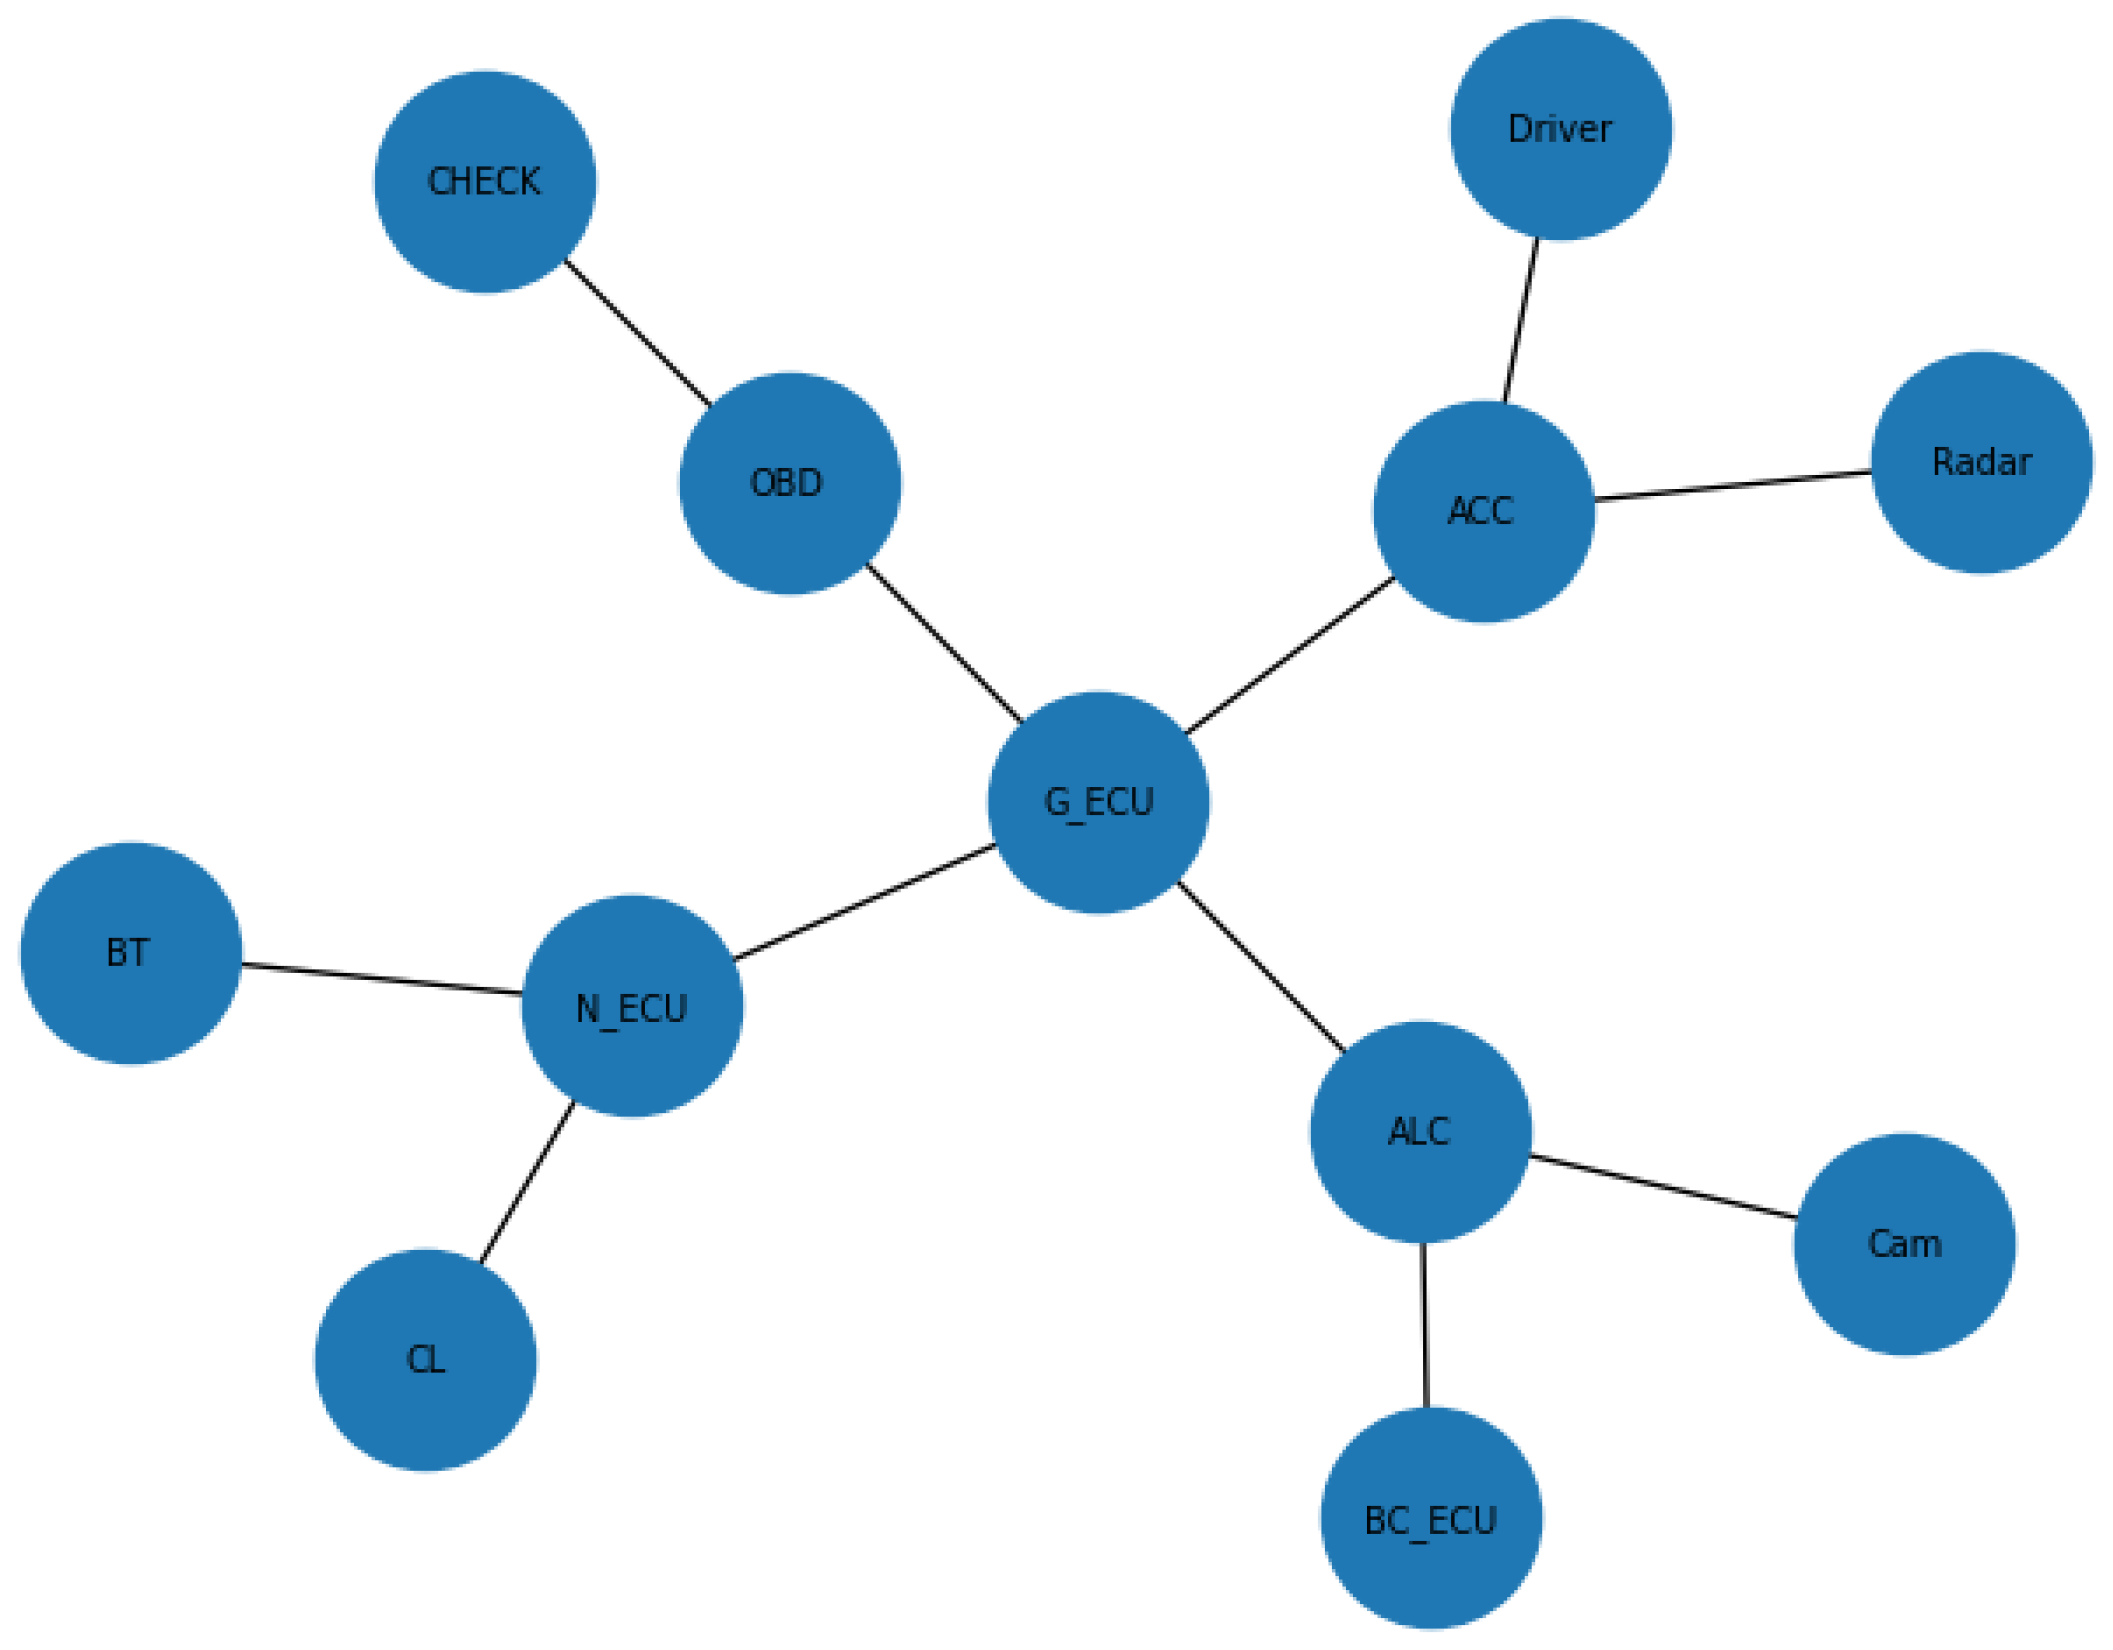
Components: To secure the component from threat, one must understand the possible ways to compromise a system and attack trees helps to visualise those potential ways. It is also possible to create an attack tree when the architecture of a component is available. Considering the adaptive cruise control and adaptive light control example from Figure 11, it is possible to generate potential attack paths shown in Figure 4. These attack paths can be produced by mapping the components’ connectivity using a system diagram. The starting point of each attack path is an attack surface; therefore, a cellular interface, Bluetooth, and OBD port can be considered as entering points of an attacker. Adding a new component to a system can also introduce new vulnerabilities, as shown in Figure 3.
Figure 3.
Residual risk management framework.

Attack Tree: Every attack path in a tree has the feasibility of exploitation, and this is a value ranging from very low to high that describes the ease of carrying out the set of corresponding attack actions [5]. Feasibility would be high or low, considering the complexity of an attack path. An attack path may be relatively short, but its complexity might be high. Therefore, attack trees are generated to calculate the feasibility as shown in Figure 3 of the attack path as a factor to calculate risk as suggested in ISO/SAE 21434.
Defense: Apply defences to avoid those threats becoming an attack, such as integrating new hardware or fixing some software bugs. It is also possible that the cause is some third-party entity or software. In that case, some policies for interaction are recommended. In Figure 3, it can be observed that defences are assigned to components, and it applies to attack trees because it will help to visualise defence placement in the actual system architecture. As discussed earlier, due to the widespread nature of the automotive industry, there is always a possibility of introducing new weaknesses that will become vulnerabilities in a system. There is also a possibility that applied defences might introduce new vulnerabilities in a system, as shown by the link from the component to the vulnerabilities in Figure 3.
Third-Party Entities: In an automotive system, users also use external devices such as mobile phones. There is a possibility that such third-party software/devices can introduce new vulnerabilities in a system, as shown in Figure 3.
One can calculate the associated risk to a component by considering the attack feasibility and the impact related to that threat. The risk value will change after applying defences, and it depends upon the effectiveness of defences. There is also a possibility that the risk might increase beyond the acceptable level; therefore, if the risk level is high, it will be considered a threat, as shown by a link from risk to threat in Figure 3. The residual risk will be calculated by finding differences before and after applying defences on the possible threats using flow graphs as suggested in [10].
Figure 4.
Potential attack paths.

4.2. Steps for Implementing Proposed Framework
The proposed framework, see Figure 3, shows the relationship among the entities. To implement the proposed methodology, we carry out the following steps:
- Step 1: The input of our framework will be a system diagram of a system under consideration. Convert the system diagram to a directed graph to identify the information flow.
- Step 3: Identify the impact of each threat considering ISO/SAE 21434 <RQ-15-05>.
- Step 4: Generate a library using a K-partite graph of known attack trees.
- Step 5: Generate a detailed integrated attack tree using the directed graph of the system diagram and library of attack trees.
- Step 6: Calculate the feasibility value of each attack path using one of the suggested approaches, i.e., attack potential, CVSS, and attack-vector-based approaches in ISO/SAE 21434 <RC-15-11>.
- Step 7: Calculate the initial risk associated with each threat as a function of impact and feasibility as suggested in ISO/SAE 21434 <RQ-15-15>.
- Step 8: Identify and implement appropriate defences for all attack paths.
- Step 9: Calculate mitigated risk as placement of appropriate defences will reduce the risk, using flow graphs.
- Step 10: Calculate residual risk as the difference between initial risk and mitigated risk. If the residual risk is above an acceptable level, move back to Step 2.
5. Step-by-Step Guide for Implementing Methodology
This section discusses a detailed step-by-step guide for implementing the proposed framework Figure 3, as discussed in Section 4.1.
5.1. Steps 1–3: Initialisation
Initialisation involves three primary steps. Firstly, the proposed framework takes a system diagram with an information flow as an input, which will then be converted into a directed graph. Secondly, a threat model is developed in the ThreatGet tool using a given system diagram. This threat modelling tool was developed at the Austrian Institute of Technology (AIT). It takes the threat model as input and generates a list of threats against the threat model. ThreatGet [59] uses an Extended Data Flow Diagram (EDFD), whereas Microsoft Threat Modelling Tool [58] uses a data flow diagram (DFD). This tool uses STRIDE by Microsoft to model threats. ThreatGet [59] uses elements, connectors, and assets for a threat model. Elements describe physical or logical devices, and connectors show the information flow. Assets indicate where valuable assets are located. Lastly, we obtain the impact of each threat using ThreatGet according to ISO/SAE 21434 <RQ-15-05>.
5.2. Step 4: Library Generation Using K-Partite Graphs
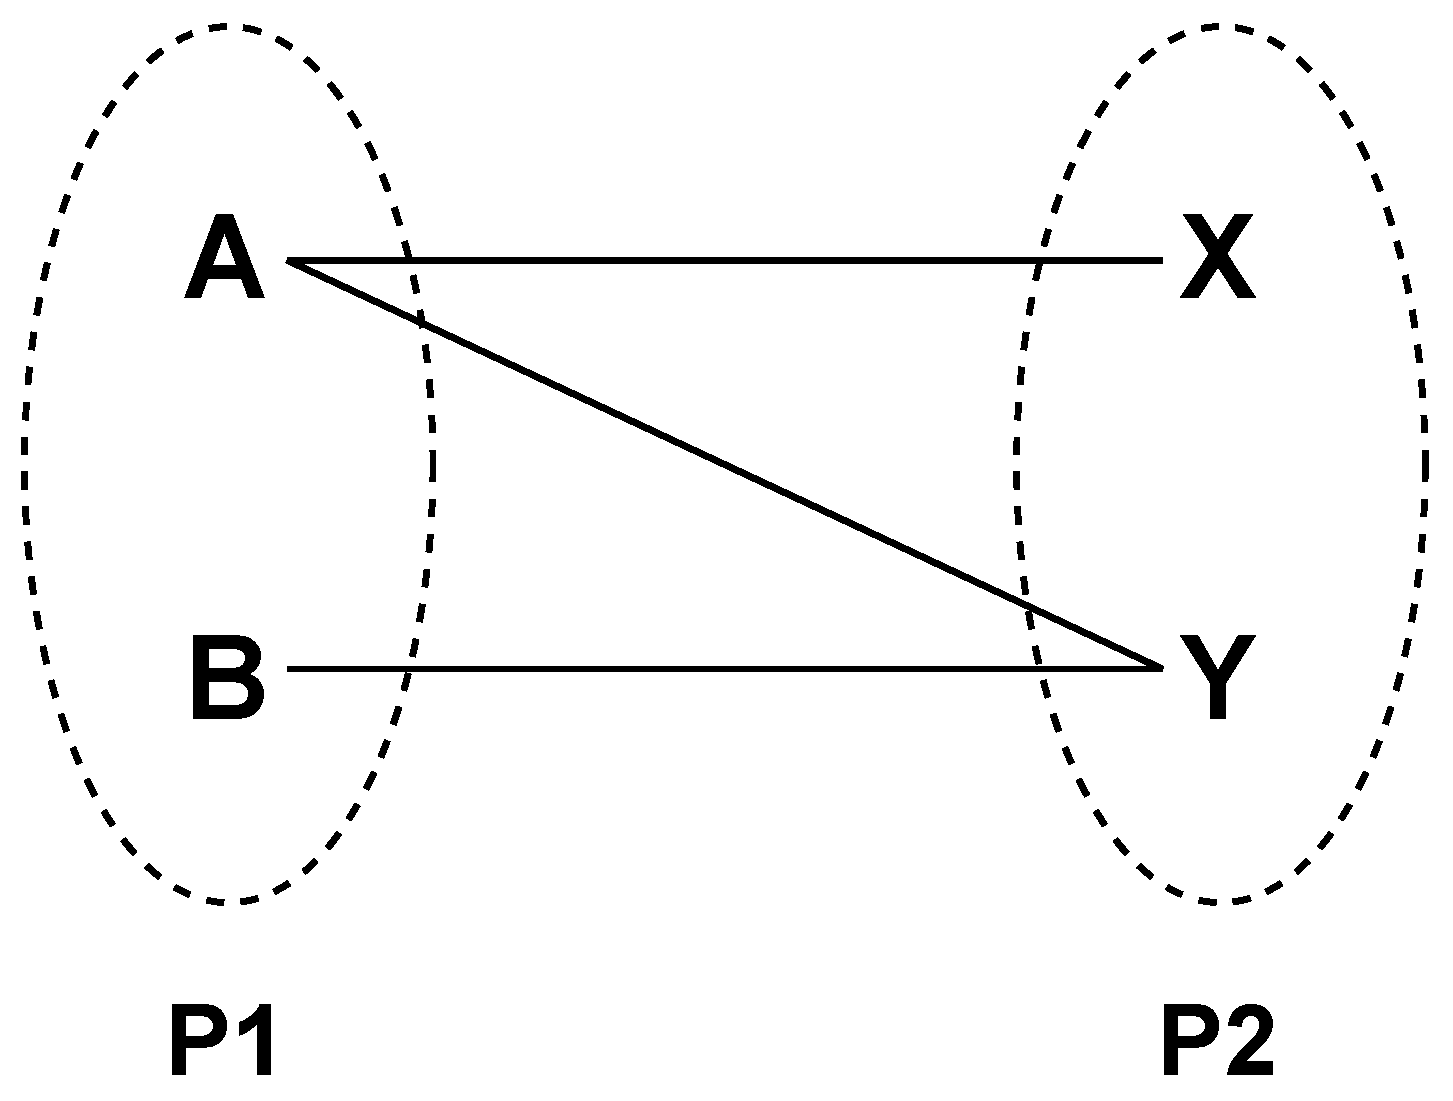
To discuss the details of the K-partite graph, it is essential to have a brief overview of the much simpler bi-partite graph. A bi-partite graph [60] is a famous graph type used in graph theory; see Figure 5. Two disjoint sets or partites of independent entities will be connected with edges according to their relationship. Each element of the set should be non-adjacent to the others. Bi-partite is a particular form of a K-partite graph in which . A K-partite or multi-partite graph includes more than two partites.
Figure 5.
Bi-partite graph example.

Consider the example of a bi-partite graph in Figure 5; there are two partites, P1 and P2. In P1, there are two nodes, A and B, and in P2, there are X and Y. One can observe that (A, B) and (X, Y) do not have any edge between them. However, there are edges , , and , so (A, B), (X, Y) are independent/non-adjacent of each other. A K-partite or multi-partite graph includes more than two partites, as shown in Figure 8. It follows the fundamental property of a disjoint set with non-adjacent elements. We are using this K-partite graph structure to generate a library of attack trees because it is vital to preserve all relations and order of steps in an attack tree to create a library. The property of a non-adjacent and independent set allows the transformation of an attack tree into a K-partite graph. Algorithm 1 is proposed to create a K-partite graph-based library represented in Figure 8 or Step 4, mentioned in Section 4.2. Additionally, Algorithm 2 is proposed to search this library as it is a prerequisite to generate a detailed integrated attack tree mentioned in Step 5.
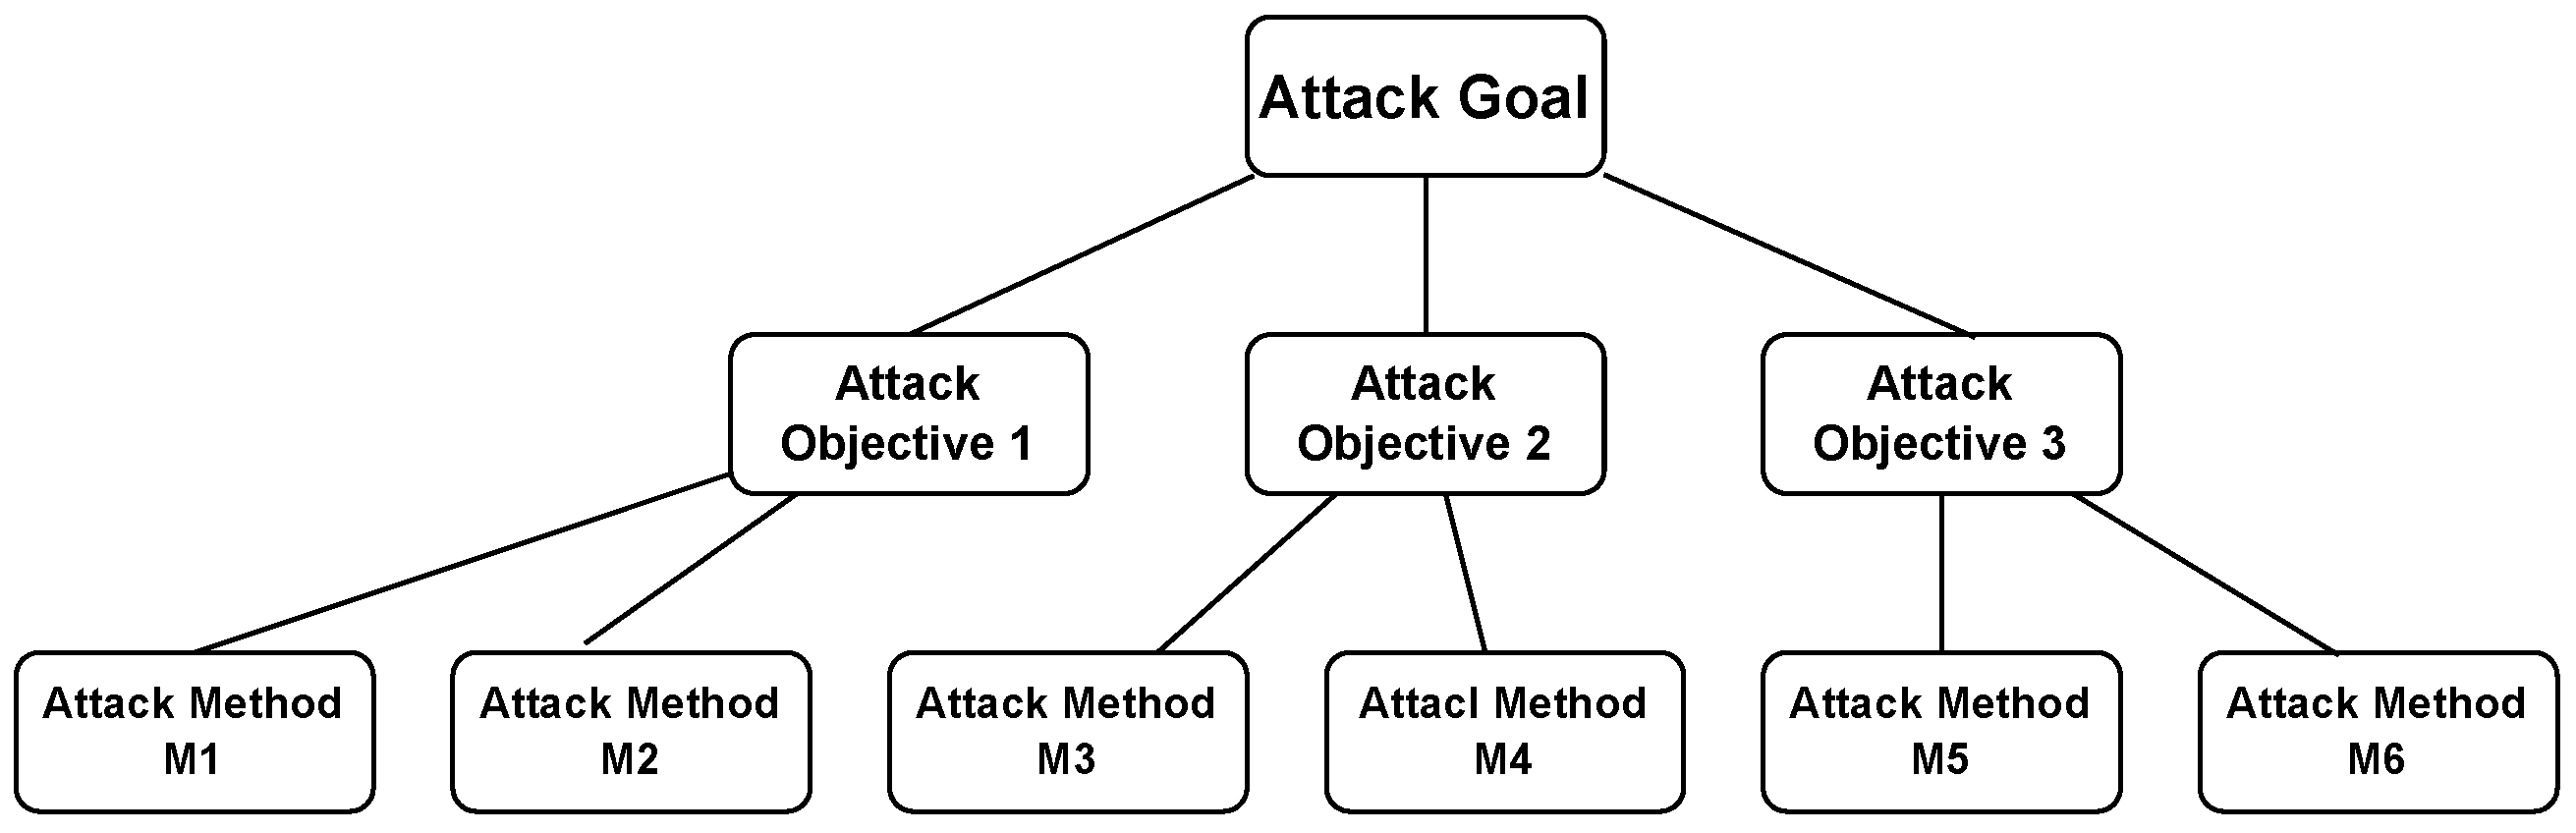
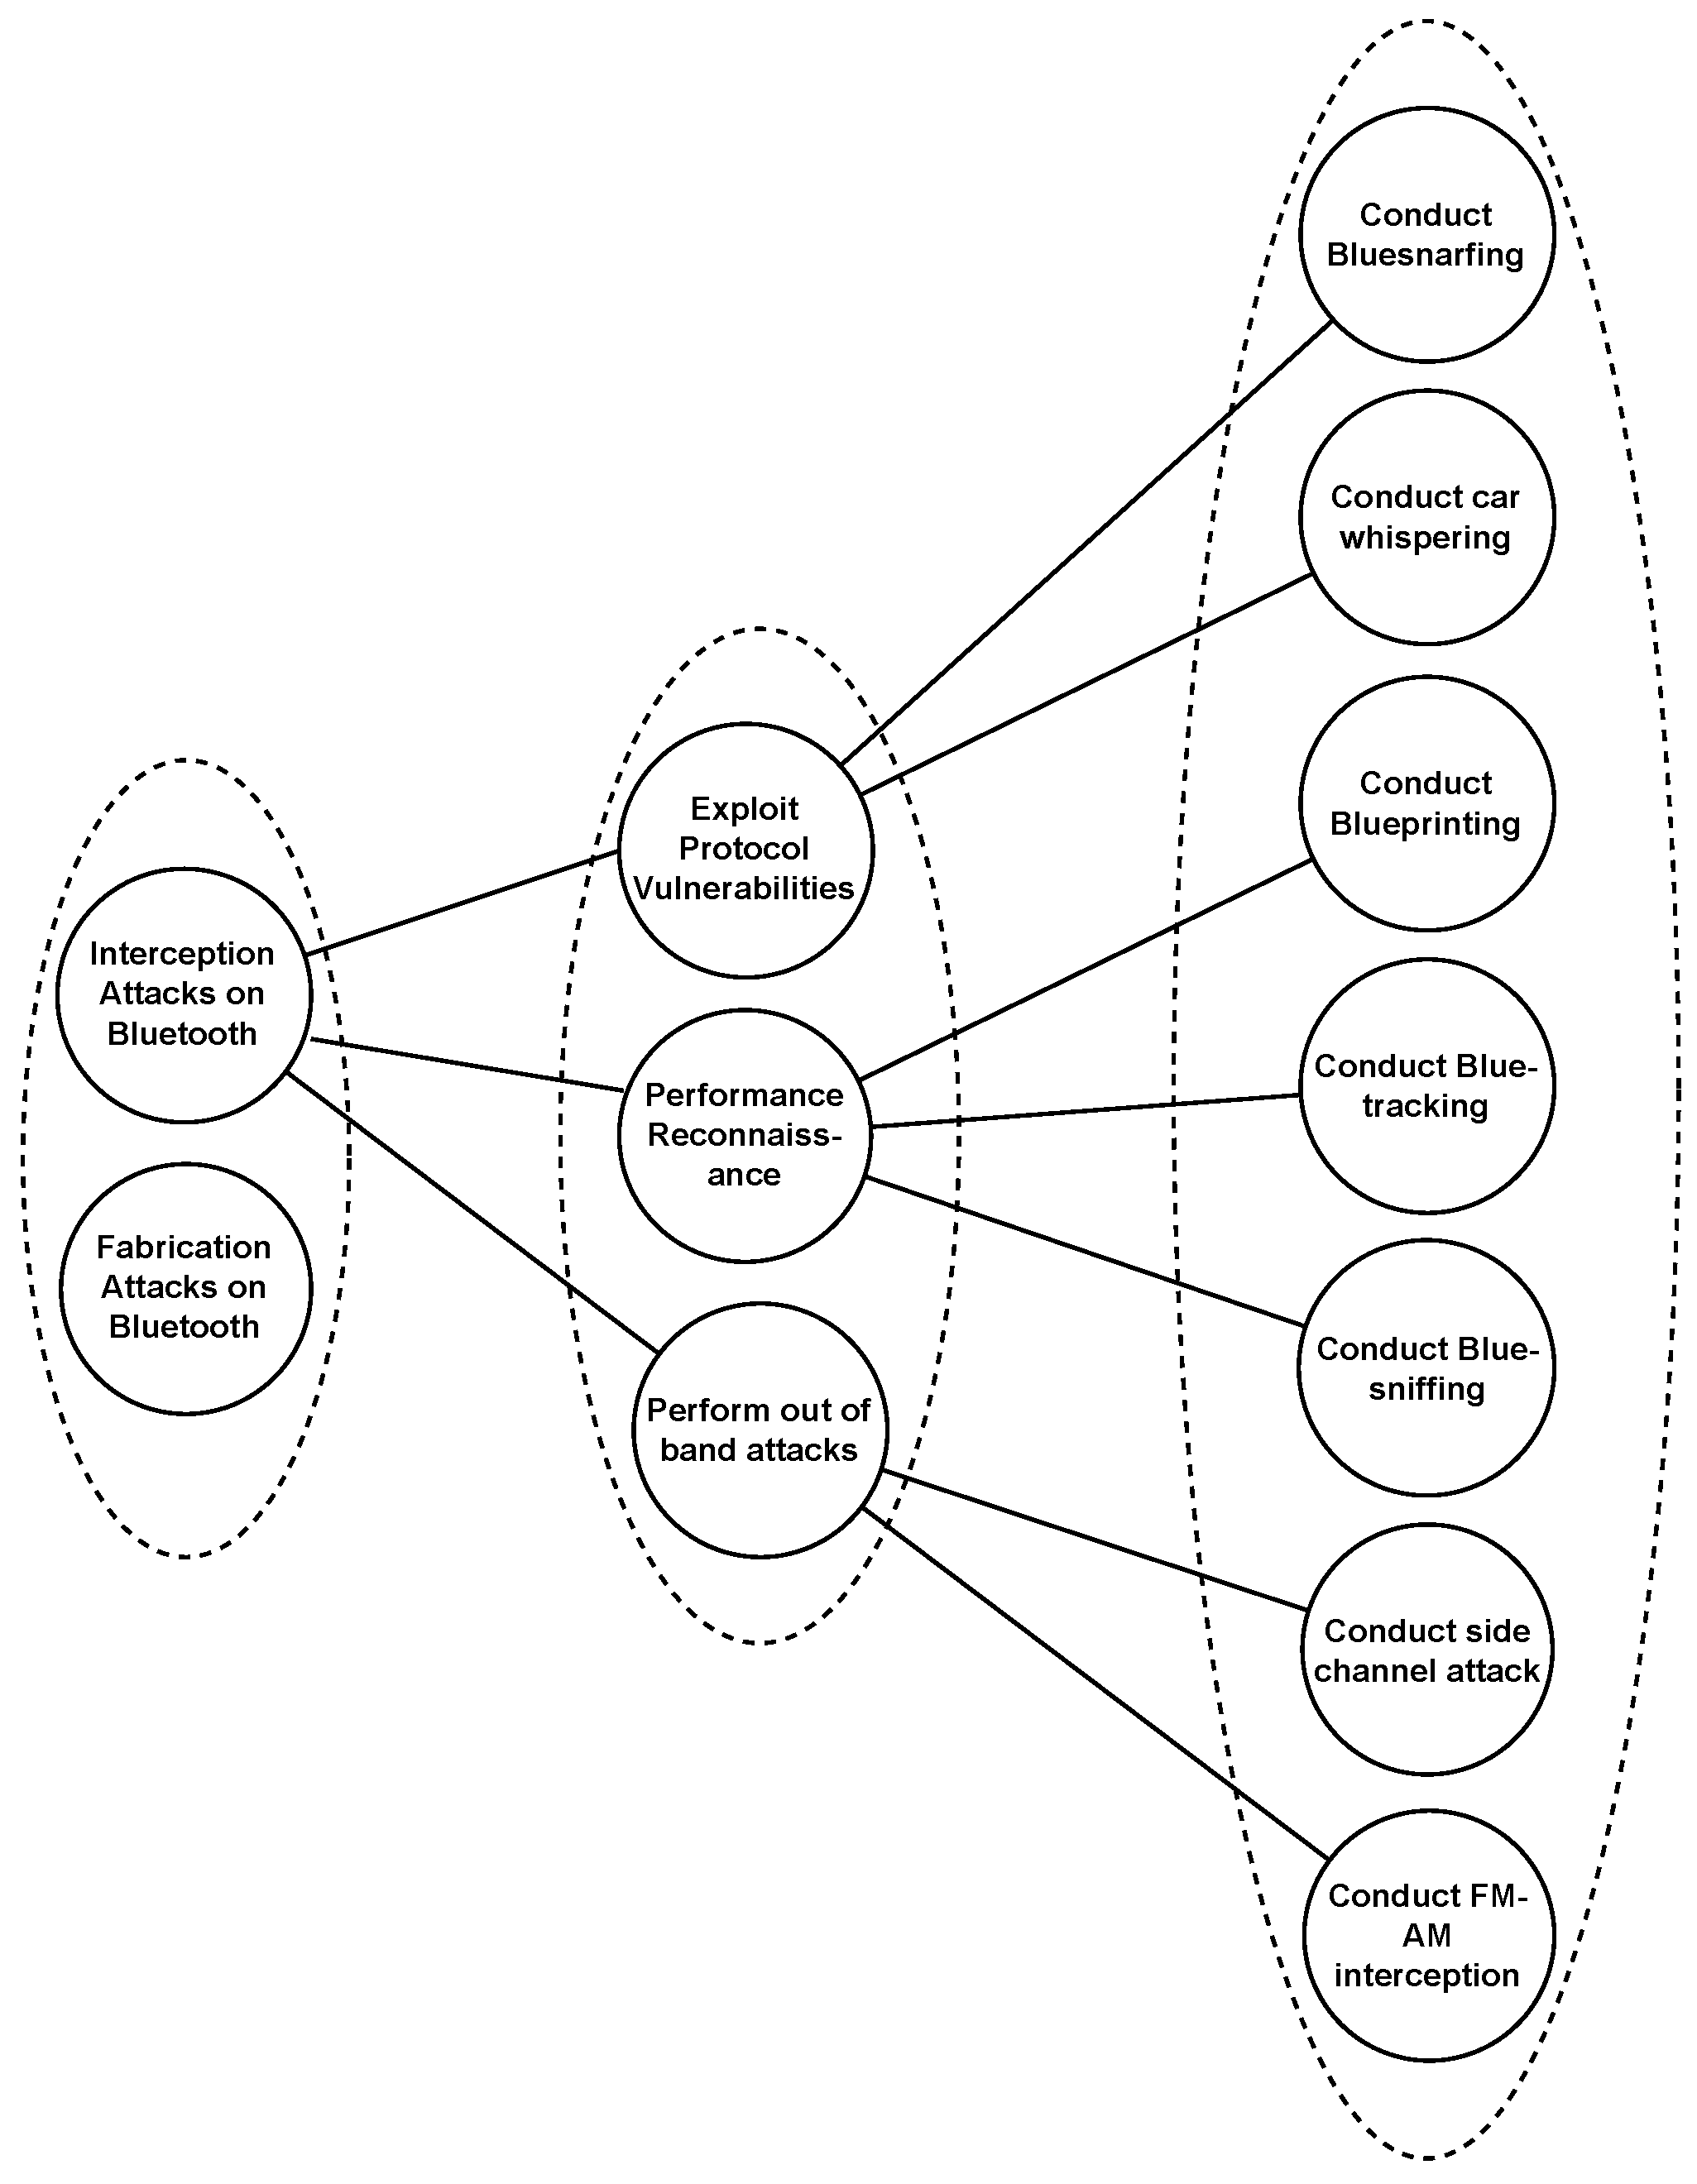
Attack trees can be represented as a K-partite graph. There is a need for insight into the attack tree’s structure/hierarchy as proposed in [20], where the root corresponds to an attacker’s goal and is considered as Level 0. Level 1 contains the attack objective as shown in Figure 6. The attack objective can be decomposed into several attack methods based on the logical combination (OR/AND) against one or more assets. A K-partite graph structure is proposed with the same approach as shown in Figure 6, placing each level of the attack tree in a partite as entities are not adjacent at each level. An attack tree for interception attacks on Bluetooth, as shown in Figure 7, is taken from [61]. It can be converted into a K-partite graph as shown in Figure 8.
Figure 6.
Attack tree structure [20].
Figure 6.
Attack tree structure [20].

Algorithm 1: Algorithm 1 will generate a K-partite graph. The complexity of this algorithm is O(|E| + |V|). First, select the attacker’s goal and create a partition for it. Then, use breadth-first search and search each level of the attack tree. Whenever we go to a new level, create a new partite. The only complexity comes when conjunctive or disjunctive nodes (OR/AND) appear. In this case, if the OR conjunction comes generate a direct link, but if the AND conjunction comes, then create a combined link to the target entity.
| Algorithm 1 K-partite Graph Generation |
|
Figure 7.
Attack tree for interception attack on Bluetooth [61].
Figure 7.
Attack tree for interception attack on Bluetooth [61].

Algorithm 2:
In Algorithm 2, search the K-partite graph to generate an attack tree when required, and its complexity is O(|V.E| + ). The K-partite graph search procedure is created with the attack goal as an input; in Line 2, select the attack goal partite. In Line 3, a while loop is used to look for the node that represents the same attack goal provided as an input. In Line 4, the code checks if the node is found, and if so, BFS is performed and other links are followed from Lines 5 to 7. From Lines 8 to 9, matching is performed to determine if the attack goal is unavailable in the partite. It will be concluded that this attack goal is not available.
| Algorithm 2 K-partite Graph Search |
|
Figure 8.
K-partite graph representation of Bluetooth attack.

An attack tree can be represented as a K-partite graph and this hypothesis is proved by dividing it into two parts. Firstly, it is proved that an attack tree satisfies all the properties of a tree in Theorem 1. In Theorem 2, it is demonstrated that if a graph is a tree, it can be represented in a K-partite graph. A few fundamental definitions are as follows:
Definition 1.
An Attack Tree “” is a connected A-cyclic graph with a global Attack Goal “”. Child nodes of are attack actions as a refinement. Leaf represents attacks that can no longer be refined. A refinement can be conjunctive “AND” or disjunctive “OR”.
Lemma 1.
An “AND” node indicates that all of its child nodes must be satisfied to achieve the parent node. Such as Node A is achieved if and only if all of its child nodes are achieved.
Lemma 2.
An “OR” node indicates that at least one of its child nodes must be satisfied for the parent node to be achieved. We can achieve Node X if at least one of its child nodes is achieved.
Definition 2.
A tree “T” is an un-directed minimally connected A-cyclic graph in which removing one edge will disconnect the graph.
Definition 3.
A K-partite graph is a graph with k different sets of vertices such that each set is an independent set.
Definition 4.
An Independent set is a set with no two vertices adjacent to each other.
Theorem 1.
If Graph “G” is an attack tree “” then it is also a Tree “T”.
Proof.
Let us compare the properties of , T and show that an ∈ T.
- is also a minimally connected graph.
- is as A-cyclic as trees.
- is the unique root node as any other tree.
- The non-root node node has exactly one parent.
Therefore, a standard also satisfies all the tree’s properties. □
Theorem 2.
If Graph G is a Tree “T” then it is also a K-partite graph.
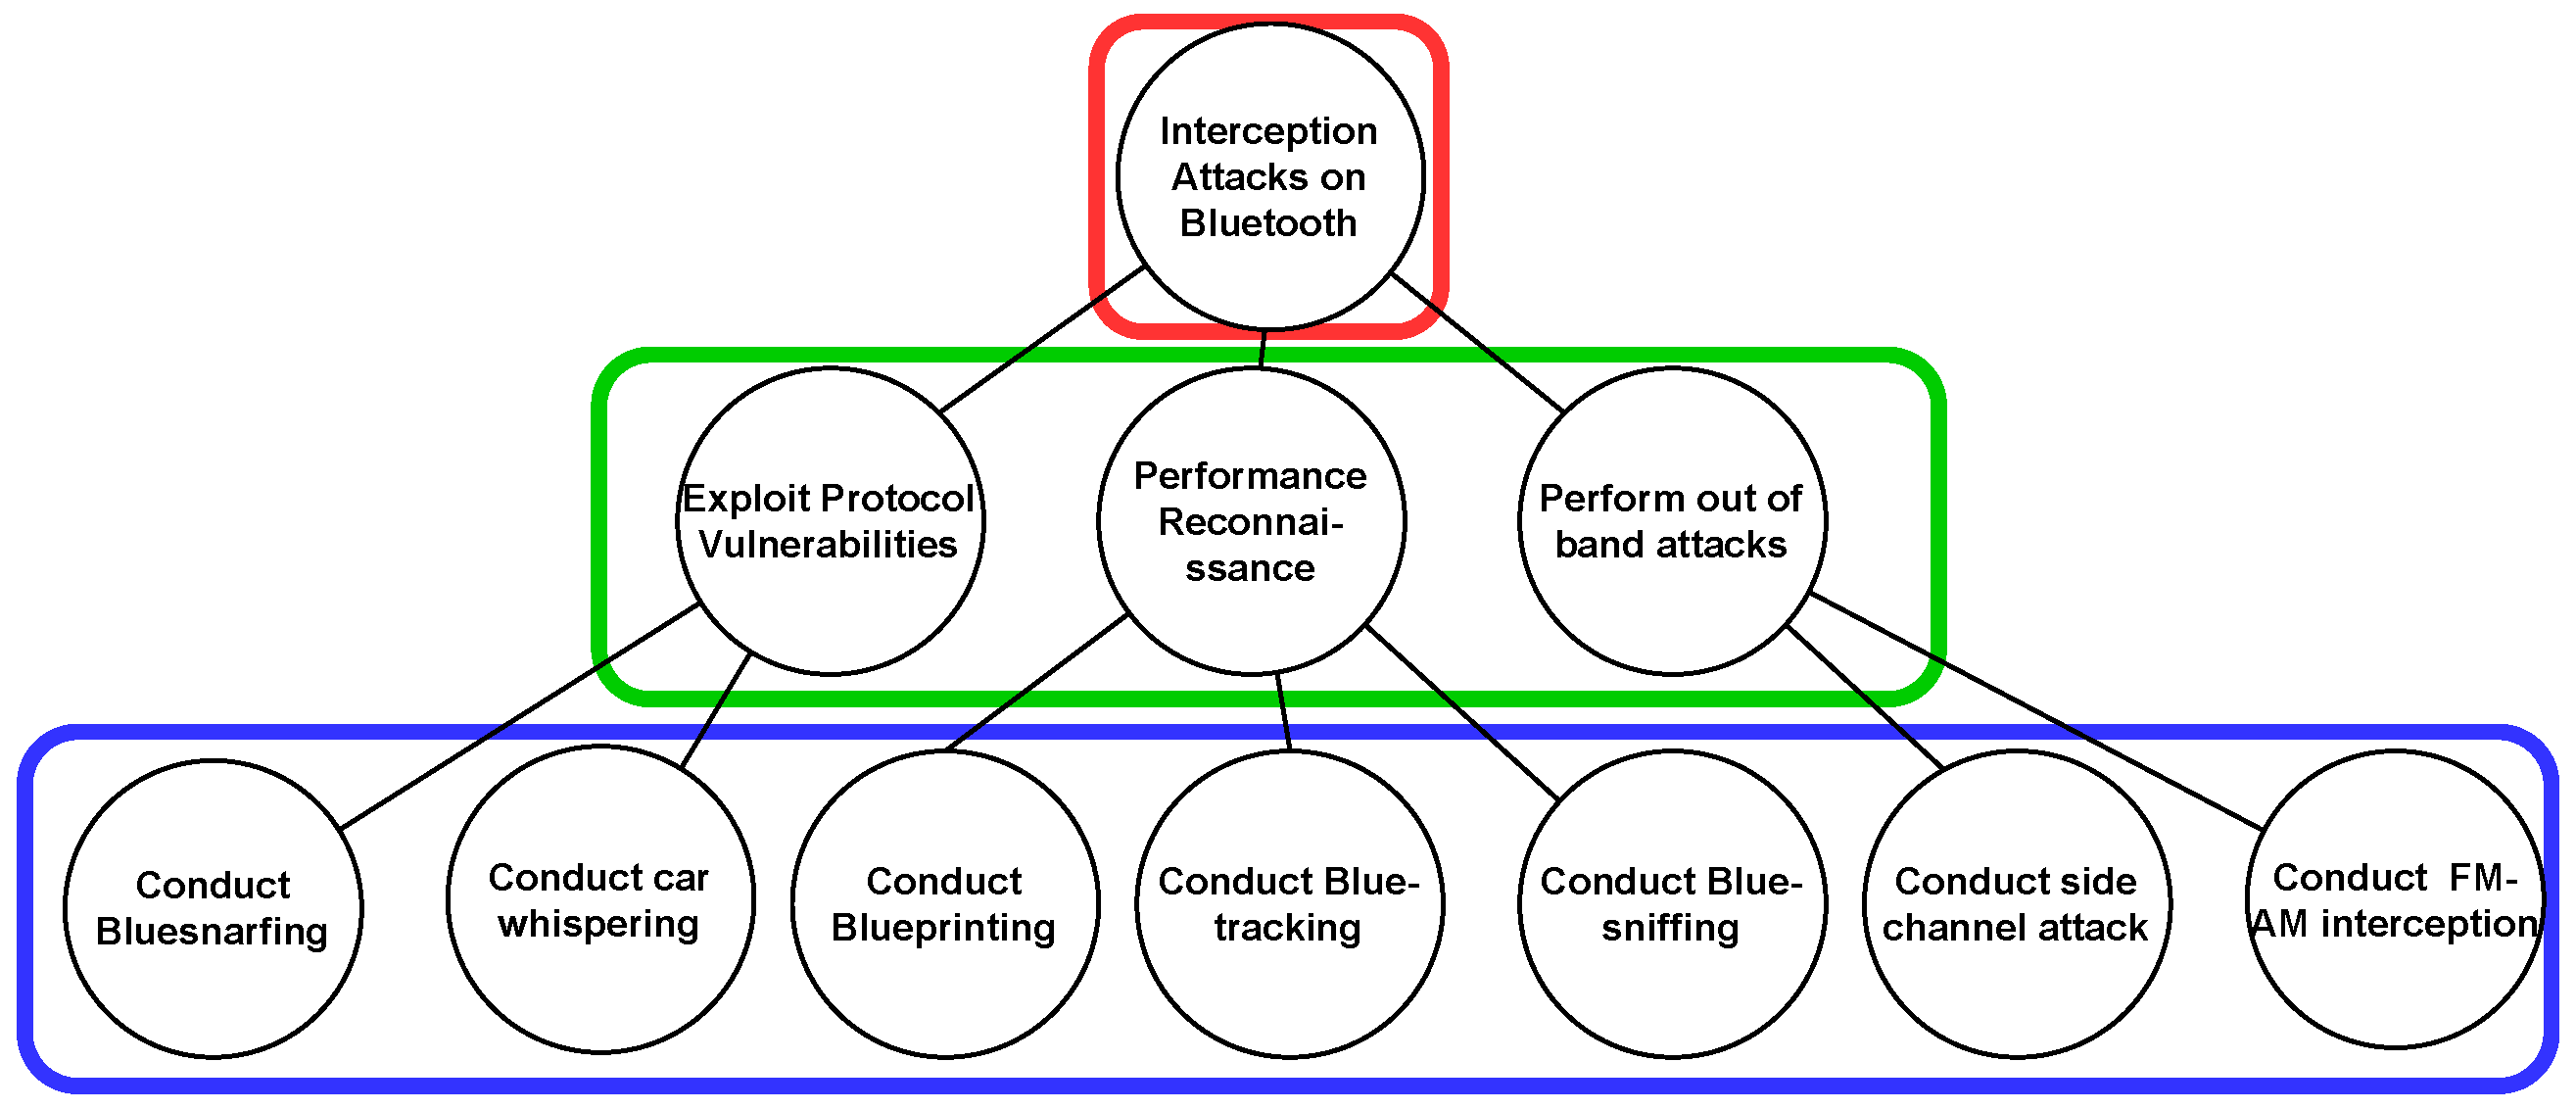
Intitution of proof: Let T be a tree with n vertices. Let us show that T is a K-partite graph by identifying each level in a different coloured box as shown in Figure 9
- Draw a red-colour box around the root node of T.
- Draw a green-colour box around all the children of the root node.
- Draw a blue-colour box around all the children of the nodes lying in a green-colour box.
- Continue this process for all the nodes in T, assigning each node the lowest available colour that has not been assigned to its parent or any of its children.
It can be observed that every colour represents a different partite (set) and there is no edge within each partite that satisfies the property of an independent set. Considering Theorems 1 and 2, we can conclude that can be presented in a K-partite graph.
Figure 9.
Colouring attack tree [61].
Figure 9.
Colouring attack tree [61].

5.3. Step 5: Generation of Integrated Attack Tree
Considering our framework in Figure 3, an attack tree will be generated against a component/system part by using a system diagram. Our motivation is to generate integrated attack trees that can help to have a better overview of a system. One of the benefits of an integrated attack tree is that it will help to understand the propagation of risk. Understanding the risk propagation is vital because when an attacker successfully moves from one step to another in an attack tree, the attacker may have access to more assets. To understand risk propagation, consider the example of an attack graph in Figure 10. Assume an attacker can reach Step 3 by following Step 1 or 2; from Step 3, the attacker now has access to Assets 1 and 2. It can be observed that the risk of an attack on Assets 1 and 2 increases when an attacker gets access to Step 3.
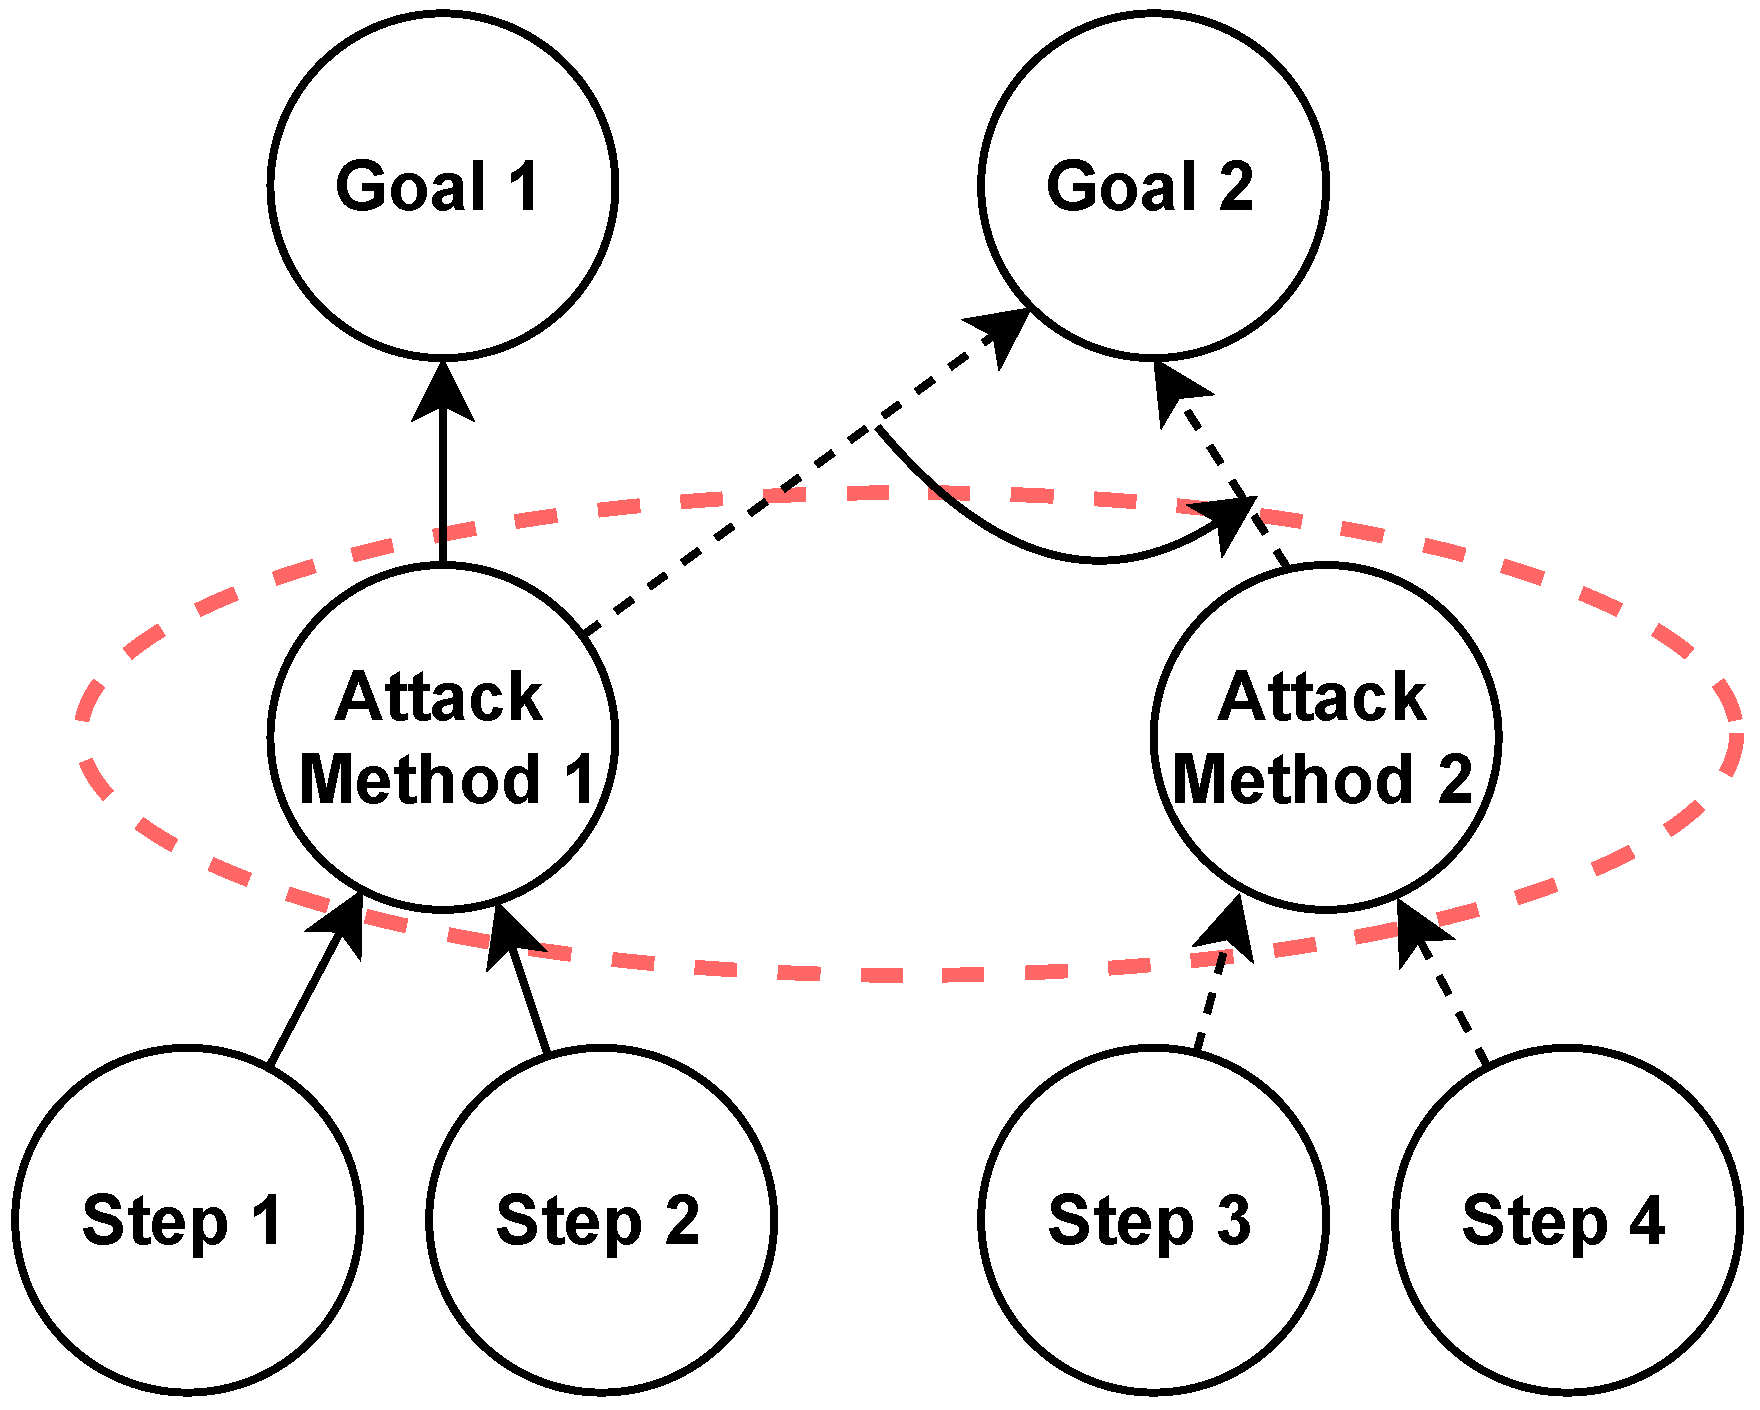
Consider Figure 13, in which two different attack trees have two distinct goals. It can be observed that in both attack trees, Attack Method 1 is repeated. In practice, attack trees are designed individually. If two attack trees are analysed together, one can identify that by following two different steps, an attacker can reach the same attack method M1, leading us to two distinct goals (Goal 1, Goal 2). The red dotted oval shows an attacker can utilise two attack methods to reach Goal 2. The above two examples can help visualise how a risk propagates from one attack tree to another.
We developed the integrated attack tree from the system diagram. A system diagram with information flow is the essential component required to design an attack tree, as shown in Figure 11. There are a few other rules that should be followed, which are listed below.
- The system diagram should indicate the information flow in it.
- If two entities are sequential, like Navigation ECU and Gateway ECU as shown in Figure 11, use AND conjunction between them.
- If two entities are connected to one component, use OR conjunction between them, such as ACC and ALC are connected to Gateway ECU as shown in Figure 11.
Figure 10.
Toy example of risk propagation.

We are considering two systems as our use case: ACC and ALC. These systems are connected to the Gateway ECU, as shown in Figure 11. The inputs of the ACC system come from the radar and the driver. The driver can set speed and distance, whereas the radar detects incoming cars. Let us assume that an attacker has to compromise the property of integrity. For this, spoofing can be performed on all types of information. The same goes for ALC, which is connected to Gateway ECU. ALC has two inputs, one from the camera ECU and the other from the body control ECU. These inputs can turn ON or OFF or receive high or low beams from the power switch actuator. The attackers can spoof these messages if they can access the vehicle’s CAN.
Figure 11.
Adaptive light control and adaptive cruise control system diagram overview.

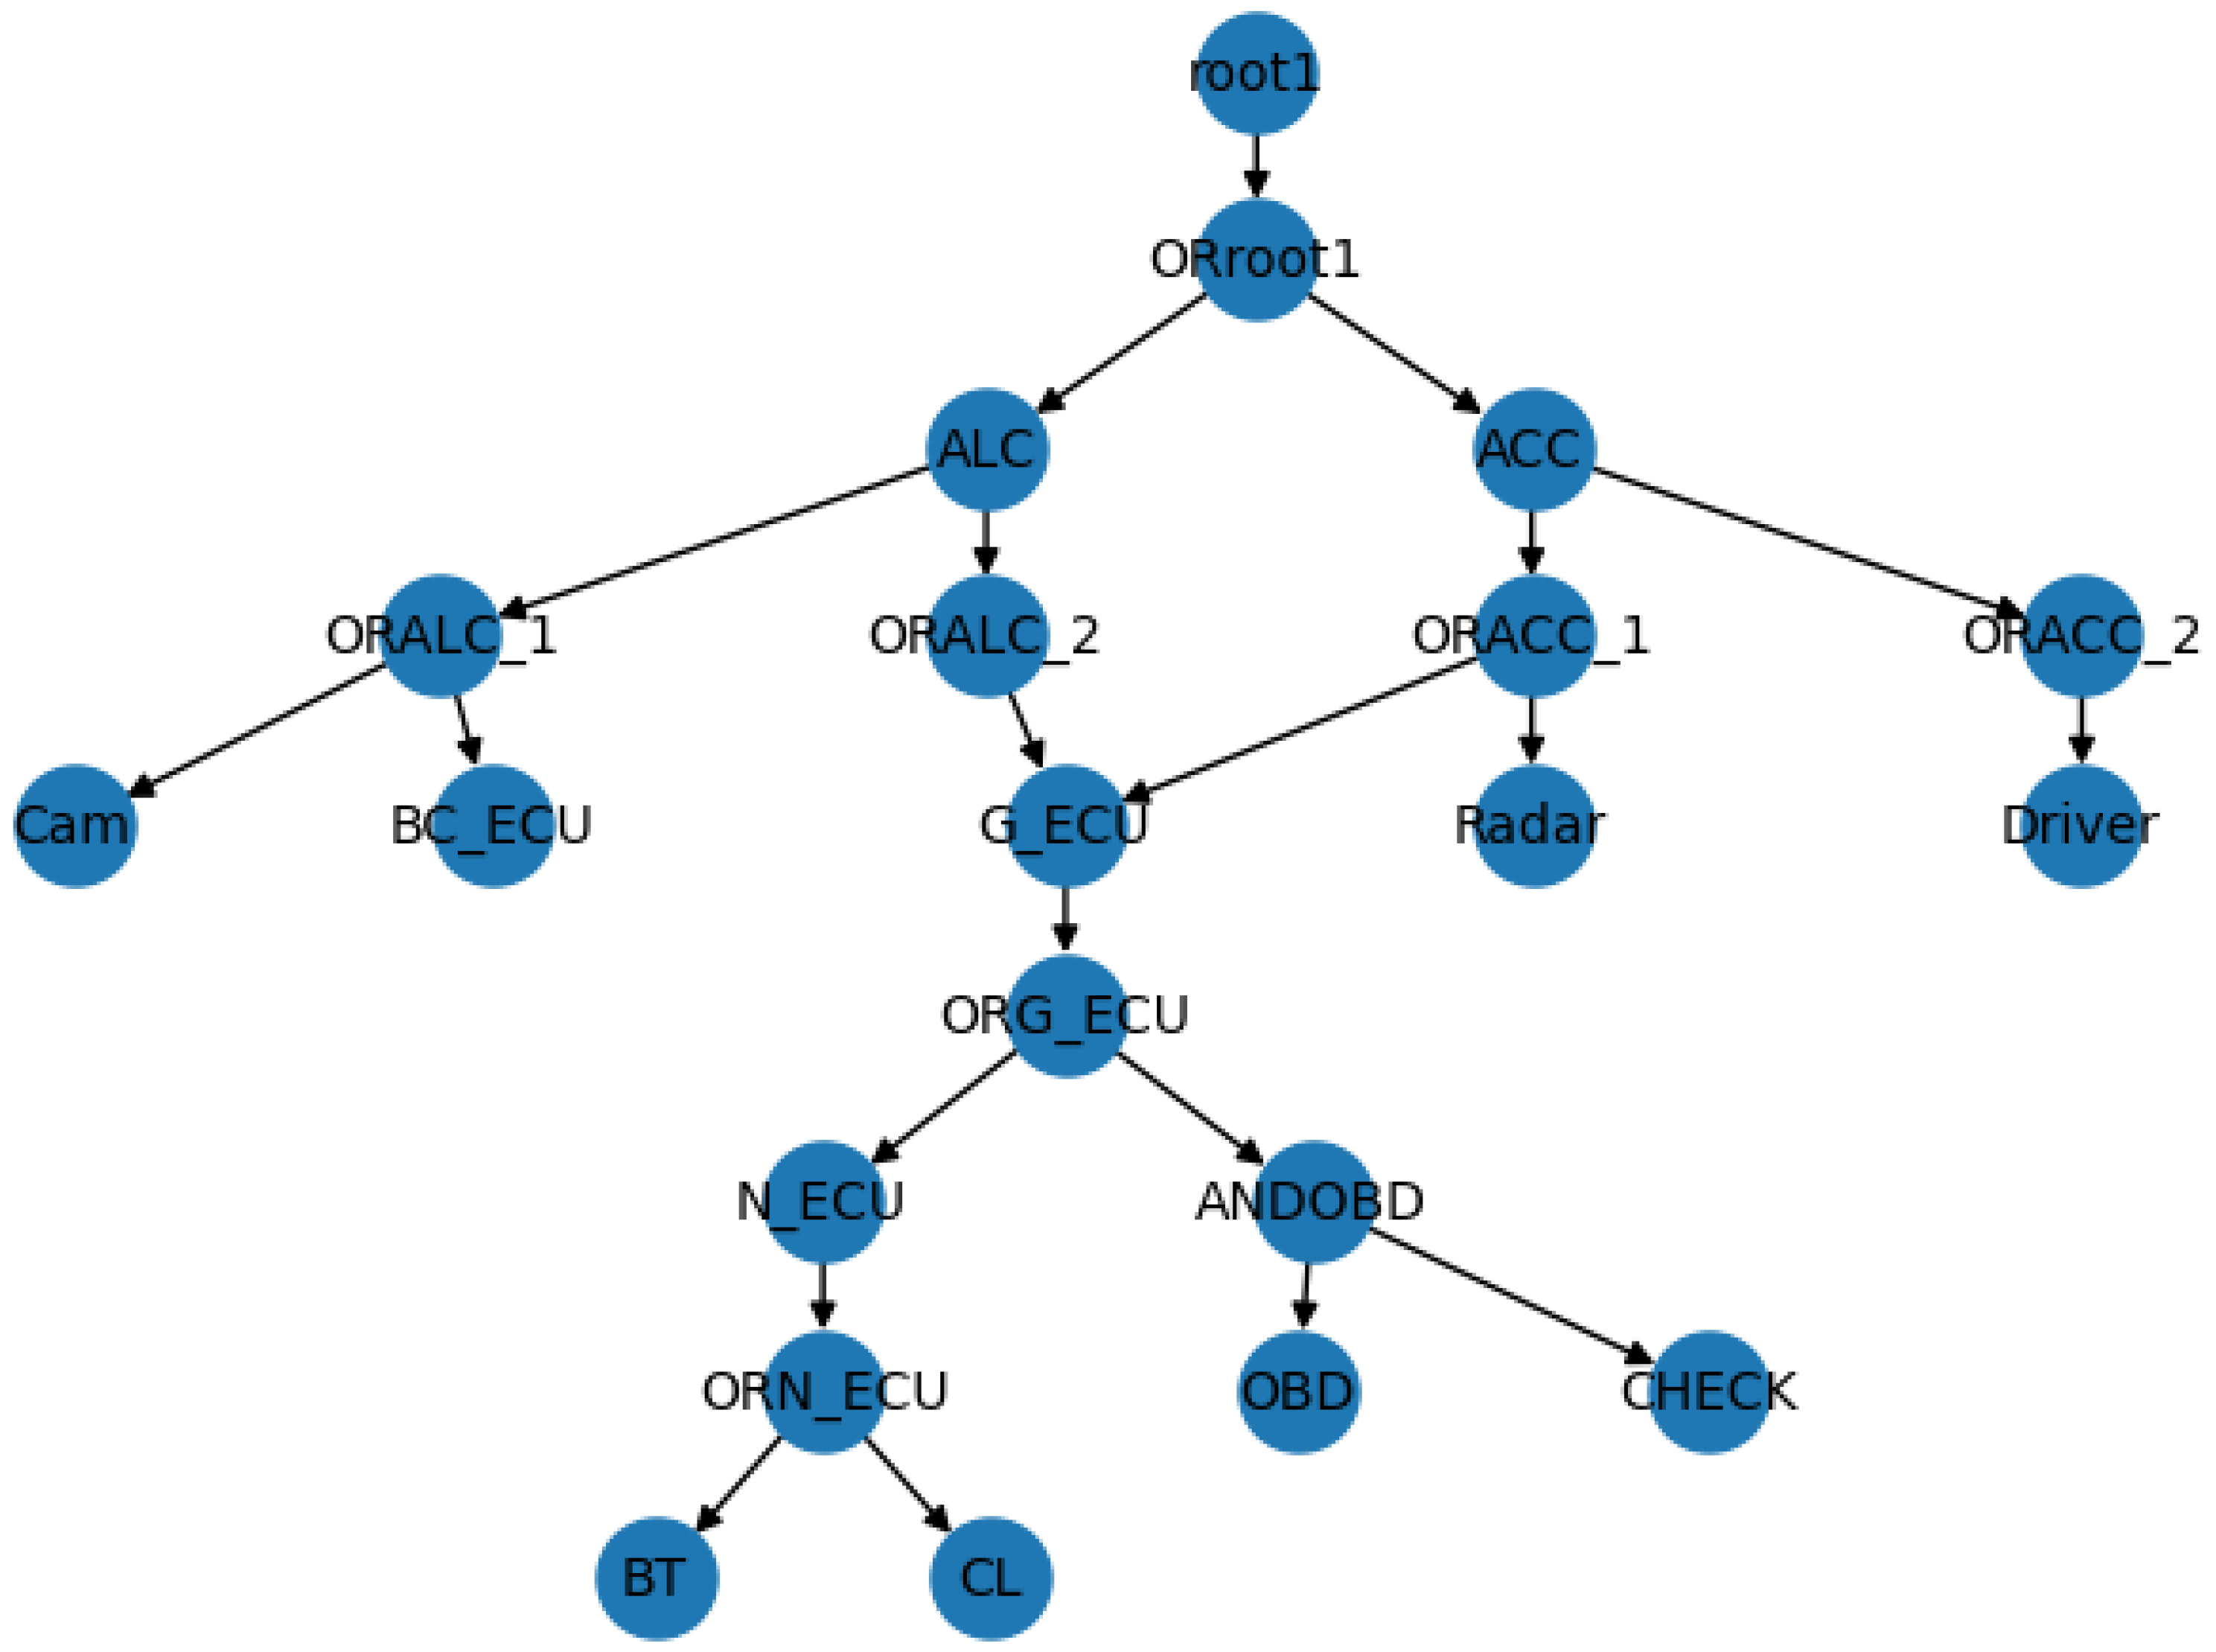
Let us consider Figure 12, which is generated from the system diagram Figure 11. Firstly, the attack surfaces and targets are to be identified. In this case, three attack surfaces are identified: Bluetooth, Cellular, and OBD-II Port, as shown in Figure 11. Compromising a system’s Cellular and Bluetooth interfaces could be an attack tree that can be extracted from the library of K-partite graphs produced in Step 4. The attacker can use either of the available attack surfaces, so OR disjunction is used. Conversely, if the attacker has to get through both systems, such as Navigation ECU and Gateway ECU, then AND conjunction should be used. In this specific case, Navigation ECU is part of Gateway ECU; therefore, AND conjunction is not used here. If two components are connected in series, the attacker must compromise both to go to the next step. For simplicity, the Navigation ECU and Gateway ECU are considered relay nodes. Navigation ECU is part of Gateway ECU; therefore, we added them one after another in Figure 13. After passing through the Gateway ECU, the attacker can access ACC and ALC. The spoofing attack would be successful if the attacker could spoof any input data. It includes a sudden use of a brake or a crash, or the car can hit the car in front with a sudden reduction of the headlight. Algorithm 3 is designed to produce the integrated attack tree, as shown in Figure 12.
Figure 12.
ALC and ACC integrated attack tree.

Algorithm 3:
This algorithm will generate an integrated attack tree using a system diagram. The procedure tree structure is defined, and a few inputs are defined, such as the system diagram, list of threats, and attacker goals. Line 3 is about a while loop that iterates over the list of the attacker’s goals. Lines 4–5 refer to each attacker’s goal, making it a tree’s root node. Lines 6–8 are about a Depth First Search on the system diagram that completes the tree by adding connected nodes as children. From Lines 10 to 15, the proposed algorithm merged each tree generated above on common nodes. It will be performed for each tree until every node is exhausted, and a merged tree will be returned. Lines 16–20 are about adding conjunction or disjunction in a merged tree. If two nodes are in parallel, an OR node will be used between them; otherwise, an AND node will be added between them. After merging the attack tree, we aim to attach appropriate threats to each leaf node. Therefore, Lines 21–26 are about iterating over the already available list of threats for each node and attaching them to respective nodes in a tree. This will return an updated merged attack tree. From Lines 27 to 30 is the calling of the K-Partite Graph Search function and passing each leaf node (threat name) to that function, which will return the attack tree from a library. We add that attack tree in our generated merged tree, avoiding duplication of nodes. The upper bound of the complexity of this algorithm is O( + )
| Algorithm 3 Attack Tree from System Diagram. |
|
Figure 13.
Integrated attack tree example.

5.4. Steps 6–7: Initial Risk Calculation
To calculate the residual risk of a system, it is essential to compute the initial risk of a system. Considering the applicability of different threats on one asset, there is a need to examine all non-functional properties that can be compromised. Calculation of initial risk requires the following steps:
- Asset assessment;
- Threat assessment;
- Impact and likelihood calculation.
One component might have multiple assets that must be identified first. There are various assets in an automotive system, such as CAN frame, firmware, etc. After the identification of assets, there is a need to associate the non-functional properties , i.e., (CIA) those can not be satisfied given that identified threats become an attack.
Every threat has an associated severity or impact. Let us consider there is an asset , and if its property is being violated, then the impact I of that would be a function of asset and property .
The impact will be quantified as a score (1–4) for severe, major, moderate, and negligible, respectively. If the impact is severe or major, it will cause more damage to the system if the associated attack is successful.
It is essential to consider the impact of a threat and the feasibility or likelihood of a threat to calculate the risk to a system. The likelihood of a threat on an asset will be
The risk is calculated as a lookup matrix in ISO/SAE 21434. An example is given in ISO/SAE 21434 [5], or it can be defined by the company (OEM). The total risk is defined as the sum of the risk R considering all threats and the associated properties of an asset.
5.5. Steps 9–10: Calculating Residual Risk Using Flow Graphs
In our previous work [6], we modelled the residual risk problem as a maximum flow problem, a well-studied problem in graph theory [62]. It is used to model various research problems, i.e., scheduling, optimal path selection, etc. Here, it is used to model the flow of risk where source s and sink t are starting and ending nodes in the maximum flow problem. There could be multiple hops between s, t, and multiple relay nodes can also be there. Each link between the relay nodes has a specific capacity of risk. We have set such a path so that flow between s and t can be maximised considering the capacities of the link. A graph G = (V,E,c) where: V = is the set of nodes, including assets , defences (control measures) , source s, sink t. is a set of edges, and c: E→ Risk is the capacity of each link. The flow graph is modelled using standard practices; s and t are added to select the start and end of the flow graph. The remaining nodes follow the property of the bi-partite graph. The defences should reduce the flow of risk passing through the graph.
The total risk to a system is calculated using TARA as an inward flow to a flow graph, as shown in Figure 14. Defences are placed to reduce the risk of an attack on any system. Considering our flow graph, the flow of risk should be reduced as they pass through any node representing a countermeasure. Considering Figure 14, (y,z) are the capacity of the links whereas two defence nodes have effectiveness ,. The effectiveness of defences should be 0 < (,) as 0 means not effective and 1 represents the fact that the risk of an attack is fully mitigated. The mitigated risk can be calculated using Equation (4), whereas the risk reaching the sink will be a residual risk.
Considering the ACC system, where a CAN frame from ACC is an asset. After the TARA, multiple defences are identified. In the scope of this work, we are considering data validation or shutdown channel and ignoring the message from private CAN as defence according to [63]. If the inflow of initial risk is X and the y, z are the distributed flow to two links with effectiveness and . Then the risk that will reach t will always be less than X because product of (y.), (z.) due to the fact 0 < (, , … ) . After applying appropriate defences against potential attacks, the remaining risk is the “Residual Risk” and can be calculated using Equation (5). If the residual risk exceeds the acceptable level, return to Step 2.
Figure 14.
Residual risk calculation using flow graph.

6. Discussion
Considering our system diagram and associated threats, we have used ThreatGet to generate a threat model and Python 3.10.12 to implement our proposed algorithms. We have provided a few snips in figures. (Figure A1, Figure A2, Figure A3 and Figure A4) from our Python-based code in the Appendix A. We compared our proposed framework with the requirements of the risk management framework in Table 3. It is identified which requirements are satisfied, partially, or still need to be satisfied. It can be observed that most of the requirements are satisfied. Currently, the requirements for automation support and parameterisation are partially satisfied. Our framework also only considers risk reduction; therefore, it is viewed as partially satisfied because there are the options of risk avoidance, risk sharing, and risk retaining in the risk treatment decision. All the other risk treatment options are outside the scope of our work. Additionally, we considered assurance by evaluating the effectiveness of the countermeasure and intuitive indicators to measure the results of RMF as not satisfied yet in this article, these areas will be addressed in our future work.
An integrated attack tree is developed from the system diagram, as shown in Figure 11. Directed edges can represent information flow from one system component to another. These directed edges help us develop an integrated attack tree from the system diagram. We have generated an attack tree with a broad vision of the system under inspection. A K-partite graph can be developed from the available attack trees for different attacks. These K-partite graphs will reduce the redundancy as well as it will act as a library for calling detailed attack trees. The conversion of known attack trees to a K-partite graph can only be correct when the generated K-partite graph satisfies the requirement of an attack tree. A K-partite graph’s foundational requirement is to separate vertices into K-independent sets or partites. Attack trees also follow a similar approach as they have multiple levels, and entities are independent of each other at the same level, as shown in Figure 6.
Table 3.
Requirements of risk management framework.
| Requirements | Satisfied | Partially Satisfied | Not Yet Satisfied | Argument |
|---|---|---|---|---|
| Follow practices and standards for risk management framework such as NIST SP 800-30 [13], ISO 31000 [12]. | ✓ | The proposed approach aligns well with ISO/SAE 21434 and NIST-SP 800. | ||
| Generic, not bound to a particular domain. | ✓ | It applies to other domains i.e., CPS, automotive | ||
| Support automation and parameterization | ✓ | Proposed an algorithmic solution to generate attack trees. | ||
| Assurance by evaluating effectiveness of countermeasure. | ✓ | Future work will cover defense identification and assurance. | ||
| Handling risk Propagation in a system. | ✓ | Visualization of a combined attack tree helps identify risk propagation from one asset. | ||
| Intuitive indicators to measure results of RMF. | ✓ | Future work will consider graph-oriented techniques for ranking threats. | ||
| Continuous risk management process. | ✓ | It follows a continual process as shown in Figure 3. | ||
| Scalable to incorporate new technologies and interfaces. | ✓ | Adding new components, handling further attacks, and finding applicable defences can be achieved using the proposed framework. | ||
| Comprehensively manage system risk. | ✓ | The scope of this work considers risk reduction. We are currently not dealing with risk avoidance, sharing, or treatment. |
7. Conclusions
Securing an automotive system can be achieved by identifying and mitigating risks. Considering the remaining risk after applying the countermeasures is crucial as mitigations are not 100% effective, and they can also introduce novel risks into the system. This work presented a modern RMF aligned with ISO/SAE 21434 and the requirements shown in Table 3. It incorporates the impact of threats, the feasibility of an attack, vulnerabilities introduced by third parties, and new defences in a system. The proposed framework is evaluated by matching it with the requirements for RMF. A broad system overview is required to understand risk better. Therefore, we considered the automated generation of an integrated attack tree. Our proposed attack tree generation method is generic, and it applies to CPS as well. It generates an integrated attack tree where multiple roots can be placed at the top of a tree. This tree is developed from a system diagram, and in this article, we considered ACC and ALC systems to generate an integrated attack tree. An integrated attack tree can help to evaluate a system’s risk propagation and is scalable.
In our future work, the implementation of the proposed methodology and a method to identify suitable countermeasures for the attack will be considered. Applying defences in a system can induce new vulnerabilities in the system; therefore, it is vital to use necessary and effective ones. To resolve this problem, we are keen to identify the locality for defence placement so that it will be effective. It is also advised to avoid unnecessary integration of defences that will reduce the chances of adding more vulnerabilities and complexity to a system.
Author Contributions
Conceptualization, A.N.K., J.B. and G.S.; Methodology, A.N.K., J.B. and G.S.; Writing—original draft, A.N.K.; Writing—review and editing, J.B., G.S. and H.J.; Supervision, J.B.; visualization, A.N.K.; formal analysis, A.N.K., J.B. All authors have read and agreed to the published version of the manuscript.
Funding
This research received no external funding.
Data Availability Statement
No new data were created or analyzed in this study. Data sharing is not applicable to this article.
Conflicts of Interest
The authors declare no conflict of interest.
Appendix A. Snippets from Implementation
Figure A1.
System model diagram.

Figure A2.
System model of attack tree conversion.

Figure A3.
K-partite graph-based library.

Figure A4.
Integrated attack tree.

References
- Researchers Hack BMW Cars, Discover 14 Vulnerabilities. 2018. Available online: https://www.helpnetsecurity.com/2018/05/23/hack-bmw-cars/ (accessed on 21 May 2022).
- Hackers Remotely Kill a Jeep on the Highway—With Me in It. 2016. Available online: https://www.wired.com/2015/07/hackers-remotely-kill-jeep-highway/ (accessed on 17 November 2023).
- Koscher, K.; Czeskis, A.; Roesner, F.; Patel, S.; Kohno, T.; Checkoway, S.; McCoy, D.; Kantor, B.; Anderson, D.; Shacham, H. Experimental security analysis of a modern automobile. In Proceedings of the 2010 IEEE Symposium on Security and Privacy, Oakland, CA, USA, 16–19 May 2010; pp. 447–462. [Google Scholar]
- Team of Hackers Take Remote Control of Tesla Model S from 12 Miles Away. 2016. Available online: https://www.theguardian.com/technology/2016/sep/20/tesla-model-s-chinese-hack-remote-control-brakes (accessed on 11 November 2021).
- ISO/SAE 21434:2021; Road Vehicles—Cybersecurity Engineering. ISO: Geneva, Switzerland, 2021.
- Khan, A.; Bryans, J.; Sabaliauskaite, G. Framework for Calculating Residual Cybersecurity Risk of Threats to Road Vehicles in Alignment with ISO/SAE 21434. In Proceedings of the International Conference on Applied Cryptography and Network Security, Rome, Italy, 20–23 June 2022; Springer: Cham, Switzerland, 2022; pp. 235–247. [Google Scholar]
- Schneier, B. Attack trees. Dr. Dobb’s J. 1999, 24, 21–29. [Google Scholar]
- Macher, G.; Sporer, H.; Berlach, R.; Armengaud, E.; Kreiner, C. SAHARA: A security-aware hazard and risk analysis method. In Proceedings of the 2015 Design, Automation & Test in Europe Conference & Exhibition (DATE), Grenoble, France, 9–13 March 2015; IEEE: Piscataway, NJ, USA; pp. 621–624. [Google Scholar]
- Schmittner, C.; Ma, Z.; Smith, P. FMVEA for safety and security analysis of intelligent and cooperative vehicles. In Proceedings of the International Conference on Computer Safety, Reliability, and Security, Florence, Italy, 8–9 September 2014; Springer: Cham, Switzerland, 2014; pp. 282–288. [Google Scholar]
- Anisetti, M.; Ardagna, C.A.; Bena, N.; Foppiani, A. An Assurance-Based Risk Management Framework for Distributed Systems. In Proceedings of the 2021 IEEE International Conference on Web Services (ICWS), Chicago, IL, USA, 5–10 September 2021; pp. 482–492. [Google Scholar]
- Methods for Testing & Specification; Risk-Based Security Assessment and Testing Methodologies. 2017. Available online: https://cdn.standards.iteh.ai/samples/43304/600f329d9fbd4ef1ba07a115de3097af/Methods-for-Testing-Specification-Risk-based-Security-Assessment-and-Testing-Methodologies.pdf (accessed on 17 November 2023).
- ISO 31000; Risk Management–Principles and Guidelines. International Organization for Standardization: Geneva, Switzerland, 2009.
- Joint Task Force Transformation Initiative. In Guide for Conducting Risk Assessments; Tech. Rep. NIST Special Publication (SP) 800-30, Rev.; National Institute of Standards and Technology: Gaithersburg, MD, USA, 2012.
- Nurse, J.R.; Creese, S.; De Roure, D. Security risk assessment in internet of things systems. IT Prof. 2017, 19, 20–26. [Google Scholar] [CrossRef]
- Jahnke, M.; Thul, C.; Martini, P. Graph based metrics for intrusion response measures in computer networks. In Proceedings of the 32nd IEEE Conference on Local Computer Networks (LCN 2007), Dublin, Ireland, 15–18 October 2007; IEEE: Piscataway, NJ, USA; pp. 1035–1042. [Google Scholar]
- UNECE Regulation No. 155—Cyber Security and Cyber Security Management System. 2021. Available online: https://unece.org/transport/documents/2021/03/standards/un-regulation-no-155-cyber-security-and-cyber-security (accessed on 17 November 2023).
- Bißmeyer, N.; Frank, K.; Stefan, D.; Christian, S. PREparing SEcuRe VEhicle-to-X. 2011. Available online: https://trimis.ec.europa.eu/sites/default/files/project/documents/20121025_114452_74602_PRESERVE-D1.1-Security_Requirements_of_Vehicle_Security_Architecture.pdf (accessed on 17 November 2023).
- The EVITA Consortium, EVITA Threat and Risk Analysis. 2009. Available online: https://www.evita-project.org/Publications/Seu09.pdf (accessed on 12 September 2021).
- Open VEhiculaR SEcurE Platform (OVERSEE). 2012. Available online: https://cordis.europa.eu/project/id/248333 (accessed on 15 January 2022).
- Ruddle, A.; Ward, D.; Weyl, B.; Idrees, S.; Roudier, Y.; Friedewald, M.; Leimbach, T.; Fuchs, A.; Gürgens, S.; Henniger, O. Deliverable D2.3: Security Requirements for Automotive on-Board Networks Based on Dark-Side Scenarios. EVITA Proj. (Version 1.1). 2009; pp. 85–130. Available online: https://zenodo.org/records/1188418 (accessed on 17 November 2023).
- Common Methodology for Information Technology Security Evaluation (CEM v3.1). 2017. Available online: https://www.commoncriteriaportal.org/files/ccfiles/CEMV3.1R5.pdf (accessed on 17 November 2023).
- Olovsson, T. HEAling Vulnerabilities to ENhance Software Security and Safety (HEAVENS). 2015; pp. 33–89. Available online: https://research.chalmers.se/en/project/5809 (accessed on 20 November 2018).
- ISO/IEC 15408-1:2009; Information Technology—Security Techniques—Evaluation Criteria for IT Security. ISO: Geneva, Switzerland, 2009.
- Schmidt, K.; Tröger, P.; Kroll, H.M.; Bünger, T.; Krueger, F.; Neuhaus, C. Adapted development process for security in networked automotive systems. SAE Int. J. Passeng. Cars Electron. Electr. Syst. 2014, 7, 516–526. [Google Scholar] [CrossRef]
- Intelligent Transport Systems (ITS). In Security; Threat, Vulnerability and Risk Analysis (TVRA). ETSI TR 102 893 V1.2.1 March 2017. Available online: https://cdn.standards.iteh.ai/samples/35784/df77f1b9ab9e4be88965c14a9f0d49d7/ETSI-TR-102-893-V1-2-1-2017-03-.pdf (accessed on 17 November 2023).
- Le, A.; Maple, C. A simplified approach for dynamic security risk management in connected and autonomous vehicles. In Proceedings of the Living in the Internet of Things (IoT 2019), London, UK, 1–2 May 2019; pp. 1–8. [Google Scholar]
- Salfer, M.; Eckert, C. Attack graph-based assessment of exploitability risks in automotive on-board networks. In Proceedings of the 13th International Conference on Availability, Reliability and Security, Hamburg Germany, 27–30 August 2018; pp. 1–10. [Google Scholar]
- Park, S.; Park, H. PIER: Cyber-resilient risk assessment model for connected and autonomous vehicles. Wirel. Netw. 2022, 28, 1–15. [Google Scholar] [CrossRef]
- Cui, J.; Zhang, B. VeRA: A simplified security risk analysis method for autonomous vehicles. IEEE Trans. Veh. Technol. 2020, 69, 10494–10505. [Google Scholar] [CrossRef]
- Reich, J.; Trapp, M. SINADRA: Towards a framework for assurable situation-aware dynamic risk assessment of autonomous vehicles. In Proceedings of the 2020 16th European Dependable Computing Conference (EDCC), Munich, Germany, 7–10 September 2020; IEEE: Piscataway, NJ, USA; pp. 47–50. [Google Scholar]
- Won, D.H.; Kim, S. Foundations of attack trees. In Proceedings of the Information Security and Cryptology-ICISC, Seoul, Republic of Korea, 1–2 December 2005; Volume 2006. [Google Scholar]
- Weiss, J.D. A system security engineering process. In Proceedings of the 14th National Computer Security Conference, Washington, DC, USA, 1–4 October 1991; Volume 249, pp. 572–581. [Google Scholar]
- Salter, C.; Saydjari, O.S.; Schneier, B.; Wallner, J. Toward a secure system engineering methodolgy. In Proceedings of the 1998 Workshop on New Security Paradigms, Charlottsville, VA, USA, 22–25 September 1998; pp. 2–10. [Google Scholar]
- Amoroso, E.G. Fundamentals of Computer Security Technology; Prentice-Hall, Inc.: Upper Saddle River, NJ, USA, 1994. [Google Scholar]
- Ray, I.; Poolsapassit, N. Using attack trees to identify malicious attacks from authorized insiders. In Proceedings of the European Symposium on Research in Computer Security, Milan, Italy, 12–14 September 2005; Springer: Berlin/Heidelberg, Germany, 2005; pp. 231–246. [Google Scholar]
- Patel, S.C.; Graham, J.H.; Ralston, P.A. Quantitatively assessing the vulnerability of critical information systems: A new method for evaluating security enhancements. Int. J. Inf. Manag. 2008, 28, 483–491. [Google Scholar] [CrossRef]
- Yager, R.R. OWA trees and their role in security modeling using attack trees. Inf. Sci. 2006, 176, 2933–2959. [Google Scholar] [CrossRef]
- Jürgenson, A.; Willemson, J. Processing multi-parameter attacktrees with estimated parameter values. In Proceedings of the International Workshop on Security, Nara, Japan, 29–31 October 2007; Springer: Berlin/Heidelberg, Germany, 2007; pp. 308–319. [Google Scholar]
- Aven, T.; Vinnem, J.E. Risk, Reliability and Societal Safety; Taylor & Francis: Abingdon, UK, 2007. [Google Scholar]
- Kordy, B.; Mauw, S.; Radomirović, S.; Schweitzer, P. Foundations of attack–defense trees. In Proceedings of the International Workshop on Formal Aspects in Security and Trust, Pisa, Italy, 16–17 September 2010; Springer: Berlin/Heidelberg, Germany, 2010; pp. 80–95. [Google Scholar]
- Roy, A.; Kim, D.S.; Trivedi, K.S. ACT: Attack countermeasure trees for information assurance analysis. In Proceedings of the 2010 INFOCOM IEEE Conference on Computer Communications Workshops, San Diego, CA, USA, 15–19 March 2010; IEEE: Piscataway, NJ, USA; pp. 1–2. [Google Scholar]
- Zonouz, S.A. Game-Theoretic Intrusion Response and Recovery; University of Illinois at Urbana-Champaign: Champaign, IL, USA, 2011. [Google Scholar]
- Tanu, E.; Arreymbi, J. An examination of the security implications of the supervisory control and data acquisition (SCADA) system in a mobile networked environment: An augmented vulnerability tree approach. In Proceedings of the Advances in Computing and Technology, (AC&T) The School of Computing and Technology 5th Annual Conference, London, UK, 14 September 2010. [Google Scholar]
- Poolsapassit, N.; Ray, I. Investigating computer attacks using attack trees. In Proceedings of the IFIP International Conference on Digital Forensics, Orlando, FL, USA, 28–31 January 2007; Springer: New York, NY, USA, 2007; pp. 331–343. [Google Scholar]
- Jürgenson, A.; Willemson, J. Computing exact outcomes of multi-parameter attack trees. In Proceedings of the OTM Confederated International Conferences “On the Move to Meaningful Internet Systems”, Monterrey, Mexico, 9–14 November 2008; Springer: Berlin/Heidelberg, Germany, 2008; pp. 1036–1051. [Google Scholar]
- Jürgenson, A.; Willemson, J. Serial model for attack tree computations. In Proceedings of the International Conference on Information Security and Cryptology, Seoul, Republic of Korea, 2–4 December 2009; Springer: Berlin/Heidelberg, Germany, 2009; pp. 118–128. [Google Scholar]
- Jürgenson, A.; Willemson, J. On fast and approximate attack tree computations. In Proceedings of the International Conference on Information Security Practice and Experience, Seoul, Republic of Korea, 12–13 May 2010; Springer: Berlin/Heidelberg, Germany, 2010; pp. 56–66. [Google Scholar]
- Niitsoo, M. Optimal adversary behavior for the serial model of financial attack trees. In Proceedings of the International Workshop on Security, Kobe, Japan, 22–24 November 2010; Springer: Berlin/Heidelberg, Germany, 2010; pp. 354–370. [Google Scholar]
- Buldas, A.; Lenin, A. New efficient utility upper bounds for the fully adaptive model of attack trees. In Proceedings of the International Conference on Decision and Game Theory for Security, Fort Worth, TX, USA, 11–12 November 2013; Springer: Cham, Switzerland, 2013; pp. 192–205. [Google Scholar]
- Buldas, A.; Laud, P.; Priisalu, J.; Saarepera, M.; Willemson, J. Rational choice of security measures via multi-parameter attack trees. In Proceedings of the International Workshop on Critical Information Infrastructures Security, Samos Island, Greece, 31 August–1 September 2006; Springer: Berlin/Heidelberg, Germany, 2006; pp. 235–248. [Google Scholar]
- Buldas, A.; Mägi, T. Practical security analysis of e-voting systems. In Proceedings of the International Workshop on Security, Nara, Japan, 29–31 October 2007; Springer: Berlin/Heidelberg, Germany, 2007; pp. 320–335. [Google Scholar]
- Fovino, I.N.; Masera, M.; De Cian, A. Integrating cyber attacks within fault trees. Reliab. Eng. Syst. Saf. 2009, 94, 1394–1402. [Google Scholar] [CrossRef]
- Roy, A. Attack Countermeasure Trees: A Non-State-Space Approach towards Analyzing Security and Finding Optimal Countermeasure Sets. Ph.D. Thesis, Duke University, Durham, NC, USA, 2010. [Google Scholar]
- Roy, A.; Kim, D.S.; Trivedi, K.S. Cyber security analysis using attack countermeasure trees. In Proceedings of the Sixth Annual Workshop on Cyber Security and Information Intelligence Research, Oak Ridge, TN, USA, 21–23 April 2010; pp. 1–4. [Google Scholar]
- Zonouz, S.A.; Khurana, H.; Sanders, W.H.; Yardley, T.M. RRE: A game-theoretic intrusion response and recovery engine. IEEE Trans. Parallel Distrib. Syst. 2013, 25, 395–406. [Google Scholar] [CrossRef]
- Xiao, L.; Gao, F. A comprehensive review of the development of adaptive cruise control systems. Veh. Syst. Dyn. 2010, 48, 1167–1192. [Google Scholar] [CrossRef]
- Mahadevan, R.K.; Gurusamy, M. Adaptive Headlight Control System. J. Phys. Conf. Ser. IOP Publ. 2021, 1969, 012059. [Google Scholar] [CrossRef]
- Potter, B. Microsoft SDL threat modelling tool. Netw. Secur. 2009, 2009, 15–18. [Google Scholar] [CrossRef]
- Schmittner, C.; Chlup, S.; Fellner, A.; Macher, G.; Brenner, E. ThreatGet: Threat modeling based approach for automated and connected vehicle systems. In Proceedings of the AmE 2020-Automotive Meets Electronics, 11th GMM-Symposium, Dortmund, Germany, 10–11 March 2020; VDE: Frankfurt am Main, Germany, 2020; pp. 1–3. [Google Scholar]
- Asratian, A.S.; Denley, T.M.; Häggkvist, R. Bipartite Graphs and Their Applications; Cambridge University Press: Cambridge, UK, 1998; Volume 131. [Google Scholar]
- Lounis, K.; Zulkernine, M. Attacks and defenses in short-range wireless technologies for IoT. IEEE Access 2020, 8, 88892. [Google Scholar] [CrossRef]
- Goldberg, A.V.; Tarjan, R.E. A new approach to the maximum-flow problem. J. ACM 1988, 35, 921–940. [Google Scholar] [CrossRef]
- Mahmood, S.; Nguyen, H.N.; Shaikh, S.A. Systematic threat assessment and security testing of automotive over-the-air (OTA) updates. Veh. Commun. 2022, 35, 100468. [Google Scholar] [CrossRef]
Figure 1.
Structure of background section.

Table 1.
Security models.
| Security Model | Application | Threat Model | Impact | Inputs | Outputs |
|---|---|---|---|---|---|
| EVITA | Vehicular IT System | Attack Tree | Safety, Financial, Operational, Privacy | Cases and Assets | Attack Scenario, Security Requirements, Risk Level |
| HEAVENS | Vehicular Electrical/ Electronic System | STRIDE | Safety, Financial, Operational, Privacy | Functional Use Case | Risk Matrix, Threat Level, High-Level Security Requirements |
| SINA | Connect Vehicles | STRIDE, Attack Tree | Safety | System Use Case | Threats, Failure Mode, Severity |
| SAHARA | Automotive Embedded System | STRIDE | Safety | Safety Analysis | Threat Level, Security Level |
| TVRA | Communications and ITS | TVRA for Telecommunication | Operational, Finance | Target of Evaluation | Risk, Counter Measures |
Disclaimer/Publisher’s Note: The statements, opinions and data contained in all publications are solely those of the individual author(s) and contributor(s) and not of MDPI and/or the editor(s). MDPI and/or the editor(s) disclaim responsibility for any injury to people or property resulting from any ideas, methods, instructions or products referred to in the content. |
© 2023 by the authors. Licensee MDPI, Basel, Switzerland. This article is an open access article distributed under the terms and conditions of the Creative Commons Attribution (CC BY) license (https://creativecommons.org/licenses/by/4.0/).
Share and Cite
MDPI and ACS Style
Khan, A.N.; Bryans, J.; Sabaliauskaite, G.; Jadidbonab, H. Integrated Attack Tree in Residual Risk Management Framework. Information 2023, 14, 639. https://doi.org/10.3390/info14120639
AMA Style
Khan AN, Bryans J, Sabaliauskaite G, Jadidbonab H. Integrated Attack Tree in Residual Risk Management Framework. Information. 2023; 14(12):639. https://doi.org/10.3390/info14120639
Chicago/Turabian StyleKhan, Ahmed Nawaz, Jeremy Bryans, Giedre Sabaliauskaite, and Hesamaldin Jadidbonab. 2023. "Integrated Attack Tree in Residual Risk Management Framework" Information 14, no. 12: 639. https://doi.org/10.3390/info14120639
Note that from the first issue of 2016, this journal uses article numbers instead of page numbers. See further details here.