

Addiction and Spending in Gacha Games

1
Independent Researcher, 10000 Zagreb, Croatia
2
Department of Multimedia, University North, University Center Varaždin, 42000 Varaždin, Croatia
3
Inpro d.o.o., 40000 Čakovec, Croatia
*
Author to whom correspondence should be addressed.
Information 2023, 14(7), 399; https://doi.org/10.3390/info14070399
Submission received: 22 June 2023
/
Revised: 10 July 2023
/
Accepted: 11 July 2023
/
Published: 13 July 2023
(This article belongs to the Special Issue Game Informatics)
Abstract
:Gacha games are the most dominant games on the mobile market. These are free-to-play games with a lottery-like system, where the user pays with in-game currency to enter a draw in order to obtain the character or item they want. If a player does not obtain what he hoped for, there is the option of paying with his own money for more draws, and this is the main way to monetize the Gacha game. The purpose of this study is to show the playing and spending habits of Gacha players: the reasons they like such games, the reasons for spending, how much they spend, what they spend on, how long they have been spending, and whether they are aware of their spending. The paper includes studies by other researchers on various aspects of Gacha games as well. The aim of the paper is to conduct a study with the hypothesis that players who play the same game for a while and have a habit of playing it are willing to give more of their money to enter a draw. Therefore, two research questions and two hypotheses were analyzed. A total of 713 participants took part in the study.
1. Introduction
Gachapon is a name originally used by the Bandai company for marketing capsuled toys in their vending machines. The word Gacha/gasha and pon are onomatopoeic words that are used for two sounds made by Gacha: “Gacha”, turning the handle in the vending toys and “pon”, the sound of capsule as it falls out of the machine. Gachapons are still today used in Japan so that the users can be given small objects such as toys, which many people collect [1].
Gacha were introduced to the Japanese mobile game scene in 2011 and have since become an important part of the gaming industry. Gacha aspects in games have different mechanics and mostly have characters, cards and other items. In most modern Gacha games, Gacha is linked with events that are present for a limited time, and this creates in people the feeling of need and fear of missing out. The basic concept behind these games is simple: the player spends a certain amount of in-game money to “jump start” Gacha and afterward, obtains a random character or item. As some items or characters are less frequent than others, the players will have to spin the game several times before they obtain what they want [1].
Almost all Japanese games with highest-grossing profits use the Gacha system. In the last 5 years, they have become a world-wide known phenomenon. It has been evaluated that more than half of the income from these games comes from Gacha, which indicates that Gacha is the best way to whale hunt (an expression for a person who spends big amounts on Gacha games) [2].
Cygames is a company that offers games on the mobile social game platform Mobage. Some of the most popular games on the platform are THE iDOLM@STER Cinderella Girls: Starlight Stage, Rage of Bahamut, and Granblue Fantasy. At present, in addition to the Mobage platform, Cygames is present on Android/IOS platforms as well as PS4 and PC. As far as the Gacha aspect is concerned, Granblue Fantasy sometimes introduces a promotional coupon for a lottery where ten JPY 3000 (around HRK 175) Gacha draws are made, and a gift coupon is received that can be exchanged for any character. The players who usually do not spend money are ready to pay in order to avoid a random draw and to make sure they obtain the character they want. During a promotional event in 2016, Granblue Fantasy added a limited-time character available only through the Gacha system. The terms “limited-time period” and “increase of probability” encourage many players to spend. One player won a character by spending JPY 700,000 (around HRK 41,000). According to the available statistics, the probability to win a character was much lower than the official announcement stated, which caused many complaints and much criticism. Cygames adopted a compensation of big proportions and set up the following Gacha system in Granblue Fantasy: for every draw, there is a currency called “Cerulean Sparks“. After the player obtains 300 Cerulean Sparks, those sparks can be exchanged for one character that can be won via a draw. After this fiasco, the CESA asked their members to follow the guidelines by showing the probability of draws in each banner. This had nothing to do with a law; it is just a rule that is today a part of every popular Gacha game [3].
2. Related Work
2.1. Li and Nower
In 2019, Wen Li and Lia Nower conducted a study on the experiences of video game players with loot boxes, video gaming, and gambling. The survey investigated whether they spent money on loot boxes, whether loot boxes increased their gaming engagement, how often they played video games or gambled, and the duration of their video game or gambling sessions. The personal growth initiative scale (PGIS) was used for measuring the players’ gambling issues. The brief symptom inventory 18 (BSI-18) was used for the evaluation of players’ mental distress. The scientists searched for connections between buying loot boxes, video games, gambling, and mental distress. The effects of loot boxes were determined by comparing the answers of the video game players who bought loot boxes and those who did not.
It was discovered that nearly half of the sample (44%) spent money on loot box purchases, and 40% gambled online. Around 48% of the video game players who bought the loot boxes reported enhanced experiences of game playing as a result of purchasing loot boxes, while 18% reported that loot boxes worsened their gaming experience.
The game players who purchased the loot boxes played the video games more often and were more likely to play the game for seven or more hours per session. They also gambled online more often, and there was higher probability for them to gamble online for seven hours or more per session. The game players who bought loot boxes had serious issues with video games, and there was higher probability for them to meet the criteria for an Internet gaming disorder. They also had serious gambling issues. Problem video gaming and problem gambling were related to elevated mental distress. Therefore, the purchase of loot boxes was indirectly related to elevated psychological distress.
This study indicates that the purchase of loot boxes was related to problem gambling and problem video gaming. In order to minimize the damage from video gaming and gambling, the creators could take into consideration regulating certain loot box features. For example, they could ban buying loot boxes with real-world money. Regulations could be put in place to ban selling video games with loot boxes to individuals below a certain age limit [4].
2.2. Brooks and Clark
In 2019, Gabriel A. Brooks and Luke Clark conducted a similar study on the relationships between addiction and game gambling. Data were analyzed in order to determine to what extent adult video gamers used loot boxes, to what extent the use of loot boxes correlated to their gambling beliefs, problem gambling, and problematic online gaming, and to what extent market games influenced the usage of loot boxes. The examiners developed the risky loot box index (RLI).
Most participants (88.9% in Study 1 and 94.8% in Study 2) opened the loot box. About half of the participants (49.3% in Study 1 and 60.3% in Study 2) spent the money on a loot box. Most participants (75.7% in Study 1 and 79.3% in Study 2) agreed loot boxes felt like a form of gambling. Most participants (68.1% in Study 1 and 86.2% in Study 2) thought loot boxes were a form of gambling. There was a higher percentage of current gamblers (53.2%) among the participants in Study 1 than in Study 2 (15.5%).
The risky loot box index gamers in Study 1 reported serious problems with video games and gambling, as well as with higher gambling and luck-related erroneous beliefs. These results indicated that erroneous beliefs could be a factor for risky loot box usage. Similar relationships were found among gamers in Study 2, however, to a lower extent. The reason for that could be the fact that Study 2 had a smaller number of gamblers than Study 1.
Both studies showed much stronger connections with risk loot box usage than the typical measure of problem gaming. This suggests there had to be a difference between a problematic loot box use and problematic gambling. The problematic loot box use can be an effect of tendencies for risky behavior and erroneous beliefs on gambling.
Some gamers (27.8% in Study 1 and 39.7% in Study 2) reported sales of loot box items on Internet markets. Furthermore, those who preferred market games bought loot boxes more often so they could sell their content. This suggested that market games could lead to gambling behaviors and change a gamer’s usage of loot boxes from wishing to buy items for personal reasons to wishing to make money [5].
2.3. Drummond and Sauer
This is in line with the study conducted in 2018 by Drummond and Sauer in which they wanted to determine if loot boxes constituted a form of gambling. The conclusion was that loot boxes shared important structural and psychological similarities to gambling, although each loot box game used in the study allowed for minor gamers to join it [6].
2.4. Lee and Kim
In 2016, Changho Lee and Ocktae Kim conducted a study for the Department of Mass Media Arts and Sciences at the National Youth Policy Institute in the Korean Sejong City. One of the main purposes of their study was to analyze the effect of online gaming on addiction by classifying it into PC online gaming and mobile gaming. This study aimed to analyze the extent to which playing games after midnight affected addictive behavior. In addition, this study analyzed the impact of game genres, parental factors, the leisure environment, and relationship satisfaction on game addiction. About 1556 students living in five major Korean cities were sampled. Online game playing time was an important predictor of game addiction, especially among those who played PC online games late at night. Among the game genres, RPG, simulation, and casual games were positively associated with addictive behavior. While the game and the leisure environment had little effect on game addiction, the extent of satisfaction with relationships with parents, friends, and teachers had a significant influence. However, parental attachment and parental mediation did not impact game addiction.
Games are an important part of leisure time activities for young Koreans. According to the statistics, 57.7% of young people enjoy watching television and DVDs at the weekends and during holidays, 41.9% play computer games, and only 17.9% engage in some type of cultural or art activities, and 14.5% actively play sports.
Various factors related to the addiction of online games in a smart mobile-phone saturated media environment were examined. Online game addicts were 11.4% of the participants in total. Their findings were similar to the addiction rate found in different Asian studies: 15.7% among adolescents in Hong Kong and between 8.8% and 9.9% among adolescents in Singapore. However, a superficial comparison of these results is not very beneficial due to the different scales used for measuring game addictions. If the demographic variables are considered, gender is strongly linked to game addiction. It is clear that male students are much more dependent on online games than female students. However, the number of female students who enjoy playing mobile games is increasingly growing. According to a study published by the National Youth Policy Institute in Korea, 41.7% of male participants enjoyed playing mobile games for more than 5 days per week in comparison to 33.2% of female participants. Having in mind the expansion and development of mobile games, it is becoming more and more likely that female students will also become addicted to mobile games. Online game playing time was an important predictor of game addiction, which supports the above-mentioned results of the study. It is interesting that the effect of PC online game playing time on addiction was more significant than the effect mobile gaming had on addiction. Although mobile games are also becoming more popular among adolescents, they seem to have a lower degree of addiction than the PC online games. However, with the development of technology, an increasing number of users will enjoy playing MMORPG on mobile platforms in the near future. This will probably increase the addiction of adolescents to mobile games, and, in turn, it will enhance their addiction.
The students who played PC online games late at night showed a higher tendency for game addiction. Therefore, it can be concluded that limiting adolescents’ access to PC online games after midnight is very important in preventing game addiction. However, this result does not mean the system of forced shutting down should be encouraged by blocking access to online games for young gamers. Although the Korean government does not allow high school students to use online games after midnight, some students manage to do it anyway. It is likely they have access to online games by using other people’s ID cards. This policy was criticized by many young people. It is necessary to have a higher degree of parental interest in children’s gaming after midnight and more guidance. Parents need to supervise their children’s habits and patterns discretely, as parental supervisions surely contributes to decreasing game addiction. Addicted adolescents can play games late at night. Therefore, the above-mentioned findings need to be interpreted carefully. Among the game genres, RPG, simulation, and casual games significantly increased the probability of addiction. However, the effect of these variables was not as strong.
It is interesting to note there was a significant gender difference related to the increased probability of addiction. The male students who liked simulation and casual games were at risk of developing addiction, while the female students who liked RPG and shooting were at a greater risk of addiction. One possible explanation for this result is that female students played RPG games in order to socialize with other gamers and for fun to a greater extent than the male students did. Therefore, they tended to be more addicted to RPG games. Although casual games were popular among female students, they increased the risk of addiction among male students. This result also indicated that men are becoming more and more trapped in simple games that do not require much time to play. As occasional gaming increases with the expansion of smartphones, male students are likely to be at a greater risk of becoming addicted to mobile gaming. This significant gender gap requires more detailed analysis in the future.
As opposed to many of the above-mentioned studies, this one found that parental attachment did not have a significant impact on gaming addiction. Parental mediation did not play a role in reducing gaming addiction. This result suggests that parental influence on gaming addiction among young people in Korean society is minimal. As already mentioned above, most participants stated their parents had no interest in their online gaming. The factors that increased the risk of online addiction at home were a lack of parental interest in their children’s online activities and a lack of willingness to control their time spent online [7].
2.5. Wang J. L., Sheng, and Wang H. Z.
In 2019, Jin-Liang Wang, Jia-Rong Sheng, and Hai-Zhen Wang conducted a study on the relationship between mobile game addiction and depression, social anxiety, and loneliness. The potential role of gender difference in the obtained results was also examined. The results revealed that adolescents with mobile game addiction had higher depression, social anxiety, and loneliness, which confirmed their three hypotheses regarding the association between mobile game addiction and depression, social anxiety, and loneliness. Further, a gender difference was observed between mobile game addiction and social anxiety, where a stronger connection between mobile game addiction and social anxiety could be seen in male adolescents. This indicates that male adolescents may experience more social anxieties if they use mobile game addictively compared with female adolescents. The literature has also shown that Internet addictions are related to poorer emotional health, in particular depression and anxiety. Adolescents with high Internet use exhibited more psychopathology, as revealed by the brief symptoms inventory (BSI, a reduced version of the symptoms checklist, SCL-90) compared with those with low Internet use. In a recent study, it was reported that young adults addicted to video games showed increased depression and anxiety and felt more socially isolated. The link between mobile game addiction and mental health may be a consequence of the social isolation resulting from spending too much time gaming, which, in turn, leads to undermined psychological well-being [8].
2.6. Chamarro, Oberst, Cladellas, and Fuster
In 2020, Andrés Chamarro, Ursula Oberst, Ramón Cladellas, and Héctor Fuster conducted a study with the aim of investigating the impact of psychological need frustration on mobile video gamers’ addictive behavior, as well as the role of cognitions (game-use expectancies) and behaviors (time spent playing) through a hypothetical serial mediation model, while controlling important correlates, such as game genre, age, gender, and payment during play. A total of 471 mobile game users (211 males) with an average age of 21 replied to an online survey containing sociodemographic and game variables, the need satisfaction and frustration scale (NSFS), the Internet gaming disorder scale—short form (IGDS9-SF), and a slightly modified version of the Internet use expectancies scale (IUES). The results corroborate the negative effects of need frustration on IGD among mobile gamers and clarify the role of time spent playing and game-use expectancies in the development of IGD, highlighting the important role of cognitions in this relationship. The conclusion is that both the time spent playing and game-use expectancies should be important targets for clinical interventions, even though they are not included in the diagnostic criteria [9].
2.7. Zendle and Cairns
In 2019, David Zendle and Paul Cairns conducted a study on loot box spending. Loot box spending was measured by asking the participants to state approximately how much money they spent on loot boxes in the previous month. In order to blind the participants about the aims of the study, they were asked a number of questions on their spending habits: how much money they spent on physical copies of video games; how much money they spent on virtual copies of video games; and how much money they spent on in-game items.
Problem gambling was measured using the problem gambling severity index (PGSI). The results of this study found further evidence for a potentially strong link between problem gambling and spending on loot boxes. Overall, there was a significant link between the participants results on the problem gambling severity index and their spending on loot boxes. Individuals who had no gambling problems spent significantly less money on loot boxes than those who were problem gamblers or those at risk of problem gambling.
The subgroup analyses revealed that gamblers had no problem spending significantly less money per month on loot boxes (average = USD 11.14) than any low-risk gamblers (average = USD 21.87), moderate-risk gamblers (average = USD 27.55), or problem gamblers (average = USD 38.24). This study found further evidence for a potentially strong link between problem gambling and the amount individuals spend on loot boxes. It directly addressed the limitations of previous studies in which a similar relationship was seen in an unblinded and self-selected sample.
This study replicated this relationship by suggesting that this relationship existed even when the sample was blinded to the fact that the study relates to loot boxes and gambling and that they did not choose themselves to be a part of a study related to loot boxes. However, it is crucial to note that the causal direction of this relationship is unclear. It is possible for loot boxes to cause individuals to become problem gamblers. Similarly, existing problem gambling might cause individuals to spend more money on buying loot boxes.
In that case, the presence of loot boxes in video games would not create a “ripe breeding ground” for problem gambling. Instead, loot boxes would give gaming companies the opportunity to take advantage of serious pre-existing psychological problems among their customers to make a substantial financial profit. Due to the correlational nature of this research, it is impossible to tease apart which of these directions of causality are true.
However, regardless of which of these outcomes is the case, the gaming industry is facing a crisis of conscience. Rating agencies such as the ESRB and PEGI are having a hard time arguing in good faith that there is little evidence of a link between problematic gambling and the use of loot boxes. Loot boxes are a new phenomenon, and game developers are understandably cautious of linking their products to gambling. However, in this case, “the focus of all the parties, whether governments, industry or consumers, should be on the need for self-education and due diligence in understanding the complexity and nuances of games and gambling”. Researchers firmly believe that this includes the need to constantly think about the potential effects of loot boxes on behalf of industry stakeholders [10].
2.8. Kim
In the study from 2016, Soul Kim analyzed the psychology of users who do not pay for the Gacha system from a multilevel perspective. For this reason, this study mainly focused on the Puzzle & Dragon mobile game, which has made the highest profit in the history of mobile games thanks to its Gacha system of collecting characters, which enables users to enjoy the game free of charge without needing to pay. This study analyzes the condition and psychological mechanism of users who pay for the Gacha system.
First, the users show cognitive error applicable to a reactional psychology and probability game in which the user pays to enjoy the moment the lottery starts. More precisely, the costs are generated through errors in self-rationalization, errors in operational conditioning, errors in sunk costs, errors in probability perception, and errors in chance. Second, users show a psychological reaction to scarcity. More precisely, after the user receives a limited-time message, the user appreciates the value of the product, which increases their desire to own their own unique character; the user pays to avoid the uncomfortable feeling of the restriction that something cannot be bought. Third, users pay for personal satisfaction. In particular, users are charged based on their desire to collect and strengthen a sense of superiority in the game, as well as to release a sense of defeat and relative deprivation if a particular character cannot be acquired.
Users who have invested a lot of money in the game may regret being impulsively charged for their cognitive error and their feeling of inferiority once they have completed the draw. However, by continuously providing in-game entertainment that can compensate for such negative and skeptical emotions while presenting different uses for unwanted lottery-acquired characters, F&D is a mobile game that remains popular. It was determined that the psychological analysis of users who pay for the Gacha game system presented in this study was assessed as valid basic academic data for accessing the psychology of users who consume virtual currency in mobile games [11].
3. Study
3.1. Defining Problems
The Gacha system in mobile games, such as games with loot boxes that have become common and popular recently, offer the possibility of large profits on free-to-play games. These games use the emotional state of the player, player’s good luck, bad luck, satisfaction, insecurity, financial stability, and dopamine when the player gets lucky in order to create addiction and the habit of repeating and continuing the game. This is not helped by the fact that Gacha games are available to all ages, and there is no limit, warning, or supervision of the age of gamers. The money can be used not only for draws but also for other smaller microtransactions that facilitate the game.
It can be concluded from the above-mentioned studies that an average Gacha game player is in his twenties, lonely or with very few friends, and is emotionally vulnerable. People who have less self-control when gambling suffer from depression or social anxiety and are also more inclined to higher spending when making Gacha game draws. The connection between a person’s bad relationship with their parents and their addiction to Gacha games cannot be proven. The oldest surveys were not conducted such a long time ago, but some surveys have been conducted either on a limited area, such as Korea, or have a slightly outdated view of the current situation on the Gacha game market.
3.2. Purpose and Goal of Study
Gacha games are modernized every year with new systems that allow players to invest money in entertainment without leaving anything to chance. This is achieved by smaller, monthly battle pass purchases (their purchase allows you to win more rewards through playing), monthly passes (give the player more in-game currency per month than the player could buy at once for the same amount of money), and character pick tickets (the player buys one character he chooses). The probability of winning the draw is public and easily accessible. An increasing number of games have a pity system (after a certain number of draws, the probability of winning a good character is higher or even guaranteed).
The purpose of this study is to show the playing and spending habits of Gacha players: the reasons they like such games, the reasons for spending, how much they spend, what they spend on, how long they have been spending, and whether they are aware of their spending.
3.3. Study Questions
Do players who have been playing the game for a while spend more money on draws than new players do?
Do players spend more time per day playing Gacha games when playing a new game?
3.4. Hypotheses
H1.
Players who have been playing the game for a longer time spend more money on draws, on average, than new players.
H2.
Players spend most of their time in a day playing Gacha games when they play a new game.
3.5. Methodology
3.5.1. Participants
A total of 713 participants took part in the study. In terms of age, 74 (10.4%) were under 18, and a third of participants (32.5%) were between 18 and 21 years old. Three-quarters of the participants were in their twenties. Almost half of the participants (45.9%) studied. As expected, 710 (99.5%) people played the Gacha game at the moment of conducting the survey, while the remaining 3 (0.4%) reported having played the game earlier but not anymore. Although the survey was published at subreddit for only 4 games, the participants play/have played each game mentioned in Question 7.
Most (91.7%) participants did not think they had any gambling problems, 57.2% participants regularly received money (work or other sources), and most participants (80.2%) spent the money on Gacha games.
3.5.2. Measuring Instruments
The survey was conducted in English so that more people from all over the world could fill it in. At the beginning, the purpose of the survey was highlighted, that it should not take more than 10 min to fill in the survey, and a request that the survey should be filled in honestly. The introductory part ended with a thank-you note. Most questions asked in the survey had predetermined answering options that the participants could choose from. Three questions were multiple choice questions. In some questions, participants had to list the Gacha games they played, state the reasons for spending money, and what hooked them on to spending money while playing the game. The Likert scale was used for three questions that were linked to the feelings of the participants. The participants’ feelings after playing the game were examined, how likely it was for them to spend the money again, and what the probability was for continuing to play this game. All 3 scales were numbered 1 to 10, where 1 was bad/most likely not, and 10 was good/most likely yes, depending on the question.
The survey consisted of 4 categories. The first category asked standard questions about demographics, such as gender, age, income, and level of education. The second category asked the questions about the participants’ relationship with Gacha games, how often they played, and what and why they played. The third category asked about spending and the reasons for spending. The fourth category examined spending and its consequences more closely.
3.5.3. Procedure
The survey was created via “Google Forms” because of easy data collection and processing. The participants of the survey voluntarily responded to it. The survey was published on 4 subreddit pages at reddit.com: r/Granblue_en, r/grandorder, r/arknights, and r/girlsfrontline (accessed on 12 July 2023). Only members of these subreddits were examined, meaning that probably everyone is actively playing at least one Gacha game. It was published in the first half of September at 11:30 p.m., at the time when game subreddits are most active, and the survey remained open for 48 h. After those 2 days, there were enough participants to conduct the study.
4. Study Results
4.1. General Data Analysis
A total of 713 participants took part in the study. From the total number, 589 (82.6%) were male, 80 (11.2%) female, 26 (3.6%) “other”, and 18 (2.5%) did not want to state their gender.
Most participants were in their twenties. Only 74 participants (10.4%) were under 18 years old, 232 (32.5%) were between 18 and 20 years old, 177 (24.8%) were between 22 and 25 years old, 135 (18.9%) were between 26 and 29 years old, and 68 (9.5%) participants were between 30 and 33 years old. A quarter of participants were people older than 33: 14 (2%) participants were between 34 and 36 years old, 8 (1.1%) between 37 and 39 years old, 2 (0.3%) between 40 and 42 years old, 1 participant (0.1%) between 43 and 45 years old, and 1 (0.1%) participant was over 50 years old.
Regarding employment status, 206 (28.9%) participants were full-time employed, 81 (11.4%) worked part-time, 77 (10.8%) were unemployed, 327 (45.9%) were students, and 22 (3.1%) participants did not want to state their working status.
The participants’ average annual income was also a part of the survey. It is important to note that the currency used was US dollars. More than a third of participants, 269 (37.7%) earned below USD 6.500 per year. This included the unemployed, some students, and low-income earners. One-tenth of the participants, 66 (9.3%), earned between USD 6500 and USD 13,000 per year, 103 (14.4%) earned between USD 13,000 and USD 40,000, 53 (7.4%) earned between USD 40,000 and USD 65,000 per year, and 34 (4.8%) had an even higher income between USD 65,000 and USD 90,000. Only 5 people (0.7%) earned between USD 90,000 and USD 100,000 per year, and only 15 respondents had the highest annual salary of over USD 100,000. Almost a quarter of participants, 168 (23.6%), did not want to state their income.
From the total of 713 participants, 4 (0.6%) stated they did not attend school. There were 36 (5%) participants who only completed primary school education. Almost half of the participants, 350 (49.1%), graduated from high school, 250 (35.1%) completed some form of higher education, 38 (5.3%) completed postgraduate studies, and 35 (4.9%) did not want to answer this question.
4.2. Gaming Habits
When asked about playing Gacha games, 710 (99.6%) participants currently play at least one Gacha game, while 3 (0.4%) participants used to play Gacha games but no longer do.
The following question asked all the participants to mark all the Gacha games they play or have played. The participants were offered 29 Gacha games popular in recent years. Each game was played at least once, proving that each game was appropriate for the survey. Among the most popular games are Arknights with 382 players (53.6% of participants), Fate/Grand Order with 362 players (50.8% of participants), Genshin Impact with 354 players (49.6% of participants), and Granblue Fantasy with 242 players (33.9% of participants). Three games had a reasonably high percentage because the survey was published on appropriate subreddits for the mentioned game players. The fourth game, Genshin Impact, is a game played by almost half of the participants, which is a sign of its enormous popularity.
In the next question, participants had to estimate how many months they spent playing the Gacha game of their choice. Month periods were chosen because weeks are too short, and years would give too many answers.
The participants had to choose from the offered answers how many Gacha games they played on average per day. There were 73 (10.2%) participants who played less than one hour per day, 273 (38.3%) participants played between 1 and 2 h per day, 193 (27.1%) participants played 2 to 3 h per day, 85 (11.9%) participants played 3 up to 4 h per day, 36 (5%) participants played 4 to 5 h per day, and 53 (7.4%) participants spent more than 5 h per day playing Gacha games.
In the following question, the participants could mention their favorite aspect of Gacha games. They could reply in as many words as they liked, but most of the 654 answers were one of the following:
- Story—175 (26.7%) responses
- Characters—248 (37.9%) responses
- Gameplay—88 (13.4%) responses
- Collecting—82 (12.5%) responses
Other more frequent answers were “art” regarding the looks of the game, the characters, “music”, and “games are time-consuming”.
4.3. Spending
The participants had a simple Yes/No choice for the following three questions. The first question was answered if they thought they had a gambling problem. The majority (654 votes or 91.7%) answered “No”, while 51 (7.2%) participants answered “Yes”. There was a third option given for this question “I do not want give and answer”, which was chosen by only eight (1.1% of participants).
The second question was about a stable income: 408 (57.2% of participants) answered “Yes”, and 305 (42.8% of participants) answered “No”.
The third question is important because it asks the participants whether they have ever spent their money on Gacha games. Most (572 participants or 80.2%) answered “Yes”, and 141 (19.8%) answered “No”.
The following question was based on the Likert scale. The answer 1 meant “bad”, while 10 meant “good”. The question “How did you feel when you spent the money?” was given 5 (18.5%), 6 (17.5%), 7 (19.5%), or 8 (15.6%) by the majority, making this experience mostly positive (71.1%).
The question that followed was again an open-ended question, and it examined the reasons participants spent money on the game. There was a total of 612 answers that can be put in the following categories:
- To unlock a character/weapon—476 answers (77.7%)
- To unlock skin (change the appearance of a character)—241 answers (39.3%)
- To make progress faster—126 answers (20.5%)
- To gain a competitive advantage—36 answers (5.8%)
- Other—120 (19.6%), most of which were either “I wanted to support game developers” or “I didn’t spend money”
4.4. Details on Spending
A further question was based again on the Likert scale. The question was “How likely are you to spend money on these games again?”: 1 was “most likely not” and 10 “most likely yes”. From 713 answers, a clear determination could be seen. The highest percentages were either 1 (94 answers or 13.2%) or 10 (176 answers or 24.7%). The rest of the answers were fairly equally divided among other options.
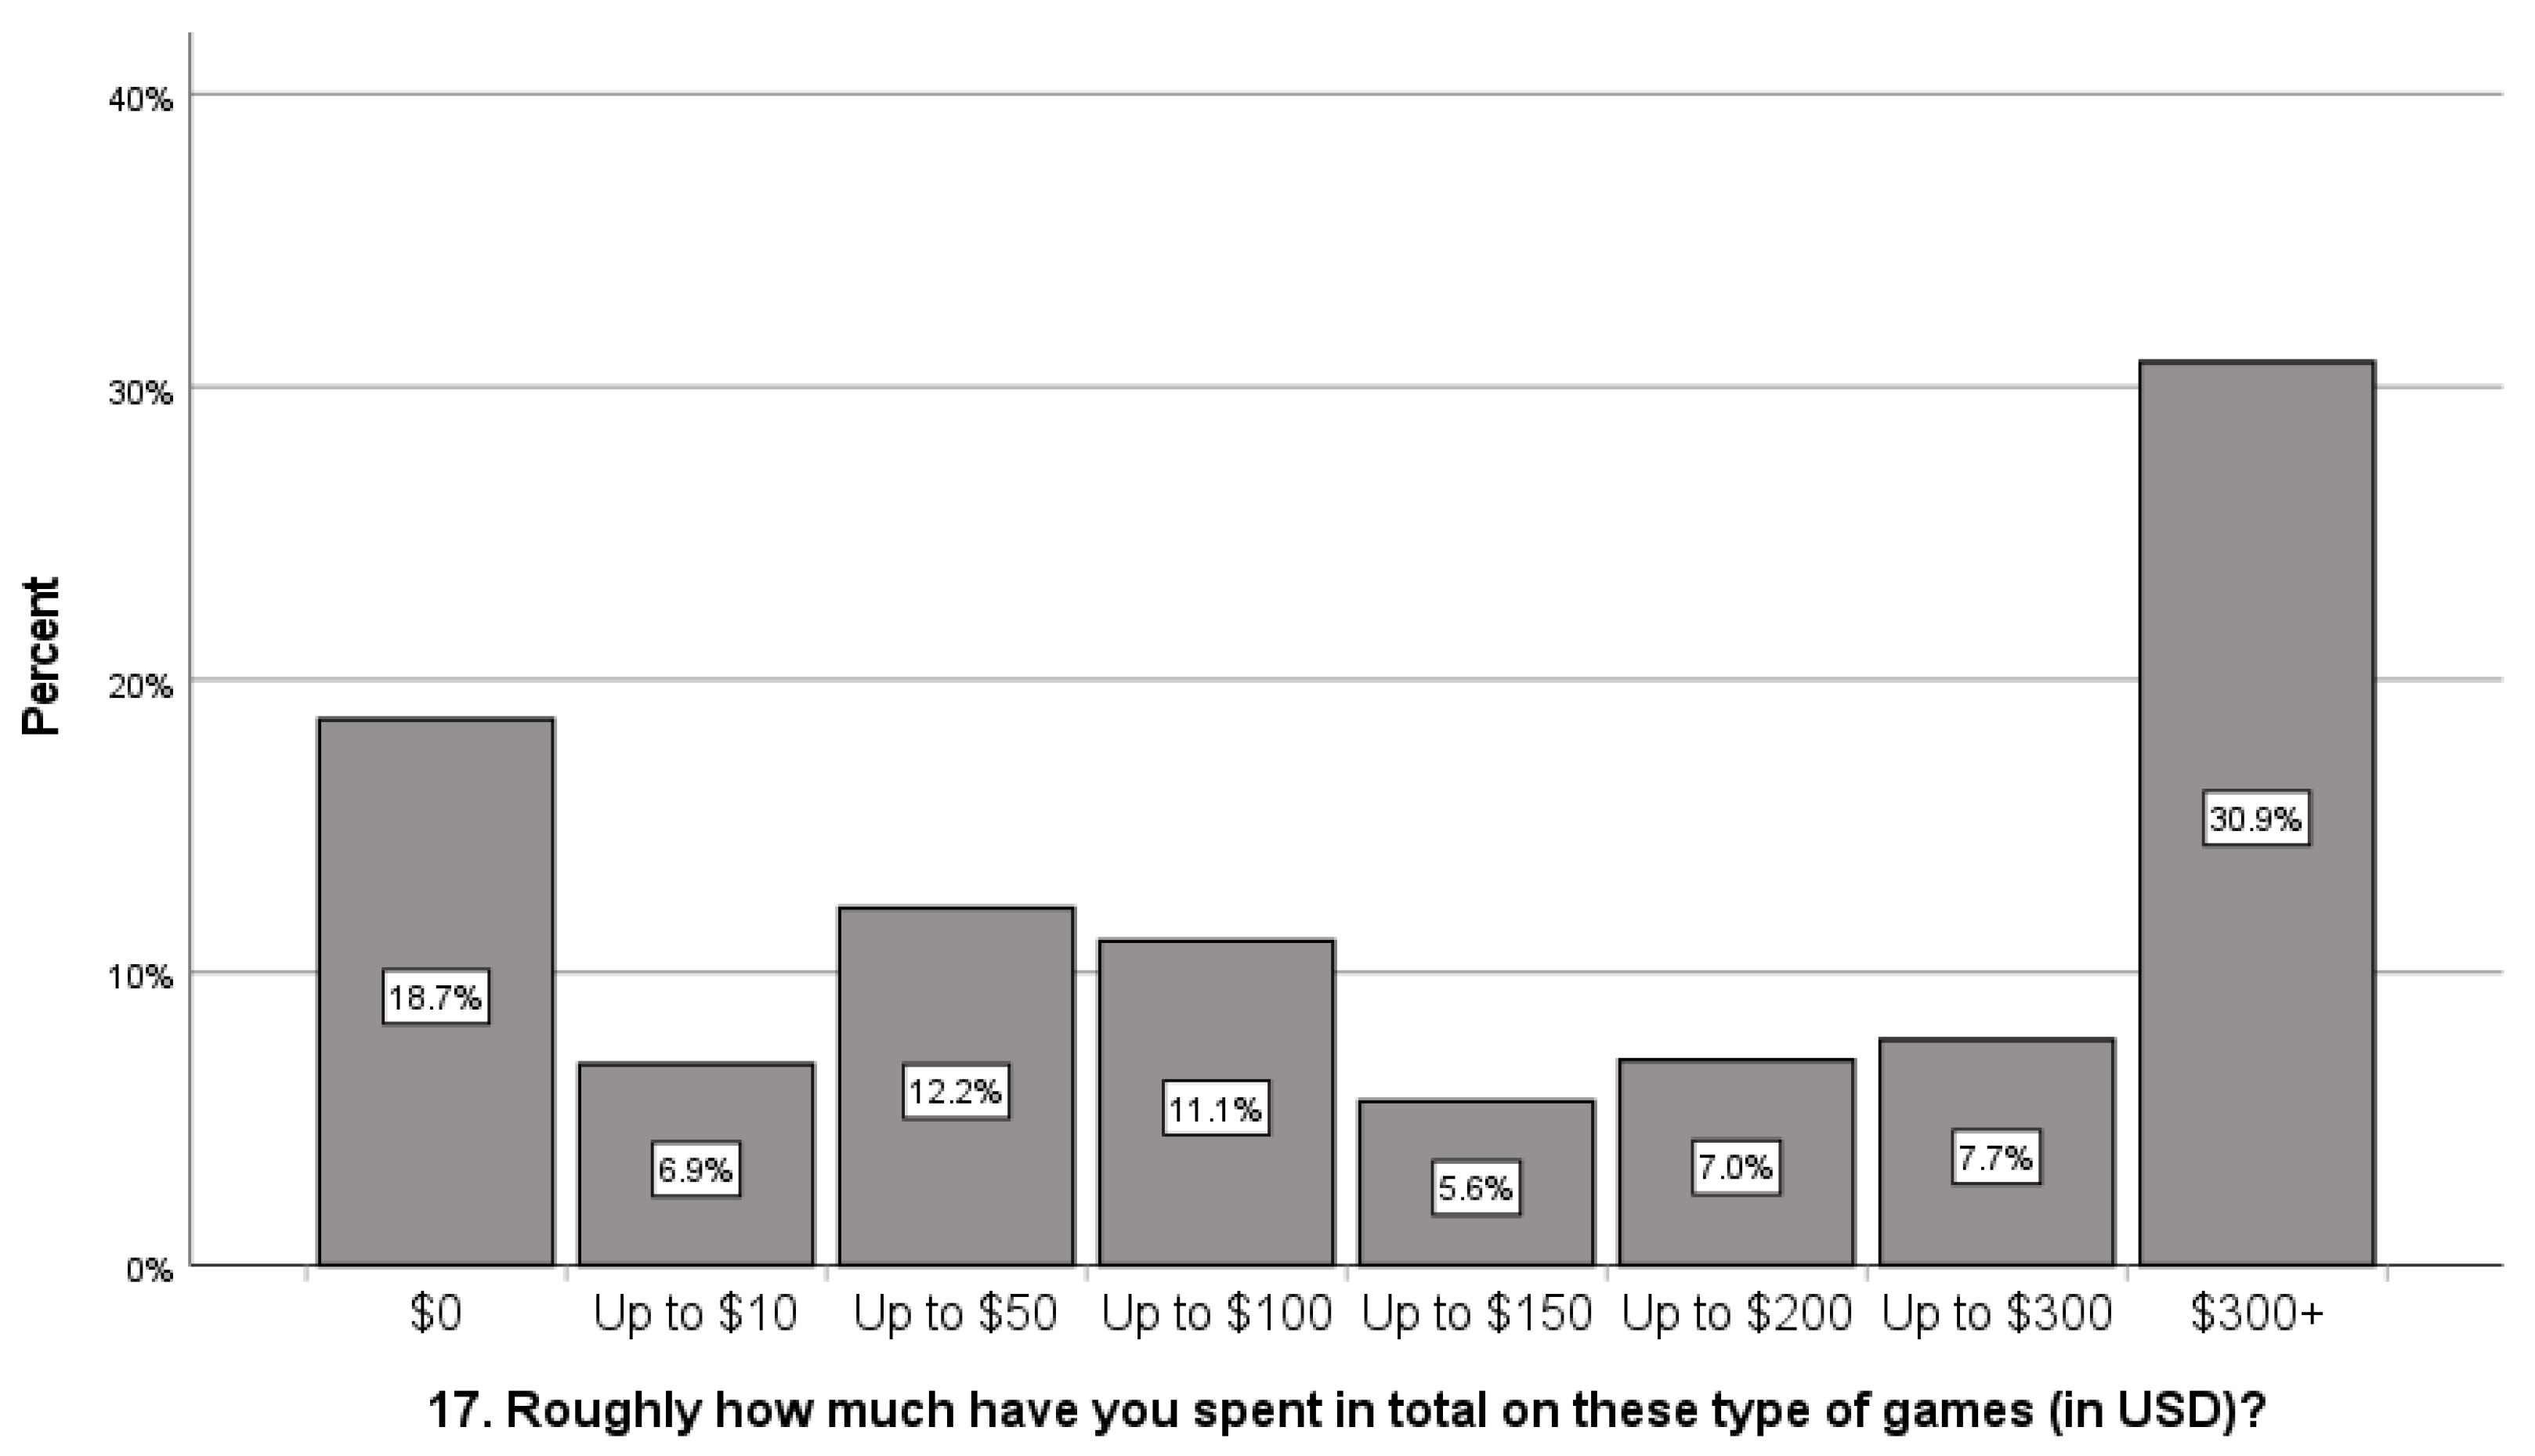
There were two questions on spending. The first question was regarding the total amount of money the participants spent on Gacha games (in US dollars). Only 133 (18.7%) participants stated they spent no money. It can be noticed this percentage is 1.1% lower for the people whose answer to the previous question was that they had never spent money on Gacha games. Furthermore, 49 (6.9%) participants spent up to USD 10 on Gacha games, 87 (12.2%) participants spent up to USD 50 on Gacha games, 79 (11.1%) participants spent up to USD 100 on Gacha games, 40 (5.6%) participants spent up to USD 150 on Gacha games, 50 (7%) participants spent up to USD 200 on Gacha games, 55 (7.7%) participants spent up to USD 300 on Gacha games, and 220 (30.9%) participants spent over USD 300 on Gacha games.
The second question (shown in Figure 1) was regarding the total amount of money the participants spent on Gacha games per session (in US dollars). Again, there is less unreliable information because 146 (20.5%) participants claimed that they had never spent money on Gacha games. However, 139 (19.5%) participants spent up to USD 10 per session, 179 (25.1%) participants spent up to USD 50 per round, 84 (11.8%) participants spent up to USD 100 per session, 26 (3.6%) participants spent up to USD 150 per session, 41 (5.8%) participants spent up to USD 200 per session, 28 (3.9%) participants spent up to USD 300 per session, and 70 (9.8%) participants spent over USD 300 per session.
In the following question, the participants had to mark the statement they agreed with. The statements were as follows:
- “I never spend money on Gacha games.”—123 (17.1%)
- “I don’t mind occasionally spending the money on Gacha games (few times per year).”—379 (53.2%), half of all the votes
- “I don’t mind spending money on Gacha games every month.”—179 (25.1%)
- “I don’t mind spending money on Gacha games every week.”—15 (2.1%)
- “I don’t mind spending money on Gacha games every day.”—0 (0%)
- Other…—17 (2.5%)
The next question was about what the game did to make the participant give in and spend money on the game. If they spent no money, participants had to indicate what nearly led them to spend the money. The options were as follows:
- Currency in the game feels less like spending real-world money—36 (5%)
- Currency is not expensive for small one-time purchases—111 (15.5%)
- Purchasing the biggest currency packages will give me more value for money (profitability)—101 (14.1%)
- Feeling the need to spend in order to make progress in the game—32 (4.4%)
- Limited time for a character/weapon/item—384 (53.8%)
- Increased chance of winning a character/weapon/item—145 (20.3%)
- It was easy to buy the currency, with just a few clicks—54 (7.5%)
- Need for a stronger character/weapon/item—187 (26.2%)
- Need for energy (stamina, many games use it to limit play time)—26 (3.6%)
- Gaining competitive advantage—40 (5.6%)
- Profile adjustment, cosmetics, clothing, in-game furniture—99 (13.8%)
- Discount on in-game currency—150 (21%)
- Purchasing with friends or the community—43 (6%)
- Other… (mostly to support game developers or not to spend money)—47 (6.5%)
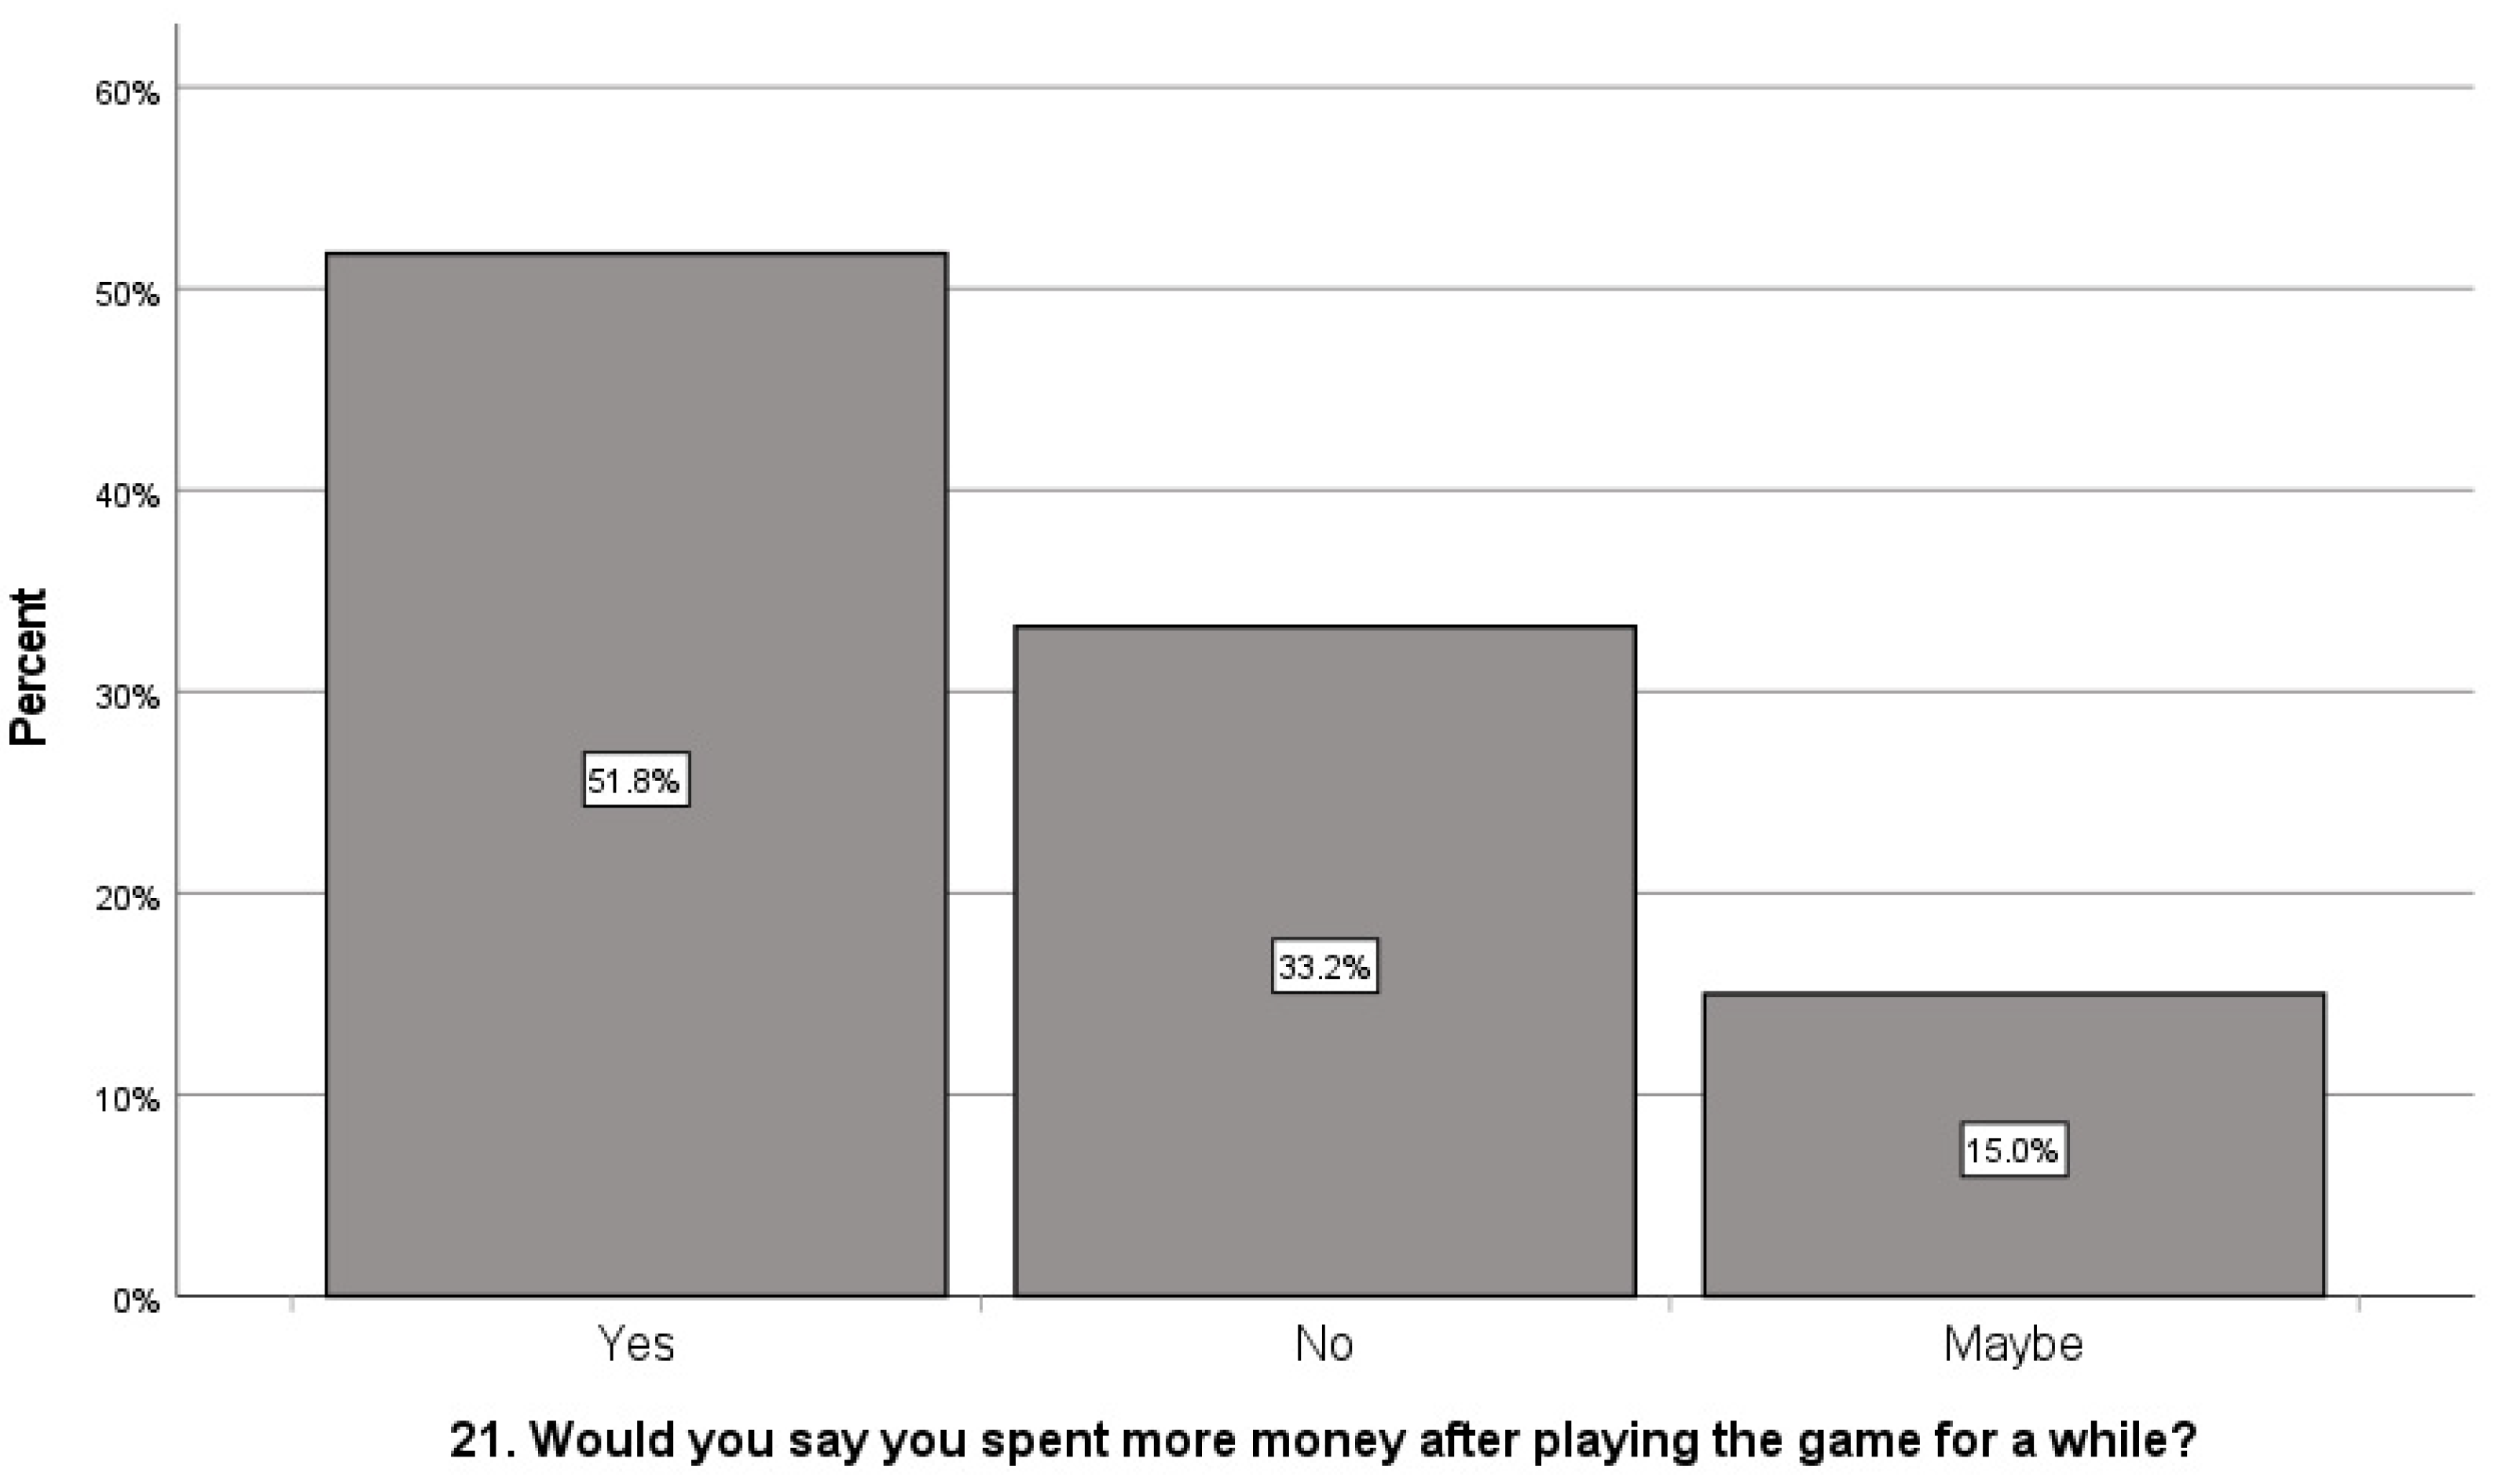
This was followed by a simple Yes/No/Maybe question, where participants were asked if they would say they spent more money after playing the game for a while; 369 (51.8%) said “Yes”, 237 (33.2%) said “No”, and 107 (15%) participants said “Maybe”.
The penultimate question was again based on the Likert scale, where 1 meant “most likely no” and 10 “most likely yes”. The result shown in Figure 2. tended towards “most likely yes”; 297 (41.7%) participants chose that answer. There were 74 (10.4%), 153 (21.5%), and 125 (17.5%) participants who voted for 7, 8, and 9.
The last question type was again a simple Yes/No/Maybe question and examines whether participants felt addicted to Gacha games. According to the result, 111 (15.6%) participants thought they were addicted, 398 (55.8%) participants thought they were not addicted, and 204 (28.6%) participants thought they might be addicted to Gacha games.
5. Interpretation of the Results
By completing the analysis of individual items in the survey, the results of the survey could be interpreted as shown in Figure 3. A total of 713 participants took part in the survey, out of which 82.6% were male. Most participants were in their twenties, a third were employed, and almost half were students. More than a third of participants earned less than USD 6500 a year, and a quarter did not want to answer this question. According to the correlation graph, it can be concluded that these were students who did not have their own source of income but depended on their parents.
Half of all the participants had a high school degree, and 710 respondents played Gacha games. Most participants have been playing Gacha games for the last 3 or 4 years. Most played the game 1 to 2 h per day. Most participants mentioned storytelling, characters, gameplay, and collecting a various item as their main aspect of Gacha games. Almost none of the participants thought they had a game addiction. Around half of the participants did not have a regular income, but most did. Only 80.2% participants spent their own money on Gacha games and did not regret making this transaction. When asked what they spent their money on, 476 participants said they wanted to unlock a new character or weapon. It was easy to make that conclusion as most Gacha games have the concept of game character drawing. A quarter of participants were very likely to spend money on Gacha games again, and 60.5% of participants marked this question with more than 6 on the Likert scale from 1 to 10, which can be considered a positive answer. Nearly a third of participants spent more than USD 300 on Gacha games in total; a third of those spent the money at once. Most participants say that they did not mind spending money on Gacha games occasionally (a couple of times a year). More than half of the participants (53.8%) spent money because they wanted a character or weapon that was available for a limited time. One-fifth of participants bought in-game currencies when they were on a special discount, such as a one-month purchase discount. Half of the participants agreed with the statement which said they spent more money after playing the game for a longer time. Almost all the participants were likely to continue playing Gacha games, although more than half of them did not think they were addicted.
5.1. Hypothesis 1
Hypothesis 1 re-examined if players who play Gacha games for a longer time period spent more money than players who have just started playing. The survey asked questions about income (Question 4), overall length of playing (Question 8), average length of daily playing (Question 9), spending money in general (Question 13), repeated spending (Question 16), and participants’ spending (Questions 17 and 18). The answers to these questions showed the correlation of the results, as can be seen from the graphs shown below. Figure 4 shows the correlation of the answers to Questions 17 (“Roughly how much have you spent in total on these type of games (in USD)?”) and 8 (“Roughly how many months have you/did you play these game(s)?”). By taking a look at the columns, it can be seen that most participants who played the game for up to 12 months spent a total of USD 0 to USD 50. When looking at medium lengths of playing (2 to 3 years), it can be noticed that these participants had a tendency towards medium/higher consumption. Participants who have been playing the game for more than 4 years show a drastic tendency for higher spending.
It can be noticed that none of the participants playing the game less than a year did not spend more than USD 300. The hypothesis could be further confirmed using a graph (Figure 5), which compares the statements of participants from Question 21 (“Would you say you spent more money after playing the game for a while?”) and the already mentioned Question 8. From the majority who stated that they spent more money after they have played the game for a longer time, the number of statements grew over years to participants who have been playing for more than 5 years. This can be explained by the smaller number of participants who played the game for 5 years, which, of course, leads to fewer “Yes” votes. The hypothesis was confirmed. However, it is necessary to take into account the inconsistency of some answers, such as the different results for Questions 13, 17, and 18 (depending on the answer, 18.7% or 20%).
5.2. Hypothesis 2
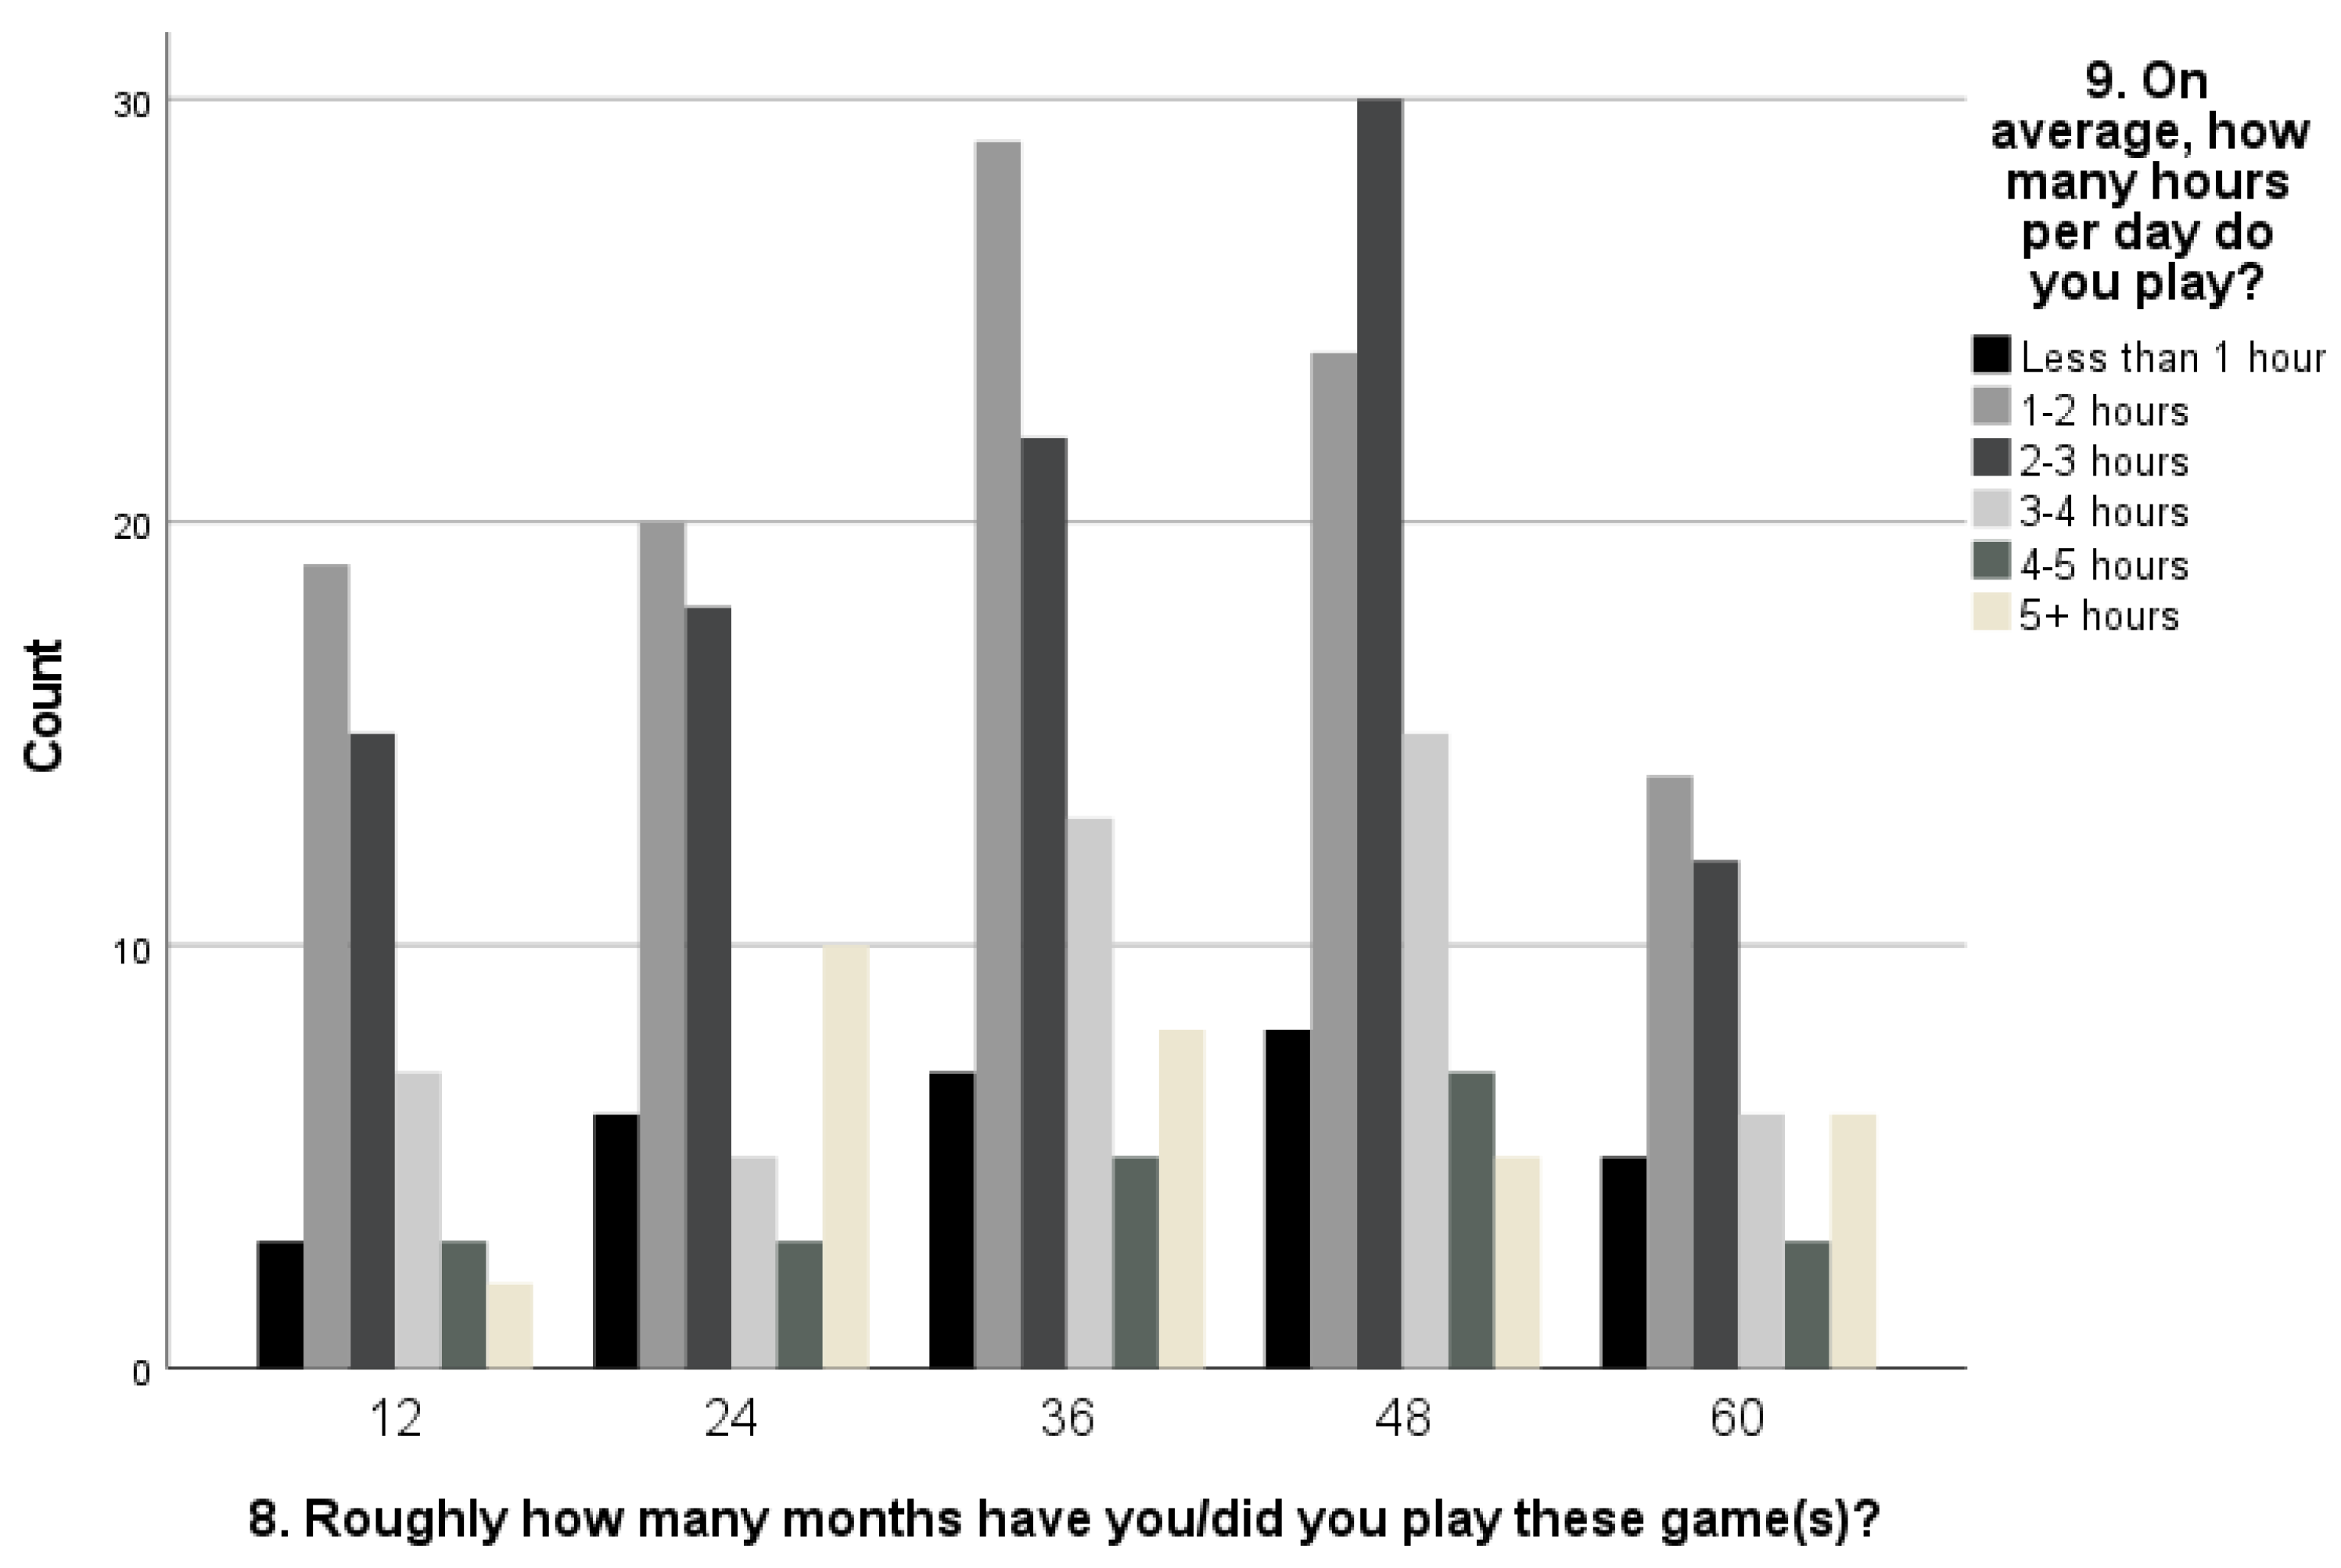
Hypothesis 2 re-examined if players played the game more if it presented a new experience for them (as shown in Figure 6). In other words, it examined if players spent less time playing a game after having played it for a longer time. In order to prove this hypothesis, a cross-section of answers could be taken to Questions 8 (“Roughly how many months have you/did you play these game(s)?”) and 9 (“On average, how many hours per day do you play?”) (as shown in Figure 7). The following graphs, which show the same correlation, indicate that there is an equal number of people in both categories of people: those who play less than an hour and those who play 4 to 5 h a day. The difference could be seen in groups that play from 1 to 2 h and those that play from 2 to 3 h a day (groups that together have 65.4% of participants). The participants in these groups have been playing for more hours a day. That number increased with the number of years they have spent playing Gacha games (up to 5 years, but, as already mentioned, the number of players decreased after that period). Even most participants who played more than 5 h a day are put in the group that has been playing the game for 2 to 3 years.
Figure 8 shows the ratio of answers to Questions 9 (“On average, how many hours per day do you play”) and 3 (“What is your current employment status?”). It can be seen from the correlation of answers to the posed questions that most players who played the game for several hours daily are students. They make up almost half of the participants. However, if students were removed from the graph, the result would remain the same. It is possible that a larger group of participants would have given a different result, but with the current data, the hypothesis was rejected. Participants mostly played for several years after starting to play. The average amount of daily playing time started decreasing only after 5 years of playing the game.
6. Discussion and Conclusions
Internet addiction refers to the excessive and compulsive use of the Internet, which leads to negative consequences in various aspects of a person’s life, including social, occupational, and psychological functioning. Addictive gambling, also known as gambling addiction or pathological gambling, is a condition characterized by an uncontrollable urge to gamble despite the negative consequences it may have on a person’s life.
Both Internet addiction and addictive gambling can have significant psycho-social and affective consequences for individuals, particularly when related to video games. Excessive Internet use, including online gaming, can lead to social isolation, impaired relationships, and decreased productivity in academic or professional settings. It can also contribute to feelings of anxiety, depression, loneliness, and low self-esteem. Addictive gambling, when associated with video games that incorporate gambling-like mechanics, such as loot boxes or virtual currency, can lead to financial problems, debt, and legal issues. The constant pursuit of rewards and the thrill of winning can create a cycle of compulsion and reward-seeking behaviors, further exacerbating the addiction. The psycho-social consequences may include strained relationships, loss of trust, and a negative impact on one’s overall well-being.
Overall, Internet addiction and addictive gambling related to video games can have detrimental effects on individuals’ mental health, social interactions, and overall quality of life. It is essential to recognize and address these issues to promote healthier gaming habits and provide support for those affected by these addictive behaviors.
Gacha games are one of the most successful branches in the mobile game industry. They were created in 2011, and almost all the games are free to play. What makes Gacha games recognizable is the Gacha draw system that works on the principle of a raffle or lottery. A player uses currency to draw new characters or weapons, and if there is not enough currency, the player can buy it with real-world money. Gacha games came to the very top of mobile games, both in popularity and earnings. In 2016, the CESA committee asked its members to make the probability of drawing each character public. This rule is respected and followed by every Gacha game today. Different studies from previous years indicate that the purchase of loot boxes is potentially related to problem gambling and problem video gaming. Many studies recommend that the sale of loot boxes, which is also a type of Gacha draw, should be banned for minors because it represents a type of gambling. Studies also show that more people open loot boxes if prizes can be sold, that parental attachment has no significant impact on gambling addiction, and that depression, anxiety, and loneliness increase Internet addiction. While a player may regret spending money on a game, the continuous fun that the game provides can compensate for negative and skeptical emotions.
Gacha games leverage players’ emotions, such as luck, satisfaction, and insecurity, to create addiction and encourage continued play. These games exploit dopamine release and offer easy accessibility to players of all ages, leading to potential vulnerability. Microtransactions within the games further facilitate gameplay and increase spending. Research suggests that average players are in their 20s, may feel lonely, and exhibit emotional vulnerability. However, these studies have limitations, and further research is needed to fully understand the impact of emotions on player behavior in Gacha games.
This study was based on the assumption that players who played the game for a longer time period spent more money on draws than new players on average spent. The assumption was also that players spent most time a day playing Gacha games when they played a new game. This study showed that most participants did not consider themselves addicted to gambling, although most of them spent money on Gacha games and a tenth of them spent more than USD 300 at once. Half of the participants did not consider themselves addicted to Gacha games. The study confirmed that players who played the game for a while also spent more on it. The assumption that players spend the most time on a new game proved incorrect. Participants spent more time a day playing games after they got into the playing habit.
The limitations of this study should be taken into consideration to provide a more comprehensive understanding for readers. Firstly, the sample size of the survey was relatively small, with a total of 713 participants. This may not fully represent the diverse population of Gacha game players, and the results may not be generalizable to a larger population. Furthermore, the survey had a gender imbalance, with 82.6% of participants being male. This gender skew could influence the findings and limit the applicability of the results to a more balanced population. Additionally, the survey relied on self-reported data, which introduces the possibility of response bias. Participants may have provided inaccurate or incomplete information, either unintentionally or deliberately. The anonymous nature of the survey could further contribute to potential response bias, as participants may feel less accountable for their answers.
Moreover, the study focused on a specific demographic of participants, primarily individuals in their 20s, a third of whom were employed and half with a high school degree. This limited demographic representation may restrict the generalizability of the findings to a wider range of Gacha game players. Lastly, the study was based on assumptions, such as the relationship between the duration of gameplay and spending habits. While some assumptions were supported by the findings, it is important to recognize that these assumptions may not hold true in all cases or for different populations of players.
In summary, readers should interpret the study findings with caution, considering the limitations, such as the small sample size, gender imbalance, self-reported data, limited demographic representation, and reliance on assumptions. Further research with a more diverse and representative sample would be valuable to validate and expand upon these findings.
Gacha games are at the same time fun and dangerous because of the substantial investment of time and money they require. To enhance the design of Gacha games and promote responsible gameplay while minimizing the risk of addiction, several strategies can be implemented: (1) transparency and fairness: clearly communicate odds and pricing and prevent excessive duplicates; (2) limit spending: set in-game spending limits and provide alternate ways to earn currency; (3) balanced rewards: design systems that offer satisfying progression for all players; (4) time-limited mechanics: introduce time-limited events to encourage regular play without excess; (5) player support: offer resources on responsible gaming and provide contact information for support; (6) social features: foster community engagement to reduce excessive play; (7) personalization: allow customization for player enjoyment beyond Gacha draws; and (8) regular assessments: continuously evaluate gameplay patterns and seek player feedback.
It is important for game developers to prioritize player well-being and continuously evaluate the impact of their design choices on players’ mental and financial health. By implementing these strategies, developers can create a more responsible and enjoyable gaming experience in the world of Gacha games.
Future work could involve expanding the scope of research by comparing Gacha game players with those engaged in other types of games or examining the behavior of Gacha game players in various geographical or cultural contexts.
Potential trajectories for future investigations include exploring the long-term effects of Gacha games on mental health and well-being. Another direction is studying the design elements that contribute to addictive behaviors in these games, with a focus on understanding how certain features and mechanics impact player engagement. Additionally, assessing interventions for preventing and treating Gacha game addiction can provide valuable insights into effective strategies for supporting players. Investigating cross-cultural influences on Gacha game behavior can shed light on the cultural factors that shape player experiences and preferences. Furthermore, examining the ethical implications of these games and consumer protection measures can help ensure player safety and fair practices. Analyzing the economic impact and regulatory measures for Gacha games is crucial for understanding their broader societal implications. Exploring alternative monetization models for mobile games can offer new approaches to balance revenue generation with player satisfaction. Additionally, studying the role of parental guidance in preventing Gacha game addiction can provide guidance for parents and caregivers. Assessing industry-wide standards for Gacha game design and promoting responsible game development practices can contribute to a healthier gaming ecosystem. Finally, conducting longitudinal studies on Gacha game trends and prevention measures can provide a comprehensive understanding of the evolving landscape and guide future interventions.
Author Contributions
Conceptualization, N.L.; methodology, N.L.; formal analysis, N.L.; investigation, N.L.; writing—original draft preparation, N.L.; writing—review and editing, A.B. and A.Č.; supervision, A.B.; funding acquisition, A.B. All authors have read and agreed to the published version of the manuscript.
Funding
This research received no external funding.
Conflicts of Interest
The authors declare no conflict of interest.
References
- Kanerva, T.K. Cultures Combined: Japanese Gachas Are Sweeping F2P Mobile Games in the West. GameRefinery. Available online: https://www.gamerefinery.com/japanese-Gachas-sweeping-f2p-games-west/ (accessed on 12 July 2023).
- Koeder, M.J.; Tanaka, E. Game of chance elements in free-to-play mobile games. A freemium business model monetization tool in need of self-regulation? In Proceedings of the 28th European Regional Conference of the International Telecommunications Society (ITS): Competition and Regulation in the Information Age, Passau, Germany, 30 July–2 August 2017. [Google Scholar]
- Fan, K.K.; Jiang, S.Y. Discussion of the lottery mechanism for the profit model of the mobile game-taking cygames as an example. In Proceedings of the 2016 International Conference on Advanced Materials for Science and Engineering (ICAMSE), Tainan, Taiwan, 12–13 November 2016; pp. 96–98. [Google Scholar]
- Li, W.; Mills, D.; Nower, L. The relationship of loot box purchases to problem video gaming and problem gambling. Addict. Behav. 2019, 97, 27–34. [Google Scholar] [CrossRef] [PubMed]
- Brooks, G.A.; Clark, L. Associations between loot box use, problematic gaming and gambling, and gambling-related cognitions. Addict. Behav. 2019, 96, 26–34. [Google Scholar] [CrossRef] [PubMed]
- Drummond, A.; Sauer, J.D. Video game loot boxes are psychologically akin to gambling. Nat. Hum. Behav. 2018, 2, 530–532. [Google Scholar] [CrossRef] [PubMed]
- Lee, C.; Kim, O. Predictors of online game addiction among Korean adolescents. Addict. Res. Theory 2017, 25, 58–66. [Google Scholar] [CrossRef]
- Wang, J.L.; Sheng, J.R.; Wang, H.Z. The association between mobile game addiction and depression, social anxiety, and loneliness. Front. Public Health 2019, 7, 247. [Google Scholar] [CrossRef] [PubMed] [Green Version]
- Chamarro, A.; Oberst, U.; Cladellas, R.; Fuster, H. Effect of the frustration of psychological needs on addictive behaviors in mobile videogamers—The mediating role of use expectancies and time spent gaming. Int. J. Environ. Res. Public Health 2020, 17, 6429. [Google Scholar] [CrossRef] [PubMed]
- Zendle, D.; Cairns, P. Loot boxes are again linked to problem gambling: Results of a replication study. PLoS ONE 2019, 14, e0213194. [Google Scholar] [CrossRef] [PubMed] [Green Version]
- Kim, S. Psychological analysis on consumer sentiment for Gacha. J. Korea Game Soc. 2016, 16, 77–86. [Google Scholar] [CrossRef]
Figure 1.
Graphic representation of participants’ total spending on Gacha games (in US dollars).

Figure 2.
Graph overview of whether the participants think they have spent more money after playing for a longer time.
Figure 2.
Graph overview of whether the participants think they have spent more money after playing for a longer time.

Figure 3.
Correlation of current status and annual income.

Figure 4.
Correlation of total spending and total playing time.

Figure 5.
Correlation of whether the participants spent more after they have played a game for a while and over longer time periods.
Figure 5.
Correlation of whether the participants spent more after they have played a game for a while and over longer time periods.

Figure 6.
Correlation of total and daily playing time (1/2).

Figure 7.
Correlation between months played the game and hours of gameplay.

Figure 8.
Correlation of total and daily playing time (2/2).

Disclaimer/Publisher’s Note: The statements, opinions and data contained in all publications are solely those of the individual author(s) and contributor(s) and not of MDPI and/or the editor(s). MDPI and/or the editor(s) disclaim responsibility for any injury to people or property resulting from any ideas, methods, instructions or products referred to in the content. |
© 2023 by the authors. Licensee MDPI, Basel, Switzerland. This article is an open access article distributed under the terms and conditions of the Creative Commons Attribution (CC BY) license (https://creativecommons.org/licenses/by/4.0/).
Share and Cite
MDPI and ACS Style
Lakić, N.; Bernik, A.; Čep, A. Addiction and Spending in Gacha Games. Information 2023, 14, 399. https://doi.org/10.3390/info14070399
AMA Style
Lakić N, Bernik A, Čep A. Addiction and Spending in Gacha Games. Information. 2023; 14(7):399. https://doi.org/10.3390/info14070399
Chicago/Turabian StyleLakić, Nikola, Andrija Bernik, and Andrej Čep. 2023. "Addiction and Spending in Gacha Games" Information 14, no. 7: 399. https://doi.org/10.3390/info14070399
Note that from the first issue of 2016, this journal uses article numbers instead of page numbers. See further details here.