Article

Machinability of Titanium Grade 5 Alloy for Wire Electrical Discharge Machining Using a Hybrid Learning Algorithm

1
Department of Mechanical Engineering, School of Engineering, Mohan Babu University, Tirupati 517102, India
2
Department of Mechanical Engineering, Yeshwantrao Chavan College of Engineering, Nagpur 441110, India
3
Laxminarayan Intitute of Technology, Nagpur 440010, India
4
Department of Environmental Health, Harvard T H Chan School of Public Health, Boston, MA 02115, USA
5
Department of Pharmacology & Toxicology, R Ken Coit College of Pharmacy, The University of Arizona, Tucson, AZ 85721, USA
6
Amity School of Applied Sciences, Amity University Rajasthan, Jaipur 303002, India
7
Facultad de CienciasFisico—Matematicas, Benemérita Universidad Autónoma de Puebla, Col. San Manuel Ciudad Universitaria, Pueble Pue 72570, Mexico
8
Faubert Lab, Ecole D’optométrie, Université de Montréal, Montréal, QC H3T1P1, Canada
*
Authors to whom correspondence should be addressed.
Information 2023, 14(8), 439; https://doi.org/10.3390/info14080439
Submission received: 16 July 2023 / Revised: 28 July 2023 / Accepted: 28 July 2023 / Published: 3 August 2023
(This article belongs to the Special Issue Trends in Computational and Cognitive Engineering)

Abstract

:
Titanium alloys have found widespread use in aviation, automotive, and marine applications, which makes their implementation in mass production more challenging. Conventional methods of removing these alloy materials are unsuitable because of the high wear rate of cutting and slower rate of processing. The complexities of these materials have prompted the creation of cutting-edge machining methods. Wire Electrical Discharge Machining (WEDM) is a technique that has the potential to be useful for the removal of materials that are harder and electrically conductive. In order to create intricate designs, this method is frequently employed. The input factors, including pulse duration (on/off) and peak current, were taken into account during the experimental design process. The rate of material removal, surface roughness, dimensional deviation, and GD&T errors were opted for as performance indicators. The approach proposed by Taguchi was selected for the investigation of the process factors, and an Analysis of Variance was selected to find out the relative momentousness of each factor. From the analysis it is perceived that the applied current is the predominant factor that influences the chosen output characteristics. The aspiration of this article is to evolve a decision-making model based on a hybrid learning method which can be adopted to predict the selected output measures that affect the WEDM process. According to the findings, the value of the ANFIS-GRG, which was predicted to be 0.7777, was in fact closer to that value than any other value. The proposed model has the ability to help make a variety of different production processes more efficient. The analysis showed that the model’s functionality was enhanced, which helps producers make well-informed decisions.

1. Introduction

Titanium alloys are widely utilized because of their high-quality characteristics including corrosion resistance and high strength. These materials have unique properties that make them challenging to machine, which is exclusively performed with the assistance of orthodox approaches. Titanium is a popular choice for the fabrication of many types of highly precise parts adopted in automobile and aerospace usages. These components include connecting rods and turbine parts [1,2,3,4,5]. Extreme hardness and strength make titanium components difficult to machine. Further, they are unfit for use in some contexts because of their poor thermal conductivity. For optimal performance, it is necessary to adapt the machining procedure to the material’s unique characteristics. The process of WEDM is one example of these approaches [6,7].
In the manufacturing sector, WEDM is utilized widely to manufacture intricately formed parts [8,9]. In the first stage, the electrode wire is moved so that it is in close contact to the material, and the space between them is filled with the dielectric medium. Regardless of the hardness of the materials being removed, erosive action can be helpful in the workplace in terms of material removal. The complete outline of the WEDM method is depicted in Figure 1 [10].
Modern machining techniques, such as WEDM, are increasingly used for producing complex geometries for things like turbine blades and fuel injectors. This method is more efficient, precise, and effective than the alternatives [12,13] when it comes to removing difficult and electrically conductive materials. When working with electrically conductive work material, the notion of WEDM is frequently used to create complex geometries that would be impossible to produce using traditional machining procedures. Erosion from electrical sparks causes material to be removed due to the discharge of energy [14,15].
Previous studies used datasets for analysis and investigation and hypothesis testing with p-values to evaluate outcomes and evidence against null hypotheses. Design of Experiments (DoE) allowed systematic experimentation to optimize processes, enhance product quality, and understand variable interactions [16,17,18,19,20,21]. The concept of grey theory has been introduced and used in several engineering problems to deal with uncertainty and missing information in a process. This idea has been established as a productive approach for dealing with intricate matters in numerous types of machining [22,23,24]. While the GRA approach has many benefits, it is not always possible to conduct a thorough analysis of the output variables. Academics have found that by using the Grey fuzzy method in the WEDM procedure, they can improve its efficacy and precision [25,26,27,28,29].
The decision-making abilities of many instruments can be bolstered by the application of grey theory. Furthermore, this research has the potential to pave the way for the creation of smart platforms that can display performance characteristics graphically [30]. Manufacturers have benefited greatly from the usage of Artificial Neural Networks (ANNs) in the development of predictive models in order to foresee optimal performance [31,32]. The adoption of a wide range of network procedures has allowed for the evolution of effective efficient models that can forecast the expected performance metrics across a wide range of machining processes. The results of these models have been compared and analyzed, demonstrating the efficacy of their predictive abilities [33,34,35,36,37,38]. The advantages of both the fuzzy and neural approaches are combined in ANFIS, making it a powerful method for imagining the desired performance measures in a wide range of engineering applications [39,40,41].
With the help of available literature, the authors have identified that a few of the most momentous factors persuading the mechanical and quality behavior of a part are the geometrical dimension and tolerancing (GD&T) of a surface during the manufacturing process. An investigation into the significance of the machining process characteristics and their values requires a great deal of attention. Despite the promising future of the ANN-ANFIS approach, not enough research has been conducted on its potential use in optimizing process variables. This article will attempt to provide a summary of the multiple aspects of the WEDM process, such as the rate of material removal (MRR), surface roughness (SR), dimensional deviation (DD), and GD&T errors. These are all abbreviated as MRR, SR, DD, and GD&T, respectively. The experimental data are then used to build a hybrid learning model that can predict the performance metrics.

2. Materials and Methods

The experimental runs were performed with the aid of a WEDM setup (Concord Make-DK-7732, Concord United Products Pvt. Ltd., Banglore, India). In this demonstration, de-ionized was water used as the dielectric fluid alongside a reusable molybdenum wire. Titanium alloy (Ti-6Al-4V) was chosen as the work material. The unique properties of this material make it perfect for a wider range of uses, predominantly those that need resistance to corrosive environments, such as marine components, aircraft parts, aerospace parts, and medical implants. The work specimen was fixed on the inner side of the machining zone with the help of clamps, as shown in Figure 2.
Wire EDM has a steady and reliable cutting speed of about 18–20 inch/h when utilizing standard 0.010 wire. The WEDM machine has approximate cutting speeds in excess of 40 inches per hour when employing large-diameter coated wires. In this present investigation, the authors used 0.18 mm wire. The necessary size (10 × 10 mm) square can be cut in approximately 15 min. The feed rate ranges from 2.5 mm/min to 5 mm/min.
Taguchi’s DoE approach suggests an L27 Orthogonal Array (OA) for analyzing the effectiveness of independently chosen factors in accordance with the chosen process factors and levels. During the WEDM process, major output parameters like MRR, SR, DD, and GD&T errors are adopted to evaluate the performance of independent factors like pulse duration (Ton–s and Toff—s) and applied current. In order to determine the best conditions for the WEDM of Ti-6Al-4V, this study examines the many variables used in the WEDM process. Table 1 depicts the factors with the opted ranges and levels.
The MRR during WEDM was ascertained by the weight loss approach. A Mitutoyo SJ 410 was used to evaluate the roughness of the surface, and a CMM (Helmel Make) was engaged to evaluate variations in dimension, shape, and orientation tolerance errors. The experimental runs were devised and conducted as per L27 OA, and the collected data are currently being used for further investigation.

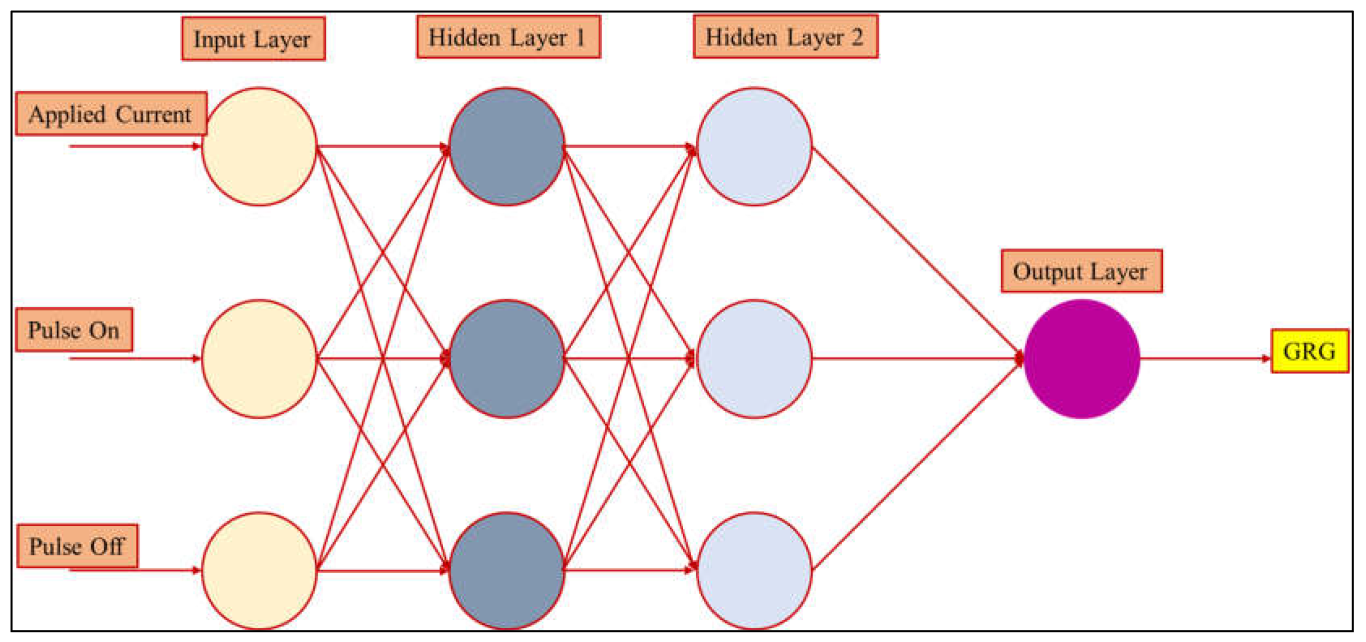
2.1. Development of Anticipated Neural Network Tools

Recent technological advances in engineering have made AI an essential tool for creating innovative methods and models. The precision of the controls is a major factor that scientists should think about when trying to optimize processes. Models using ANNs have been developed and studied by researchers to investigate a wide range of engineering issues. The convenience of making such a model is one of its primary benefits. The layers of a network model consist of three inputs and one output. Figure 3 depicts the evolved model’s structure.
A well-trained performance characteristic is necessary for accurately predicting the outcomes of the process. This article describes a method for using the LM algorithm to establish a foundation for future “FFBP” model training. Training makes use of both the learning function and experimental practice. Figure 4 illustrates the regression value for the model that was generated using the input data.

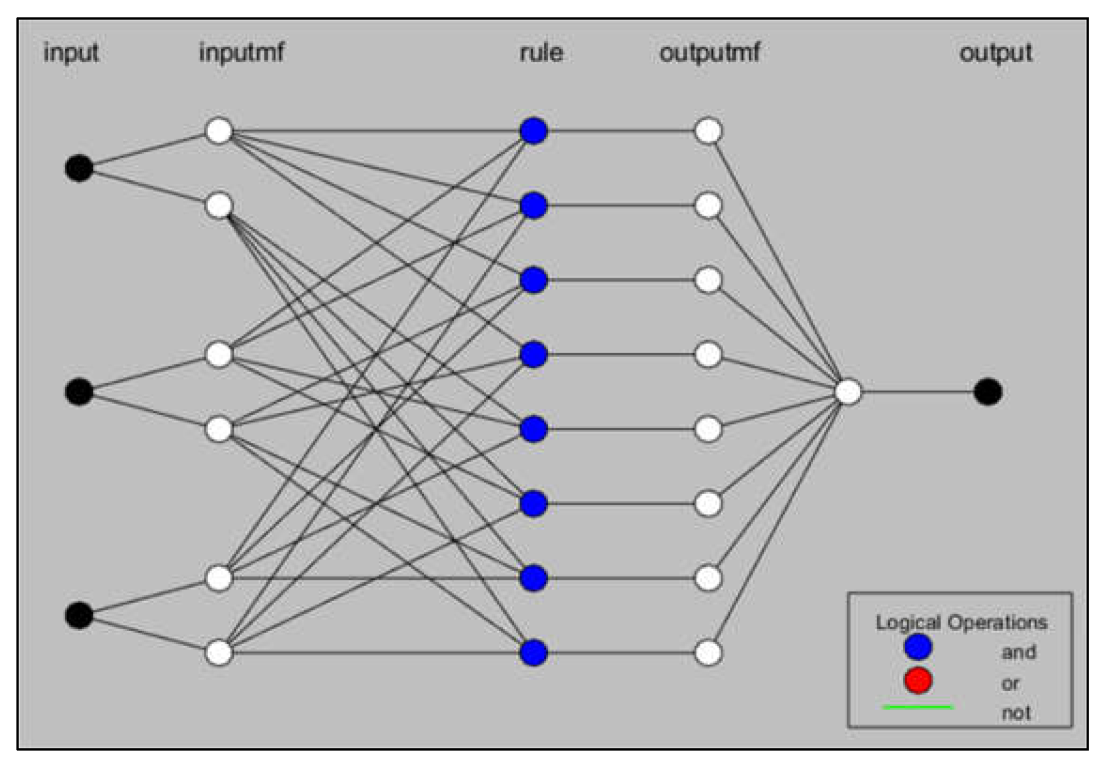
2.2. Evolution of Proposed ANFIS Tools

The aspiration of this investigational study is to evolve a prophetic tool (ANFIS) with the aid of a toolbox for predicting the Multi-Performance Index (MPI) based on three inputs and one output.
The ANFIS framework is produced by the “gaussmf” membership function, which develops rules automatically based on the data provided. The model has progressed with the aid of experimental data. This technique considers several features of a model and offers the essential inputs to efficiently evolve it. Figure 5 and Figure 6 depict the ANFIS architecture and rule viewer, correspondingly.

3. Results and Discussion

Through the use of ANOVA and the Taguchi-based grey method, this article elucidates the impact of a number of factors that have a momentous impact on the output of the WEDM process [11]. AI tools were developed for prediction and the performance of the models they use was analyzed in order to visualize the necessary performance factor.

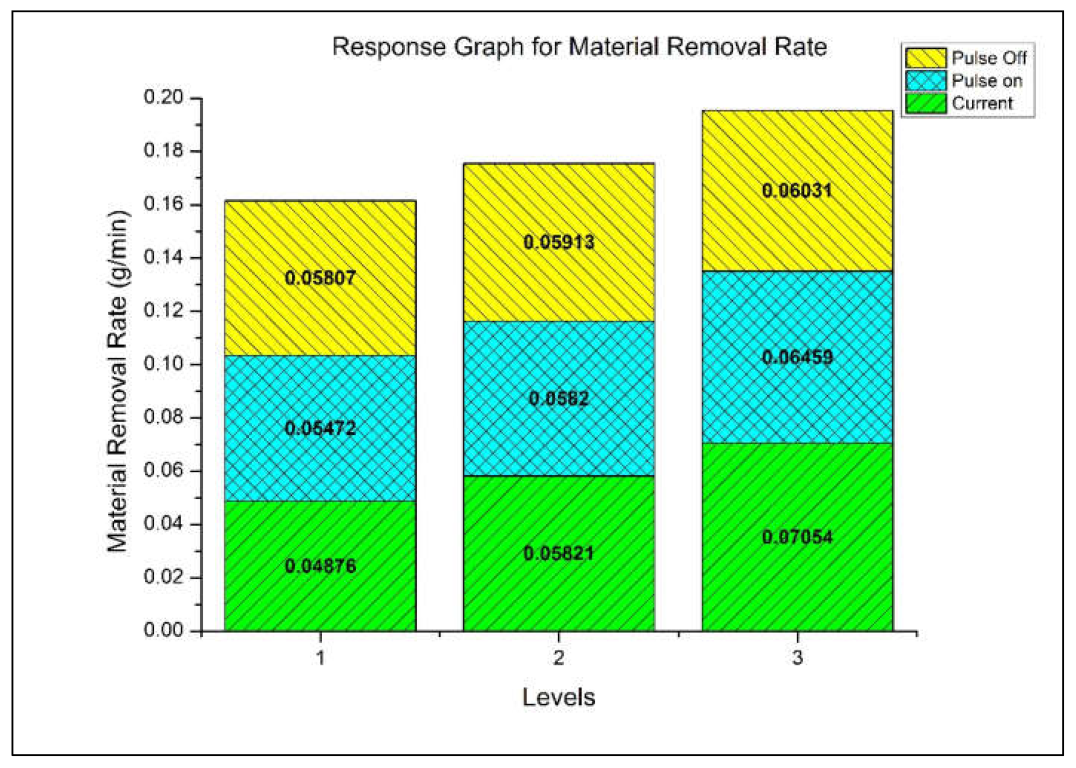
3.1. Determining the Optimal Variables for MRR

There is widespread agreement among experts that larger sizes provide greater potential for achieving an augmented MRR. A graph displaying the information obtained from the responses may be found in Figure 7. The graph makes it clear that there is a greater possibility for the removal of material when it is subjected to maximum amounts of applied current, denoted as “Ton” and “Toff.”
As a consequence of a larger energy pulse that was made feasible by a gradually intensifying current, an intensification in the MRR may be possible. As a direct result of this, the “Ton” can progressively increase, which ultimately results in an increased heat flux. This happens as a consequence of the plasma channel’s ability to expand, which makes it possible for the heat to reach the machining region.
The approach developed by Taguchi was advocated for use in determining which combinations of process variables were the most likely to result in an enhanced MRR. According to the findings, it would appear that the best settings to use in order to achieve the fastest rate of material removal are A3B3C3, with all of the parameters having their maximum values set. According to the findings, the applied current is the aspect that carries the most weight when it comes to determining the MRR.

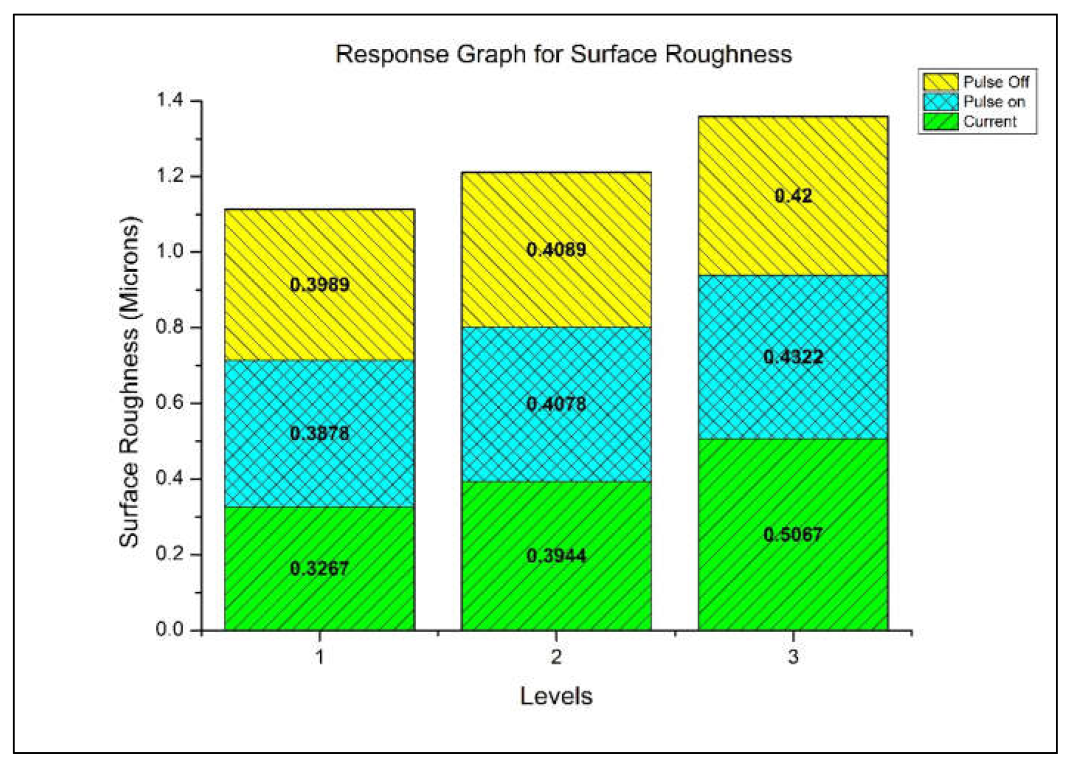
3.2. Determining the Optimal Conditions for Surface Roughness (SR)

The chosen criterion, the SR, is considered to fall inside the minimum better criteria of WEDM. The response plot indicates that an intensification in the supplied current, as well as “Ton” and “Toff”, can result in a rise in the SR. In addition, it has been discovered that raising the current might result in a decrease in the temperature of the surface. Figure 8 provides a visual depiction of the response plot.
Both the discharge produced by the machining operation and the molten metal present in the area have the potential to have an effect on the temperature of the surface. As a direct consequence of this, craters may appear, elevating the overall SR. The depth of these craters is another factor that may influence the total quality of the completed product. The energy that is exhibited during the explosions that occur throughout the machining process can have an effect on the temperature of the surface. It is also possible that the roughness will become worse when the energy pulse becomes higher.
It has been established that the combination of machining variables denoted by A1B1C1 is the optimal choice, with all of the parameters having their maximum values reduced to their minimums in order to achieve the smoothest surface possible. Research was conducted to determine how the applied current affects the surface temperature as well as the machining parameters. It is generally agreed that the current is the single most essential variable that has an extensive part in determining the SR.

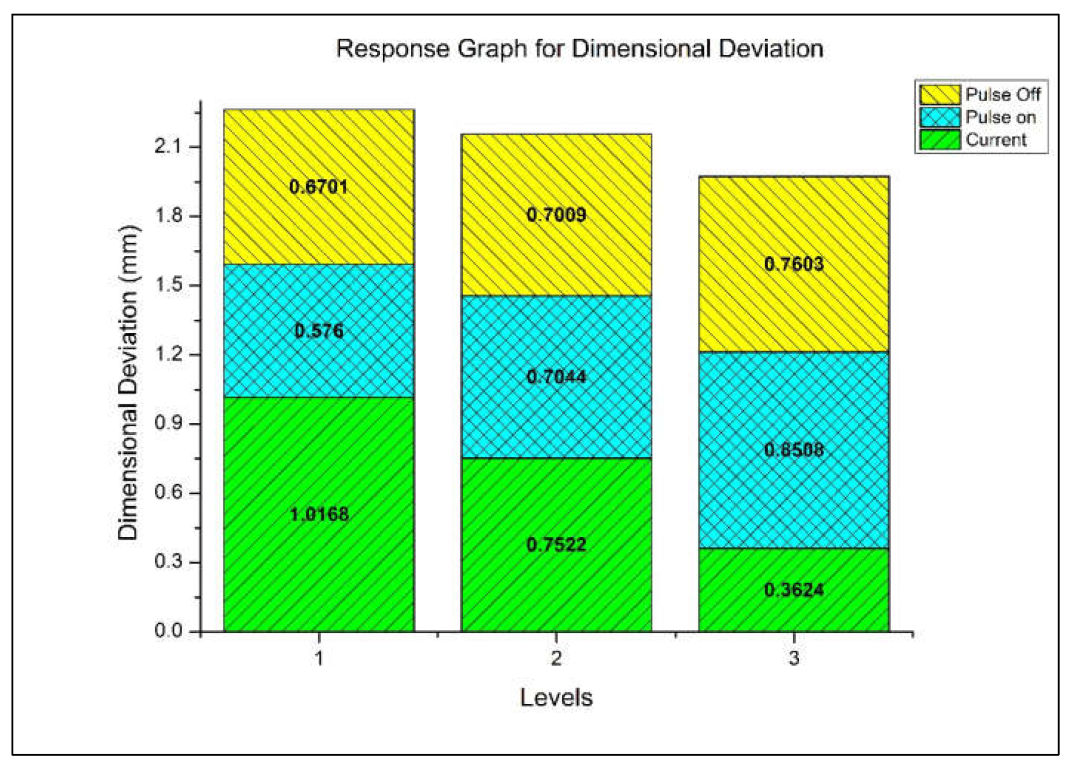
3.3. Determining the Optimal Factors for Dimensional Deviation

Within the framework of WEDM, the minimization criterion is applied is the dimensional deviation. The data of the dimensional deviation when plotted against higher and lower currents are shown. Secondary sparks have the potential to cause damage to the machined parts, as seen in Figure 9, if the debris is not carefully cleaned.
The length of the pulse raises the total amount of energy that is released, which can lead to the development of significant craters. It is also possible for debris to become wedged between the electrode and the specimen, which would result in a loss of dimension precision in the end part. It has been determined that the combination of materials that produces the best results in terms of dimensional consistency and accuracy is A3B1C1, which stands for current at the highest level and pulse duration at the lowest level. This combination was found to be ideal. The applied current is the one that plays the most significant role among all of the other process variables that are accountable for the total deviation from the target dimensions.

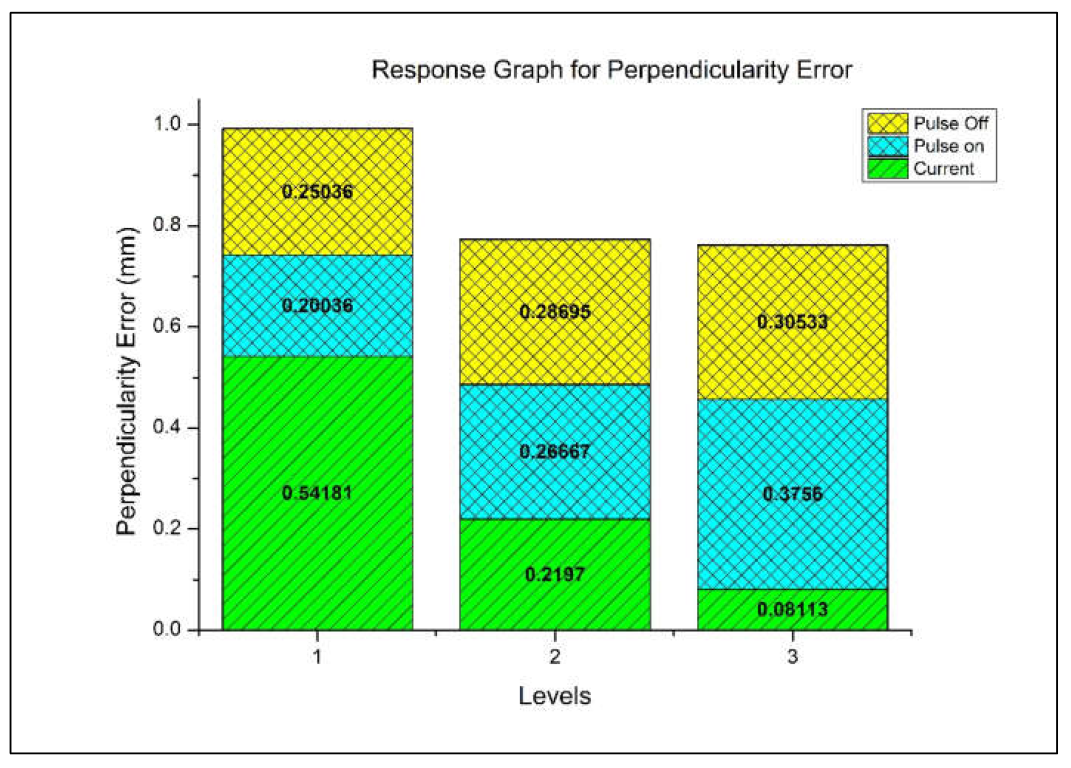
3.4. Determining the Optimal Factors for GD&T Errors

There has been a recent rise in the importance of squareness and orientation error tolerances as key performance criteria for modern manufacturing processes. Tolerance errors in shape and orientation caused by WEDM processing of titanium alloys are depicted in Figure 10 and Figure 11. The graphic presents a representation of the decline in the frequency of these errors. When there are increased values of the duration of the pulse and the current at which it is performed, there is a possibility that the holes produced will be inaccurate. This makes the process of eliminating materials go more quickly, which is another advantage of using it.
Errors in orientation and form tolerance can manifest themselves if debris is allowed to accumulate between the specimen and the electrode. According to the findings of the research, the ideal conditions for machining titanium alloys are A3B1C1 (a greater current with a lower pulse on/off). Taguchi performed a thorough review in order to cut down on the errors. Figure 10 and Figure 11 illustrate this procedure that was used.

3.5. ANOVA for Preferred Output Measures

The ANOVA is a method that may statistically explore the process variables of a dataset with a level of confidence of 95%. An ANOVA was carried out on the numerous factors that were utilized in the machining of the Ti6Al4V. The current appears to be the element that has the greatest impact on the outcome of the WEDM process [13], as indicated by the data in Table 2.

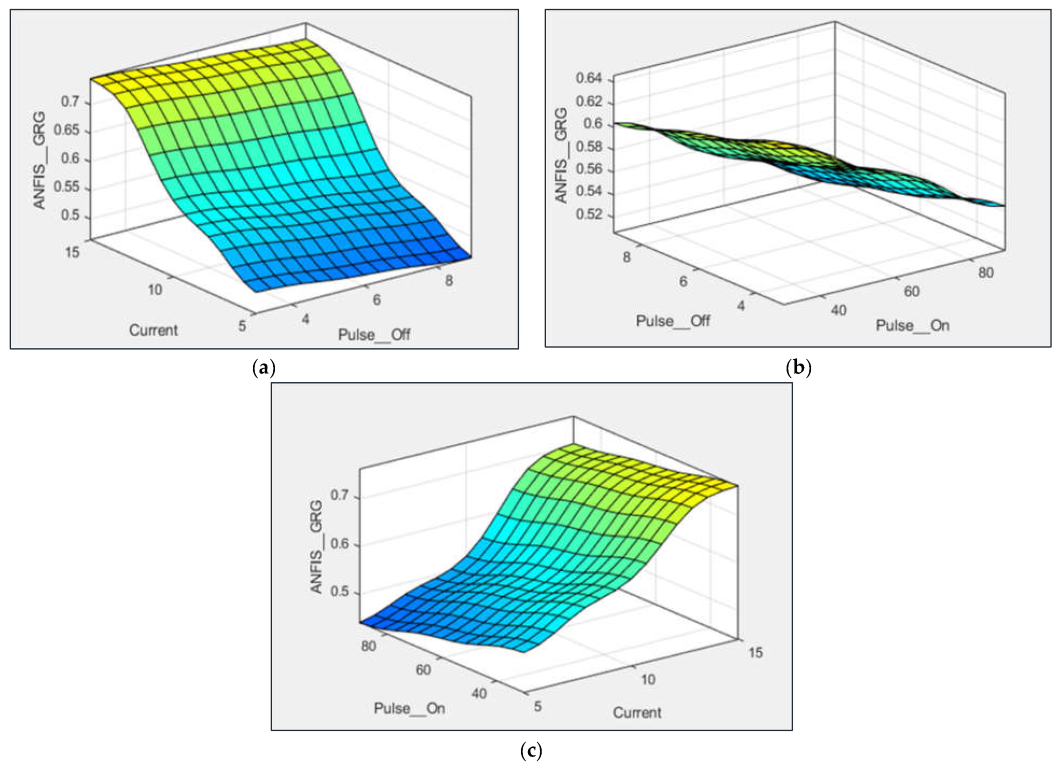
3.6. Interpretations on Evolution of ANFIS Models

Figure 12 portrays the influence of independent factors on the ANFIS-GRG considered in this investigational analysis. The illustrations show that combining maximum levels of current with lower levels of “Toff” produces better multi-performance measures during the WEDM of the titanium alloy (Grade 5).
Figure 13 shows that the ANFIS-GRG also increases with amplifying levels of “Ton” and current. As shown in Figure 14, pulse off at lower levels and pulse on at higher levels also results in improved performance when it comes to multi-aspect machining.

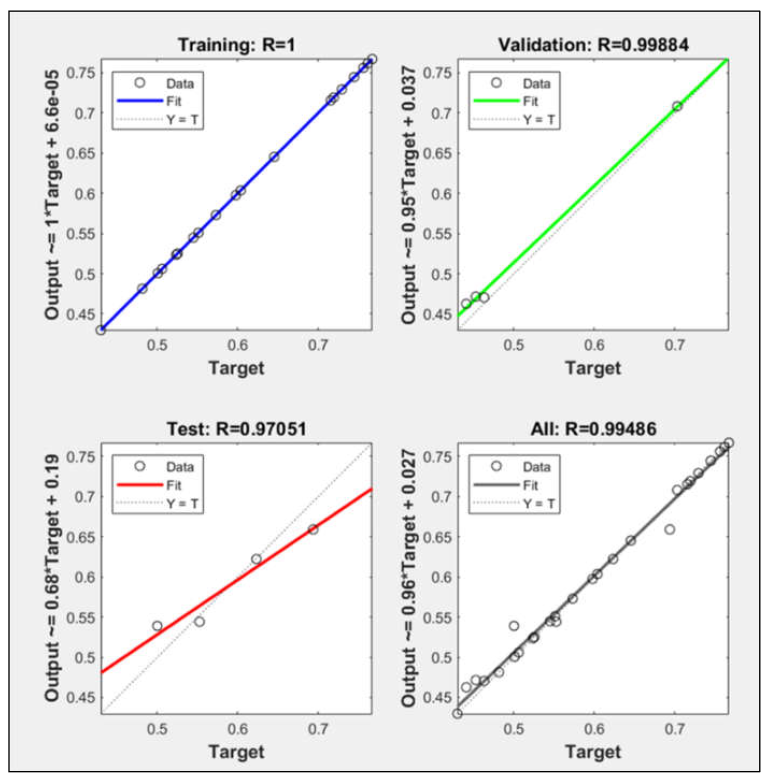
3.7. Investigation on the Performance of Evolved Artificial Models

Insight into the capabilities of the evolved models is provided through examination of the output metrics. The outcomes of the analysis are presented as follows.
The following Equations (1)–(9) can be used to calculate the severity of various types of errors. The data attained are shown in Table 3.
M A E = i = 1 n E i P i n
M S E = i = 1 n ( E i P i ) 2 n
R M S E = i = 1 n ( E i P i ) 2 n
M A R E = i = 1 n ( E i P i ) E i n
M S R E = i = 1 n ( E i P i ) E i n
R M S R E = i = 1 n E i P i E i 2 n
M A P E = i = 1 n ( E i P i ) E i n × 100
M S P E = i = 1 n E i P i E i × 100 2 n
R M S P E = i = 1 n E i P i E i × 100 2 n

3.8. Efficiency of Developed Predictive Models

The ability of the hybrid learning was also inspected by subsequent Equations (10) and (11). The data attained from the assessment are depicted in Table 3.
Correlation   coefficient :   R = n × i = 1 n E i P i i = 1 n E i × i = 1 n P i n × i = 1 n E i 2 i = 1 n E i 2 × n × i = 1 n P i 2 i = 1 n P i 2
Nash   Sutcliffe   efficiency   coefficient :   N S E = 1 i = 1 n ( E i P i ) 2 i = 1 n ( E i E ) 2
Here, the values from the experimentation “Ei” and values gained from prediction values “Pi” are composed for the entire “n” set of observations. The evaluation of the performance of the ANFIS structure revealed that it has minimal errors, which supports the evolution of the model and is disclosed in Figure 13.
The data illustrate that the model is proficient for accurately envisaging the variables that are important for the prediction of the WEDM of a Ti6Al4V. They also show that the model has the necessary competencies to perform this task.

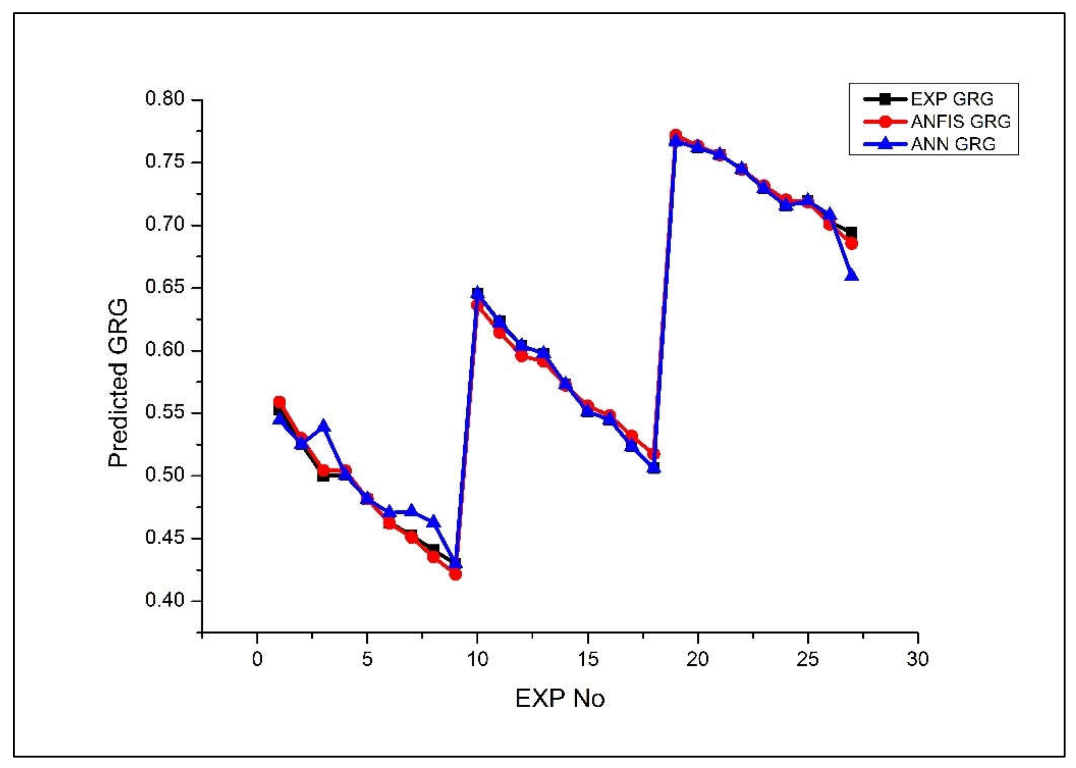
3.9. Comparative Analysis on Actual and Foretold GRG

The purpose of this investigation was to come up with an appropriate model for calculating the GRG by utilizing the ANFIS and ANN methodologies. A study of comparison was carried out to establish the values that were forecasted by the two different models [21,24]. The ANFIS model was successful in providing an accurate prediction of the various output factors. In addition to this, the relationship between the projected scale values and the calculated scale values was demonstrated [4]. The findings of the investigation showed that the projected outcomes had a high degree of correspondence with the actual results.

4. Conclusions

The aim of this present explorative analysis was to create a prophecy structure that could foresee the GRG of a titanium alloy with the assistance of WEDM. The model was further refined using various tools, such as ANFIS and ANN. The interpretations gathered from this exploration are as follows:
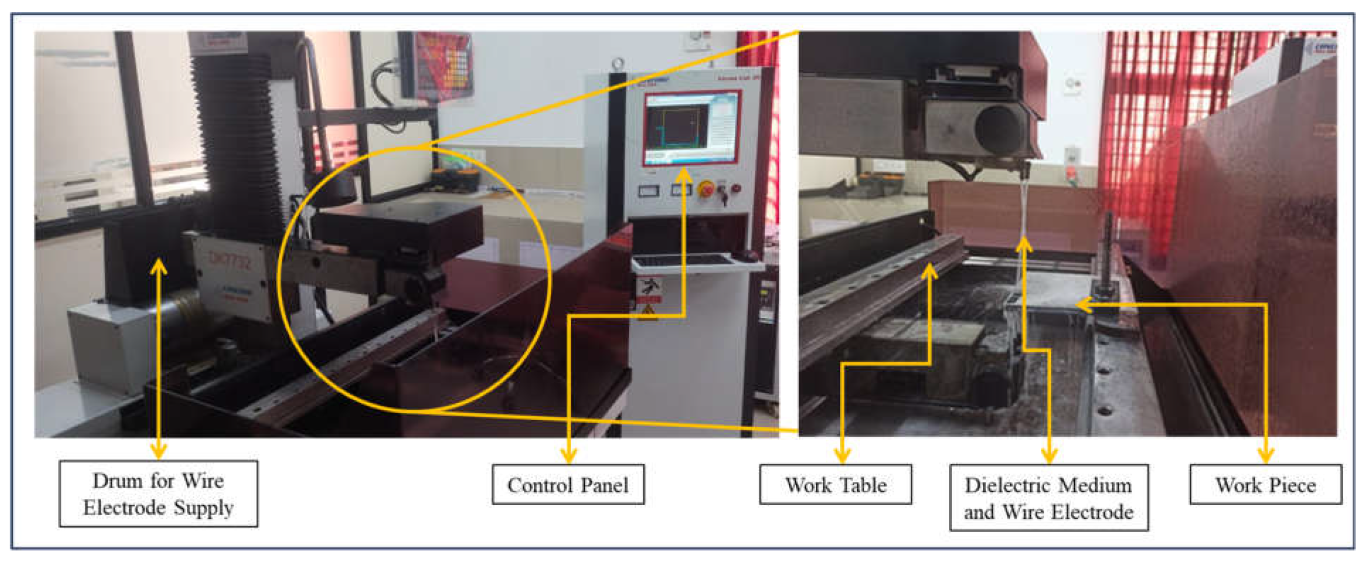
  • The WEDM process was engaged to accomplish the performance attributes with the assistance of Taguchi L27 OA.
  • The performance parameters of a material were selected according to the approach of the Taguchi method. An investigation was then performed to ascertain the various input variables that impact the output of a Ti6Al4V. It was revealed that the effect of current on the performance is the most critical factor.
  • The output parameters were analyzed using the ANOVA method, and the main influence was the electric current that was used in the WEDM approach. The outcomes of the exploration unveiled that the different methods used in the investigation have closer connection with the Taguchi approach.
  • The input factor values were exploited to input the model that was engaged in the evolution of hybrid learning models. The ANFIS-GRG and ANN-GRG were created from the evolved predictive structures. The findings of the analysis unveiled that the ANFIS structure is proficient for precisely predicting the performance measures of the alloy.
  • The ANFIS proposed structure was also found to enhance the accurateness of the forecast by reducing the vagueness in the results.
  • The performance index was then analyzed by the grey theory. The outcomes designated that the prophesied value of the ANFIS-GRG was at 0.7777. The recommended model can assist in improving the proficiency of various manufacturing processes.
  • The anticipated accurateness of the ANFIS model and efficiency were established by the competent results of the analysis. The NSE and correlation coefficient values also evidenced the efficacy of the ANFIS model.
  • The summary of this study specified that the projected structure can be adopted for various uses in manufacturing. It can be predominantly beneficial for attaining multi-performance in various manufacturing processes.
  • Similar work could be extended to other contemporary machining processes such as EDM, abrasive jet machining, etc. The suggested approach could be used for online quality control techniques in machining. Various random search techniques such as Tabu Search, the Memetic Algorithm, Simulated Annealing, and Ant Colony Optimization could be attempted as training algorithms for hybrid intelligent decision-making tools.

Author Contributions

All authors contributed equally to the conceptualization, formal analysis, investigation, methodology, and writing and editing of the original draft. All authors have read and agreed to the published version of the manuscript.

Funding

This research received no external funding.

Institutional Review Board Statement

Not applicable.

Informed Consent Statement

Not applicable.

Data Availability Statement

The datasets used during the current study are available from the corresponding authors on reasonable request.

Conflicts of Interest

The authors declare no conflict of interest.

References

  1. Veiga, C.; Davim, J.P.; Loureiro AJ, R. Properties and applications of titanium alloys: A brief review. Rev. Adv. Mater. Sci. 2012, 32, 133–148. [Google Scholar]
  2. Gorynin, I.V. Titanium alloys for marine application. Mater. Sci. Eng. A 1999, 263, 112–116. [Google Scholar] [CrossRef]
  3. Pasupuleti, T.; Natarajan, M.; Silambarasan, R.; Ramesh, R. Development of Regression Models for Laser Beam Welding of Inconel 718 Alloy Thin Sheets (No. 2022-28-0340); SAE Technical Paper: Pittsburgh, PE, USA, 2022. [Google Scholar]
  4. Thejasree, P.; Narasimhamu, K.L.; Natarajan, M.; Raju, R. Generative modelling of laser beam welded Inconel 718 thin weldments using ANFIS based hybrid algorithm. Int. J. Interact. Des. Manuf. 2022, 1–9. [Google Scholar] [CrossRef]
  5. Koizumi, H.; Takeuchi, Y.; Imai, H.; Kawai, T.; Yoneyama, T. Application of titanium and titanium alloys to fixed dental prostheses. J. Prosthodont. Res. 2019, 63, 266–270. [Google Scholar] [CrossRef]
  6. Singh, A.; Ghadai, R.K.; Kalita, K.; Chatterjee, P.; Pamučar, D. Edm Process Parameter Optimization for Efficient Machining of Inconel-718. Facta Univ. Ser. Mech. Eng. 2020, 18, 473. [Google Scholar] [CrossRef]
  7. Ho, K.H.; Newman, S.T. State of the Art Electrical Discharge Machining (EDM). Int. J. Mach. Tools Manuf. 2003, 43, 1287–1300. [Google Scholar] [CrossRef]
  8. Nguyen, H.-P.; Ngo, N.-V.; Nguyen, Q.-T. Optimizing Process Parameters in EDM Using Low Frequency Vibration for Material Removal Rate and Surface Roughness. J. King Saud Univ.-Eng. Sci. 2021, 33, 284–291. [Google Scholar] [CrossRef]
  9. Kliuev, M.; Florio, K.; Akbari, M.; Wegener, K. Influence of Energy Fraction in EDM Drilling of Inconel 718 by Statistical Analysis and Finite Element Crater-Modelling. J. Manuf. Process. 2019, 40, 84–93. [Google Scholar] [CrossRef]
  10. El-Hofy, H.A. Advanced Machining Processes; McGraw-Hill Education: New York, NY, USA, 2005. [Google Scholar]
  11. Khan, M.A.; Thejasree, P.; Natarajan, M.; Narasimhamu, K.L. Application of a hybrid Taguchi grey approach for determining the optimal parameters on wire electrical discharge machining of Ti6Al4V. Int. J. Interact. Des. Manuf. 2023. [Google Scholar] [CrossRef]
  12. Li, X.K.; Yan, F.H.; Ma, J.; Chen, Z.Z.; Wen, X.Y.; Cao, Y. RBF and NSGA-II Based EDM Process Parameters Optimization with Multiple Constraints. Math. Biosci. Eng. 2019, 16, 5788–5803. [Google Scholar] [CrossRef]
  13. Palanisamy, D.; Devaraju, A.; Manikandan, N.; Balasubramanian, K.; Arulkirubakaran, D. Experimental Investigation and Optimization of Process Parameters in EDM of Aluminium Metal Matrix Composites. Mater. Today 2020, 22, 525–530. [Google Scholar] [CrossRef]
  14. Caiazzo, F.; Cuccaro, L.; Fierro, I.; Petrone, G.; Alfieri, V. Electrical Discharge Machining of René 108 DS Nickel Superalloy for Aerospace Turbine Blades. Procedia CIRP 2015, 33, 382–387. [Google Scholar] [CrossRef] [Green Version]
  15. Manikandan, N.; Thejasree, P.; Raju, R.; Palanisamy, D.; Varaprasad, K.C.; Sagai Francis Britto, A.; Deeraj Chengalva Sai, A. Investigations on Wire Electrical Discharge Machining of Titanium Alloys by Taguchi—Grey Approach. In Lecture Notes in Mechanical Engineering; Springer Nature: Singapore, 2022; pp. 359–368. [Google Scholar]
  16. Lostado, R.; Martinez, R.F.; Mac Donald, B.; Villanueva, P. Combining soft computing techniques and the finite element method to design and optimize complex welded products. Integr. Comput. Aided Eng. 2015, 22, 153–170. [Google Scholar] [CrossRef]
  17. Martínez-de-Pisón, F.J.; Lostado, R.; Pernía, A.; Fernández, R. Optimising tension levelling process by means of genetic algorithms and finite element method. Ironmak. Steelmak. 2011, 38, 45–52. [Google Scholar] [CrossRef]
  18. Lostado, R.; Martínez-De-Pisón, F.J.; Pernía, A.; Alba, F.; Blanco, J. Combining regression trees and the finite element method to define stress models of highly non-linear mechanical systems. J. Strain Anal. Eng. Des. 2009, 44, 491–502. [Google Scholar] [CrossRef]
  19. Lostado, R.; Martínez-de-Pisón, F.J.; Fernández, R.; Fernández, J. Using Genetic Algorithms to Optimize the Material Behaviour Model in Finite Element Models of Processes with Cyclic Loads. J. Strain Anal. Eng. Des. 2010, 46, 143–159. [Google Scholar] [CrossRef]
  20. Lostado Lorza, R.; Escribano García, R.; Martínez Calvo, M.; Múgica Vidal, R. Improvement in the Design of Welded Joints of EN 235JR Low Carbon Steel by Multiple Response Surface Methodology. Metals 2016, 6, 205. [Google Scholar] [CrossRef] [Green Version]
  21. Sabando-Fraile, C.; Corral-Bobadilla, M.; Lostado-Lorza, R.; Somovilla-Gomez, F. Multiresponse Performance Evaluation and Life Cycle Assessment for the Optimal Elimination of Pb (II) from Industrial Wastewater by Adsorption Using Vine Shoot Activated Carbon. Sustainability 2023, 15, 11007. [Google Scholar] [CrossRef]
  22. Liu, S.; Liu, Y. An Introduction to Grey Systems: Foundations, Methodology, and Applications; Iigss Academic Publisher: Cambridge, MA, USA, 1998. [Google Scholar]
  23. Manikandan, N.; Varaprasad, K.C.; Thejasree, P.; Palanisamy, D.; Arulkirubakaran, D.; Raju, R.; Badrinath, K. Prediction of Performance Measures Using Multiple Regression Analysis for Wire Electrical Discharge Machining of Titanium Alloy. In Lecture Notes in Mechanical Engineering; Springer Nature: Singapore, 2022; pp. 601–612. [Google Scholar]
  24. Palanisamy, D.; Senthil, P. Optimization on Turning Parameters of 15-5PH Stainless Steel Using Taguchi Based Grey Approach and Topsis. Arch. Mech. Eng. 2016, 63, 397–412. [Google Scholar] [CrossRef] [Green Version]
  25. Hourmand, M.; Sarhan, A.A.D.; Farahany, S.; Sayuti, M. Microstructure Characterization and Maximization of the Material Removal Rate in Nano-Powder Mixed EDM of Al-Mg2Si Metal Matrix Composite—ANFIS and RSM Approaches. Int. J. Adv. Manuf. Technol. 2019, 101, 2723–2737. [Google Scholar] [CrossRef]
  26. Patel Gowdru Chandrashekarappa, M.; Kumar, S.; Jagadish, J.; Pimenov, D.Y.; Giasin, K. Experimental Analysis and Optimization of EDM Parameters on HcHcr Steel in Context with Different Electrodes and Dielectric Fluids Using Hybrid Taguchi-Based PCA-Utility and CRITIC-Utility Approaches. Metals 2021, 11, 419. [Google Scholar] [CrossRef]
  27. Pandey, R.K.; Panda, S.S. Optimization of Bone Drilling Parameters Using Grey-Based Fuzzy Algorithm. Measurement 2014, 47, 386–392. [Google Scholar] [CrossRef]
  28. Suresh, P.; Marimuthu, K.; Ranganathan, S.; Rajmohan, T. Optimization of Machining Parameters in Turning of Al-SiC-Gr Hybrid Metal Matrix Composites Using Grey-Fuzzy Algorithm. Trans. Nonferrous Met. Soc. China 2014, 24, 2805–2814. [Google Scholar] [CrossRef]
  29. Guo, Y.; Wang, L.; Zhang, G.; Hou, P. Multi-Response Optimization of the Electrical Discharge Machining of Insulating Zirconia. Mater. Manuf. Process. 2017, 32, 294–301. [Google Scholar] [CrossRef]
  30. Pradhan, M.K.; Biswas, C.K. Neuro-Fuzzy and Neural Network-Based Prediction of Various Responses in Electrical Discharge Machining of AISI D2 Steel: NF and NN Based Prediction of Responses in EDM of D2 Steel. Int. J. Adv. Manuf. Technol. 2010, 50, 591–610. [Google Scholar] [CrossRef]
  31. Dimla, D.E., Jr.; Lister, P.M.; Leighton, N.J. Neural Network Solutions to the Tool Condition Monitoring Problem in Metal Cutting—A Critical Review of Methods. Int. J. Mach. Tools Manuf. 1997, 37, 1219–1241. [Google Scholar] [CrossRef]
  32. Barua, R.; Datta, S.; Datta, P.; Roychowdhury, A. Study and Application of Machine Learning Methods in Modern Additive Manufacturing Processes. In Applications of Artificial Intelligence in Additive Manufacturing; IGI Global: Pittsburgh, PE, USA, 2022; pp. 75–95. [Google Scholar]
  33. Arunadevi, M.; Prakash, C.P.S. Predictive analysis and multi objective optimization of wire-EDM process using ANN. Mater. Today Proc. 2021, 46, 6012–6016. [Google Scholar]
  34. Kao, J.Y.; Tarng, Y.S. A Neutral-Network Approach for the on-Line Monitoring of the Electrical Discharge Machining Process. J. Mater. Process. Technol. 1997, 69, 112–119. [Google Scholar] [CrossRef]
  35. Quarto, M.; D’Urso, G.; Giardini, C. Micro-EDM Optimization through Particle Swarm Algorithm and Artificial Neural Network. Precis. Eng. 2022, 73, 63–70. [Google Scholar] [CrossRef]
  36. Saffaran, A.; Azadi Moghaddam, M.; Kolahan, F. Optimization of Backpropagation Neural Network-Based Models in EDM Process Using Particle Swarm Optimization and Simulated Annealing Algorithms. J. Braz. Soc. Mech. Sci. Eng. 2020, 42, 73. [Google Scholar] [CrossRef]
  37. Mandal, D.; Pal, S.K.; Saha, P. Back Propagation Neural Network Based Modeling of Multi-Response of an Electrical Discharge Machining Process. Int. J. Knowl. Based Intell. Eng. Syst. 2007, 11, 105–113. [Google Scholar] [CrossRef]
  38. Singh, T.; Kumar, P.; Misra, J.P. Modelling of MRR during wire-EDM of ballistic grade alloy using artificial neural network technique. J. Phys. Conf. Ser. 2019, 1240, 012114. [Google Scholar]
  39. Alduroobi, A.A.; Ubaid, A.M.; Tawfiq, M.A.; Elias, R.R. Wire EDM process optimization for machining AISI 1045 steel by use of Taguchi method, artificial neural network and analysis of variances. Int. J. Syst. Assur. Eng. Manag. 2020, 11, 1314–1338. [Google Scholar] [CrossRef]
  40. Surya, V.R.; Kumar, K.V.; Keshavamurthy, R.; Ugrasen, G.; Ravindra, H.V. Prediction of machining characteristics using artificial neural network in wire EDM of Al7075 based in-situ composite. Mater. Today Proc. 2017, 4, 203–212. [Google Scholar] [CrossRef]
  41. Reddy, C.B.; Reddy, C.E.; Reddy, D.R. Experimental investigation of surface finish and material removal rate of P20 die-tool steel in wire-EDM using multiple regression analysis. GSTF J. Eng. Technol. 2014, 1. [Google Scholar]
Figure 1. Process flow schematic of WEDM [10,11].
Information 14 00439 g001
Figure 2. Experimental setup.
Information 14 00439 g002
Figure 3. Structure of ANN model.
Information 14 00439 g003
Figure 4. Regression values of ANN model.
Information 14 00439 g004
Figure 5. Structure of developed ANFIS model.
Information 14 00439 g005
Figure 6. Rule viewer.
Information 14 00439 g006
Figure 7. Response graph for MRR.
Information 14 00439 g007
Figure 8. Response graph for SR.
Information 14 00439 g008
Figure 9. Plot for dimensional deviation.
Information 14 00439 g009
Figure 10. Plot for squareness error.
Information 14 00439 g010
Figure 11. Plot for perpendicularity error.
Information 14 00439 g011
Figure 12. Surface plot for ANFIS-GRG on (a) current vs. pulse off, (b) current vs. pulse on, (c) pulse off vs. pulse on.
Information 14 00439 g012
Figure 13. Efficiency of models developed.
Information 14 00439 g013
Figure 14. Comparison plot for estimated and foretold GRG.
Information 14 00439 g014
Table 1. Factors and levels.
SymbolsVariablesLevels
123
ACurrent (A)51015
TonPon (µs)306090
ToffPoff (µs)369
Table 2. ANOVA for WEDM of Ti6Al4V.
ANOVA for MRR (g/min)
SourceDFSS (Seq)SS (Adj)MS (Adj)Fp
A20.0021490.00214880.0010741080.810
Ton20.0004510.00045080.000225226.740
Toff22.27 × 10−50.00002271.13 × 10−511.410
Error201.99 × 10−50.00001990.000001
Total260.002642
ANOVA for SR (microns)
A20.1487630.1487630.0743821257.150
Ton20.0089190.0089190.00445975.370
Toff20.0020070.0020070.00100416.960
Error200.0011830.0011830.000059
Total260.160872
ANOVA for Dimensional Deviation (mm)
A21.950651.950650.9753379,116.470
Ton20.340250.340250.1701213,800.090
Toff20.037830.037830.018921534.40
Error200.000250.000250.00001
Total262.32898
ANOVA for form Error (mm)
A21.143421.143420.57171325.360
Ton20.084240.084240.0421223.970
Toff20.020110.020110.010065.720.011
Error200.035140.035140.00176
Total261.28291
ANOVA for Orientation Error (mm)
A21.005581.005580.50279247.380
Ton20.14090.14090.0704534.660
Toff20.014090.014090.007053.470.051
Error200.040650.040650.00203
Total261.20122
Table 3. Performance analysis of predictive models.
ErrorModel
ANFISANN
MAE0.0044260.005056
MSE0.000030.000138
RMSE0.0054610.011737
MARE0.0078560.009623
MSRE0.0000980.000496
RMSRE0.009890.022261
MAPE0.7856480.962349
MSPE0.9781744.955395
RMSPE0.9890272.226072
Efficiency of models
Correlational Coefficient Value0.998750.99486
NSE0.997500.98846
Disclaimer/Publisher’s Note: The statements, opinions and data contained in all publications are solely those of the individual author(s) and contributor(s) and not of MDPI and/or the editor(s). MDPI and/or the editor(s) disclaim responsibility for any injury to people or property resulting from any ideas, methods, instructions or products referred to in the content.

