

A Novel Non-Intrusive Load Monitoring Algorithm for Unsupervised Disaggregation of Household Appliances

1
Department of Computer Science and Artificial Intelligence, University of Granada, 18014 Granada, Spain
2
Department of Software Engineering, University of Granada, 18014 Granada, Spain
3
Grupo Cuerva, 18194 Churriana de la Vega, Spain
*
Author to whom correspondence should be addressed.
Information 2024, 15(2), 87; https://doi.org/10.3390/info15020087
Submission received: 11 January 2024
/
Revised: 31 January 2024
/
Accepted: 1 February 2024
/
Published: 5 February 2024
(This article belongs to the Topic Software Engineering and Applications)
Abstract
:This paper introduces the first completely unsupervised methodology for non-intrusive load monitoring that does not rely on any additional data, making it suitable for real-life applications. The methodology includes an algorithm to efficiently decompose the aggregated energy load from households in events and algorithms based on expert knowledge to assign each of these events to four types of appliances: fridge, dishwasher, microwave, and washer/dryer. The methodology was developed to work with smart meters that have a granularity of 1 min and was evaluated using the Reference Energy Disaggregation Dataset. The results show that the algorithm can disaggregate the refrigerator with high accuracy and the usefulness of the proposed methodology to extract relevant features from other appliances, such as the power use and duration from the heating cycles of a dishwasher.
1. Introduction
Electricity usage profiling is essential for understanding and improving household energy consumption patterns [1]. By identifying individual appliance-level energy usage patterns, homeowners can make informed decisions on how to manage their energy use, reduce their carbon footprint, and save money on energy bills [2]. The identification of appliance consumption has been successfully applied to improve the householders’ quality of life in many different scenarios, such as scheduling the use of large consumption appliances [3], detecting appliance malfunctions [4], or providing early preventive maintenance [5], among many others.
Two main groups of approaches have been previously studied to monitor each appliance’s load: intrusive and non-intrusive. Intrusive load monitoring relies on installing additional sensors at the plug level per appliance cost, being more accurate at the expense of a higher price due to the high number of plug-level sensors that need to be manufactured, installed, and maintained. On the other hand, non-intrusive load monitoring (NILM) only relies on the aggregated load measured at the user connection point with their energy distributor. As such, NILM approaches use algorithms and machine learning models to disaggregate the appliance-level load from the aggregated load, leading to a less accurate but more cost-effective approach. Since the NILM problem was first formulated in the mid-1980s [6,7], many researchers have proposed different alternatives to address this challenge. These proposals can be categorized into four different groups depending on the strategies used to disaggregate the energy load.
State-based approaches, such as Hidden Markov Models (HMMs) [8,9,10], used to be the state of the art in NILM as there was a clear relationship between each appliance state and the hidden states of the model. HMMs are probabilistic methods that require providing (or learning) a finite set of states, the probabilities of transitioning from one state to another, and the probability of producing an output from the hidden state. The major limitation of this type of approach is its high computational cost, making it too expensive and slow for real-life applications.
Dictionary-based approaches (sparse coding) [11,12,13,14] aim to find data representation based on the linear combination of a dictionary and a representation where the difference between the aggregated time series and the linear combination is minimized, each element of the dictionary represents a different appliance, and the representation is sparse enough. This minimization problem is NP-Hard and several methods can be used to solve it, such as K-SVD or LASSO. These approaches can provide good results for supervised scenarios and can be fast depending on the formulation and algorithms used to solve the optimization problem. However, they have some major limitations in unsupervised scenarios since the number of appliances for the dictionary must be provided previously.
Neural network-based approaches, with all the advancements made in deep learning over the past decade, have become the state of the art for supervised NILM. These approaches are notoriously slow for training and require large amounts of data but can provide fast and accurate disaggregation once trained. Several different neural network architectures have recently been developed for this purpose, such as the use of U-Net [15], combinations of convolutional neural networks and Long Short-Term Memory [16], and generative adversarial networks [17].
Lastly, event-based approaches [18,19,20] detect the use of an appliance by detecting events where appliances have been switched on or off or changed to a state with considerably different power consumption, usually by edge detection. Once the events are identified, rising and falling power edges are generally matched and some features of each event are extracted (power, duration, etc.). Then, a classification (supervised) or clustering (unsupervised) algorithm is used to map each event to an appliance. These approaches are generally fast due to the dimensionality reduction provided by the event extraction. However, they can only detect appliances with consistent energy consumption in each operational state. The algorithm proposed in this paper is of this kind. A notable methodology of this kind that has seen some success, even in unsupervised scenarios, is the use of Graph Signal Processing (GSP) [21,22,23]. In GSP, a graph is constructed, with each node representing a rising/falling edge of the original time series. Then, the mathematical properties of the graph representation and a weighted adjacency matrix are exploited to convert the problem at hand (clustering, classification) into an unconstrained quadratic optimization problem that minimizes the total graph variation.
Although numerous approaches to NILM have been suggested, the majority of them face limitations that hinder practical deployment in real-life applications. A predominant proportion of these NILM algorithms depend on supervised methods, necessitating energy companies to acquire and install multiple dedicated sensors (one for each appliance) in every customer’s household. Despite offering highly accurate disaggregation results, this approach compromises the intended non-intrusiveness of NILM algorithms and imposes significant economic burdens due to the substantial costs associated with the installation of these devices. Unsupervised approaches, which eliminate the need to install sensors, have barely been studied, with just a few algorithms proposed for this task. However, even these algorithms have some major limitations for real-life applications. For example, in [21], even though the disaggregation is conducted in an unsupervised manner, several hyperparameters must be tuned manually in order to do so, making it unfeasible to deploy it on a large scale. Furthermore, the disaggregated signals are not mapped to their corresponding appliance, requiring, according to the authors, an additional step comparing each event with a signature database, which defeats the unsupervised purpose of the algorithm. Another example of this situation is found in [24], where the energy is disaggregated according to an energy consumption survey in Central Europe and a probabilistic HMM framework of household activities. Not only may we be concerned with whether the results of the survey are truly transferable to other regions but this approach requires some supervised information that is not provided to the energy distributor, such as the number of occupants, their age, and the nominal power of the appliances.
As such, the work proposed in this paper presents a new algorithm for low-rate unsupervised NILM that provides the following main contributions to the field:
- It is the first unsupervised algorithm that can be deployed in any residential household without any additional supervised information;
- We propose a novel event detection algorithm capable of recognizing some instances in which rising/falling edges overlap;
- The NILM algorithm provides its disaggregation through knowledge of the common use of appliances and how they work, making it easy to understand but limiting the number of appliances it can detect.
2. Materials and Methods
The Materials and Methods section presents our algorithm and the methodology used to validate it. The section starts by formally defining the problem at hand and an overview of our algorithm. Afterward, a subsection presents our event detector and the following one presents the expert knowledge used to associate each event with an appliance. Lastly, the methodology used to validate the proposed algorithm is presented.
2.1. NILM Problem Formulation
Let be the total household’s active power consumption at timestep . The task at hand is to find, for each timestep , the contribution of each appliance , towards the total consumption power:
where is the set of all appliances in the household and is the random noise provided by measurement errors and any undetected appliances. Furthermore, after disaggregating each signal, the algorithm should label each independent signal with its corresponding appliance (fridge, dishwasher, microwave, etc.).
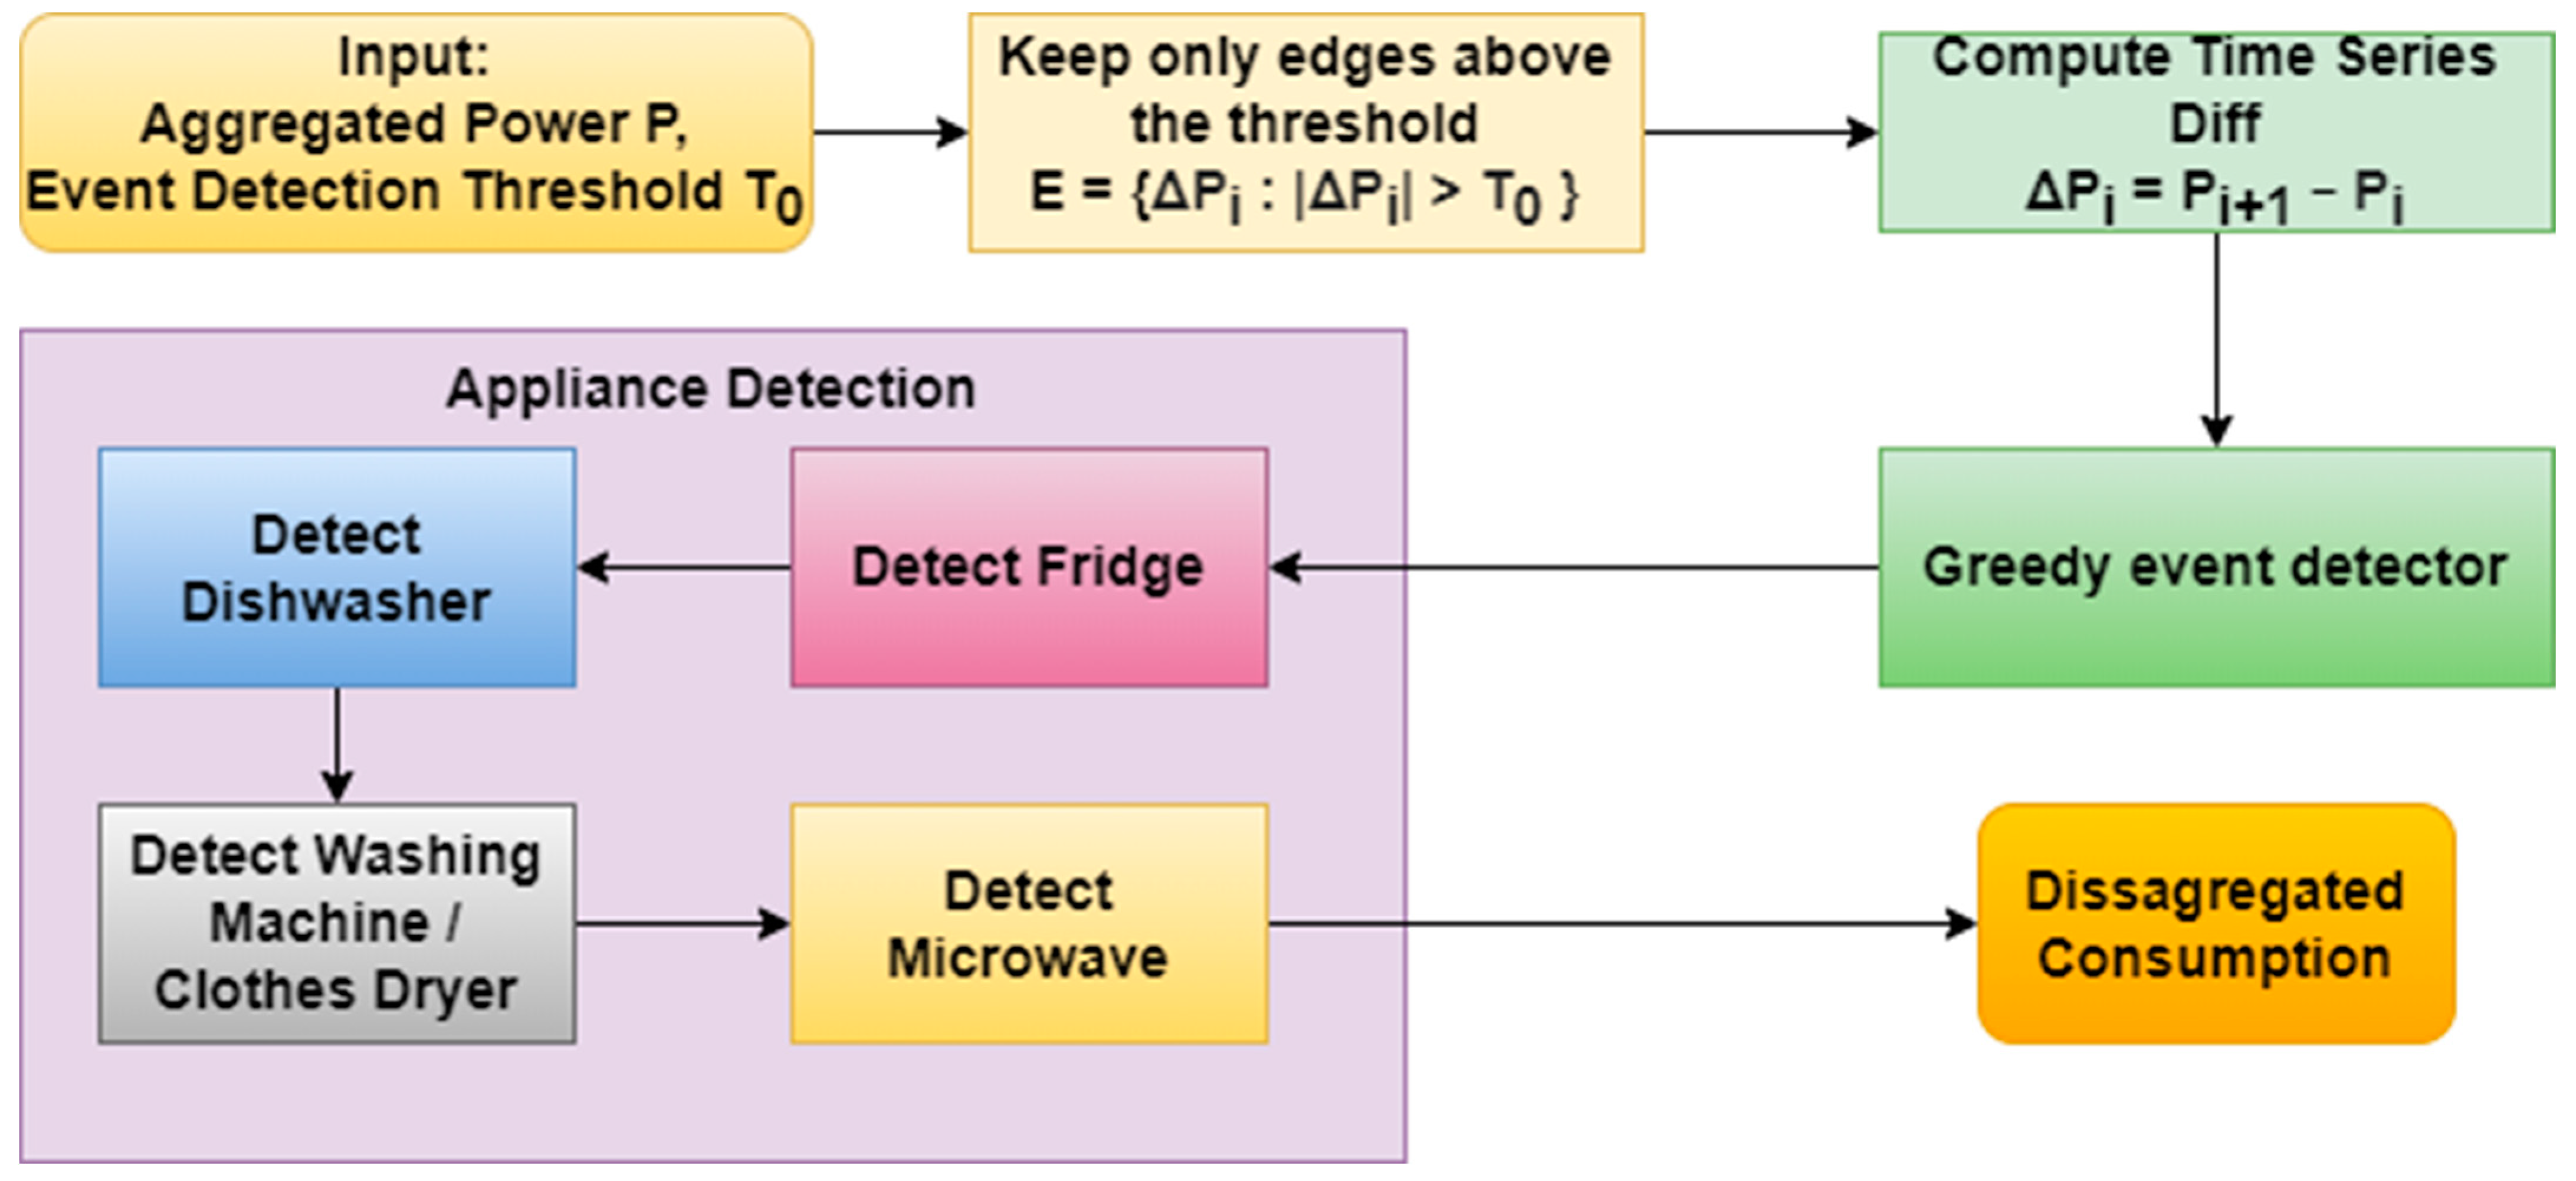
2.2. General Overview of Our Algorithm
Figure 1 represents the general methodology of our algorithm. Since the algorithm proposed in this paper is an event-based method, its first step is to find substantial active power consumption. In order to do so, the time series is differentiated by one time step and only the values that surpass a threshold in absolute value are preserved. These values represent the falling (negative) and rising (positive) edges that will be matched in the next step to define the events. After the edges are extracted, the greedy algorithm presented in Section 2.3 is used to match them, obtaining all the consumption events. Then, we leverage the knowledge of the pattern uses and general known signatures of the fridge, dishwasher, washing/dryer, and microwave in Section 2.4.
2.3. Event Detection
One of the most important and challenging steps in any event-based NILM algorithm is to accurately match the rising and falling edges to accurately describe each event. The proposed algorithm will work iteratively over the time series rising edges, alternating two phases that can create events in each iteration, denominated matching and pruning.
2.3.1. Matching Phase
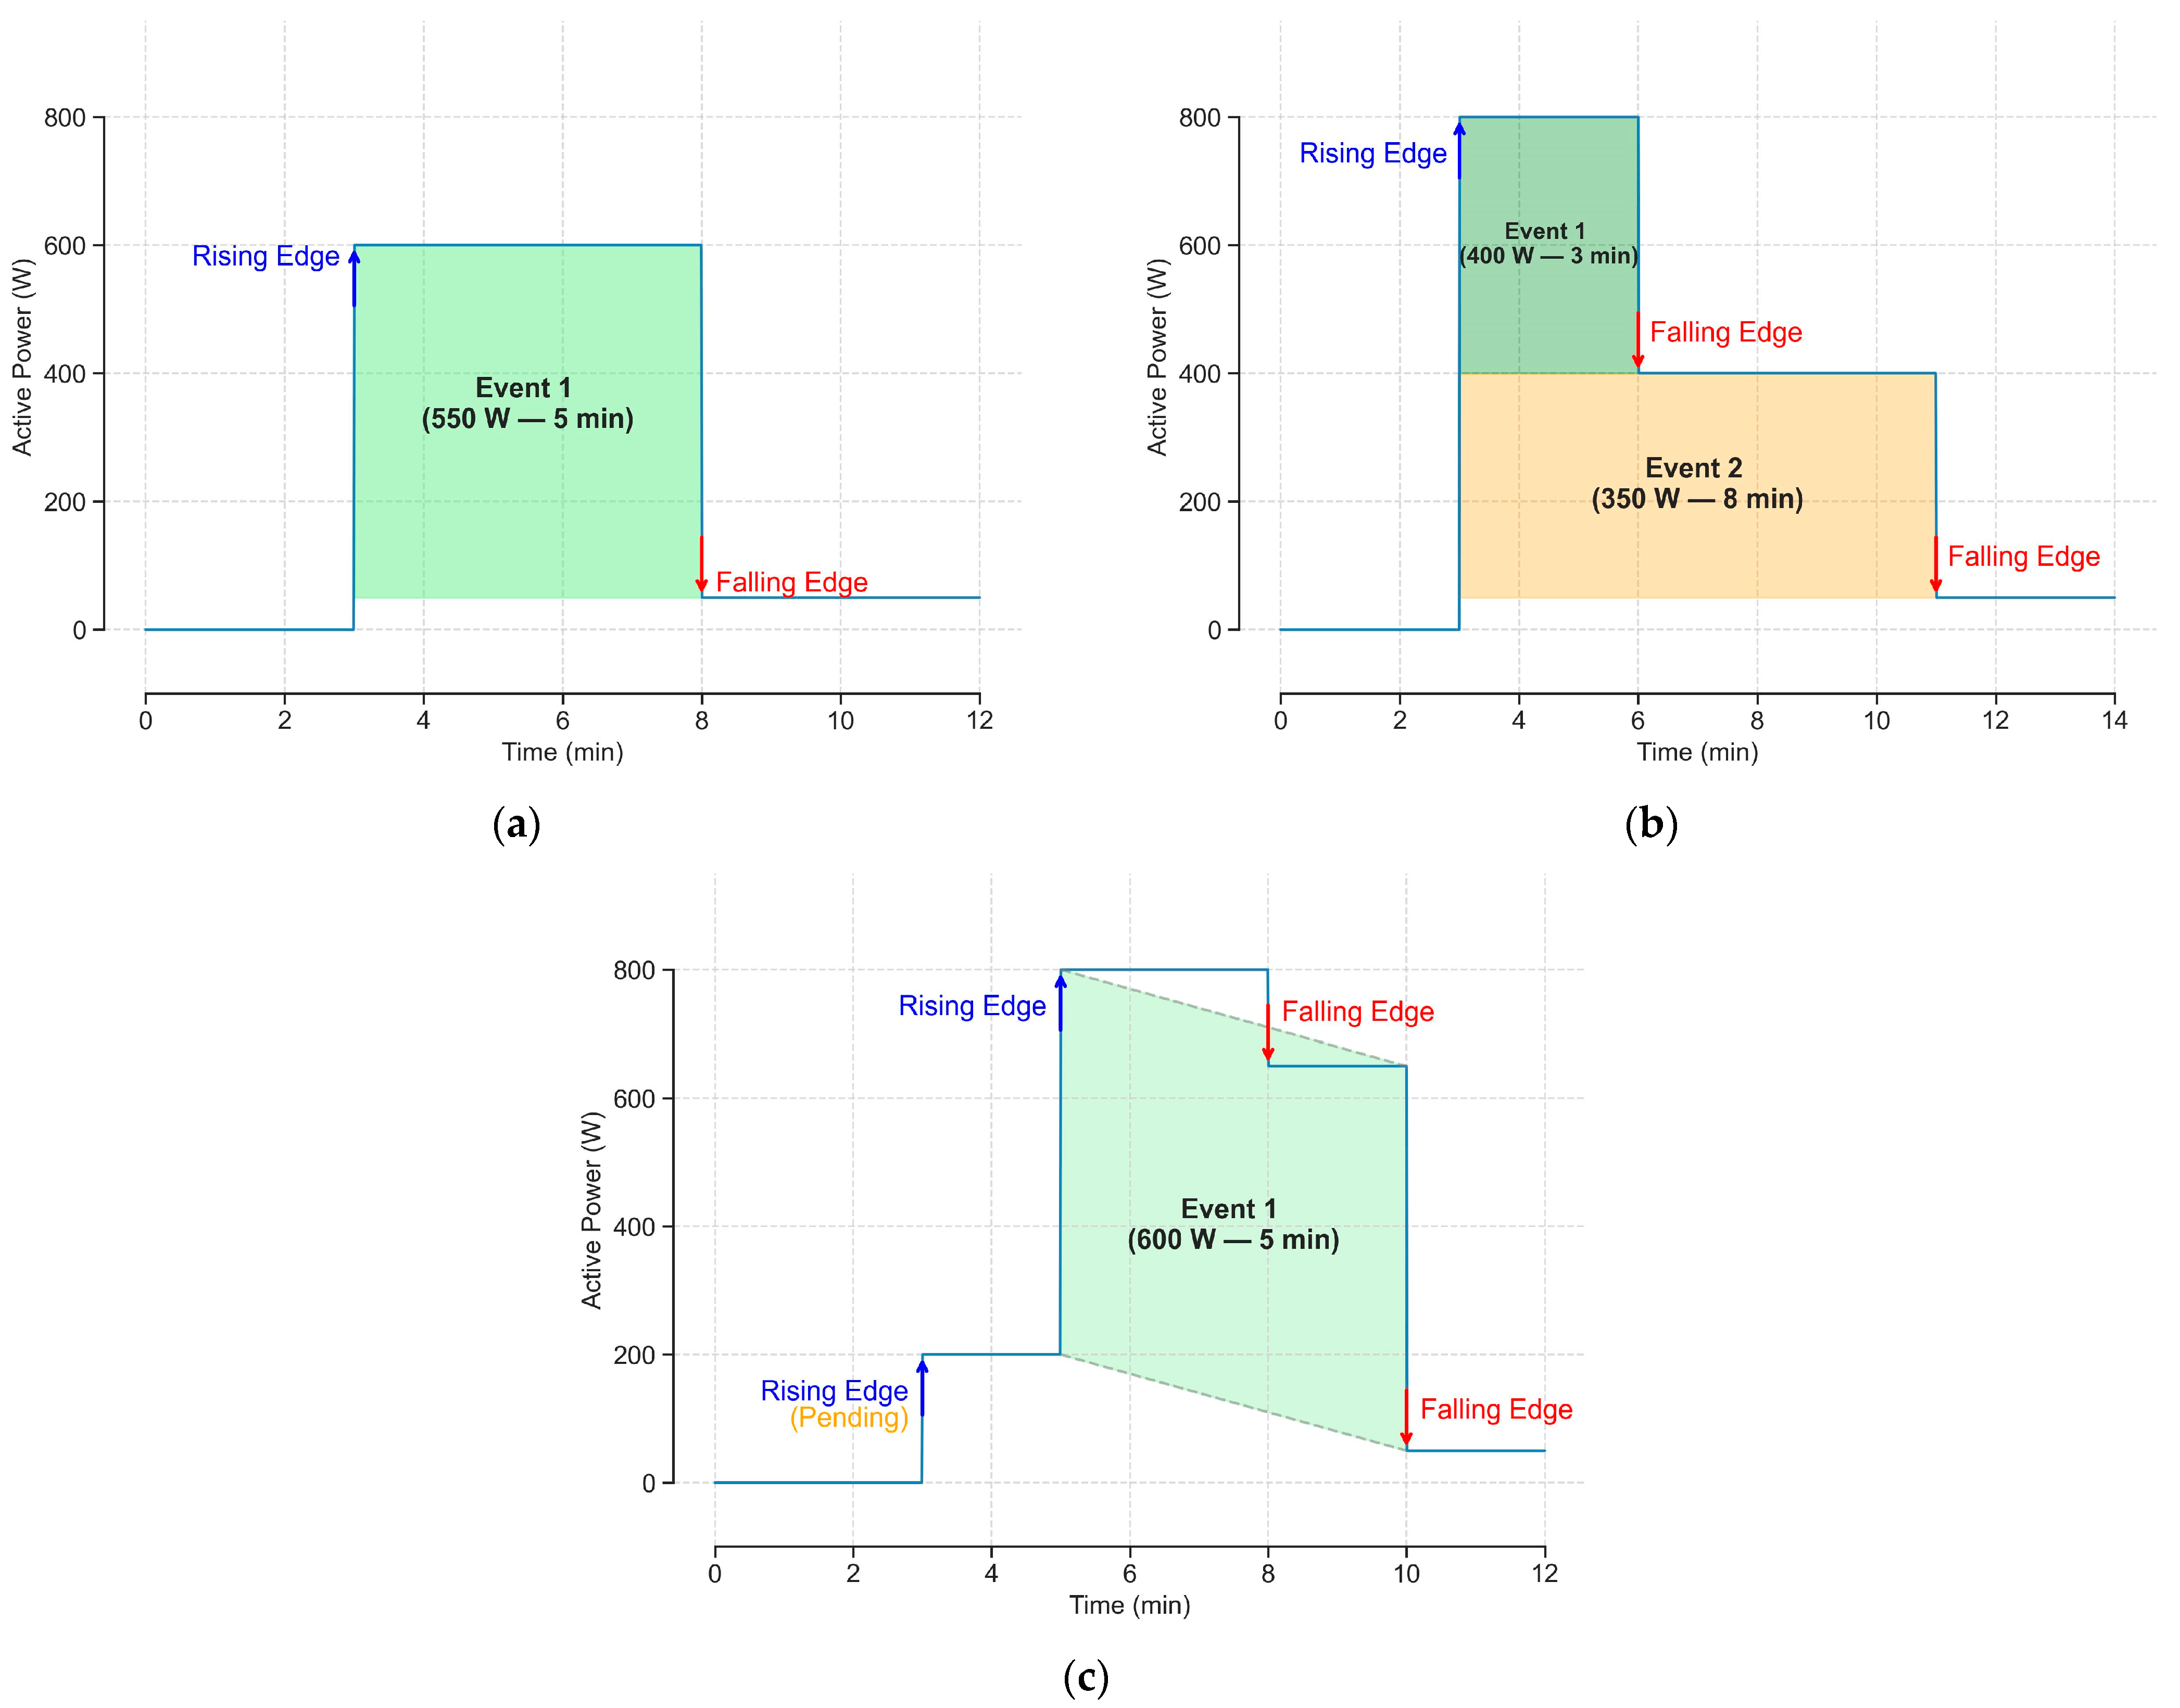
The matching phase will try to create an event using the rising edge of the current iteration. All falling edges prior to the next rising edge are taken into consideration to create an event. The event can be created if a valid match is found between the rising edge and one or more falling edges. A valid match implies that the increase in power of the rising edge is ±25% of the decrease in power of the falling edge(s). When a valid match is found, the implied rising and falling edges are marked as used and their corresponding events are added to the algorithm’s output. Since there will be situations in which multiple valid matches are possible, the matches are always evaluated in the following order (Figure 2). First, we assess whether the first falling edge is a valid match (Figure 2a). Second, we evaluate whether any combination of one or more falling edges is a valid match. If there are multiple valid matches in the latter case, we select the one that has the smallest difference in total power increase and decrease from the rising and falling edges involved. This can be seen in Figure 2b, where one rising edge is matched with two falling edges to create different events, and in the second rising edge of Figure 2c. Lastly, if there is no falling edge available before the next rising edge (first rising edge in Figure 2c) or no valid match is found, the algorithm will add the current rising edge to a pending list that will be managed later in the pruning phase.
2.3.2. Pruning Phase
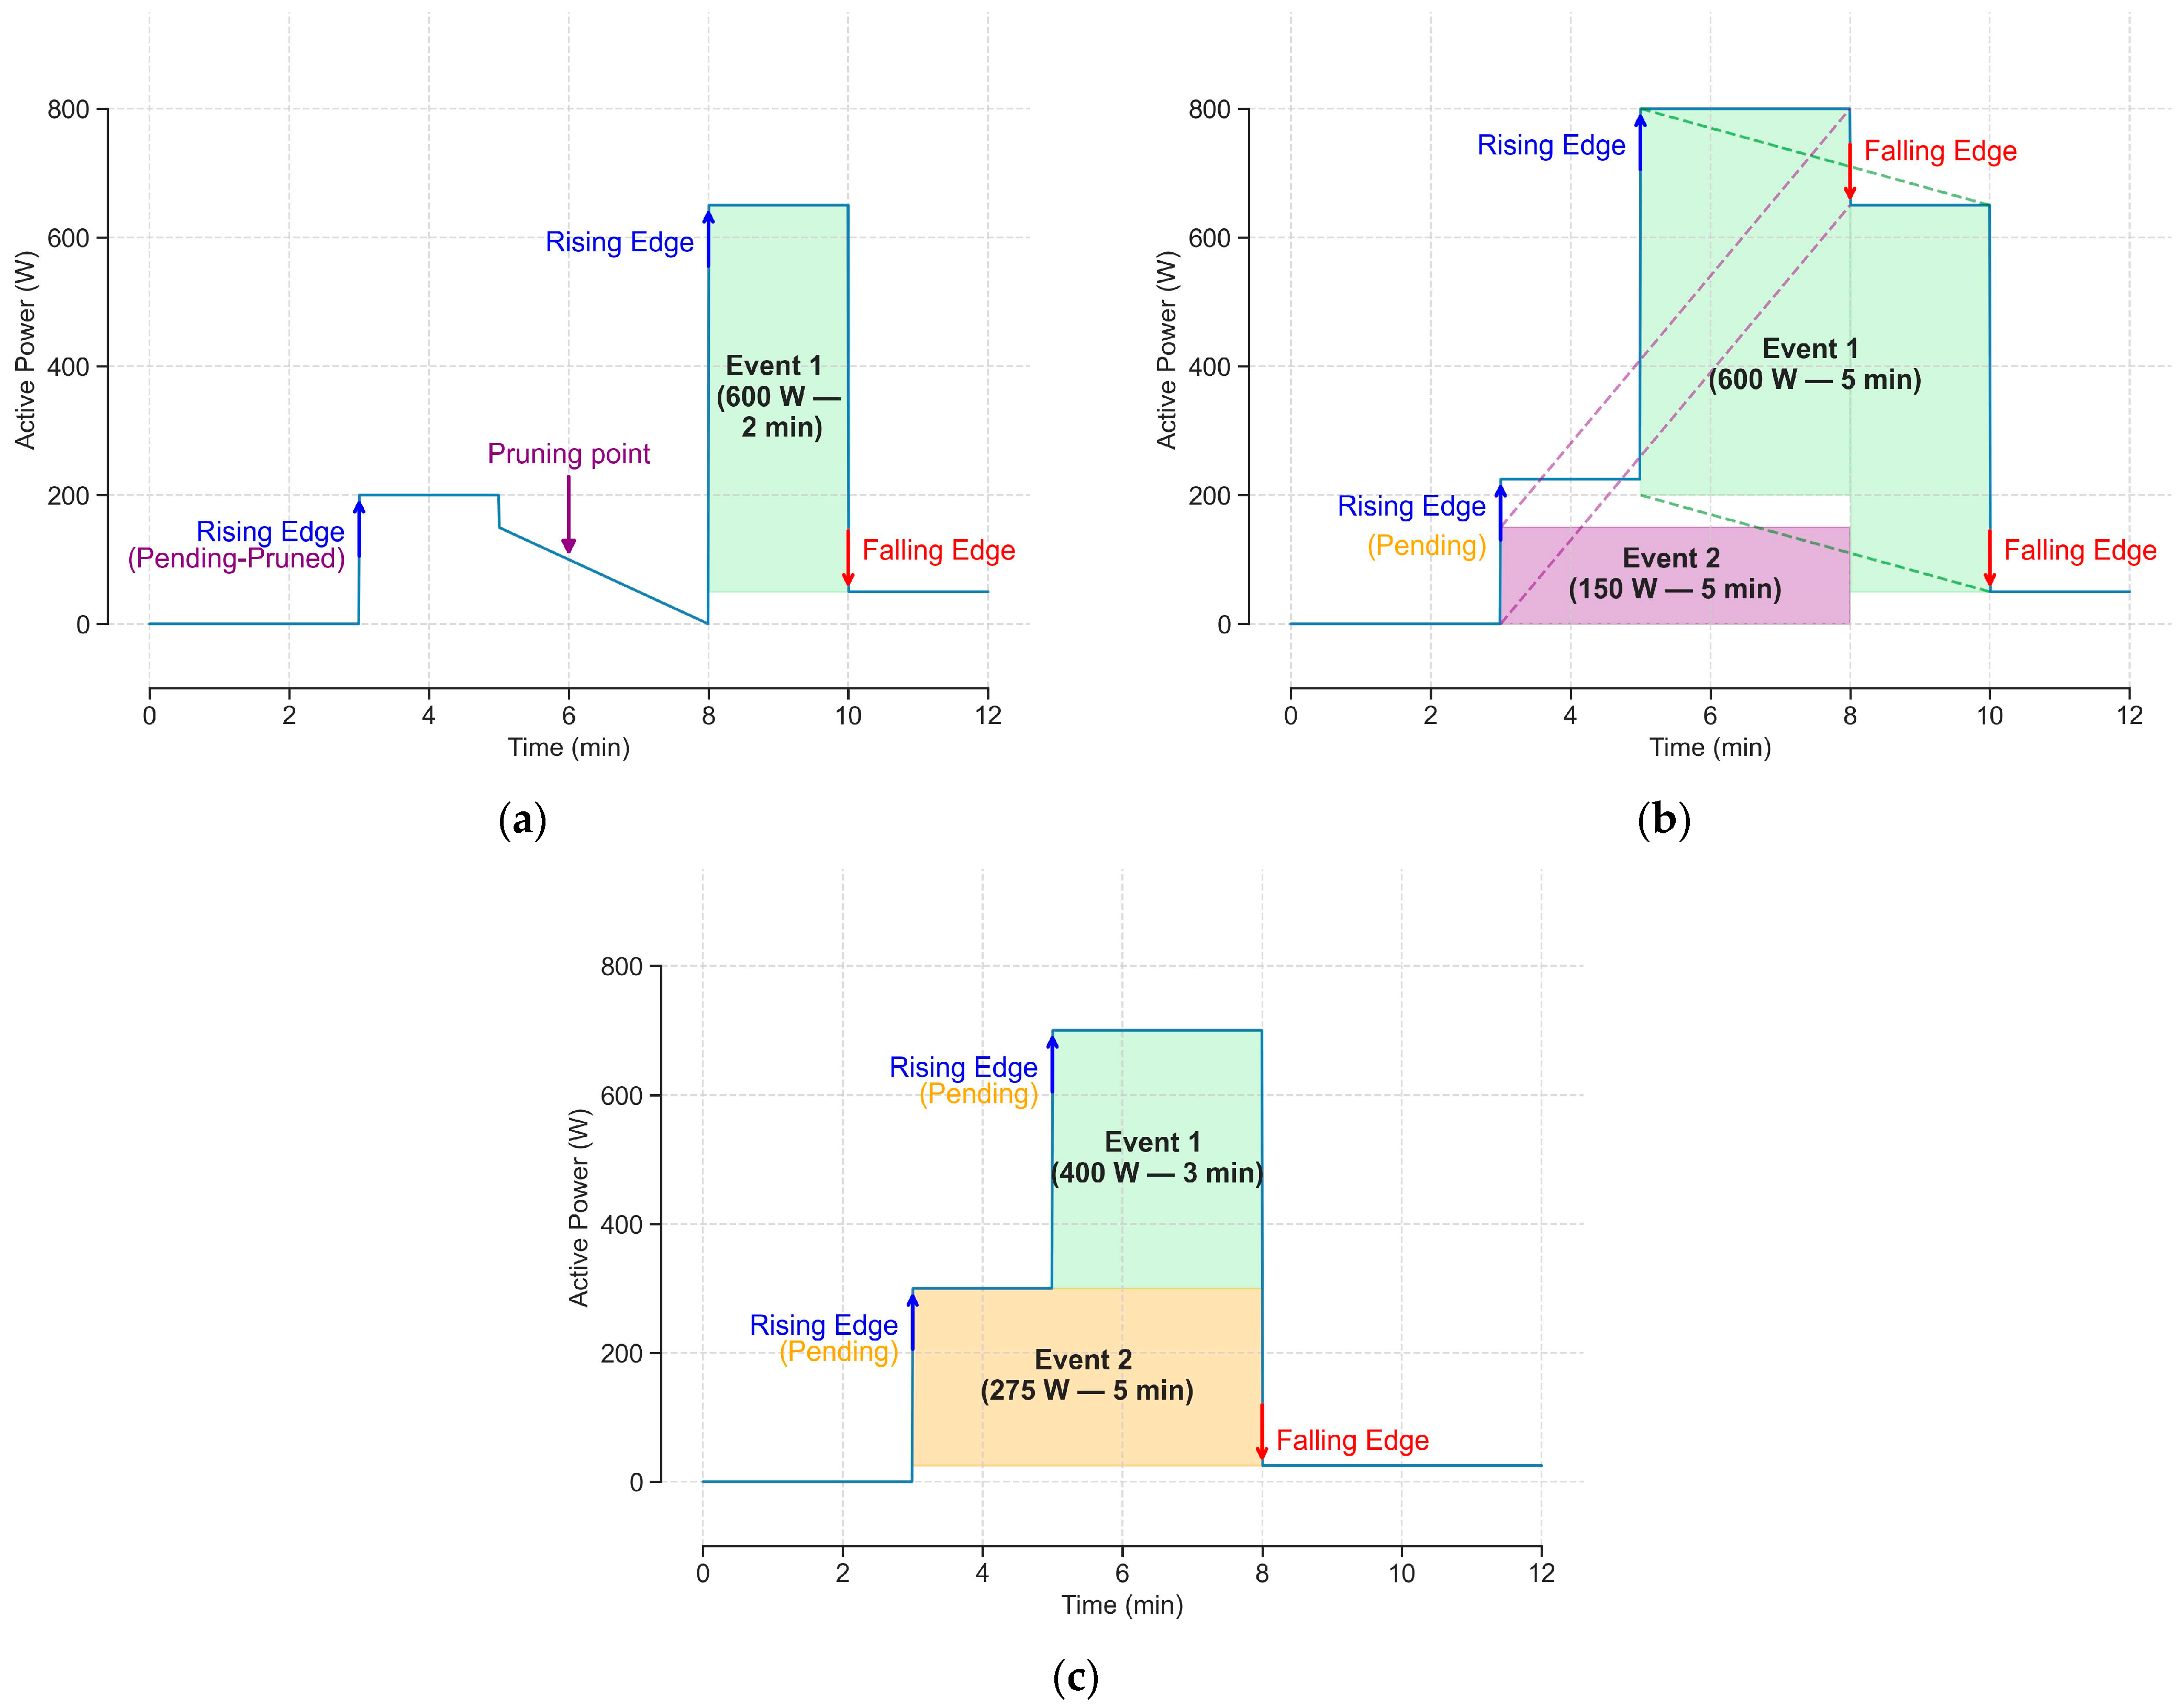
The pruning section will be executed after the matching section only if there is any edge in the pending rising list. This section will try to match older rising edges from the pending rising list with unused falling edges and will prune any old rising edge that is no longer useful, even if no match was found for it. We use two different pruning mechanisms. The first one aims to avoid events that are too long as it is unlikely that those events actually occurred. We have set this limit to be 2 h for lower consumption events (below 450 W) and 10 h for the others. The second pruning mechanism (Figure 3a) will prune a rising edge if the total consumption becomes too low (below 25% of its power increase) to create a reasonable event. In both cases, a last chance of matching before finally deleting the rising edge is provided but only taking into account any unused falling edge prior to the point in the time series that caused the pruning. Matching rising edges from the pending rising list is similar to the rules provided in the matching section; although, some tweaks are required. First, we will always evaluate the pending rising edges in a Last In, First Out (LIFO) manner. Second, for each pending rising edge, we will first evaluate whether one of the unused falling edges can be used to create an event. Furthermore, if there is only one pending rising edge pending that should be pruned and one unused falling edge before its pruning point (Figure 3b), we allow a slightly larger ±30% difference in power consumption between edges as, otherwise, neither of them will be used. Third, if no match is found, we will assess whether the sum of the consecutive rising edges from the pending list (up to the one currently being evaluated) can be matched with a unique falling edge (Figure 3c). Lastly, we evaluate if the rising edge can be matched with multiple falling edges, as conducted in the matching section. The pruning procedure is repeated as long as a pending rising edge is removed from the pending rising list. Once this procedure finishes, the algorithm continues iterating to the next rising edge and applying the matching section.
2.4. Appliance Detection
Once the events have been extracted by the event detector, the next step is to associate each event to an appliance. Our algorithm is capable of detecting 4 appliances: fridges; dishwashers; and appliances that must preserve a specific high temperature, such as the clothes dryer and the microwave. The following sub-sub-sections present the expert knowledge used to create an algorithm to detect each of these appliances.
2.4.1. Fridge Detection
Any food refrigeration appliance works according to the same principles of cooling through evaporation [25]. This process is controlled by a thermostat that will start the cooling process whenever the temperature detected is too hot and stop it once the desired temperature has been reached. This makes food refrigeration appliances be active periodically, even when there is no human activity. This is clearly displayed, among other ideas, in Figure 4, where the daily load signature of two refrigerators from the tracebase dataset [26] is downsampled from 1-s to 1-min intervals. We can observe how transients can affect the NILM process in the upper plot. Transients (in this context) are situations in which an appliance very briefly consumes more or less power when it is transitioning from an operational steady state to another (for example, the fridge controller starting or finishing the refrigeration cycle). This situation is manageable for our proposal as the event detection algorithm will generally divide these situations into two different events. In the lower plot, we can also observe that there are several cycles that are longer than usual. This is expected behavior whenever the household occupants frequently open the fridge door [27], making the interior hotter and requiring more time to reach the programmed temperature.
Algorithm 1 is used to disaggregate the fridge from the aggregated signal. The default values proposed for each parameter of the algorithm are available in Table 1. The algorithm starts by extracting all events that do not overlap, are below the maximum power consumption allowed for the fridge, and last a reasonable amount of time for a fridge cycle. By looking at non-overlapping events, we aim to detect those cycles when there is no activity at home; thus, there should be less variance between cycles. If enough of these cycles are found, we take the median of their events’ power and duration and use them to initially mark any event that is in a range around the median power and has a reasonable cycle length compared to the fridge events (Lines 1–9). Furthermore, we include three optimizations to improve the labeling of fridge events. These are the following:
- If there are any situations in which two events start or finish simultaneously, the other edge is one minute apart, and the sum of power respects the rules for length and duration described previously, we also mark them as a fridge event (Line 10). This is undertaken to manage possible transients at the end of the cycle;
- The second optimization (Line 11) allows the selection of an event with a slightly higher difference in power consumption if only one suitable event is found in any instance in which too much time has passed between consecutive fridge events;
- Lastly, the third optimization (Lines 12–16) manages situations in which multiple fridge events have been found overlapping with each other, preserving those that are more likely to be the real ones.
| Algorithm 1. Fridge detection and labeling optimizations | |||
| Input: | |||
| Output:} found. | |||
| 1: | nonOverlappingEvents = Extract from eventList all events that do not overlap with any other event. | ||
| 2: | For event in nonOverlappingEvents: | ||
| 3: | If and | ||
| 4: | Append event to validEvents | ||
| 5: | If size (validEvents) | ||
| 6: | = median (validEvents.P); median (validEvents.t); | ||
| 7: | Else: | ||
| 8: | return None (fridge was not found) | ||
| 9: | fridgeEvents = all events from nonOverlappingEvents that last and consume | ||
| 10: | Add to fridgeEvents all events that either start or finish simultaneously; their sum and duration are between the boundaries described in the previous line and do not overlap with a previous fridgeEvent. | ||
| 11: | If the time between two fridgeEvents is longer than the median and there is only one event that can be a fridge event if in Line 9 was increased by we add it | ||
| 12: | For each group of fridgeEvents g that overlap: | ||
| 13: | If size(g) == 2: | ||
| 14: | Keep the element with the closest duration to | ||
| 15: | Else: | ||
| 16: | Keep the combination of events with the closest energy (duration multiplied by the event power) to the median cycle energy () | ||
| 17: | Return fridgeEvents | ||
2.4.2. Dishwasher Detection
The dishwasher is another appliance that can be detected relatively easily if the events are detected accurately; although, our approach will only detect the two main power consumption events of a dishwashing program. Figure 5 shows the signature of different programs from four dishwashing appliances: dev_B81D04, dev_995BAC, and dev_B82F81 from the tracebase dataset; and one from House 1 of the Reference Energy Disaggregation Dataset (REDD) [28]. It should be noted that even though the fourth signature seems harder to detect, thanks to the capability of our method to disaggregate multiple events that start or finish simultaneously, two events will also be detected in this case (20–50 min and 70–90 min).
These two larger events correspond to the instances in which the dishwasher draws more power for heating purposes. A traditional dishwashing cycle consists of four different stages: prewashing, washing, rinsing, and drying. Most of the power consumption (the two events our algorithm looks for) comes from heating the water during the washing phase and heating fresh water again during the rinsing phase [29]. Depending on the model and program, additional events of large power consumption may be found; although, in most cases, they will have at least these two. Furthermore, in most dishwashers, the duration of these cycles is controlled by a timer. As such, every time the same dishwasher program is used, we should expect that these large consumption events and the time between both of them should always last the same.
The identification of the main cycles of the most frequent dishwashing program used is described in Algorithm 2. This algorithm takes, as input, the events found by the event detector that are still not labeled and the hyperparameters that control it (the default values for it are provided in Table 1). The algorithm starts by filtering out events that consume too little power or are unreasonably short or long to be one of the dishwasher cycles (Lines 1–4). Then, we also filter out events with similar power that appear too many times in a cycle as it is extremely likely that they are related to another appliance, such as a large freezer (Lines 5–6). Lastly, we compute all pairs of events that meet the restrictions (Lines 7–12) and group them (Lines 13–22), preserving only the most prevailing group if it appears at least a minimum number of times. Once the most frequent program has been found, the dishwashing events are labeled by repeating the algorithm from Lines 1 to 12 and marking all sequences of events that are at most in the range of in power and in time from the respective features from the most frequent dishwashing program found.
| Algorithm 2. Dishwasher program detection | |||||
| Input: | |||||
| Output: Most frequent dishwashing program { | |||||
| 1: | validList = [] (empty list) | ||||
| 2: | For event in eventList: | ||||
| 3: | If and : | ||||
| 4: | Append to validEvents | ||||
| 5: | Add to each event a new variable “count” that counts the number of validEvents in a range that happen in less than an hour | ||||
| 6: | Remove all events with count equal or superior to | ||||
| 7: | validTuples = [] | ||||
| 8: | For in eventList: | ||||
| 9: | For in eventList: (only events that start after the end of ) | ||||
| 10: | = start of end of | ||||
| 11: | If ( and : | ||||
| 12: | to validTuples | ||||
| 13: | groupsFound = [] | ||||
| 14: | For in validTuples: | ||||
| 15: | If size(groupsFound) == 0: | ||||
| 16: | to groupsFound | ||||
| 17: | Else: | ||||
| 18: | For in groupsFound: | ||||
| 19: | If are in range of and times have at most a difference of minutes with | ||||
| 20: | as the mean of all previous validTuples in the group and increase by 1. | ||||
| 21: | break | ||||
| 22: | Return or nothing if | ||||
2.4.3. Other Thermostat-Based Appliances
Another common signature found in the aggregated signal downsampled to 1 min is the presence of multiple contiguous spikes of energy of short durations, on many occasions with a starting cycle longer than the spikes. This is a common situation for many heat-based appliances that require one start cycle to reach the desired temperature and then have additional cycles to maintain the temperature within reasonable ranges. Appliances, such as clothes dryers, washing machines, irons, or ovens, present this type of signature [30], making it extremely difficult to differentiate them without any user-provided feedback. Figure 6 illustrates this situation for load signatures from an oven, an iron, and a clothes dryer. The same clothes dryer is displayed with a 1-min and 1-s granularity and displays one of the additional challenges that low-granularity sensors have with this type of signature as multiple spikes can appear as a unique cycle or may be completely missing for this signature.
Algorithm 3 finds the most frequent power for any spike-based appliance. The algorithm starts by iterating over all events that have not been assigned to any appliance that has consumed at least a minimum amount of power (Lines 1–5). Then, we iterate over all other events that start after the end of the previous event and add them to the spikes chain if they are within a range of the original event power consumption (Lines 6–11). This process ends when too much time has passed without a new spike. Then, we add the sequence to the list of valid sequences if the number of consecutive spikes exceeds a minimum threshold (Lines 12–13). For comparative purposes, in the rest of the paper, we have assumed that the most frequently used appliance of this style is the washing machine or a clothes dryer. Once the power has been found, the algorithm from Lines 1–13 is used to mark the events that belong to the washing/drying appliance using the median power found instead of .
| Algorithm 3. Spike-based appliance detection | |||||
| Input: | |||||
| Output: Most frequent spike-based appliance median power consumption | |||||
| 1: | validSpikes = [] (empty list) | ||||
| 2: | For event in eventList: (only events that are yet to be assigned to an appliance) | ||||
| 3: | If | ||||
| 4: | mySpikes = [] (empty list) | ||||
| 5: | lastEnd = .end | ||||
| 6: | For event in eventList: (only events that start after the end of ): | ||||
| 7: | If start–lastEnd > | ||||
| 8: | break | ||||
| 9: | Else If | ||||
| 10: | lastEnd = .end | ||||
| 11: | Append to mySpikes | ||||
| 12: | If size (mySpikes) : | ||||
| 13: | Append mySpikes to validSpikes | ||||
| 14: | If size (validSpikes) : | ||||
| 15: | Return median (validSpikes) | ||||
2.4.4. Microwave Detection
The last appliance we will disaggregate is the microwave oven. The microwave oven has become a staple appliance in most modern households. It is frequently used not only for cooking but also for quickly heating milk or water, reheating food, or heating pre-made food. Since it is mostly used in short periods, in many cases, even less than 1 min, there will be instances in which the microwave will not be present in the aggregated signal even though it was used. However, the microwave usually presents a signal that is denoted by a short spike in power consumption. A typical microwave oven for a household can draw a wide range of power while working depending on the power used to heat the food and the volume of the microwave. Therefore, in order to detect the microwave, we look at any short event (up to minutes) that is yet to be labeled in a range between and , removing any instances in which they may be a transient and making sure they are not part of a sequence of spikes from other thermostat-based appliances. If there are at least instances of spikes of this kind, we take the median as the usual power draw of the microwave and will label, as microwave, any element that is not part of a spike chain, as long as they are in a range of of the expected value.
2.5. Validation Methodology
To evaluate how well our algorithm performs, we made use of the Reference Energy Disaggregation Dataset downsampled to a 1-min granularity. This dataset contains a few weeks of energy consumption information from six US houses and has been widely used to evaluate most NILM algorithms. The dataset provides information about the aggregated power consumption and provides a detailed disaggregation with only a relatively small unknown load. We selected this dataset as the first three houses had information about most of the appliances our algorithm can detect, with a relatively small amount of missing data. Note that we did not compare our algorithm with any other proposal as, to the best of our knowledge, there is no other algorithm capable of disaggregating and labeling energy consumption without additional information. As our algorithm is completely unsupervised, all data from each house were used for evaluation, with the exception of any time period in which the aggregated signal was missing.
3. Results
3.1. Evaluation Metrics
To evaluate the NILM disaggregation in each household, we have used the classification metrics generally used in this field: Precision (Equation (1)), Recall (Equation (2)), and the F1-Score (Equation (3)).
The Precision (PR) measures how many instances in which the model determined an appliance was running were actually right:
The Recall (RE), also referred to as sensitivity, measures how many times the model detected an appliance running out of all instances in the data where the appliance was running:
Lastly, the F1-Score (F1) is a metric that combines the previous ones to provide a single metric that weights precision and recall in a balanced way:
For all these formulas, True Positives (TP) are the amounts of time in which an appliance was running and an algorithm detected it as running, False Positives (FP) denote all instances in which an appliance was not running but the algorithm detected it as running, True Negatives (TN) are instances in which the appliance was not being used and the algorithm detected the appliance was not running, and False Negatives (FN) denote instances in which the algorithm did not detect the appliance although it was running. Thus, the use of these metrics provides a more nuanced evaluation of the algorithm’s performance, taking into account the trade-offs between true positives, false positives, true negatives, and false negatives.
3.2. Disaggregation Accuracy in Each Household Evaluated
Table 2 presents the results obtained by the algorithm for the REDD’s House 1. This house contains information about energy consumption from 18 April 2011 to 24 May 2011 with four periods of consecutive days where the consumption data are missing. The proposed algorithm provided the results for this house in 2.22 s. All appliances were available in the house and used in this time frame. On one hand, the fridge was disaggregated with great accuracy, obtaining an F1-Score of 88.61%. On the other hand, the dishwasher produced a really bad F1-Score of 22.6% with 100% precision, implying that every time the algorithm marked something as dishwasher, it was correct. This result can be easily explained as our algorithm can only detect the dishwasher program during the heating phases. Therefore, the minutes corresponding to the other phases increase significantly the number of false negatives. However, the high precision obtained shows the usefulness of our algorithm in detecting the general power consumption and duration of the dishwasher cycle. A similar situation can be observed for the washer/dryer with high precision but mediocre recall due to all the minutes the washing/drying program is working without using the heating component. Finally, the microwave provided only mediocre results, with an F1-Score below 60% and precision and recalls around that range.
Table 3 presents the results for House 2. Information about energy consumption in this house is provided between 18 April 2011 and the first hours of 2 May 2011 with no missing data. In this house, the proposed method took 1.52 s to provide the results. Additionally, a few hours from 22 May are also available. In this house, although there is a submeter for the washer/dryer appliance, the measured value never went over 9 W, indicating that it was never used or there was some misconfiguration. Similar to House 1, the fridge was disaggregated accurately with an F1-Score of 88.78%. The dishwasher still provided, again, perfect precision and a better recall in comparison with House 1, which was to be expected since most of the programs/models used in House 2 had a lower number of minutes without using the heating component. At last, the microwave provided an even worse F1-Score in this case as there were more instances in which the microwave was not detected.
Finally, Table 4 provides the results for House 3, where the proposed method provided the disaggregation after 4.96 s. Information about energy consumption in this house was available between 17 April 2021 and 27 May 2021, with multiple periods of missing data, most notably the period from 28 April 2021 to 17 May 2021. This was the first house in which our algorithm did not detect an existing appliance, the dishwasher of this house, showing one of the limitations of the proposed algorithm. In this case, the program used only used one major heating cycle; thus, this dishwasher program could not be detected. For the other appliances, we saw a relatively good disaggregation of the fridge, although slightly worse than in other houses; the washer/dryer was disaggregated perfectly when detected with the expected false negatives due to the time it was working but not using the heating component and the microwave provided, once again, only mediocre results.
3.3. Real-Life Applications
Overall, even though the disaggregation provided by our algorithm is not perfect, it is still, to the best of our knowledge, the only algorithm capable of providing high-quality disaggregation without using any additional kind of supervised information. The primary constraint of our algorithm lies in its reliance on the identification of appliances based on their consumption patterns. Consequently, appliances that exhibit no discernible pattern or have an unknown pattern will not be effectively identified by our algorithm. Despite this limitation, the algorithm demonstrates proficiency in detecting at least the four appliances that have been studied, utilizing the available information. The simplest application of the proposed algorithm is the creation of visualizations that can help both customers and providers to understand the energy consumption of each household, as can be seen in Figure 7, where the disaggregation conducted by the proposed algorithm for the REDD’s House 1 is displayed. Another simple example would be to use them as a prior step for other NILM algorithms that rely on supervised knowledge of the appliance energy consumption. However, the most interesting applications of this algorithm come from its ability to learn general characteristics from appliances, such as their power use in each cycle and their duration. For example, the usual power consumption and duration of refrigeration cycles could be recorded periodically to detect any possible malfunctioning of the refrigerator since, as it deteriorates, it is frequent that the cycles become longer. This is easily detectable in our algorithm as this duration is recorded during the detection process and, if cycles become too long, the algorithm will suddenly fail to recognize the fridge. Thus, notifying the customer after verifying this kind of behavior can help diminish the economic impact of appliance faults. Another possible application of the algorithm would be to use it to schedule the use of some appliances, such as the dishwasher, to lower the energy cost of using them. This would be particularly useful in Internet of Things (IoT) scenarios in which the appliance may be scheduled to run at a specific hour and optimized according to the needs of the customer. Furthermore, since the algorithm has low computational requirements, it can be fully implemented in an Edge device at the final customers’ homes to completely respect their privacy.
4. Conclusions
This work presented a new methodology to disaggregate energy consumption from a few selected appliances without the use of additional information, unlike previous work in the field that required information about the nominal power of the appliances or information about the household occupants to identify the appliances. The methodology relied on the development of a new algorithm for event detection and the use of export knowledge to identify each appliance.
The need for a new event detection algorithm came due to the fact that previous clustering-based approaches were limited to matching edges with a balance between power consumption and time duration, as was conducted in [21]. However, this approach is not ideal for data with low sampling rates as it will be unable to differentiate instances in which multiple events start or end simultaneously. Therefore, we created a new event-based detection algorithm that, as explained in Section 2.3, took into account these situations to provide a better disaggregation into events. Once this disaggregation was completed, the algorithms developed for each appliance were used to identify them without having to rely on any additional information. This is a major step towards truly unsupervised disaggregation as the algorithm can be used directly on household aggregated consumption without the need to tune any parameters nor the need to know any information about the customer’s household, providing a completely non-intrusive approach. This comes with the drawback of limited accuracy and the fact that only appliances that exhibit consumption patterns that can help us identify them can be detected and properly labeled.
The evaluation of the proposed methodology utilized data from three houses within the REDD dataset. The results demonstrated a high accuracy in fridge disaggregation and showcased the algorithm’s ability to learn appliance characteristics, such as the power and duration of dishwasher heating cycles, in other cases. These findings underscore the potential practical applications of the proposed approach.
Future works may evaluate the incorporation of the proposed methodology in other NILM algorithms and their application in IoT/Edge scenarios for tasks such as preventive maintenance or scheduling.
Author Contributions
Conceptualization, D.C.-R., L.G.B.R., J.R.S.I. and M.C.P.; Methodology, D.C.-R., L.G.B.R., J.R.S.I. and M.C.P.; Software, D.C.-R., L.G.B.R., J.R.S.I. and M.C.P.; Validation, D.C.-R., L.G.B.R., J.R.S.I. and M.C.P.; Writing—original draft, D.C.-R., L.G.B.R. and M.C.P.; Writing—review & editing, D.C.-R., L.G.B.R., J.R.S.I. and M.C.P.; Supervision, M.C.P.; Funding acquisition, J.R.S.I. All authors have read and agreed to the published version of the manuscript.
Funding
We acknowledge financial support from Cuerva Energía, with funding acquired through incentive line “Redes Inteligentes de la Agencia Andaluza de la Energía”—Expedient 11303205-A1.B) Smart Grids Developments; and Ministerio de Ciencia e Innovación (Spain) (Grant PID2020-112495RB-C21 funded by MCIN/AEI/10.13039/501100011033).
Institutional Review Board Statement
Not applicable.
Informed Consent Statement
Not applicable.
Data Availability Statement
The data presented in this study used to be openly available at http://redd.csail.mit.edu/ (accessed on 2 March 2022). Copies of the dataset used in this study are available on request from the corresponding author.
Conflicts of Interest
The authors declare no conflicts of interest.
References
- Abdeen, A.; Kharvari, F.; O’Brien, W.; Gunay, B. The Impact of the COVID-19 on Households’ Hourly Electricity Consumption in Canada. Energy Build. 2021, 250, 111280. [Google Scholar] [CrossRef]
- Khan, I. A Survey-Based Electricity Demand Profiling Method for Developing Countries: The Case of Urban Households in Bangladesh. J. Build. Eng. 2021, 42, 102507. [Google Scholar] [CrossRef]
- Liu, Y.; Ma, J.; Xing, X.; Liu, X.; Wang, W. A Home Energy Management System Incorporating Data-Driven Uncertainty-Aware User Preference. Appl. Energy 2022, 326, 119911. [Google Scholar] [CrossRef]
- Rashid, H.; Singh, P.; Stankovic, V.; Stankovic, L. Can Non-Intrusive Load Monitoring Be Used for Identifying an Appliance’s Anomalous Behaviour? Appl. Energy 2019, 238, 796–805. [Google Scholar] [CrossRef]
- Green, D.; Kane, T.; Kidwell, S.; Lindahl, P.; Donnal, J.; Leeb, S. NILM Dashboard: Actionable Feedback for Condition-Based Maintenance. IEEE Instrum. Meas. Mag. 2020, 23, 3–10. [Google Scholar] [CrossRef]
- Hart, G.W. Prototype Nonintrusive Appliance Load Monitor, MIT Energy Laboratory Technical Report, and Electric Power Research Institute Technical Report. 1985.
- Hart, G.W. Nonintrusive Appliance Load Monitoring. Proc. IEEE 1992, 80, 1870–1891. [Google Scholar] [CrossRef]
- Wu, Z.; Wang, C.; Peng, W.; Liu, W.; Zhang, H. Non-Intrusive Load Monitoring Using Factorial Hidden Markov Model Based on Adaptive Density Peak Clustering. Energy Build. 2021, 244, 111025. [Google Scholar] [CrossRef]
- Wu, Z.; Wang, C.; Zhang, H.; Peng, W.; Liu, W. A Time-Efficient Factorial Hidden Semi-Markov Model for Non-Intrusive Load Monitoring. Electr. Power Syst. Res. 2021, 199, 107372. [Google Scholar] [CrossRef]
- Kumar, P.; Abhyankar, A.R. A Time Efficient Factorial Hidden Markov Model Based Approach for Non-Intrusive Load Monitoring. IEEE Trans. Smart Grid 2023, 14, 3627–3639. [Google Scholar] [CrossRef]
- Kolter, J.; Batra, S.; Ng, A. Energy Disaggregation via Discriminative Sparse Coding. In Proceedings of the Advances in Neural Information Processing Systems, Vancouver, Canada, 6–9 December 2010; Curran Associates, Inc.: Red Hook, NY, USA, 2010; Volume 23. [Google Scholar]
- Elhamifar, E.; Sastry, S. Energy Disaggregation via Learning “Powerlets” and Sparse Coding. In Proceedings of the Twenty-Ninth AAAI Conference on Artificial Intelligence, Austin, TX, USA, 25–30 January 2015; AAAI Press: Austin, TX, USA, 2015; pp. 629–635. [Google Scholar]
- Singh, S.; Majumdar, A. Deep Sparse Coding for Non–Intrusive Load Monitoring. IEEE Trans. Smart Grid 2018, 9, 4669–4678. [Google Scholar] [CrossRef]
- Singhal, V.; Maggu, J.; Majumdar, A. Simultaneous Detection of Multiple Appliances From Smart-Meter Measurements via Multi-Label Consistent Deep Dictionary Learning and Deep Transform Learning. IEEE Trans. Smart Grid 2019, 10, 2969–2978. [Google Scholar] [CrossRef]
- Faustine, A.; Pereira, L.; Bousbiat, H.; Kulkarni, S. UNet-NILM: A Deep Neural Network for Multi-Tasks Appliances State Detection and Power Estimation in NILM. In Proceedings of the 5th International Workshop on Non-Intrusive Load Monitoring, New York, NY, USA, 18 November 2020; Association for Computing Machinery: New York, NY, USA, 2020; pp. 84–88. [Google Scholar]
- Zhou, X.; Li, S.; Liu, C.; Zhu, H.; Dong, N.; Xiao, T. Non-Intrusive Load Monitoring Using a CNN-LSTM-RF Model Considering Label Correlation and Class-Imbalance. IEEE Access 2021, 9, 84306–84315. [Google Scholar] [CrossRef]
- Kaselimi, M.; Doulamis, N.; Voulodimos, A.; Doulamis, A.; Protopapadakis, E. EnerGAN++: A Generative Adversarial Gated Recurrent Network for Robust Energy Disaggregation. IEEE Open J. Signal Process. 2021, 2, 1–16. [Google Scholar] [CrossRef]
- Liao, J.; Elafoudi, G.; Stankovic, L.; Stankovic, V. Non-Intrusive Appliance Load Monitoring Using Low-Resolution Smart Meter Data. In Proceedings of the 2014 IEEE International Conference on Smart Grid Communications (SmartGridComm), Venice, Italy, 3–6 November 2014; pp. 535–540. [Google Scholar]
- Giri, S.; Bergés, M. An Energy Estimation Framework for Event-Based Methods in Non-Intrusive Load Monitoring. Energy Convers. Manag. 2015, 90, 488–498. [Google Scholar] [CrossRef]
- Alcalá, J.; Ureña, J.; Hernández, Á.; Gualda, D. Event-Based Energy Disaggregation Algorithm for Activity Monitoring From a Single-Point Sensor. IEEE Trans. Instrum. Meas. 2017, 66, 2615–2626. [Google Scholar] [CrossRef]
- Zhao, B.; Stankovic, L.; Stankovic, V. On a Training-Less Solution for Non-Intrusive Appliance Load Monitoring Using Graph Signal Processing. IEEE Access 2016, 4, 1784–1799. [Google Scholar] [CrossRef]
- Zhao, B.; He, K.; Stankovic, L.; Stankovic, V. Improving Event-Based Non-Intrusive Load Monitoring Using Graph Signal Processing. IEEE Access 2018, 6, 53944–53959. [Google Scholar] [CrossRef]
- Li, X.; Zhao, B.; Luan, W.; Liu, B. A Training-Free Non-Intrusive Load Monitoring Approach for High-Frequency Measurements Based on Graph Signal Processing. In Proceedings of the 2022 7th Asia Conference on Power and Electrical Engineering (ACPEE), Hangzhou, China, 15–17 April 2022; pp. 859–863. [Google Scholar]
- Holweger, J.; Dorokhova, M.; Bloch, L.; Ballif, C.; Wyrsch, N. Unsupervised Algorithm for Disaggregating Low-Sampling-Rate Electricity Consumption of Households. Sustain. Energy Grids Netw. 2019, 19, 100244. [Google Scholar] [CrossRef]
- Mascheroni, R.; Salvadori, V. Household Refrigerators and Freezers. In Handbook of Frozen Food Processing and Packaging; CRC PRESS: Boca Raton, FL, USA, 2011; pp. 253–272. [Google Scholar]
- Reinhardt, A.; Baumann, P.; Burgstahler, D.; Hollick, M.; Chonov, H.; Werner, M.; Steinmetz, R. On the Accuracy of Appliance Identification Based on Distributed Load Metering Data. In Proceedings of the 2012 Sustainable Internet and ICT for Sustainability (SustainIT), Pisa, Italy, 4–5 October 2012; IEEE: Toulouse, France, 2012; pp. 1–9. [Google Scholar]
- Liu, D.-Y.; Chang, W.-R.; Lin, J.-Y. Performance Comparison with Effect of Door Opening on Variable and Fixed Frequency Refrigerators/Freezers. Appl. Therm. Eng. 2004, 24, 2281–2292. [Google Scholar] [CrossRef]
- Kolter, J.; Johnson, M. REDD: A Public Data Set for Energy Disaggregation Research. Artif Intell 2011, 25, 59–62. [Google Scholar]
- Bengtsson, P.; Berghel, J.; Renström, R. A Household Dishwasher Heated by a Heat Pump System Using an Energy Storage Unit with Water as the Heat Source. Int. J. Refrig. 2015, 49, 19–27. [Google Scholar] [CrossRef]
- Issi, F.; Kaplan, O. The Determination of Load Profiles and Power Consumptions of Home Appliances. Energies 2018, 11, 607. [Google Scholar] [CrossRef]
Figure 1.
Flowchart of the proposed algorithm.

Figure 2.
Examples of events created in the matching phase. (a) Match between consecutive edges, (b) Match with multiple falling edges, (c) No falling edge available after rising edge.
Figure 2.
Examples of events created in the matching phase. (a) Match between consecutive edges, (b) Match with multiple falling edges, (c) No falling edge available after rising edge.

Figure 3.
Examples of events created in the pruning phase. (a) Pruning rising edge, (b) Additional match threshold, (c) Multiple rising edges with one falling edge.
Figure 3.
Examples of events created in the pruning phase. (a) Pruning rising edge, (b) Additional match threshold, (c) Multiple rising edges with one falling edge.

Figure 4.
Load signature from two refrigerators during a day (dev_76C07C AND dev_D32131) taken from the tracebase dataset.
Figure 4.
Load signature from two refrigerators during a day (dev_76C07C AND dev_D32131) taken from the tracebase dataset.

Figure 5.
Load signatures from four different dishwashers taken from the tracebase dataset and REDD.
Figure 5.
Load signatures from four different dishwashers taken from the tracebase dataset and REDD.

Figure 6.
Load signature from an oven from the REDD and an iron and clothes dryer from tracebase.

Figure 7.
Appliance disaggregation in the first two weeks of REDD House 1 with a zoomed-in version for 23 April 2011.
Figure 7.
Appliance disaggregation in the first two weeks of REDD House 1 with a zoomed-in version for 23 April 2011.


Table 1.
List of all hyperparameter default values.
| Hyperparameter | Value | Explanation |
|---|---|---|
| 450 W | Maximum power of events used for fridge detection | |
| 7 min | Minimum length of each fridge cycle | |
| 90 min | Maximum length of each fridge cycle | |
| 100 | Minimum number of non-overlapping fridge events to consider it detected | |
| 0.25 | Maximum percentual threshold for fridge events | |
| 0.05 | Additional threshold for fridge events if too much time has passed | |
| 750 W | Minimum power consumption for dishwasher events | |
| 10 min | Minimum length of each cycle of dishwashing programs | |
| 90 min | Maximum length of each cycle of dishwashing programs | |
| 5 | Minimum number of times the dishwashing program must be detected | |
| 5 | Maximum number of similar dishwashing cycles allowed in one program | |
| 0.25 | Maximum percentual threshold for dishwashing cycles power | |
| 3 min | Maximum time difference between new events and the detected dishwashing program | |
| 750 W | Minimum power of events for a spike-based appliance | |
| 7 min | Maximum time between two consecutive spike events | |
| 5 | Minimum number of full spike-based events to detect a spike-based appliance | |
| 6 | Minimum number of consecutive spikes to consider it a full spike-based event | |
| 0.25 | Percentual difference allowed between a spike-based appliance’s event | |
| 7 min | Maximum length of microwave events | |
| 10 | Minimum number of times the microwave must be detected | |
| 0.1 | Percentual difference allowed between microwave events | |
| 600 W | Minimum power of events for microwave detection | |
| 2000 W | Maximum power of events for microwave detection |
Table 2.
Results for our algorithm in REDD House 1.
| TP | FP | TN | FN | RE | PR | F1 | |
|---|---|---|---|---|---|---|---|
| Fridge | 5539 | 422 | 19,337 | 1002 | 0.9292 | 0.8468 | 0.8861 |
| Dishwasher | 125 | 0 | 25,319 | 856 | 0.1274 | 1.0 | 0.2260 |
| Microwave | 190 | 112 | 25,846 | 152 | 0.5555 | 0.6291 | 0.5901 |
| Washer/Dryer | 232 | 25 | 25,822 | 221 | 0.5121 | 0.9027 | 0.6535 |
Table 3.
Results for our algorithm in REDD House 2.
| TP | FP | TN | FN | RE | PR | F1 | |
|---|---|---|---|---|---|---|---|
| Fridge | 7457 | 440 | 10,793 | 1444 | 0.8377 | 0.9443 | 0.8878 |
| Dishwasher | 103 | 0 | 19,893 | 138 | 0.4274 | 1.0 | 0.5988 |
| Microwave | 36 | 2 | 19,986 | 110 | 0.2466 | 0.9474 | 0.3913 |
| Washer/Dryer | Not used in this house | ||||||
Table 4.
Results for our algorithm in REDD House 3.
| TP | FP | TN | FN | RE | PR | F1 | |
|---|---|---|---|---|---|---|---|
| Fridge | 7549 | 1228 | 14,219 | 1669 | 0.8189 | 0.8601 | 0.8390 |
| Microwave | 52 | 35 | 24,505 | 73 | 0.416 | 0.5977 | 0.5988 |
| Washer/Dryer | 350 | 0 | 23,633 | 682 | 0.3391 | 1.0 | 0.5065 |
| Dishwasher | Not detected | ||||||
Disclaimer/Publisher’s Note: The statements, opinions and data contained in all publications are solely those of the individual author(s) and contributor(s) and not of MDPI and/or the editor(s). MDPI and/or the editor(s) disclaim responsibility for any injury to people or property resulting from any ideas, methods, instructions or products referred to in the content. |
© 2024 by the authors. Licensee MDPI, Basel, Switzerland. This article is an open access article distributed under the terms and conditions of the Creative Commons Attribution (CC BY) license (https://creativecommons.org/licenses/by/4.0/).
Share and Cite
MDPI and ACS Style
Criado-Ramón, D.; Ruiz, L.G.B.; Iruela, J.R.S.; Pegalajar, M.C. A Novel Non-Intrusive Load Monitoring Algorithm for Unsupervised Disaggregation of Household Appliances. Information 2024, 15, 87. https://doi.org/10.3390/info15020087
AMA Style
Criado-Ramón D, Ruiz LGB, Iruela JRS, Pegalajar MC. A Novel Non-Intrusive Load Monitoring Algorithm for Unsupervised Disaggregation of Household Appliances. Information. 2024; 15(2):87. https://doi.org/10.3390/info15020087
Chicago/Turabian StyleCriado-Ramón, D., L. G. B. Ruiz, J. R. S. Iruela, and M. C. Pegalajar. 2024. "A Novel Non-Intrusive Load Monitoring Algorithm for Unsupervised Disaggregation of Household Appliances" Information 15, no. 2: 87. https://doi.org/10.3390/info15020087
Note that from the first issue of 2016, this journal uses article numbers instead of page numbers. See further details here.