
Sports Analytics: Data Mining to Uncover NBA Player Position, Age, and Injury Impact on Performance and Economics

School of Science and Technology, International Hellenic University, 57001 Thessaloniki, Greece
*
Author to whom correspondence should be addressed.
Information 2024, 15(4), 242; https://doi.org/10.3390/info15040242
Submission received: 13 March 2024
/
Revised: 14 April 2024
/
Accepted: 18 April 2024
/
Published: 21 April 2024
(This article belongs to the Special Issue New Information Communication Technologies in the Digital Era)
Abstract
:In the intersecting fields of data mining (DM) and sports analytics, the impact of socioeconomic, demographic, and injury-related factors on sports performance and economics has been extensively explored. A novel methodology is proposed and evaluated in this study, aiming to identify essential attributes and metrics that influence the salaries and performance of NBA players. Feature selection techniques are utilized for estimating the financial impacts of injuries, while clustering algorithms are applied to analyse the relationship between player age, position, and advanced performance metrics. Through the application of PCA-driven pattern recognition and exploratory-based categorization, a detailed examination of the effects on earnings and performance is conducted. Findings indicate that peak performance is typically achieved between the ages of 27 and 29, whereas the highest salaries are received between the ages of 29 and 34. Additionally, musculoskeletal injuries are identified as the source of half of the financial costs related to health problems in the NBA. The association between demographics and financial analytics, particularly focusing on the position and age of NBA players, is also investigated, offering new insights into the economic implications of player attributes and health.
1. Introduction and Background
Sports analytics has become an increasingly important tool for enhancing team performance and reducing costs within the fiercely competitive sports industry. This study examines NBA player performance data, employing a variety of data mining (DM) techniques to uncover significant trends and patterns. The insights gained offer valuable guidance for enhancing strategic decision-making, financial management, and tactical planning. It also identifies the key predictors of injury risk, underscoring the critical role of injury prevention and management strategies [1,2,3,4].
The core issue this research addresses are the methodological underpinnings of sports analytics, with a particular focus on data science. It utilizes principal component analysis (PCA) for feature selection, leveraging feature loadings to estimate injury costs alongside advanced basketball performance analytics. Players were categorized by age and position, and their data analyzed in conjunction with PCA-derived feature loadings to gauge their impact on earnings and performance. Despite the growing prevalence of data analytics in sports, the accuracy and effectiveness of these methods remain to be validated. Thus, the objective was to analyze NBA player data to identify patterns and trends that inform performance and injury risk, aiding in strategic decision-making, financial planning, and tactical execution. The methodology presented can guide future sports analytics research, ensuring the effective and accurate use of data science methods to boost team performance and success.
Sports, including basketball, are affected by variables such as age, position, and health, which influence performance and financial outcomes. This research applies DM techniques to analyze socioeconomic, demographic, and injury-related attributes in relation to basketball performance metrics. The extraction and analysis of sophisticated sports metrics yield insights that support decision makers in strategy, budgeting, tactics, and training to minimize risks and financial losses [5,6].
Athletes hold significant popularity beyond the sports sphere, affecting social, economic, and marketing activities. Enhanced player and team performance elevates the social and financial standing of all involved, highlighting the interconnectedness of success across these domains [7].
Sports clubs prioritize profit-making through competition wins and indirect means like advertising, attendance, player reputation, and partnerships. The integration of sports and business analytics aims to find a balance between victories and cost reduction. For example, one research exploits the optimal ticket price based on the city, team reputation and fan level of interest. Thus, the sports industry tries to combine sports analytics with business analytics in order to find the critical path between wins and cost reduction [6,8].
Big data analysis in basketball has shown the potential of economics and game theory in predicting trends across various domains, though accurately projecting such correlations remains challenging. Player and team momentum are called, in sports jargon, “hot/cold hand” and “hot/cold streak” in basketball and baseball, respectively. This momentum is derived from psychological, social, economic and form aspects. Nevertheless, studies have shown that it is difficult to accurately project these correlations [6,9,10]. Another research has found that athletes with high social ranking and reputation designate more “winners” and “losers” characteristics in their playing attitudes [11].
An athletic injury needs proper medical and recovery assistance for an athlete to return to action. Therefore, sports clubs must know that all parts of the service chain (doctors, physiotherapists, performance coaches, trainers, coaches, etc.) are required for each issue in correlation with appropriate financial analysis at the management level. Hence, injury impact should be seriously considered regarding team strategy, load, rest, and recovery management. Noteworthy sports and other combined analytics provided by microtechnology (such as training process, type of training, injury history, stress tolerance, recovery adaptation, psychological status and leadership skills) have financial implications [11,12,13].
The focus on sports by health and medical businesses since the 1990s highlights the growing economic returns from athlete care, from college to professional levels. Stakeholders in the sports industry play a crucial role in addressing performance-affecting issues, guiding athletes towards success. Sports industry stakeholders consist of doctors, performance coaches, physical trainers, physicians and others taking care of athletes, in order to address issues affecting their performance and lead them into success [11,14].
Studies indicate that effective sports data analysis can improve performance and have a positive economic impact. Sports ecosystems rely on data to glean insights, with media and betting companies increasingly utilizing sports analytics for evaluation and prediction [15,16]. In addition, media and betting companies increasingly tend to use sports analytics and advanced statistics through metrics, infographics and visualizations for evaluation and prediction purposes [17]. Resource management is crucial in the sports industry, with the challenge of hiring the best personnel at the lowest cost. Data analysis in talent management is key to maintaining this balance [18].
The following aims, objectives and corresponding contributions succinctly convey the primary goals of the research. By focusing on enhancing data analysis techniques, supporting strategic decisions in team management, and analyzing the financial implications of injuries, the research directly addresses the critical needs of decision makers in the sports industry.
- (i)
- Enhance Feature Selection and Data Preprocessing; Utilize PCA to refine feature selection with a focus on estimating the economic impact of injuries; Implement advanced data preprocessing techniques to minimize data noise and enhance the reliability of results, thereby providing decision makers with a refined understanding of the attributes that influence injury-related expenses in the NBA;
- (ii)
- Optimize Team Management and Performance Analysis; Employ clustering techniques to identify peak performance periods of players, based on age and position, in conjunction with advanced basketball performance analytics; This aims to support sports clubs in strategic budget allocation, player selection, rotation management, and fostering a clear strategic vision;
- (iii)
- Analyze Financial Implications of Health Pathologies and Injuries; Determine which health pathologies and injuries incur the most significant financial costs; Provide insights that assist decision makers in formulating strategies for game selection, training schedules, load management, and recovery processes to mitigate financial risks and optimize player health and performance.
This study employs DM methodologies to explore the economic and performance impacts of injuries in NBA players, offering scientific value by highlighting the financial losses from such injuries. By analyzing both economic and performance impacts, this research provides a comprehensive understanding of the effects of musculoskeletal injuries on players and teams, thereby informing injury prevention strategies and improving sports player health management.
This research involves the careful assembly and analysis of a comprehensive high-volume and complex dataset, encompassing a collection of player performance metrics, detailed injury records, and economic indicators spanning over two decades of NBA history. Leveraging DM techniques, including PCA for dimensionality reduction, and age group analysis for identifying patterns in player performance and injury data, our study explores the complex interplay between player attributes and their multifaceted effects on performance outcomes and financial implications. Such an approach allows for a depth of analysis, uncovering dynamics that have remained underexplored in the literature.
Notably, this study measures the financial impact of player injuries with adjustments for inflation and the real purchasing power of money. Through this perspective, domain experts can leverage how injuries influence not just the immediate financial landscape, but also the long-term economic sustainability of team operations. It recalibrates the financial burden of player injuries to account for inflation over time, ensuring that financial assessments remain accurate and relevant across different economic conditions. Meanwhile, it provides an insight into how injury-related expenditures affect a team’s purchasing power in the real terms of goods and services that can be acquired, considering the broader economic implications of these costs. By incorporating these insights into our analysis, we can more accurately quantify the economic impact of player injuries, considering the evolving economic environment and its effect on financial planning and management within NBA teams.
This innovative approach not only deepens our understanding of the economic dimensions of sports injuries, but also furnishes stakeholders with critical insights for making informed decisions that align with both current and future financial realities. By integrating these novel analytical tools into our methodology, we offer tangible, actionable insights that extend beyond academic inquiry to inform strategic decision-making in professional sports management. Thus, our research makes a significant leap forward in the application of data science to sports analytics, bridging the gap between theoretical models and practical applications. The introduction of novel and analytical techniques enriches the academic discourse on sports analytics, while also equipping practitioners with the data-driven strategies necessary to navigate the complexities of the modern NBA landscape.
The manuscript integrates classification and clustering methods to analyze NBA player data, with a focus on understanding the impacts of player demographics, injuries, and performance metrics on financial outcomes. This comprehensive approach showcases the manuscript’s methodological contributions to sports analytics, particularly in the innovative application of DM techniques to the field of basketball analytics. Overall, this work provides valuable insights which can inform injury prevention strategies and improve the management of sport player health.
1.1. Background
Athletes’ injuries are one of the biggest challenges in sports. Risk identification and assessment for this uncertain factor is not only crucial for the sport industry regarding rotation and team selection management, but most importantly because of its economic impact. Therefore, injury avoidance or limitation, and even accurate prediction, can lead to large cost savings and support performance improvement. Therefore, this manuscript examines the aid of sports analytics and DM in assessing age, players’ position and injury influence on finance and performance in basketball. The literature examined the benefits provided through sports injury analytics associated with performance, the effect of sports injuries and the identification of crucial injuries that have influenced performance in the NBA league over the last decade, 2010–2020. In addition, the research was enhanced with a wider experimental analysis at the peak of performance, based on the age and the reach of the maximum salary in the timespan 1996 to 2020.
Sport clubs, technical staff, and owners organize their roster and strategy based on the team budget. However, defeats do not only negatively influence player performance, but also teams. It is significant for a team to show proactiveness in terms of potential health issues. An injury or health problem may not only affect player availability, impacting team performance, but also financial loss. Regrettably, health issues and pathologies are uncertain events, difficult to predict. Injury avoidance implies lower costs and more stability in a team roster. Therefore, appropriate team selection by technical staff, involving the monitoring and tracking of load and rest management during matches and training, can lead to player and team performance optimization. Biometric characteristics (such as speed, agility, height, weight, and body mass), demographics (such as age, country, and college), nutrition, training pace, psychology, marketing strategy and social life are significant in terms of performance and salary expectations. Uncertainty minimization in every sport can lead to cost reduction and efficiency and productivity optimisation [19].
1.1.1. Data Science Algorithms and Data Mining Techniques for Sports Analytics
Sports analytics emerges as an essential tool in the sports industry. It combines data science and information technology (IT). It is the scientific field that uses current and historical data to measure performance, forecast and provide a competitive advantage for decision-making [20]. Sports teams and sports data scientists use DM methodologies either for interpretation or clustering purposes in various fields, such as tactics, strategy and financial/budgeting management for the team and roster selection in the short- or long-term according to the team’s vision [1].
Sports industry experts including players, performance coaches, scouters, club owners, managers, health staff, and technical staff seriously consider any advanced statistics supporting their analysis. Especially at the top-level, every detail can bounce a possible positive effect to player and team performance. Sports analytics use DM and machine learning (ML) techniques and algorithms in order to understand data in more depth, create self-explanatory visualisations and help the senior management in decision-making and storytelling behind raw data [8,21].
Sports data analysts should also validate and perform data pre-processing to deal with noise [22]. Hence, the purpose of advanced analytics is to identify gaps, limitations and focus on performance improvements that lead to greater chances of victories. In addition, sports analytics helps players and staff to identify the critical path of a game or game series for pace increment and decision accuracy during or after a match. Performance estimation is a multivariate task depending on physical, mental, social, economic, psychological and shape variables, which contain high levels of uncertainty in correlations, and this hinders forecasting. However, the target of analytics is to minimize the risk and bias of player and team performance. Data science requires good statistical analysis and data interpretation, with the aid of technology, to lead to success [23,24].
Each sport requires specific body characteristics and talent charisma, but the most significant ingredients are hard training, commitment to the game and sports IQ (intelligence quotient). Technical staff search and measure biometrics connections related to height, weight, agility, speed, hand length, stamina and other important characteristics that can maximize the performance of each player and give more impact to the game that could drive a team to more wins and achievements. Previous studies have shown that some of the higher-ranking characteristics that influence rookie selection in the NBA league draft lottery are height, agility, and long arms. The taller a player is (with suitable talent, of course), the greater the chances to be selected in drafts. The 1st player pick in a rookie scale receives a salary of over $8 million for the first season, according to year 2020–2021 earnings [11,25,26].
The sports industry has recently focused on big data, not only for box-score statistic cards, but also in segments, such as opponents analysis, scouting analysis, ticket pricing, roster management, training data, health data, and social network analytics, apart from advanced performance analytics that support decision-making [27].
Sports analytics assist businesses with data (i) retrieval, (ii) collection, (iii) transformation and cleansing, (iv) analysis, (v) visualization and (vi) forecasting by using past and current statistics, based on methods and/or data science and ML algorithms. Sports data scientists process the aforesaid qualitative and quantitative information to aid owners and technical staff with tools, providing a competitive advantage and optimizing performance, tactics and strategy [6,28,29].
Studies in different sports (such as NFL, tennis, etc.) tried to identify the average athlete body profile in each sport, as illustrated in Figure 1. The average height for NBA players is 201 cm with a 101 kg weight and a 24.85 body mass index (BMI), while the body image of a normal man is 175 cm, 82.5 kg and 26.66 BMI, respectively [30].
Health pathologies and injuries are events with a high level of bias due to the complexity and the interdependencies that exist in this multivariate model. One of the most famous methodologies for performance forecasting in advanced basketball analytics is the CARMELO method, which combines regression statistics and data analysis using Box Plus Minus (BPM) and Real Plus Minus (RPM) statistics, with the purpose to estimate future player and team performance. However, a limitation of this methodology is that it does not include attribute correlation when modelling aggregated/combined injuries, psychological, biometrical, training, video analysis, and ergometric analytics [1,2,31].
A recent study indicated that there is a high correlation between injury and performance analytics implications when trying to correlate qualitative and quantitative data (for instance, box-score stats, health and injury analytics) from multiple sports data sources [2]. Sports analytics are the tools and methods used in performance optimization on and off the court, with the purpose to identify the efficiency of teams and players. Furthermore, through these, decision makers can propose the ideal team line-up or pairs of players who are more productive [32].
1.1.2. Socioeconomic Influence
The sports industry has grown intensely over the past years. The estimated worldwide market size is over $1.3 trillion, with more than 1 billion fans who support their favourite sport and/or team. This audience derives from a variety of sources, such as betting and entertainment from TV, internet broadcasting or live games in stadia [33].
Soccer, basketball, and baseball are the leaders in sports analytics providing innovative tech savvy solutions to understand the game in more depth, but also for forecasting purposes. Nowadays, the sports industry practices wearables, SportVU cameras, drones, sensors, and other important technologies to monitor every step and process in training, injury, recovery, workout and during a game spot check. Therefore, the sports industry allocates an important share of their budget for sports analytics actions with the purpose to improve their strategy, to understand their limitations, to better scout their opponents and lastly to avoid extra costs [34,35].
Top players take care of any small detail before and after each game. Hence, training, body recovery, nutrition, injury physiotherapy, strategy, tactics, and skill development are some traits for career improvement, attracting large investments from players. One of the best NBA players in the last decade, Lebron James, pays $1.5 million per year for his body preparation, recovery, nutrition, training and all the appropriate steps needed to stay at the top level of performance. Therefore, athletes use technology and the benefits of sports analytics to minimize any upcoming risk (such as injury or health problem) with the purpose to be efficient and healthy and extend their professional career as long as possible [36,37].
Basketball is a contact team sport. All sports in this type are risk averse to injuries. Injuries are not only performance costly for the club, implying higher probability to lose games and increase financial expenses, and may cause problems in team chemistry. For instance, in football UK Premier League for the season 2016–17, injured players cost over £175 million to their teams due to health problems [38]. Artificial intelligence (AI), DM and ML techniques and algorithms are used for prediction, including performance and financial benefit estimation [39,40,41,42].
For over 20 years, sports experts have been using sophisticated statistics to explain results and performances. Sports analytics gained a reputation with the story/movie of Moneyball [43] by changing the mode of player evaluation in terms of game impact, but also helped to enhance the strategy and tactics in defence and offense before, during and after the game. The purpose behind that is to retrieve valuable information through combined analytics and let club owners, managers and players take tough decisions, which include small but vital details and try, at the same time, to minimize any upcoming risk [44,45].
As the salaries of players and team budget increase over time, there is a need to gather more data and analyse them properly under different conditions to support effective decision-making and cost reduction. The right choice of players and good team management can alleviate additional costs and provide stability to player and team performance. Annual salaries in the NBA can range between a few thousand dollars and tens of millions of dollars. This depends on a variety of considerations, such performance, team, marketing, age, peak of career and other factors. Even though most professional NBA players earned a salary of almost $5 million dollars for season 2019–20. The salary of a player can fluctuate as D-league competition (subsidiary competition of NBA); crossover agreements earn $5000 dollars depending on the matches that they played. The salary cap for NBA players is close to $100 million, even though, currently, nobody earns anywhere near that amount. The top players in the NBA league earn nearly $40 million. The team salary cap for season 2019–20 was approximately $109 million. In case teams exceed this amount, they have to pay extra for luxury taxes [46,47,48].
2. Data and Methods
In the followed methodology for this study, as well as the key research questions along with aims and objectives, the aim was to support domain experts to understand the relationships and correlations among socioeconomic and demographic factors, and advanced basketball performance analytics for players and teams.
In this research, demographic indicators refer to the characteristics of NBA players that can be measured and categorized, such as age and playing position. These indicators are used to identify patterns in player performance and injury trends within specific demographic segments. In addition, socioeconomic indicators were defined as factors that relate to both economic and social dimensions, impacting players’ professional careers and teams’ financial decisions. Hence, this includes players’ salaries and the economic impact of injuries. These indicators help us analyse how economic aspects influence, and are influenced by, player performance and team strategies.
2.1. Research Questions/Hypothesis
- What is the cost of NBA league player Health pathologies and Injuries? (RQ1)
- At what age do NBA league players peak in terms of performance? (RQ2)
- At what age do NBA league players reach their maximum annual salary? (RQ3)
Addressing these research questions with sports analytics could support the sports industry to structure its strategy, make better decisions related to investments by minimising costs and winning championships, and its reputation.
2.2. Aim and Objectives
The aim of this study is to associate basketball performance with advanced analytics on demographics, economics, and injuries in order to find valuable insights for players and teams and provide guidelines to decision makers.
Sports analytics can be applied to unstructured data collected from various data sources, even without clear associations, which can be combined and structured in the quest to support domain experts. It is common for teams and players to make important decisions quickly before, during and after a match [49,50].
Nowadays, there is an upward trend in player salary and team budget. Club owners try to minimize any upcoming risk (e.g., avoid injury or select players who are not injury volatile) in terms of player management and selection process in order reduce potential extra costs. In addition, an objective of this paper is to uncover valuable information based on the proposed methodology validated in the literature [32,51].
Another objective of this study is to observe useful intuitions of performance analytics in correlation with player wages and the team budget, along with the extra costs that arise from injuries or pathologies. Furthermore, the applied micro-level data analysis and DM mechanisms strive to find further insights that could be applied, in a similar manner, to sports other than basketball [52].
2.3. Methodology
The methodology section describes the process used to collect and analyse data on NBA basketball players from 1996–1997 to 2019–2020. The data were primarily scrapped from various sources such as [46,47,48]. In order to gain the maximum amount of information possible, the data were unstructured and heterogeneous, so DM techniques were utilized for feature loading, variance explainability, PCA, and exploratory-based categorization to gain insights. The methodology included data collection, pre-processing, analysis, and result evaluation. The data scraping and wrangling process was executed using Python, SQL scripts, Power BI and the KNIME Analytics Platform.
The code for data scraping, and the relevant KNIME workflows, Power BI and Excel files for this data analysis can be accessed on GitHub at: https://github.com/vsarlis/NBAinjurydemoeconomics (accessed on 2 April 2023). Data preparation and pre-processing includes several steps to ensure that the data are cleaned, transformed, and formatted correctly. The first step is to identify and remove any missing values, outliers, and irrelevant data. This step is crucial to ensure that the data are consistent and accurate. For that reason, various data sources are selected for cross-validation purposes. Next, the data are transformed by scaling and normalizing the features to ensure that all features are on the same scale. Then, the data are organized into a format that is easy to use and understand, which may include creating new features or variables, or aggregating data by player or team. Lastly, feature selection is performed to select the most relevant features for the analysis and modelling, which is important to ensure that the model is not overfitting and is not too complex. The gathered data underwent an Extract, Transform, and Load (ETL) process for data cleansing, standardization, and homogenization to improve the quality of data for analysis [53,54,55].
The data model flow in Figure 2 starts with data collection from various sources, followed by data scraping and wrangling, and Python scripts for the retrieval process. Next, data preparation includes cleaning, transforming, and normalizing the data for analysis. Data pre-processing involves cleaning and transforming data to remove any inconsistencies or errors, while data cleansing identifies and corrects or removes errors and inaccuracies through KNIME Analytics tools. ETL transforms data from different sources into a format suitable for analysis and loads them into a data warehouse. Data transformation converts data into another format to make them suitable for analysis, while data consolidation combines data from multiple sources into a single dataset.
In the data analysis stage, dimensionality reduction was applied via techniques such as exploratory data analysis (EDA) and PCA, as well as feature selection methods, to identify the most important variables. Moreover, clustering and classification techniques were used to group similar data points together and to predict outcomes or categorize data into different classes. These methods leverage the power of DM and machine learning to identify relationships, detect anomalies, and make predictions based on the available data. In the last part of this research, visualizations and reports are established to communicate insights and findings to decision makers, while evaluation measures the accuracy of predictions or determines the impact of certain variables on outcomes.
EDA is an important step in the clustering process as it helps to understand the characteristics and structure of the data. EDA can be used to identify patterns, outliers, and trends in the data, which can inform the selection of the appropriate clustering algorithm and the tuning of its parameters. EDA and PCA are powerful techniques that can be used in sports analytics to gain insights into basketball data. EDA is a technique used to understand the characteristics and structure of the data. PCA, on the other hand, is a technique used to reduce the dimensionality of the data and analyse the distribution of the data points. Together, ECA and PCA can be used to identify patterns, trends, and outliers in the data and help inform the selection of the appropriate classification algorithm and the tuning of its parameters [56,57,58].
The data analysis stage focused on advanced basketball analytics selected from 1996–97 up to 2019–20 regular seasons. The consolidated dataset includes 585,800 rows, for each game of 1577 players from 35 teams incorporated with Absence analytics (injuries, health problems, suspensions and not selection reasoning for the game), demographics (Age, country, college, origin, etc.), financial information (player’s salary, team’s salary cap, etc.) and advanced basketball performance analytics. The basketball analytics used in this paper include rating and performance indicators like Points (PTS), Rebounds (REBS), Assists (AST) Total Rebounds Percentage (TRB%), Turnover Percentage (TOV%), Usage Percentage (USG%), True Shooting Percentage (TS%), Assists Percentage (AST%), Steals Percentage (STL%), Blocks Percentage (BLK%), Net Rating (NetRtg), Player Efficiency Rating (PER), Win Share (WS), Win Share per 48 min (WS per_48), Box Plus Minus (BMP or Plus/Minus or +/−) and Value over Replacement (VORP). Data were filtered for players with average playing time over 10 min per game (mpg) who played at least 19 games (gp) in each of the 24 regular seasons. This selection threshold was strategically set to capture data from players who consistently contributed to their teams throughout the season, thereby providing a reliable basis for evaluating performance and financial implications. By concentrating on the regularly participating players, we aimed to enhance the precision of our insights into the dynamics of player performance, injuries, and their economic impacts on NBA teams. This approach allowed us to extract meaningful patterns and trends from the vast dataset, ensuring that our conclusions are drawn from a foundation of substantial, consistent player engagement across multiple seasons.
In Table A1, the calculated inflated rates are adjusted for 2019–2020 as the baseline dollar value, taking into account the time value of money that was adjusted for the salaries in order to measure the changes in each year of the purchasing power of money [59]. Inflation can affect the salaries of NBA players by reducing the purchasing power of the dollar. If a player’s salary is not adjusted to keep up with inflation, they may find that they are struggling to make ends meet. On the other hand, NBA players’ salaries have been rising faster than inflation in recent years. This is partly due to the increasing popularity and revenue of the league, which allows teams to pay higher salaries to attract top players. Additionally, the NBA has a salary cap that is determined by the league’s revenue, which tends to increase over time. So, the players’ salaries tend to increase as well [60,61,62,63,64,65].
To improve data quality and insights, data that existed in more than one source were kept, and outliers were excluded from the consolidated dataset, resulting in a final working dataset of 490,584 rows. Inflation-adjusted rates were calculated as a baseline dollar value to measure the changes in the purchasing power of money over time. The methodology also mentions the limitations of the approach and potential areas for future work. The results of this study provide valuable insights into the relationships between various performance metrics, demographics, and financial information of NBA basketball players.
To ensure the robustness of our methodology and the reliability of our findings, we employ additional quality controls, such as mutual information, correlation-based feature selection, and recursive feature elimination. These methods rigorously ascertain the relevance of features for our classification tasks, ensuring that our analysis is both precise and pertinent. Furthermore, the integration of EDA, ECA, and PCA facilitates a comprehensive yet nuanced exploration of basketball analytics. We enhance our analysis with visual representations, including plots and graphs, to elucidate the relationships between features and class labels vividly. This visual approach not only aids pattern recognition, but also the identification of outliers and trends, providing a more accessible interpretation of complex data for decision makers in sports management. By adopting these advanced analytical techniques and stringent quality controls, our research offers deep insights into basketball data, supporting informed decision-making for coaches, team managers, and players. This methodological framework not only elevates the analytical rigor of sports analytics, but also ensures that our conclusions are derived from a thorough and reliable examination of the data [56,58,66,67].
3. Results
Basketball is a sport with a high level of ambiguity and parameters intercorrelated in a multivariate model. It presented the findings from clustering, in terms of age (RQ2), and feature selection for injury cost relationships (RQ1) according to state-of-the-art techniques. For the age and the position criteria regarding high earnings in the NBA league, clustering and demonstrated associations were performed between demographics and financial analytics (RQ3).
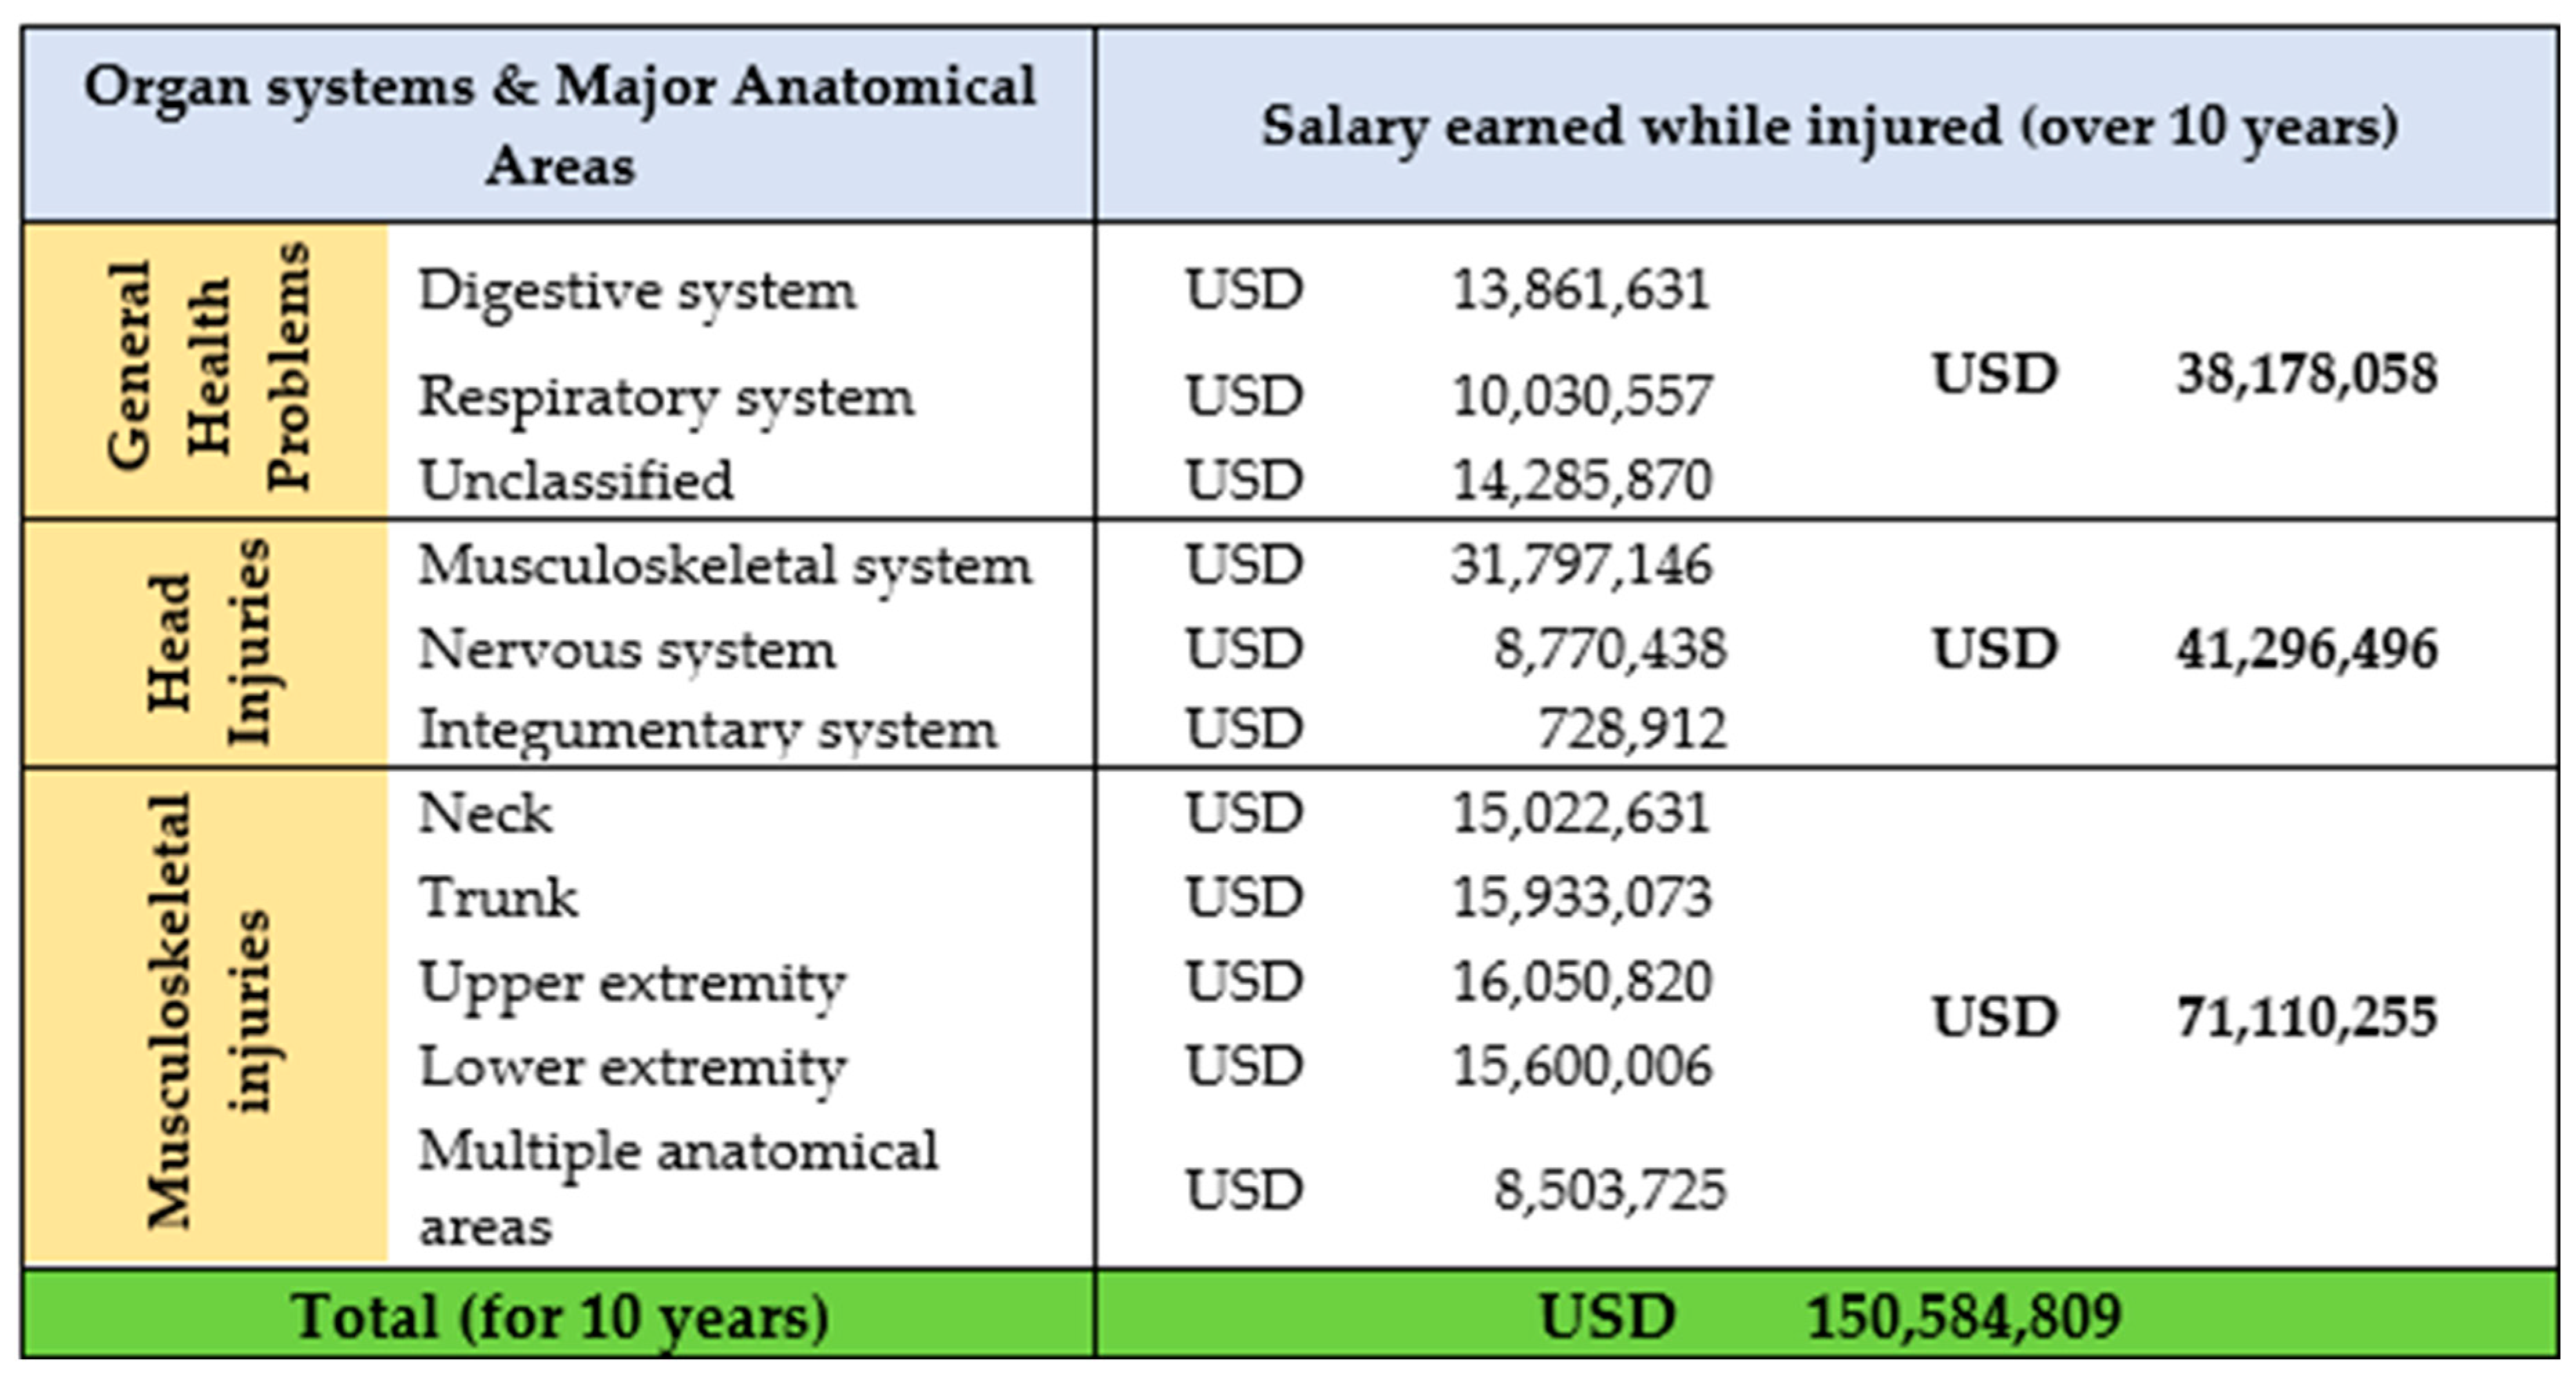
Figure 3 indicates that musculoskeletal injuries cost approximately half (47.2%) of the total cost of health pathologies and injuries in NBA league teams, while head injuries cost 27.4% and general health issues provoke the 25.4% of total financial losses while players are injured, out of the line-up but earn a salary. Data over 10 years was analysed and the total cost of health pathologies and injuries for NBA league players was found to be over 150 million dollars. The annual evolution of this cost, starting at some 12 million dollars in 2010–11, all the way to 16 million dollars in 2019–20, is illustrated in Figure A1. The high-level effect of injuries by organ system and major anatomical area on NBA is presented in Figure 3. The study analysed NBA player performance data spanning from the 1996–97 to the 2019–20 seasons, sourced from official publicly available data sources [46,47,48]. In the current study, the financial losses from player health pathologies and injuries were investigated based on the injury classification performed in previous research [2] (RQ1).
Additionally, in this study, data analysis for 24 NBA league seasons (from 1996–97 up to 2019–20) was conducted with the purpose to discover the player position earning the highest salary per year. For that reason, 1577 players were categorized into three classes, namely Centers (“C”), Forwards (“F”) and Guards (“G”). A “Forward” player is someone used in the positions of Power Forward and Small Forward, while a “Guard” is used as Shooting Guard or/and Point Guard. A “Center” is used a Center most of the time (RQ3).
Figure 3 and Figure A1 present these three classes in correlation with the average salary for each class. According to this, Centers are the best-paid players in the league, not only for their height but also for their good performance [68,69,70,71]. Based on the law of supply and demand, the position of a “Center” player shows the relationship of players in that class with the salary that teams offer. It is difficult to find a player of such height and of the highest quality and performance at this competitive level [72].
According to data analysis for 1577 players, Centers accounted for 21.3% of the total, with an average salary of USD 6.84 million, while Guards were 38% of the total, with the lowest average annual salary of USD 5.37 million, over 24 NBA Seasons (Table 1) (RQ3).
Figure 4 displays a detailed analysis of NBA salary trends over two decades, differentiated across time and grouped by player positions: Centers (C), Forwards (F), and Guards (G). Each column represents the average inflated salary for these positions, offering insights into the economic evolution within the league from 1996–97 to 2019–20. The data are adjusted for inflation, providing a clear view of the real earning power over time. A year-over-year percentage change is also indicated, highlighting salary fluctuations which can be associated with market changes, collective bargaining agreements, and shifts in the league’s economic landscape. For instance, Centers saw a peak increase of 34.02% in 1997–98 and 33.21% in 2016–17 season, while Guards experienced a significant rise of 37.54% in the 2016–17 season. Forwards encountered a less dramatic, but still notable peak increase of 29.02% in the 2015–16 season.
The global average inflated salary across all positions demonstrates a steady growth in player compensation, with an average salary increase of 7.49% from the previous year by the end of the 2019–20 season. These insights are particularly relevant when considering the financial strategy of teams and the negotiation dynamics of player contracts. Furthermore, the data underscore the importance of position-specific financial planning, especially when accounting for the impact of player injuries and the subsequent adjustments that may be necessary for team salary caps and budgeting.
Figure 4 also illustrates NBA annual salary drill down analysis per position. From 1996–97 season up to 2019–20, there is an increase in salaries for “Centers” from USD 3,88 to USD 9.44 million (143% increase), for “Forwards” from USD 3.54 to USD 7.6 million (115% increase) and for “Guards” from USD 3.26 to USD 8.05 million (147% increase), and an average increase in salaries for all players from USD 3.49 to USD 8.17 (134% increase) (RQ3). Based on the results, it seems that the game is changing, and all players are eligible and capable of playing in every position needed during matches.
Without a doubt, the age criterion is vital for players regarding their career. Based on that, sport clubs invest in players’ careers, create their strategies, structure their team roster, and finally make important decisions for their budget. Age influences performance, as professional basketball players older than 30 years have lower speed and/or jumping ability than younger ones, which means that performance declines severely by that age [73].
In addition, this research study aimed to correlate NBA player age with salaries and advanced basketball performance analytics. Figure 5 presents a matrix with the attributes of age, salary and advanced basketball performance analytics contained by PTS, REBS, AST, TRB%, TOV%, USG%, TS%, AST%, STL%, BLK%, NetRtg, PER, WS, WS per_48, BMP or Plus/Minus or +/− and VORP which used, as the most appropriate rating, basketball analytics in the background [1,19,74,75,76] (RQ2 and RQ3).
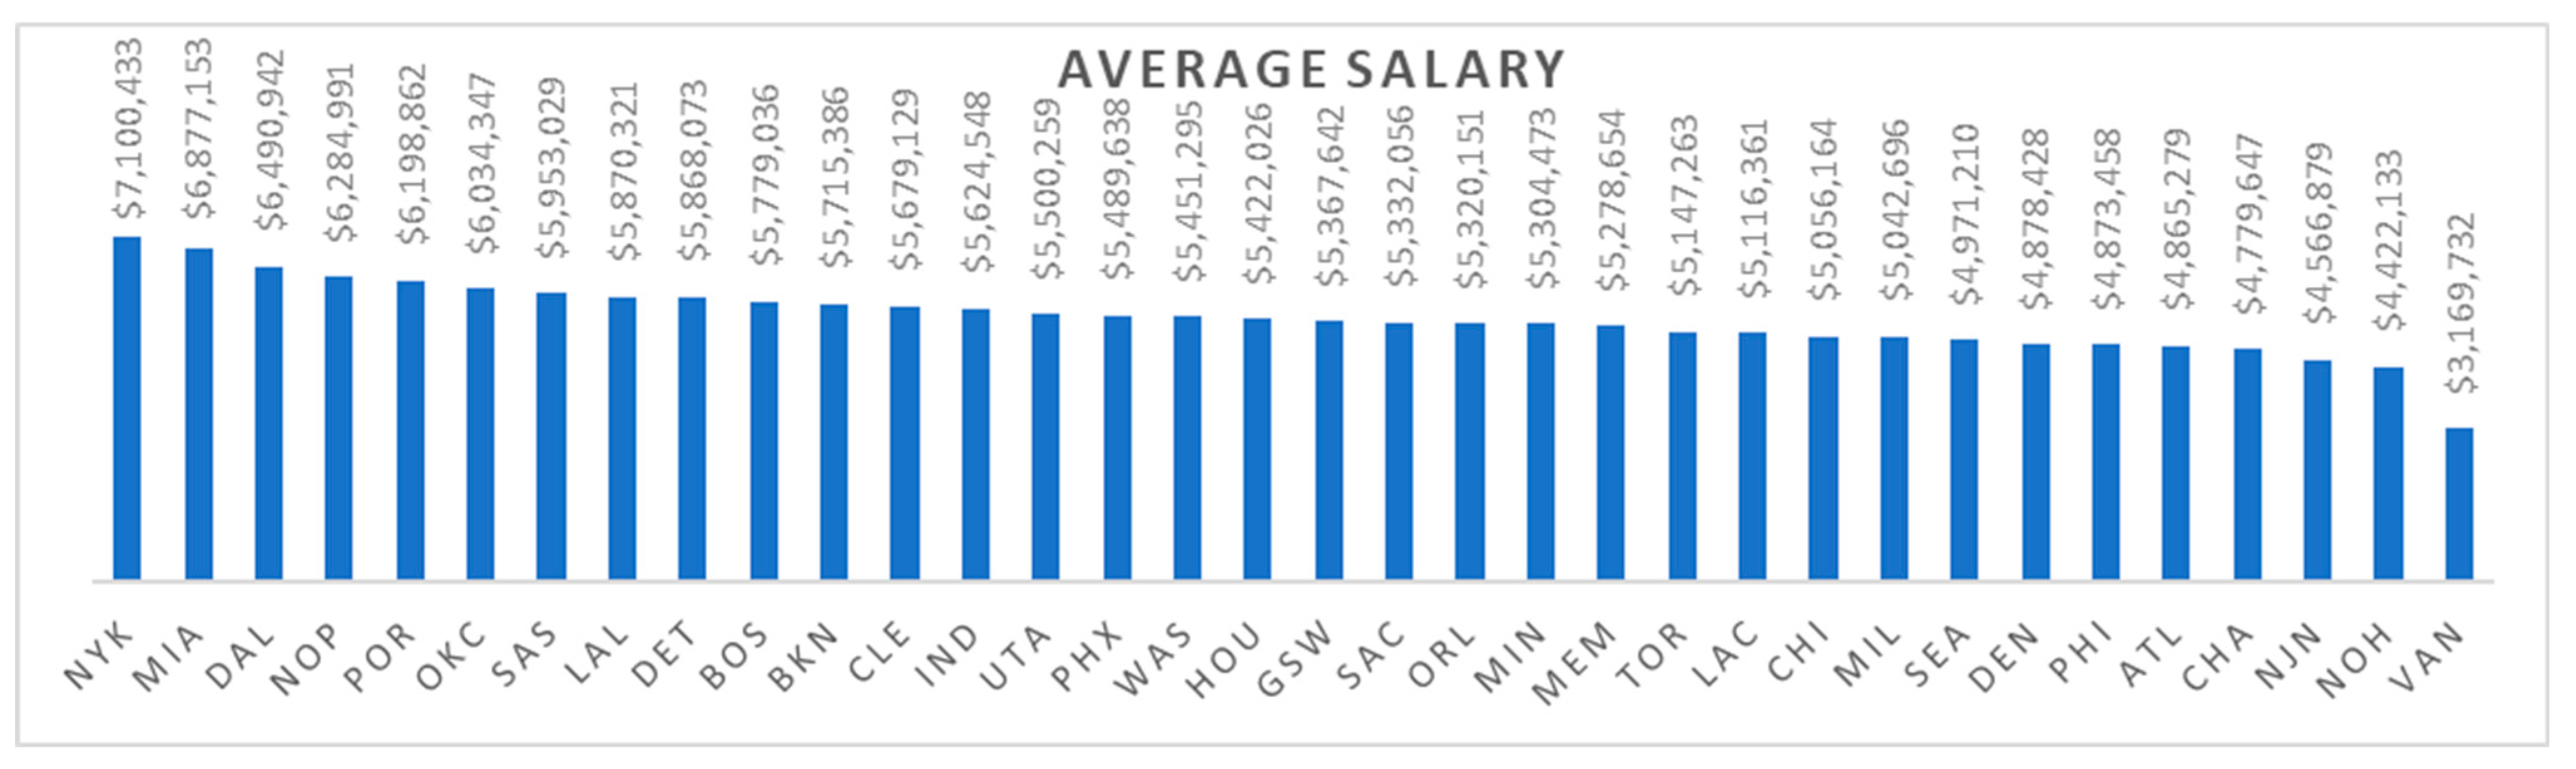
Figure 5 and Figure A2 show the financial cost simplification regarding the average annual salary paid by each team in the analogy of 24 NBA seasons from 1996–97 to 2019–20. New Orleans Pelicans (NOP), Miami Heat (MIA) and New York Knicks are the top 3 clubs with the highest paid salaries: USD 6 M, USD 5.74 M and USD 5.72 M, respectively. On the other hand, Atlanta Hawks (ATL), Charlotte Hornets (CHA) and Philadelphia 76 ers (PHI) are the teams offering the lowest salaries, USD 4.04 M, USD 4.03 M and USD 3.97 M, respectively. The bottom 3 clubs, SEA, NJN and VAN, were excluded from this comparison because these teams ceased to exist many years ago, when lower salaries were the norm.
As illustrated in Figure 6, the green highlighted cells are those which demonstrate players reaching their peak performance within each age group. Studying 24 seasons of the NBA league showed that players aged between 27 and 29 are at the peak of their careers regarding average performance in the provided most-accredited basketball advanced rating analytics. However, their maximum earnings on average are achieved when they are between 29 and 34 years old (RQ2 and RQ3) with the maximum average salary for an NBA league player achieved at age 34.
Regarding performance evaluation, there is high complexity and limitation in correlation analysis between tactics formation, SportsVU video-tracking analytics, physical performance measurements and psychometric/biometric analytics. Based on the possible implications proposed, this study can be considered as providing valuable insights to decision makers. By performing clustering through dimensionality reduction, based on feature extraction (PCA) and feature selection (Wrapper, Filter, and Embedded methodologies), eight age clusters were formed, as presented in Figure 6 and detailed in Table 2. Approximately 50% of players in the NBA are in the age group 23 up to 28. Players aged between 29 and 33 receive the highest salaries of approx. 8.2 million dollars.
Table 2 and Figure A3 categorize NBA players into eight distinct age groups to reflect various financial tiers within player contracts, and capture the diversity of player earnings. This segmentation is critical for analysing the financial impact of player injuries on team economics. The age ranges facilitate an in-depth exploration of how age influences both the occurrence of injuries and salary structures in the NBA. The data showcases the percentage of players in each age cluster, the average salary adjusted for inflation in U.S. dollars, and the associated PER, a measure of their on-court performance. These groups are essential for investigating correlations and patterns that elucidate the complex relationships between player age, performance, and their accrued professional experience within the league. By doing so, the study provides a nuanced understanding of how age-related factors contribute to economic considerations in team management.
Table 2 focuses on the overall percentage of players by age, their inflation-adjusted salaries, and efficiency ratings (PER), while Figure A3 breaks down players by age, position, and includes detailed performance analytics. Together, they suggest that players’ salaries tend to increase and peak during their late twenties to early thirties, whereas the PER peaks in the mid to late twenties and then varies or decreases. Younger players make up a smaller portion of the league, and the most common age bracket is from 23 to 26 years old. Overall, these insights indicate a complex interplay between age, experience, position, and financial compensation in the NBA.
Guards (G) show the best playing performance when aged 29–30 and, in the same cluster, they are getting the highest salary on average with ~7.5 million dollars. In addition, Forwards (F) play better when aged 27–28 with the highest salary of ~8.6 million dollars when they are 31–33 years old. On the other hand, Centers (C) are paid more when aged 31–33 with 9.4 million dollars and their highest performance is when aged 25–26.
The radial chart (also known as a spider chart) in Figure 7 visualizes and compares the average salaries of teams in the timespan of 24 years. A supportive explanation for the teams is as follows: 3 New Jersey Nets changed their brand name at the end of season 2011–12. From 2012–13 season onwards, they use the name Brooklyn Nets; 4 New Orleans Hornets changed their brand name at the end of season 2012–13, and from the 2013–14 season onwards, they use the name of New Orleans Pelicans; 5 Seattle SuperSonics played their last season in the NBA in the season 2007–08; 6 Vancouver Grizzlies played for 6 seasons in the period from 1995 to 2001.
The tornado funnel diagram (Figure 8) illustrates the correlation between age and inflated salary for all NBA players in descending salary order. The percentage in brackets indicates the percent of the first in order to have a clear comparison. Based on the results, it was concluded that players in the age group of 29–34 get the highest salaries (Table 2). Hence, teams select them as experienced professionals to use as mentors to teach younger players and achieve the best mix for achieving more wins and championships.
Limitations and challenges such as the availability and quality of data, data size, complexity of the game, selection bias, injuries, human factors, validity of the metrics and modelling assumptions. Basketball is a complex game, making it difficult to accurately capture all the nuances and interactions of the players and teams. Selection bias, injuries and player turnover can greatly impact a team’s performance, making it difficult to draw accurate conclusions about a team’s true talent level. Additionally, human factors such as coaching, player motivation, and team dynamics can be difficult to quantify and incorporate into analytics.
4. Discussion
Important criteria, such as age, nutrition, training status, history and load monitoring, psychological status, social status and lifestyle, stress tolerance and proper recovery procedure need to be considered in order to avoid the extra costs that provoke an injury or health pathology [11].
Players during, their careers, can change playing position for various reasons, such as coaching staff decision, opponent adaptation, specific skills targeting, body transformation, and age criteria. For consistency purposes, a player was assigned to his most usual position (RQ3).
A basketball team comprises 12 active players; these players are eligible to play at any moment during a game. Therefore, proper player selection in the roster can enhance team performance and each minor good decision during every second of the game can take the lead or provide the win in a match. Over the past 10 years, the trending coaching style has been to distribute playing time to all the players of the roster by keeping or changing the game tempo according to their strategy. For that reason, the nomination of the 6th player of the NBA league is a good sign that technical staff are giving extra attention to all the players of the roster. Based on that, appropriate roster selection, team management, role assignment and rotation are significant factors with the purpose to achieve better results, and can provide added value to a team [77,78,79,80].
NBA league seasons, with important salary decreases, occurred in 2011–12 and 2012–13 due to the NBA lockout decision, which shortened the season from 82 to 66 games per team, with a −3.38% and −9.52%, respectively, total percentage average annual salary difference compared with the previous year’s average salaries [50,81]. The worldwide recession of the global economy between 2007 and 2009 influenced NBA player salaries, resulting in an 8% average decrease in season 2009–10 [82,83] (RQ3).
The aggregated data containing basketball advanced performance analytics, demographics, and financial information were presented earlier. Additionally, the combined data uncover relationships and influences between performance, demographics and economic analytics for teams and players. According to the pre-processed aggregated data, the relationship between player health pathologies/injuries and the financial cost these imply in the NBA competition were examined. Table 1 illustrates three different groups, namely general health problems, head injuries and musculoskeletal injuries in the NBA league for 10 seasons, starting from 2010 up to 2020. It is clear for club owners, as well as medical and technical staff, that they should organize and structure their strategy in terms of training, game selection, load management, and recovery procedure with the purpose that the players should return active and healthy in the team roster, avoiding any additional implications (RQ1 and RQ2).
The novelty of our research lies in the sophisticated integration of clustering and classification techniques through exploratory-based categorization, complemented by the application of PCA-driven pattern recognition for nuanced feature selection. This approach enables us to unearth complex associations among demographics, performance metrics, and financial variables specific to NBA players, offering fresh perspectives on how these factors interrelate to influence outcomes within the league. The methodology goes beyond conventional analyses by thoroughly detailing the data collection and preprocessing steps, ensuring the integrity and robustness of our dataset before applying our advanced analytical techniques.
Our analysis extends into the economic domain, investigating the consequences of player injuries and health issues, an aspect only marginally explored within sports analytics. Through a rigorous quantitative methodology, we unveil the profound economic burdens these health-related factors impose on NBA teams. Our research outlines the direct and indirect costs associated with player injuries, from immediate health expenses to longer-term impacts on team performance and player valuation. By mapping these economic implications, our study yields critical insights, fostering more informed strategies around player health management and financial structuring. This comprehensive approach not only charts a course for the application of advanced analytics in sports management, but also aids empirical research on the complex interplay between player health and the financial mechanisms of professional sports leagues.
Addressing threats to the validity of this study, we acknowledge the exclusion of discussions on potential confounding variables that could influence the observed relationships. The scope of our study does not encompass factors like nutrition, training programs, load monitoring, and psychological or social influences, which could also play significant roles in injury prevention and recovery. While these dimensions merit consideration, our focused examination on the NBA league provides a foundational analysis that prompts further inquiry into these areas. Moreover, our findings, while robust within the context of NBA data, may necessitate adaptation for applicability to other basketball leagues or sports. This limitation underscores the need for tailored analytical frameworks to understand the unique dynamics of different sporting environments [84].
5. Conclusions and Future Work
The aim of this work was to help decision makers to assemble their vision, strategy, make appropriate budget allocation and investments, and win championships with the minimum cost in terms of money and time. Age and position criteria are factored in player wage estimation, based on advanced basketball analytics. In addition, injury history status and health problem patterns can help technical staff to structure their training, load management, psychological encouragement, recovery procedures, tactics, and player nutrition.
Throughout the manuscript, the exploration of multivariate relationships between player performance metrics, salaries, and age is meticulously conducted. Advanced DM techniques are employed, encompassing the application of PCA for feature selection, PCA-driven pattern recognition, exploratory-based categorization, as well as classification and clustering processes. The feature selection process is pivotal, enabling the identification and prioritization of the most significant variables impacting player performance and economic outcomes. Subsequently, classification methods are utilized to categorize players based on these selected features, revealing insights into how different attributes correlate with performance levels and financial rewards. Clustering techniques further segment players into distinct groups based on age, position, and performance metrics, facilitating a deeper understanding of the dynamics within player cohorts. These combined methods afford a nuanced comprehension of the complex interplay between a player’s age, performance, and salary, transcending the capabilities of simple database queries. By integrating feature selection with classification and clustering, patterns and insights crucial for strategic decision-making in sports management are unveiled, offering a comprehensive analysis of the underlying economic and performance-related implications.
Our study enriches the sports analytics field by introducing a novel methodology that integrates PCA for refined feature selection, clustering techniques to pinpoint players’ peak performance periods, and an in-depth financial analysis of the impacts of health pathologies and injuries. Unlike the existing literature, our approach offers a more precise understanding of how player attributes influence performance and economic outcomes in the NBA.
The avoidance of injuries is significant in sports. According to the findings, musculoskeletal injuries cost 47.2% of the total health problems and pathologies in the NBA league (RQ1). Based on the age criterion, clubs can form their strategy and allocate their budget accordingly (RQ2).
One of the main objectives was to provide relationships in the form of the metrics of economics, demographics, injuries, and pathologies using advanced basketball statistics. Sports performance is a multivariate model difficult to predict because of its extensive uncertainty. Some of the parameters involved include shape, psychology, social background, lifestyle, mental status, playing usage and monetary traits [85]. There are many interdependencies and correlations among these parameters. Therefore, the purpose of analytics is to minimize the risk and make forecasting for uncertainties with the purpose to maximize efficiency [1].
Player position is important not only for starting line-up selection, but also for rotation management, as well as financial reasons (RQ3). NBA players who belong to the age group between 27 and 29 are at the peak of their performance, based on advanced basketball analytics, while they get the highest average salary between 29–30 years old (RQ2 and RQ3). Additionally, NBA top level players in the “Center” position are fewer (21.3% of the total) but earn more (USD 5.69 million) in comparison with “Forwards” (USD 5.1 million) and “Guards” (USD 4.48 million). Therefore, “Centers” dominate the NBA league in terms of the highest annual earnings, but it is difficult to discover “Centers” combining quality and performance characteristics (RQ3).
Further, this study proposes to explore the socio-economic impacts of NBA careers more deeply. By analysing how changes in player performance due to aging or injuries affect their marketability, sponsorship opportunities, and post-career prospects, this research can offer a holistic view of a player’s economic lifecycle within and beyond their active sports career.
Basketball is a team sport that focuses on minor details prior to and during a match. Bad or good choices, effective game tempo, the condition in the first minutes of the match, and efficient offensive and defensive matchups are some examples that lead to advantages or disadvantages to a club against opponents. However, there are examples of players who influence a match with their energy, motivation, and psychological support to the whole team. These are characteristics that data analysts cannot quantify and allocate to statistical categories but need to be combined and aggregated into a sophisticated model. However, domain experts, with the help of data scientists, can recognize important patterns through the game in order to increase productivity and minimize any upcoming bias [86]. Nonetheless, data experts and technical staff can use advanced analytics for evaluation, tracking, monitoring, and forecasting purposes of team and player performance. Based on these analyses, technical staff can make significant decisions for roster management, team culture fit, strategy, vision, scouting, future transfers and new talent acquisitions [87].
Future Work
In addition to current research, further work can be applied to a variety of sports analytics predictive or descriptive segments. Possible areas of future focus include the impact of psychology on player and team performance, medical and health issues, recovery, tactics, biometrics, social, nutrition and leadership. These can be studied not only for basketball but also for other team sports. Examining sports data analysis for individual sports is an opportunity to identify patterns and insights as an appealing alternative.
For club owners, management, and technical staff, it is vital to receive accurate predictions for uncertain situations that could cost them either financially or in terms of performance. The psychological and behaviour analysis of athletes is also vital to prepare them mentally. Nowadays, the engagement of players and teams through social networks is extensive, motivating sports data scientists to focus on them with the purpose to retrieve valuable information and insights. Studying social networks can facilitate behavioural analysis, build persona clustering, and recognize patterns. These events can be associated with fan and team activities for descriptive analysis, but also to make associations and predictions for the future in a variety of attributes, as discussed previously.
There are many platforms and applications that use data to quantify biometrics, muscular soreness, sleeping quality, physical condition, nutrition, fan engagement, training, marketing analytics, and social analytics. The purpose is not only for data visualization but also for a sports business focus to avoid extra costs. In addition, the convergence of science and technology can reduce extra investments and optimize the productivity and effectiveness of a team and player’s daily routine.
The COVID-19 pandemic created new standards in every moment worldwide and influenced dramatically every sport. For that reason, the sports industry should adjust the training, fan engagement, and contacts, and focus on every detail that could affect any participant of each team. Data science and analytics can similarly help to minimize any upcoming risk among sports members and also aid with a wide range of physical and mental issues that could provoke economical, mental and health problems [88,89].
Additionally, it could identify injury factors with prescriptive analysis. Big data analysis can define which game period of a sport causes the most injuries and whether fatigue plays a significant role in this health problem. Furthermore, it is useful to understand how much player fatigue can impact the last minutes of the game and if the leadership and mental skills of a player can alleviate this impact. Finally, the quality of sleep, long trips and number of trips can influence players and teams to perform well or not. Analysis on this topic can help technical staff in rotation and load management with the purpose to keep the team fresh.
Author Contributions
Conceptualization: V.S.; methodology: V.S; software: V.S.; validation: C.T., V.S.; formal analysis: V.S.; investigation: V.S.; resources: C.T. and V.S.; data curation: V.S.; writing—original draft preparation: V.S.; writing—review and editing: C.T. and V.S.; visualization: V.S.; supervision: C.T.; project administration: C.T. and V.S. All authors have read and agreed to the published version of the manuscript.
Funding
This research received no external funding.
Institutional Review Board Statement
Not applicable.
Informed Consent Statement
Not applicable.
Data Availability Statement
Data partly available within the manuscript.
Conflicts of Interest
The authors declare no potential conflicts of interest with respect to the research, authorship, and/or publication of this article. This manuscript is according to the guidelines and complies with the Ethical Standards.
Appendix A
Figure A1 illustrates the annual progress of costs in each of the major anatomical areas.
Figure A1.
Annual NBA league team financial losses in USD due to player health pathologies and injuries (from 2010–11 up to 2019–20).
Figure A1.
Annual NBA league team financial losses in USD due to player health pathologies and injuries (from 2010–11 up to 2019–20).

Table A1 shows inflation-adjusted rates for 2019–2020, considering the time value of money for salary adjustments. It demonstrates how inflation adapts NBA players’ purchasing power.

Table A1.
NBA player average salary per position over 24 seasons (1996–2020).
| Year | Annual Inflation Adjusted Using 2019–20 as a Baseline |
|---|---|
| 1996–97 | 0.613 |
| 1997–98 | 0.628 |
| 1998–99 | 0.637 |
| 1999–00 | 0.651 |
| 2000–01 | 0.673 |
| 2001–02 | 0.692 |
| 2002–03 | 0.703 |
| 2003–04 | 0.719 |
| 2004–05 | 0.739 |
| 2005–06 | 0.764 |
| 2006–07 | 0.788 |
| 2007–08 | 0.811 |
| 2008–09 | 0.842 |
| 2009–10 | 0.839 |
| 2010–11 | 0.853 |
| 2011–12 | 0.880 |
| 2012–13 | 0.898 |
| 2013–14 | 0.911 |
| 2014–15 | 0.926 |
| 2015–16 | 0.927 |
| 2016–17 | 0.939 |
| 2017–18 | 0.959 |
| 2018–19 | 0.982 |
| 2019–20 | 1.000 |
Figure A2 outlines the annual changes of important basketball advanced analytics, such as the salary inflated and performance metrics in order to understand the fluctuations and the significance of them in relation to the age criterion.
Figure A2.
Player age clustering (for ages 18–43) in correlation with basketball advanced analytics and average wages in USD for the period 1996–2020.
Figure A2.
Player age clustering (for ages 18–43) in correlation with basketball advanced analytics and average wages in USD for the period 1996–2020.

Figure A3 shows that players’ salaries generally peak in their late twenties to early thirties (29–30 years old), while PER tends to peak slightly earlier (27–29). Salaries and performance metrics, such as PER, VORP, net rating, etc. vary with age, highlighting the relationship between a player’s career stage, their role, and their value to the team.
Figure A3.
Eight age clusters across 3 different playing positions, in correlation with player percentage, salary adjusted for inflation, and advanced basketball analytics over 24 NBA seasons (1996–2020).
Figure A3.
Eight age clusters across 3 different playing positions, in correlation with player percentage, salary adjusted for inflation, and advanced basketball analytics over 24 NBA seasons (1996–2020).

References
- Sarlis, V.; Tjortjis, C. Sports analytics—Evaluation of basketball players and team performance. Inf. Syst. 2020, 19, 19. [Google Scholar] [CrossRef]
- Sarlis, V.; Chatziilias, V.; Tjortjis, C.; Mandalidis, D. A Data Science approach analysing the Impact of Injuries on Basketball Player and Team Performance. Inf. Syst. 2021, 99, 101750. [Google Scholar] [CrossRef]
- Papageorgiou, G.; Sarlis, V.; Tjortjis, C. Unsupervised Learning in NBA Injury Recovery: Advanced Data Mining to Decode Recovery Durations and Economic Impacts. Information 2024, 15, 61. [Google Scholar] [CrossRef]
- Sarlis, V.; Papageorgiou, G.; Tjortjis, C. Injury Patterns and Impact on Performance in the NBA League Using Sports Analytics. Computation 2024, 12, 36. [Google Scholar] [CrossRef]
- Adhikari, A.; Majumdar, A.; Gupta, G.; Bisi, A. An innovative super-efficiency data envelopment analysis, semi-variance, and Shannon-entropy-based methodology for player selection: Evidence from cricket. Ann. Oper. Res. 2020, 284, 1–32. [Google Scholar] [CrossRef]
- Morgulev, E.; Azar, O.H.; Lidor, R. Sports analytics and the big-data era. Int. J. Data Sci. Anal. 2018, 5, 213–222. [Google Scholar] [CrossRef]
- Lankhorst, K.; De Groot, J.; Takken, T.; Backx, F.; Backx, F.J.G.; De Groot, J.F.; Lankhorst, K.M.; Nijboer, T.C.W.; Takken, T.; Smits, D.W.; et al. Sports participation related to injuries and illnesses among ambulatory youth with chronic diseases: Results of the health in adapted youth sports study. BMC Sports Sci. Med. Rehabil. 2019, 11, 36. [Google Scholar] [CrossRef] [PubMed]
- Davenport, T.H. Analytics in Sports: The New Science of Winning. Int. Inst. Anal. 2014, 2, 1–28. [Google Scholar]
- Sandri, M.; Zuccolotto, P.; Manisera, M. Markov switching modelling of shooting performance variability and teammate interactions in basketball. J. R. Stat. Soc. Ser. C Appl. Stat. 2020, 69, 1337–1356. [Google Scholar] [CrossRef]
- Sürer, Ö.; Apley, D.W.; Malthouse, E.C. Coefficient tree regression for generalized linear models. Stat. Anal. Data Min. 2021, 14, 407–429. [Google Scholar] [CrossRef]
- Cole, B.; Arundale, A.J.H.; Bytomski, J.; Amendola, A. Basketball Sports Medicine and Science; Springer: Berlin/Heidelberg, Germany, 2020; ISBN 9783662610695. [Google Scholar]
- del Corral, J.; Maroto, A.; Gallardo, A. Are Former Professional Athletes and Native Better Coaches? Evidence From Spanish Basketball. J. Sports Econom. 2017, 18, 698–719. [Google Scholar] [CrossRef]
- Sarlis, V.; Papageorgiou, G.; Tjortjis, C. Sports Analytics and Text Mining NBA Data to Assess Recovery from Injuries and their Economic Impact. Computers 2023, 12, 261. [Google Scholar] [CrossRef]
- Simmons, B. The Book of Basketball: The NBA according to the Sports Guy; ESPN: Bristol, CT, USA, 2010. [Google Scholar]
- Thabtah, F.; Zhang, L.; Abdelhamid, N. NBA Game Result Prediction Using Feature Analysis and Machine Learning. Ann. Data Sci. 2019, 6, 103–116. [Google Scholar] [CrossRef]
- Pantzalis, V.C.; Tjortjis, C. Sports Analytics for Football League Table and Player Performance Prediction. In Proceedings of the 2020 11th International Conference on Information, Intelligence, Systems and Applications (IISA), Piraeus, Greece, 15–17 July 2020. [Google Scholar] [CrossRef]
- Apostolou, K.; Tjortjis, C. Sports Analytics algorithms for performance prediction. In Proceedings of the 2019 10th International Conference on Information, Intelligence, Systems and Applications (IISA), Patras, Greece, 15–17 July 2019; pp. 1–4. [Google Scholar] [CrossRef]
- Brefeld, U.; Davis, J.; Goebel, R.; Van Haaren, J. Machine Learning and Data Mining in Sports Analytics [Internet]. In Proceedings of the 5th Interna-tional Workshop, MLSA 2018 Co-located with ECML/PKDD 2018, Dublin, Ireland, 10 September 2018; 182p. [Google Scholar] [CrossRef]
- Cao, C. Sports Data Mining Technology Used in Basketball Outcome Prediction [Internet]; Dublin Institute of Technology: Dublin, Ireland, 2012; Available online: https://arrow.tudublin.ie/cgi/viewcontent.cgi?article=1040&context=scschcomdis (accessed on 23 February 2023).
- Csató, L. The UEFA Champions League seeding is not strategy-proof since the 2015/16 season. Ann. Oper. Res. 2020, 292, 161–169. [Google Scholar] [CrossRef]
- Sikka, D.; Rajeswari, D. Basketball Win Percentage Prediction using Ensemble-based Machine Learning. In Proceedings of the Sixth International Conference on Electronics, Communication and Aerospace Technology (ICECA 2022), Coimbatore, India, 1–3 December 2022; pp. 885–890. [Google Scholar]
- Markov, I.; Stamatatos, E.; Sidorov, G. Improving Cross-Topic Authorship Attribution: The Role of Pre-Processing; Lecture Notes in Computer Science (including subseries Lecture Notes in Artificial Intelligence and Lecture Notes in Bioinformatics); Springer: Berlin/Heidelberg, Germany, 2018; Volume 10762, pp. 289–302. [Google Scholar] [CrossRef]
- Martin, L. Sports Performance Measurement and Analytics: The Science of Assessing Performance, Predicting Future Outcomes, Interpreting Statistical Models, and Evaluating the Market Value of Athletes; Pearson Education Ltd.: London, UK, 2016; ISBN 9780134193304. [Google Scholar]
- Serrano, B.; Comer, M.; Puls, G. Athletic Monitoring in Basketball: A Qualitative Exploratory Approach. Adv. Orthop. Sport. Med. 2022, 2022, 10–13. [Google Scholar] [CrossRef]
- Real, G.M. Basketball Real GM [Internet]. 2021. Available online: https://basketball.realgm.com/nba/info/rookie_scale/2021 (accessed on 10 January 2021).
- Motomura, A.; Roberts, K.V.; Leeds, D.M.; Leeds, M.A. Does It Pay to Build through the Draft in the National Basketball Association? J. Sports Econom. 2016, 17, 501–516. [Google Scholar] [CrossRef]
- Tichy, W. Changing the Game: Dr. Dave Schrader on sports analytics. Ubiquity 2016, 2016, 1–10. [Google Scholar] [CrossRef]
- Alamar, B.C. Sports Analytics: A Guide for Coaches, Managers, and Other Decision Makers; Columbia University Press: New York, NY, USA, 2013. [Google Scholar]
- Vinue, G.; Epifanio, I. Archetypoid analysis for sports analytics. Data Min. Knowl. Discov. 2017, 31, 1643–1677. [Google Scholar] [CrossRef]
- Psych Guides. Male Body Image and the Average Athlete [Internet]. 2021. Available online: https://www.psychguides.com/interact/male-body-image-and-the-average-athlete/ (accessed on 10 January 2021).
- Silver, N. CARMELO NBA player projections [Internet]. 2018. Available online: https://projects.fivethirtyeight.com/carmelo/anzejs-pasecniks/ (accessed on 15 December 2020).
- Pham, L.; Anand, S.; Piette, J. Evaluating Basketball Player Performance via Statistical Network Modeling. MIT Sloan Sport Anal Conf [Internet]. 2011. Available online: https://www.researchgate.net/publication/267963402 (accessed on 15 December 2022).
- Plunkett, J. Global Sports Industry Soars to $1.3 Trillion [Internet]. Plunkett Research Online. 2020. Available online: https://www.plunkettresearch.com/global-sports-industry-soars-to-1-3-trillion/ (accessed on 20 January 2021).
- Schumaker, R.P.; Solieman, O.K.; Chen, H. Sports Knowledge Management and Data Mining. In Annual Review of Information Science and Technology Develop; Springer: Berlin/Heidelberg, Germany, 2010; Volume 44, pp. 115–158. [Google Scholar]
- Grossi, V.; Giannotti, F.; Pedreschi, D.; Manghi, P.; Pagano, P.; Assante, M. Data science: A game changer for science and innovation. Int. J. Data Sci. Anal. 2021, 11, 263–278. [Google Scholar] [CrossRef]
- Davis, S. LeBron James Diet, Workouts, Treatment Cost Him $1.5 Million in Body Care—Business Insider [Internet]. Available online: https://www.businessinsider.com/how-lebron-james-spends-money-body-care-2018-7 (accessed on 12 December 2020).
- Javadpour, L.; Blakeslee, J.; Khazaeli, M.; Schroeder, P. Optimizing the best play in basketball using deep learning. J. Sport. Anal. 2022, 8, 1–7. [Google Scholar] [CrossRef]
- Beal, R.; Norman, T.J.; Ramchurn, S.D. Artificial intelligence for team sports: A survey. Knowl. Eng. Rev. 2019, 34, 1–37. [Google Scholar] [CrossRef]
- Friedrich, S.; Antes, G.; Behr, S.; Binder, H.; Brannath, W.; Dumpert, F.; Ickstadt, K.; Kestler, H.A.; Lederer, J.; Leitgöb, H.; et al. Is there a role for statistics in artificial intelligence? Adv. Data Anal. Classif. 2022, 16, 823–846. [Google Scholar] [CrossRef]
- Cao, L.; Yang, Q.; Yu, P.S. Data science and AI in FinTech: An overview. Int. J. Data Sci. Anal. 2021, 12, 81–99. [Google Scholar] [CrossRef]
- Ekstrøm, C.T.; Jensen, A.K. Having a ball: Evaluating scoring streaks and game excitement using in-match trend estimation. AStA Adv. Stat. Anal. 2022, 107, 295–311. [Google Scholar] [CrossRef] [PubMed]
- Maddox, J.T.; Sides, R.; Harvill, J.L. Bayesian estimation of in-game home team win probability for college basketball. J. Quant. Anal. Sport. 2022, 18, 201–213. [Google Scholar] [CrossRef]
- Lewis, M.; Moneyball: The Art of Winning an Unfair Game [Internet]. Choice Reviews Online. 2004. Available online: http://repositorio.unan.edu.ni/2986/1/5624.pdf (accessed on 20 January 2022).
- Donoghue, P.O. Research Methods for Sports Performance Analysis [Internet]; Routledge: London, UK, 2009; 295p, Available online: http://www.tandfebooks.com/isbn/9780203878309 (accessed on 15 February 2022).
- Supola, B.; Hoch, T.; Baca, A. Modeling the formation of defensive gaps in basketball: Cutting on a teammate’s drive. PLoS ONE 2023, 18, e0281467. [Google Scholar] [CrossRef] [PubMed]
- NBA Basketball Reference, W. NBA Basketball Reference [Internet]. 2023. Available online: https://www.basketball-reference.com/ (accessed on 20 August 2023).
- ESPN NBA Stats, W. ESPN NBA Stats [Internet]. 2023. Available online: https://www.espn.com/nba/stats (accessed on 10 January 2023).
- NBA.com. NBA.com [Internet]. 2023. Available online: https://stats.nba.com (accessed on 1 November 2023).
- Gerrard, B. Moneyball and the Role of Sports Analytics: A Decision-Theoretic Perspective. In Proceedings of the North American Society for Sport Management Conference (NASSM 2016), Orlando, FL, USA, 31 May–5 June 2016; pp. 2010–2012. [Google Scholar]
- Vaz de Melo, P.; Almeida, V.; Loureiro, A.; Faloutsos, C. Forecasting in the NBA and Other Team Sports: Network Effects in Action. ACM Trans. Knowl. Discov. Data 2012, 6, 1–27. [Google Scholar] [CrossRef]
- Vinue, G.; Epifanio, I. Forecasting basketball players’ performance using sparse functional data. Stat. Anal. Data Min. 2018, 12, 534–547. [Google Scholar] [CrossRef]
- U.S. Bureau of Labor Statistics W. U.S. Bureau of Labor Statistics [Internet]. 2022. Available online: https://www.bls.gov/ (accessed on 1 February 2022).
- D’Urso, P.; De Giovanni, L.; Massari, R. Trimmed fuzzy clustering of financial time series based on dynamic time warping. Ann. Oper. Res. 2021, 299, 1379–1395. [Google Scholar] [CrossRef]
- Zimmermann, A. Basketball predictions in the NCAAB and NBA: Similarities and differences. Stat. Anal. Data Min. 2016, 9, 350–364. [Google Scholar] [CrossRef]
- Han, J.; Kamber, M.; Pei, J. Data Mining: Concepts and Techniques [Internet], 3rd ed.; Elsevier: Amsterdam, The Netherlands; Morgan Kaufmann: Burlington, MA, USA, 2011; pp. 1–740. Available online: https://myweb.sabanciuniv.edu/rdehkharghani/files/2016/02/The-Morgan-Kaufmann-Series-in-Data-Management-Systems-Jiawei-Han-Micheline-Kamber-Jian-Pei-Data-Mining.-Concepts-and-Techniques-3rd-Edition-Morgan-Kaufmann-2011.pdf (accessed on 2 December 2020).
- Jasinska-Piadlo, A.; Bond, R.; Biglarbeigi, P.; Brisk, R.; Campbell, P.; Browne, F.; McEneaneny, D. Data-driven versus a domain-led ap-proach to k-means clustering on an open heart failure dataset. Int. J. Data Sci. Anal. 2022, 15, 49–66. [Google Scholar] [CrossRef]
- Unnikrishnan, V.; Beyer, C.; Matuszyk, P.; Niemann, U.; Pryss, R.; Schlee, W.; Ntoutsi, E. Entity-level stream classification: Exploiting entity similarity to label the future observations referring to an entity. Int. J. Data Sci. Anal. 2020, 9, 1–15. [Google Scholar] [CrossRef]
- Sassi, S.; Ivanovic, M.; Chbeir, R.; Prasath, R.; Manolopoulos, Y. Collective intelligence and knowledge exploration: An intro-duction. Int. J. Data Sci. Anal. 2022, 14, 99–111. [Google Scholar] [CrossRef] [PubMed]
- Downward, P.; Dawson, A.; Dejonghe, T. Sports Economics: Theory, Evidence and Policy [Internet]; Elsevier: Amsterdam, The Netherlands, 2009; 440p, Available online: www.elsevierdirect.com (accessed on 12 December 2022).
- Nagarajan, R.; Li, L. Optimizing NBA player selection strategies based on salary and statistics analysis. In Proceedings of the 2017 IEEE 15th Intl Conf on Dependable, Autonomic and Secure Computing, 15th Intl Conf on Pervasive Intelligence and Computing, 3rd Intl Conf on Big Data Intelligence and Computing and Cyber Science and Technology Congress(DASC/PiCom/DataCom/CyberSciTech), Orlando, FL, USA, 6–10 November 2017. [Google Scholar]
- Papadaki, I.; Tsagris, M. Estimating NBA players salary share according to their performance on court : A machine learning approach. arXiv 2020, arXiv:2007.14694. [Google Scholar]
- Rosen, J.; Arcidiacono, P.; Advisor, F.; Kimbrough, K.; Advisor, F. Determining NBA Free Agent Salary from Player Performance; Duke University: Durham, NC, USA, 2016. [Google Scholar]
- Bordo, M.D.; Levy, M.D. Do enlarged fiscal deficits cause inflation? The historical record. Econ. Aff. 2021, 41, 59–83. [Google Scholar] [CrossRef]
- D’Urso, P.; De Giovanni, L.; Massari, R. Smoothed self-organizing map for robust clustering. Inf. Sci. 2020, 512, 381–401. [Google Scholar] [CrossRef]
- Leigh, D.; Ball, L.; Mishra, P. Understanding U.S. Inflation During the COVID Era. IMF Work Pap. 2022, 2022, 1. [Google Scholar] [CrossRef]
- Kwartler, T. Sports Analytics in Practice with R; Wiley: Hoboken, NJ, USA, 2022. [Google Scholar]
- Li, X.; Zhang, Z.; Stefanidis, K. A data-driven approach for video game playability analysis based on players’ reviews. Information 2021, 12, 129. [Google Scholar] [CrossRef]
- Wolf, C. An Analysis of NBA Teams’ Spending by Position for the Upcoming Season [Internet]. 2019. Available online: https://www.samford.edu/sports-analytics/fans/2019/An-Analysis-of-NBA-Teams-Spending-by-Position-for-the-Upcoming-Season (accessed on 21 February 2021).
- Johnsson, E. Wanna Make Money in the NBA? Be a Center [Internet]. The Official Blog of the Harvard Sports Analysis Collective. 2018. Available online: https://harvardsportsanalysis.org/2018/10/wanna-make-money-in-the-nba-be-a-center/ (accessed on 15 January 2021).
- Curcic, D. The Ultimate Analysis of NBA Salaries [1991–2019] [Internet]. 2020. Available online: https://runrepeat.com/salary-analysis-in-the-nba-1991-2019 (accessed on 10 February 2021).
- Ward, M.R.; Harmon, A.D. ESport Superstars. J. Sports Econom. 2019, 20, 987–1013. [Google Scholar] [CrossRef]
- O’Neil, W. How to Make Money in Stocks: A Winning System in Good Times and Bad; McGraw-Hill: New York, NY, USA, 2013; ISBN 9780071832793. [Google Scholar]
- Kalén, A.; Pérez-Ferreirós, A.; Costa, P.B.; Rey, E. Effects of age on physical and technical performance in National Basketball Association (NBA) players. Res. Sport. Med. 2021, 29, 277–288. [Google Scholar] [CrossRef]
- Madhavan, V. Predicting NBA Game Outcomes with Hidden Markov Models. 2017. Available online: https://www.semanticscholar.org/paper/Predicting-NBA-Game-Outcomes-with-Hidden-Markov-Madhavan/c1309669d56bf65a30d17f7e205a332aa972e66b (accessed on 13 March 2022).
- Franks, A.M.; D’Amour, A.; Cervone, D.; Bornn, L. Meta-analytics: Tools for understanding the statistical properties of sports metrics. J. Quant. Anal. Sport. 2016, 12, 151–165. [Google Scholar] [CrossRef]
- Yang, Y. Predicting Regular Season Results of NBA Teams Based on Regression Analysis of Common Basketball Statistics; University of California at Berkeley: Berkeley, CA, USA, 2015. [Google Scholar]
- Bension, J.B. The Importance of NBA Box Score Statistics and the Value of Statistical Outbursts [Internet]. 2019. Available online: http://repository.library.csuci.edu/bitstream/handle/10211.3/214528/Bension,JackMSCSThesisF19_done.pdf?sequence=1 (accessed on 18 March 2022).
- Serrano, S. Basketball (and Other Things): A Collection of Questions Asked, Answered, Illustrated; Abrams Image: New, York, USA, 2017; ISBN 978-1-4197-2647-7. [Google Scholar]
- Teramoto, M.; Cross, C.L.; Cushman, D.M.; Maak, T.G.; Petron, D.J.; Willick, S.E. Game injuries in relation to game schedules in the National Basketball Association. J. Sci. Med. Sport 2017, 20, 230–235. [Google Scholar] [CrossRef] [PubMed]
- Malinowski, E. Betaball: How Silicon Valley and Science Built One of the Greatest Basketball Teams in History; Atria books: New York, NY, USA, 2017. [Google Scholar]
- Manner, H. Modeling and forecasting the outcomes of NBA basketball games. J. Quant. Anal. Sport. 2016, 12, 25. [Google Scholar] [CrossRef]
- Siegel, E. Predictive Analytics: The Power to Predict Who Will Click, Buy, Lie, or Die; Wiley: Hoboken, NJ, USA, 2013; ISBN 978-1-118-35685-2. [Google Scholar]
- Wheelan, C.; Wheelam, C. Naked Statistics: Stripping the Dread from the Data; W. W. Norton & Company: New York, NY, USA, 2013; ISBN 9788578110796. [Google Scholar]
- Ross, C.; Lambs, P.; McAlpine, P.; Kennedy, G.; Button, C. Validation of gyroscope sensors for snow sports performance monitoring. Int. J. Comput. Sci. Sport 2020, 19, 51–59. [Google Scholar] [CrossRef]
- Cea, S.; Durán, G.; Guajardo, M.; Sauré, D.; Siebert, J.; Zamorano, G. An analytics approach to the FIFA ranking procedure and the World Cup final draw. Ann. Oper. Res. 2020, 286, 119–146. [Google Scholar] [CrossRef]
- Pelechrinis, K.; Papalexakis, E. Athlytics: Winning in Sports with Data. In Proceedings of the WSDM 2018: The Eleventh ACM International Conference on Web Search and Data Mining, Marina Del Rey, CA, USA, 5–9 February 2018; pp. 787–788. Available online: https://dl.acm.org/doi/10.1145/3159652.3162005 (accessed on 12 May 2022).
- Chartier, T. Coachable Business Results. J. Corp. Account. Financ. 2015, 27, 83–85. [Google Scholar] [CrossRef]
- Watson, A.M.; Haraldsdottir, K.; Biese, K.; Stevens, B.; McGuine, T. The Association of COVID-19 Incidence with Sport and Face Mask Use in United States High School Athletes. J. Athl. Train. 2021, 58, 29–36. [Google Scholar] [CrossRef]
- Senbel, S.; Sharma, S.; Raval, M.S.; Taber, C.; Nolan, J.; Artan, N.S.; Ezzeddine, D.; Kaya, T. Impact of Sleep and Training on Game Performance and Injury in Division-1 Women’s Basketball Amidst the Pandemic. IEEE Access 2022, 10, 15516–15527. [Google Scholar] [CrossRef]
Figure 1.
Professional player average body profile in various sports compared with an average man.

Figure 2.
Data collection, pre-processing, data mining, and interpretation process.

Figure 3.
NBA Teams’ financial losses from player health pathologies and injuries (2010–2020).

Figure 4.
Average annual NBA player salary compared with the previous year, over 24 seasons (1996–2020).
Figure 4.
Average annual NBA player salary compared with the previous year, over 24 seasons (1996–2020).

Figure 5.
Average NBA player salary per team over 24 seasons (1996–2020).

Figure 6.
NBA player age clustering in correlation with basketball advanced analytics and average inflated salaries over 24 seasons (1996–2020).
Figure 6.
NBA player age clustering in correlation with basketball advanced analytics and average inflated salaries over 24 seasons (1996–2020).

Figure 7.
Left side: Radial chart distribution of average NBA player salary per team over 24 seasons (1996–2020). Right side: Team name and abbreviation.
Figure 7.
Left side: Radial chart distribution of average NBA player salary per team over 24 seasons (1996–2020). Right side: Team name and abbreviation.

Figure 8.
Tornado funnel diagram for all NBA players over 24 seasons (1996–2020) regarding inflated salary versus age.
Figure 8.
Tornado funnel diagram for all NBA players over 24 seasons (1996–2020) regarding inflated salary versus age.

Table 1.
NBA players’ average salary per position over 24 seasons (1996–2020).
| Player Positions | Number of Players | % of Players | Average Inflated Salary |
|---|---|---|---|
| C (Centers) | 336 | 21.3% | USD 6,842,627 |
| F (Forwards) | 642 | 40.7% | USD 6,159,377 |
| G (Guards) | 599 | 38.0% | USD 5,365,431 |
| All Players | 1577 | 100% | USD 5,960,735 |
Table 2.
Eight age clusters correlation with player percentage, salary adjusted for inflation and performance estimate rating (PER) over 24 NBA seasons (1996–2020).
Table 2.
Eight age clusters correlation with player percentage, salary adjusted for inflation and performance estimate rating (PER) over 24 NBA seasons (1996–2020).
| Age Clusters | % of Players | Salary Inflated (USD) | PER |
|---|---|---|---|
| 18–20 | 3.4% | 2,953,999 | 13.11 |
| 21–22 | 10.6% | 2,669,485 | 13.80 |
| 23–24 | 17.7% | 3,558,466 | 13.79 |
| 25–26 | 17.2% | 5,762,331 | 14.41 |
| 27–28 | 16.2% | 7,286,295 | 14.15 |
| 29–30 | 13.2% | 8,155,019 | 13.74 |
| 31–33 | 13.4% | 8,171,796 | 13.10 |
| ≥34 | 8.3% | 7,304,144 | 12.94 |
Disclaimer/Publisher’s Note: The statements, opinions and data contained in all publications are solely those of the individual author(s) and contributor(s) and not of MDPI and/or the editor(s). MDPI and/or the editor(s) disclaim responsibility for any injury to people or property resulting from any ideas, methods, instructions or products referred to in the content. |
© 2024 by the authors. Licensee MDPI, Basel, Switzerland. This article is an open access article distributed under the terms and conditions of the Creative Commons Attribution (CC BY) license (https://creativecommons.org/licenses/by/4.0/).
Share and Cite
MDPI and ACS Style
Sarlis, V.; Tjortjis, C. Sports Analytics: Data Mining to Uncover NBA Player Position, Age, and Injury Impact on Performance and Economics. Information 2024, 15, 242. https://doi.org/10.3390/info15040242
AMA Style
Sarlis V, Tjortjis C. Sports Analytics: Data Mining to Uncover NBA Player Position, Age, and Injury Impact on Performance and Economics. Information. 2024; 15(4):242. https://doi.org/10.3390/info15040242
Chicago/Turabian StyleSarlis, Vangelis, and Christos Tjortjis. 2024. "Sports Analytics: Data Mining to Uncover NBA Player Position, Age, and Injury Impact on Performance and Economics" Information 15, no. 4: 242. https://doi.org/10.3390/info15040242
Note that from the first issue of 2016, this journal uses article numbers instead of page numbers. See further details here.