
An mHealth Tool Suite for Mobility Assessment


Abstract
:
1. Introduction
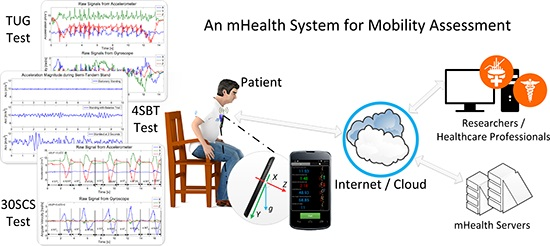
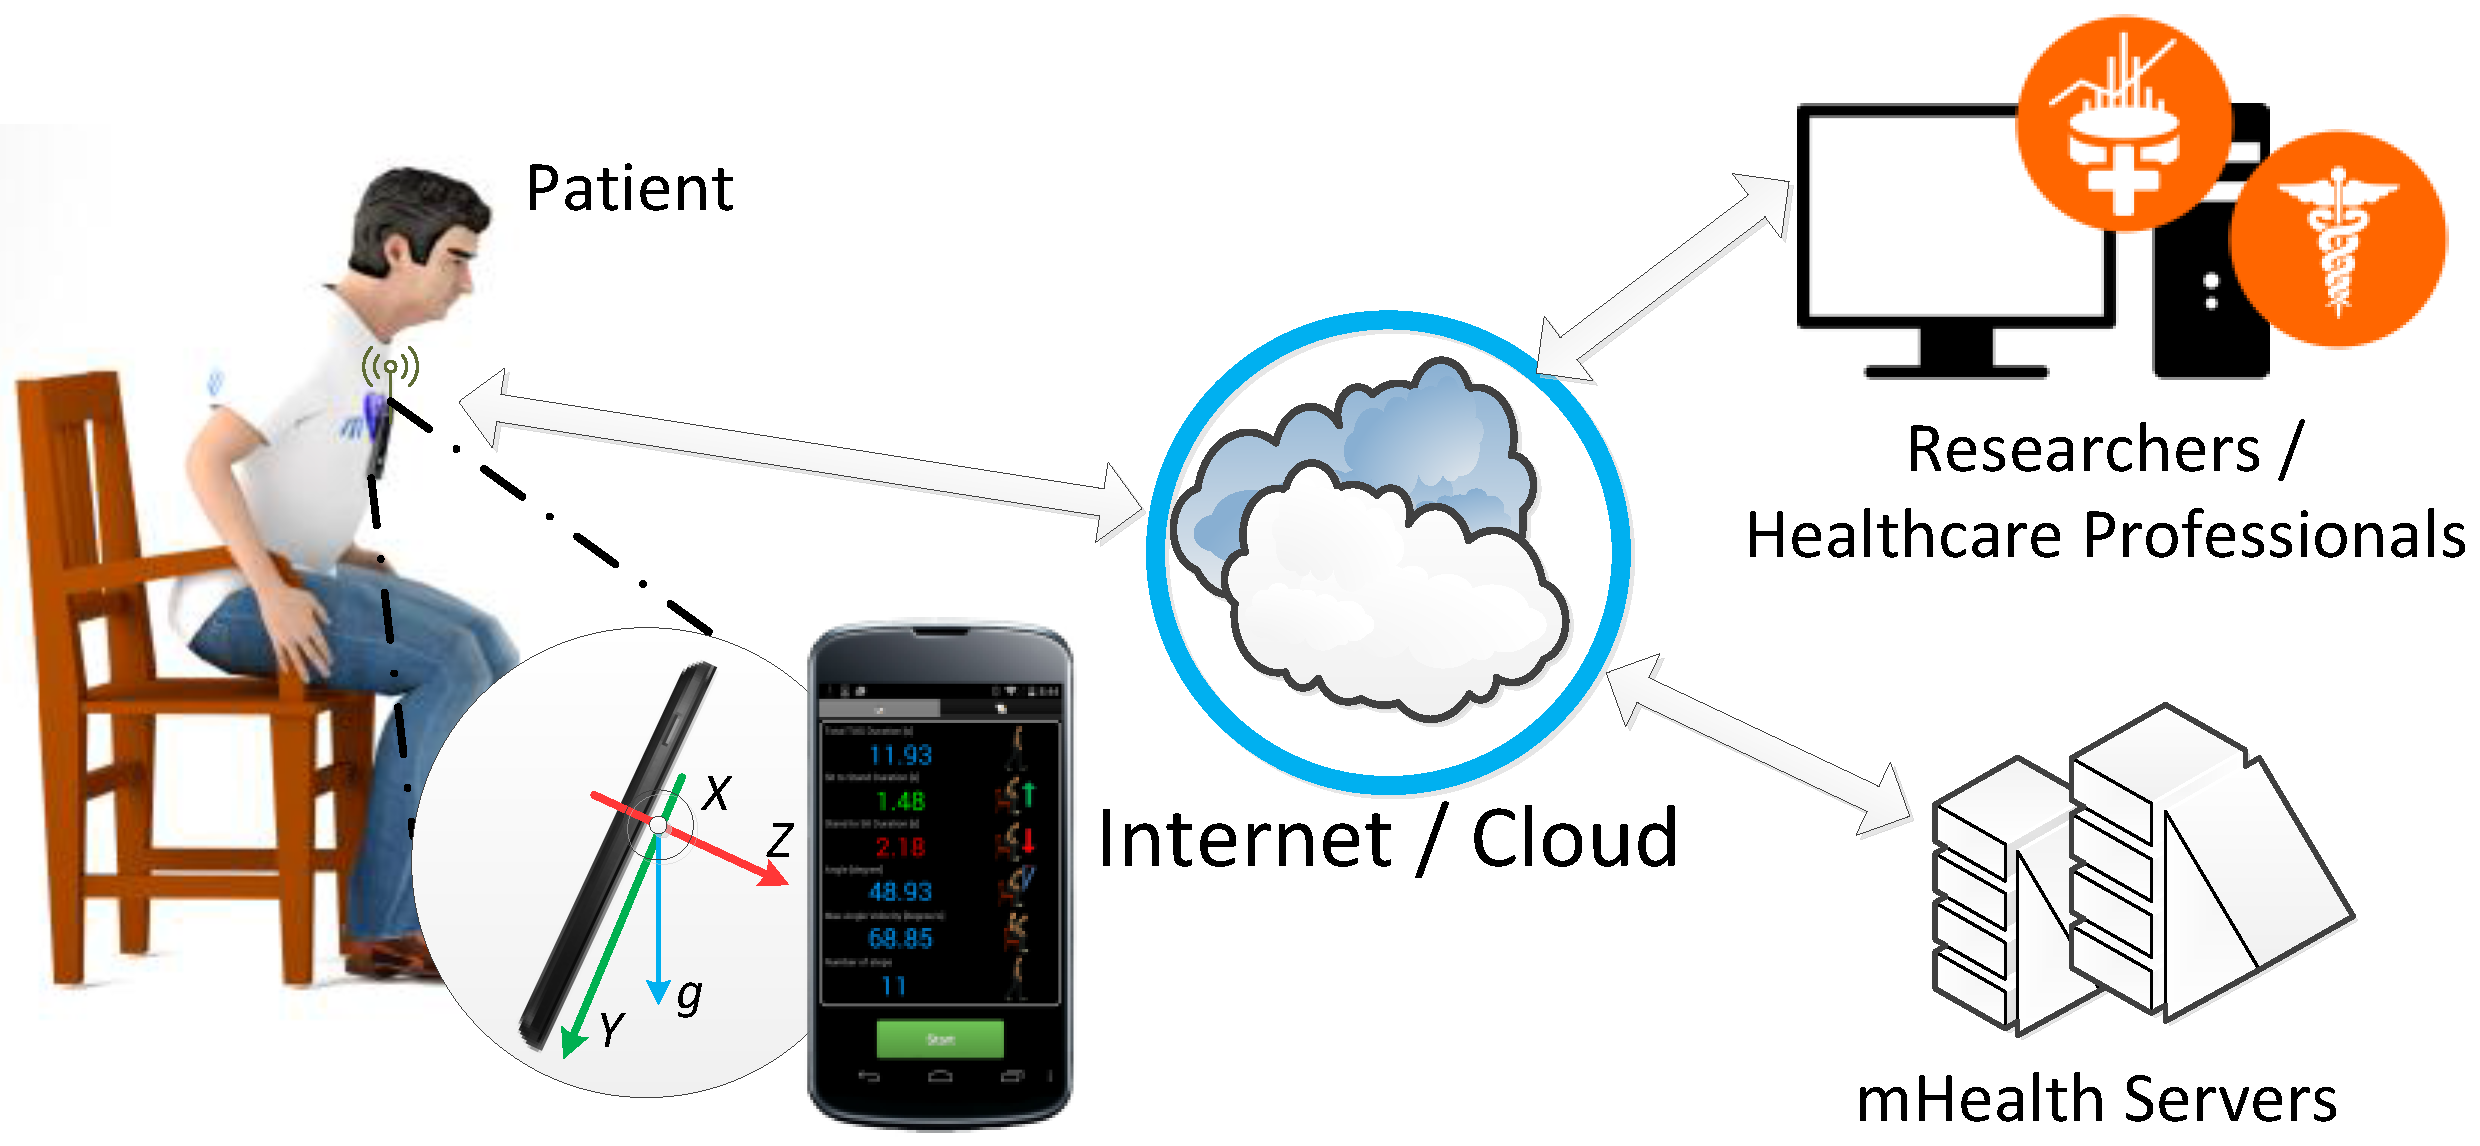
2. Mobility Assessment System
2.1. System Architecture
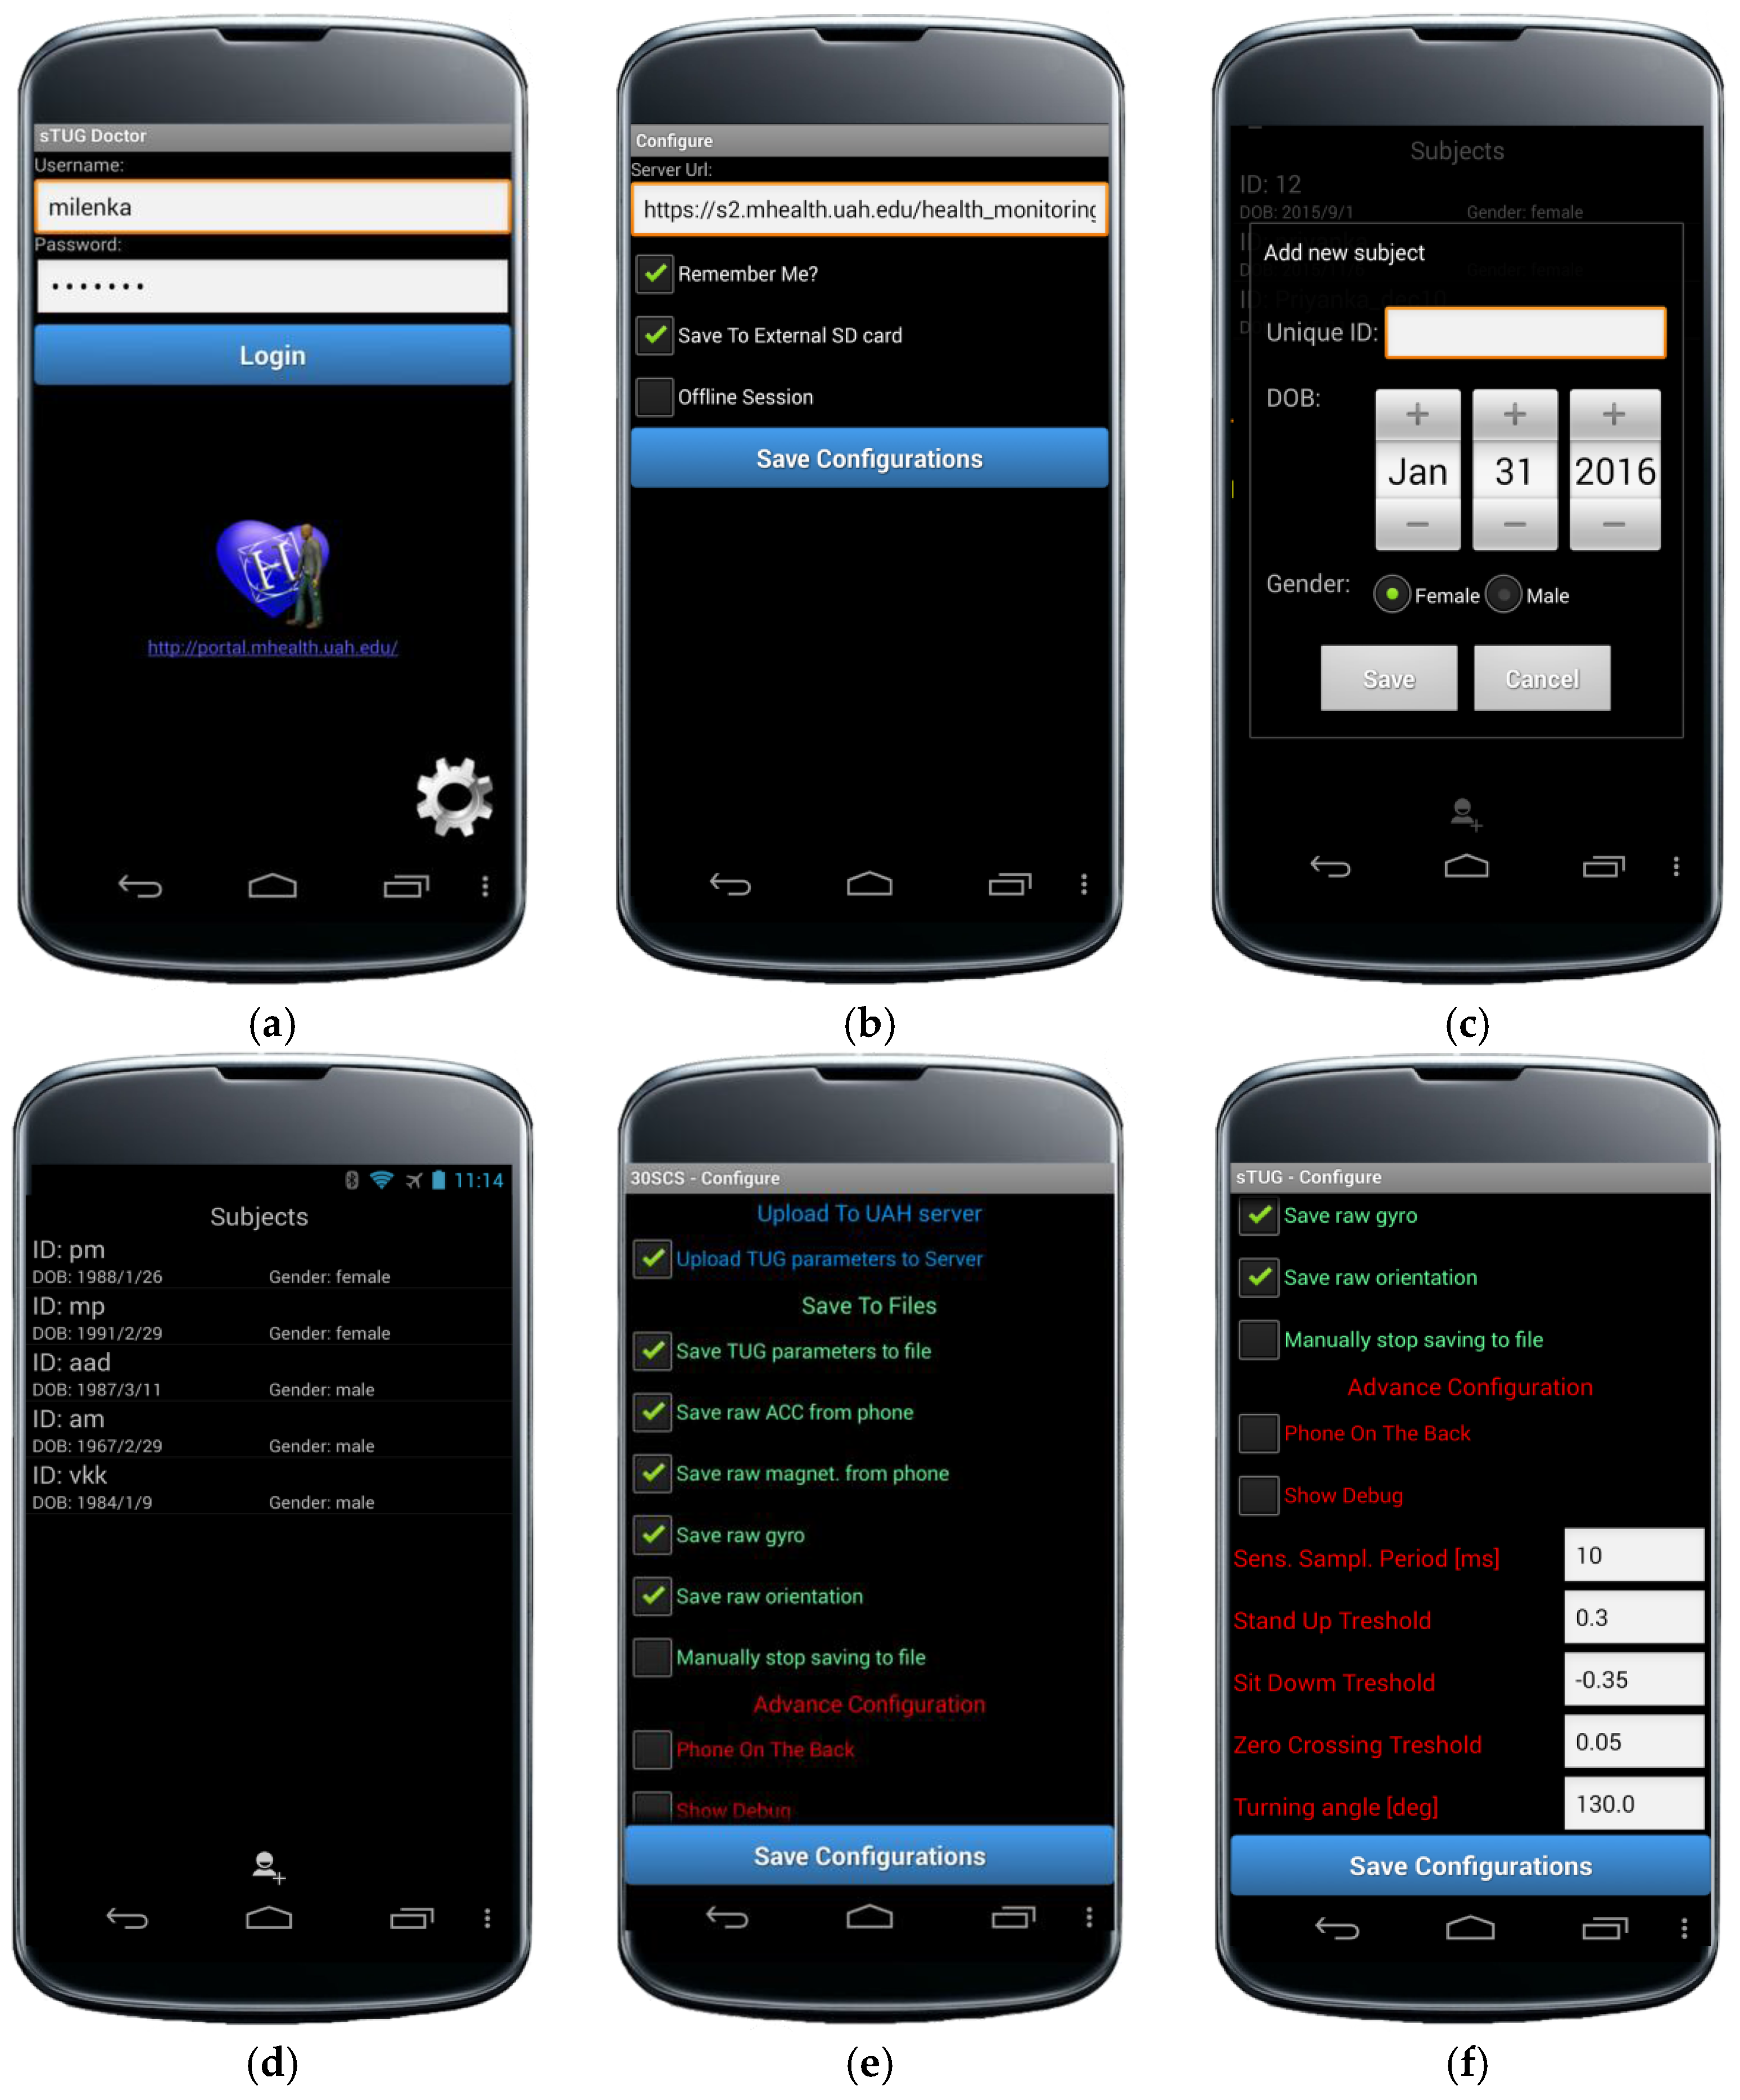
2.2. Settings and Configurations
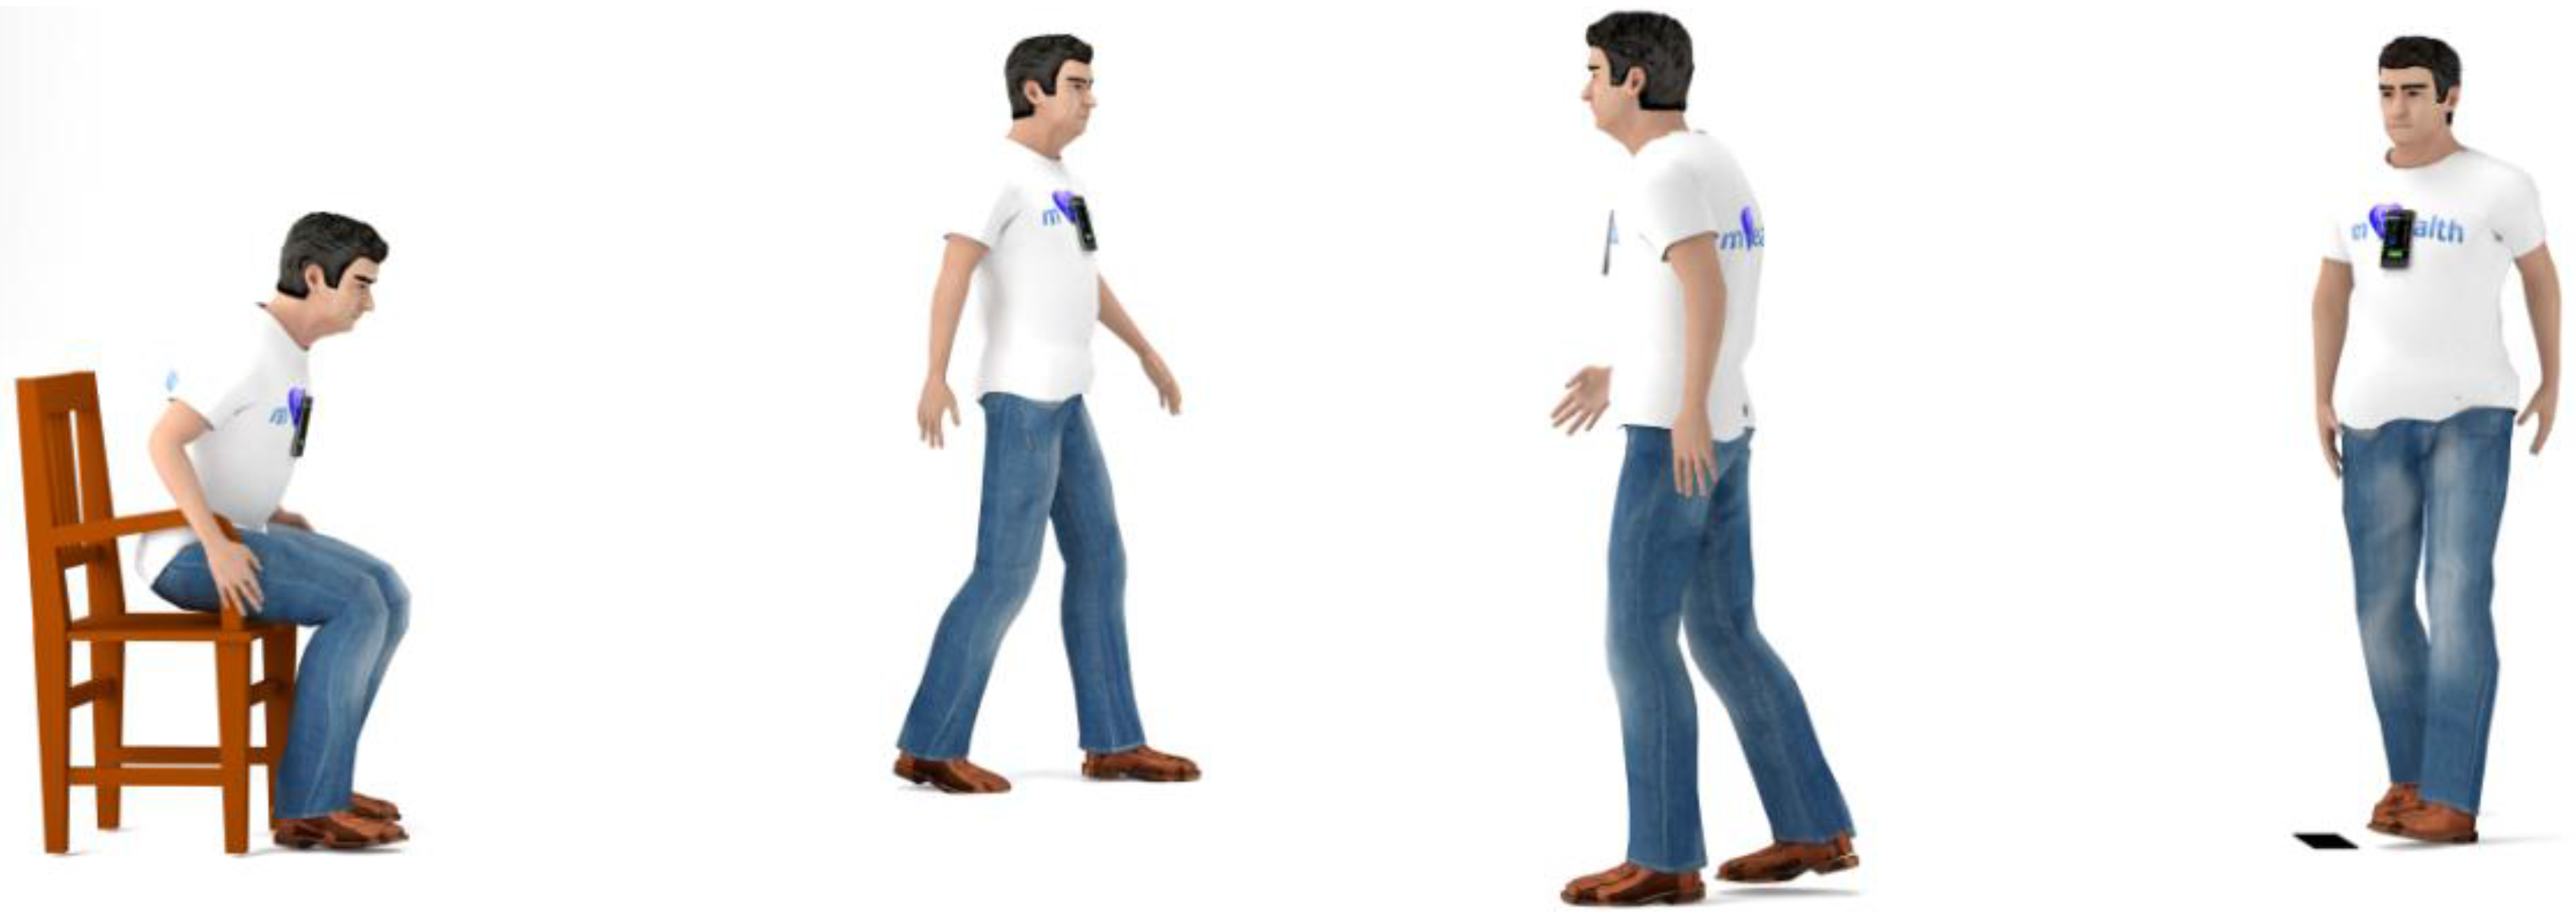
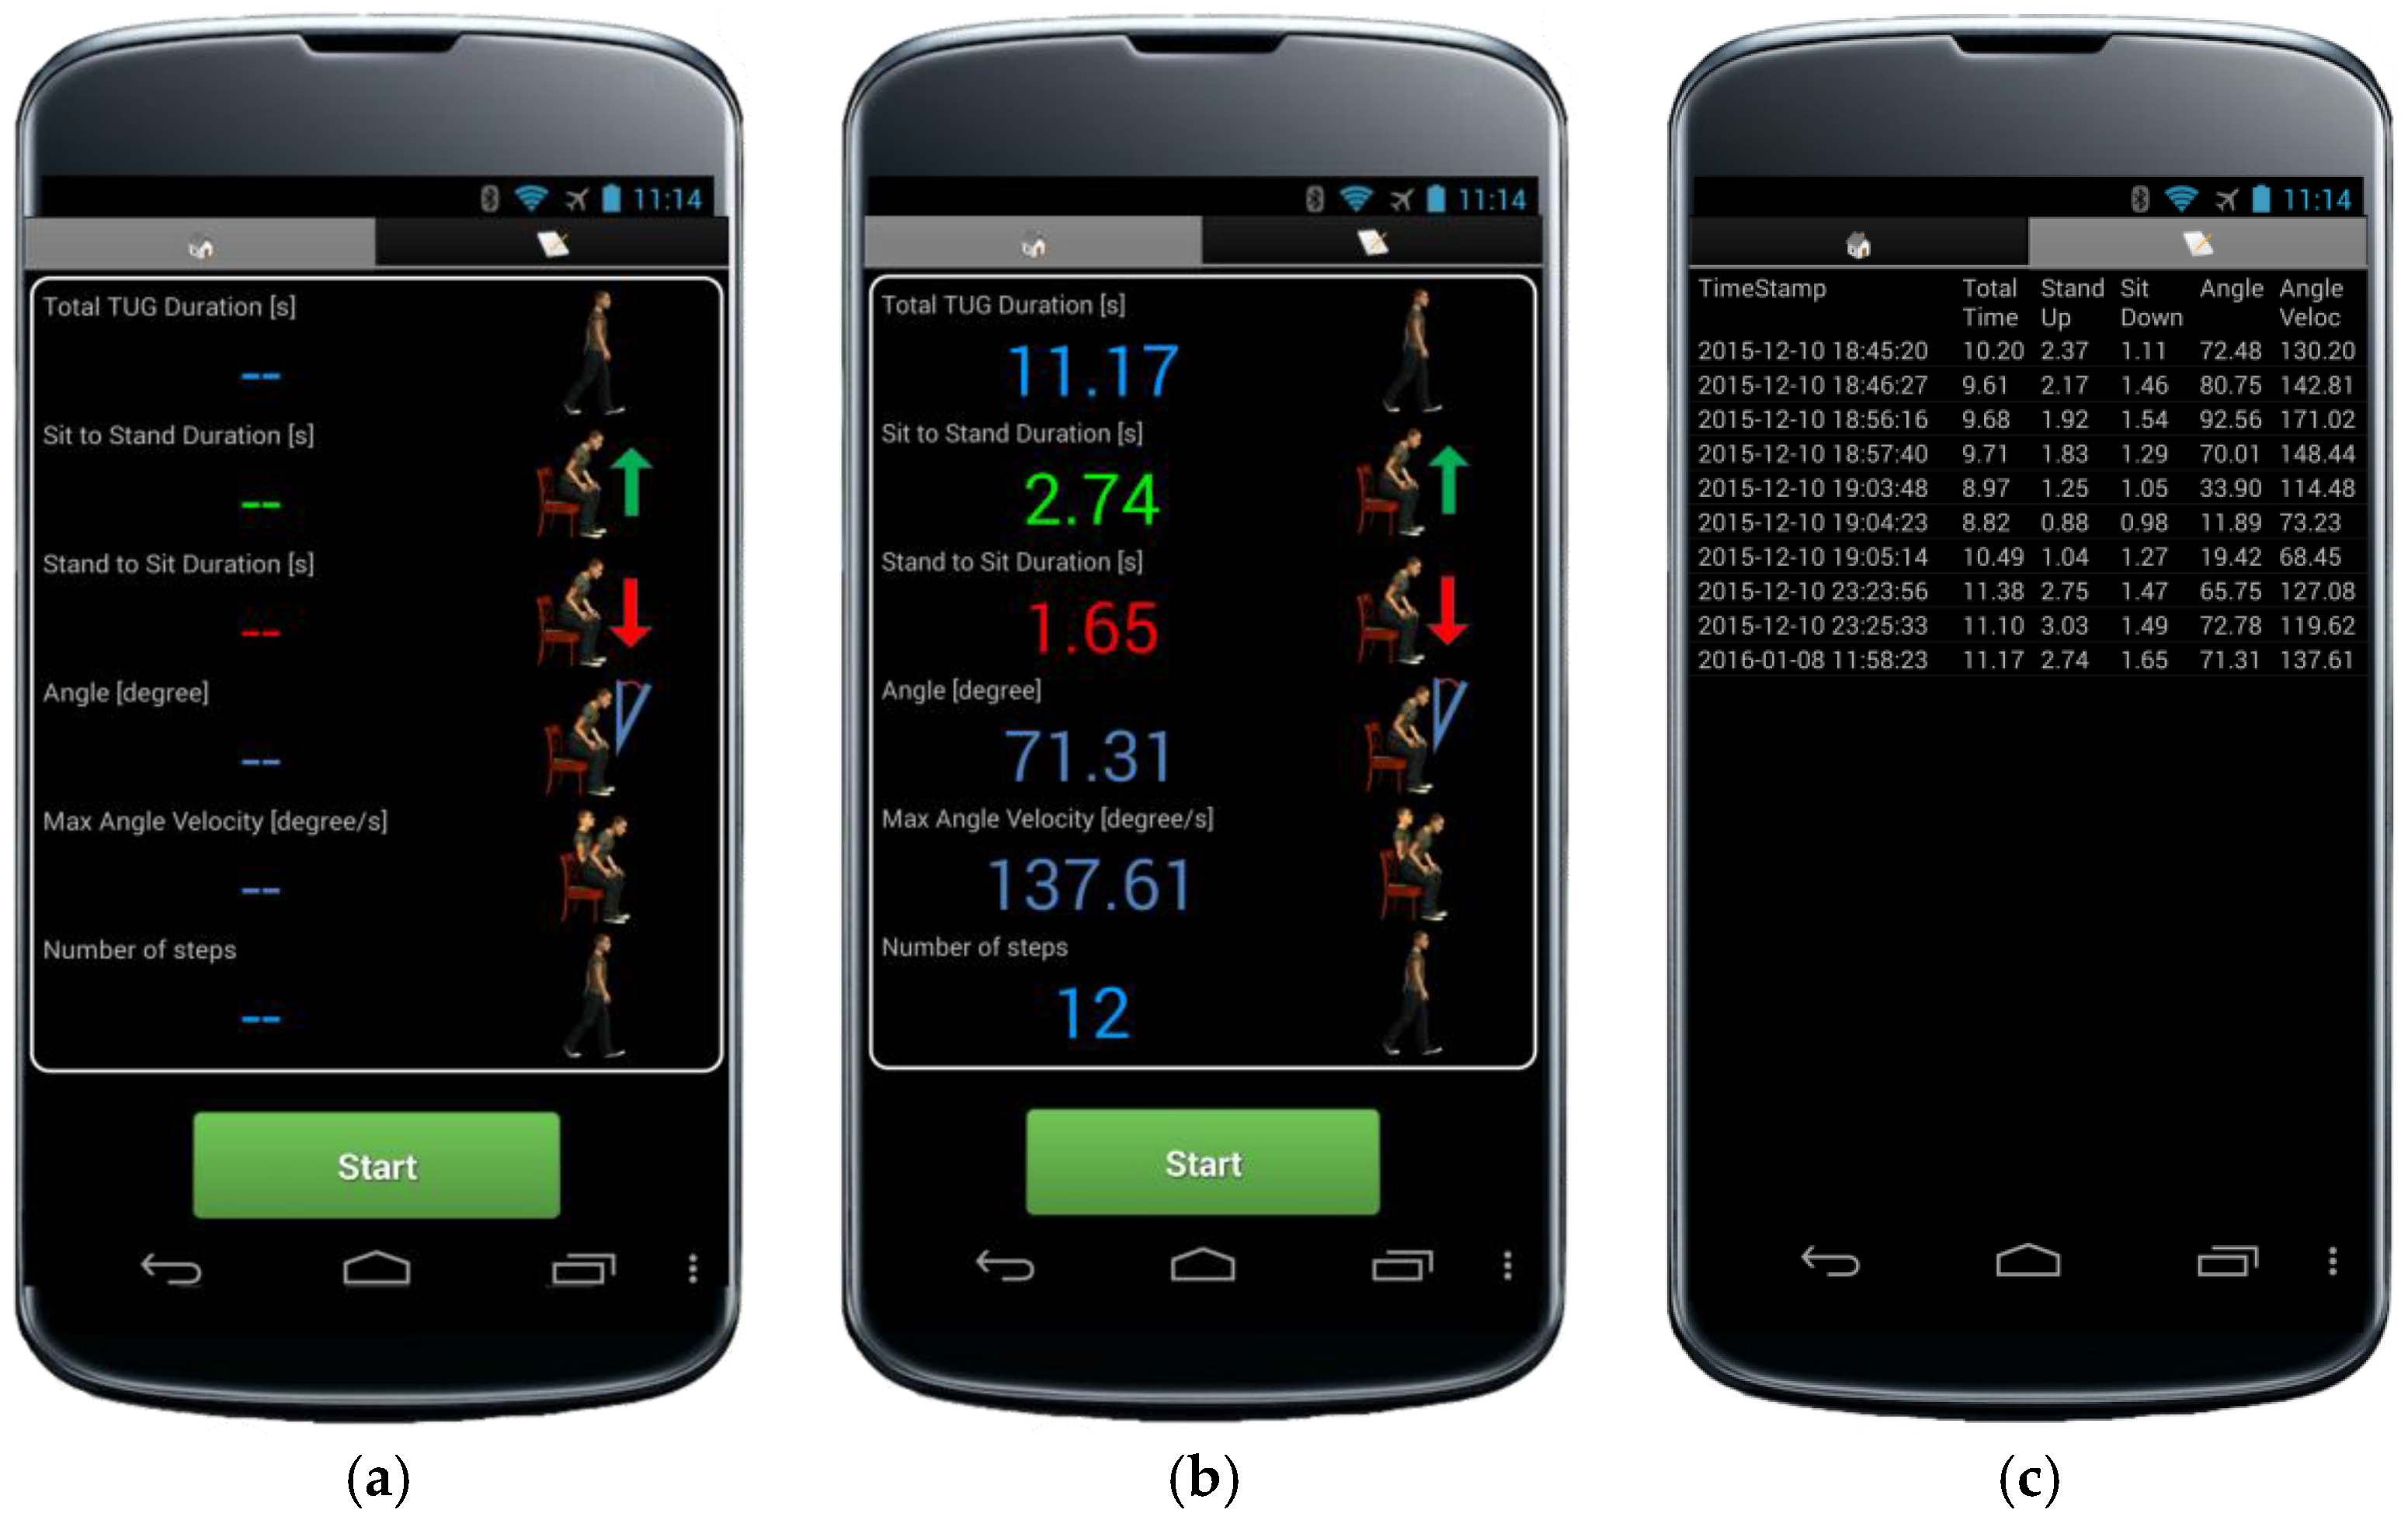
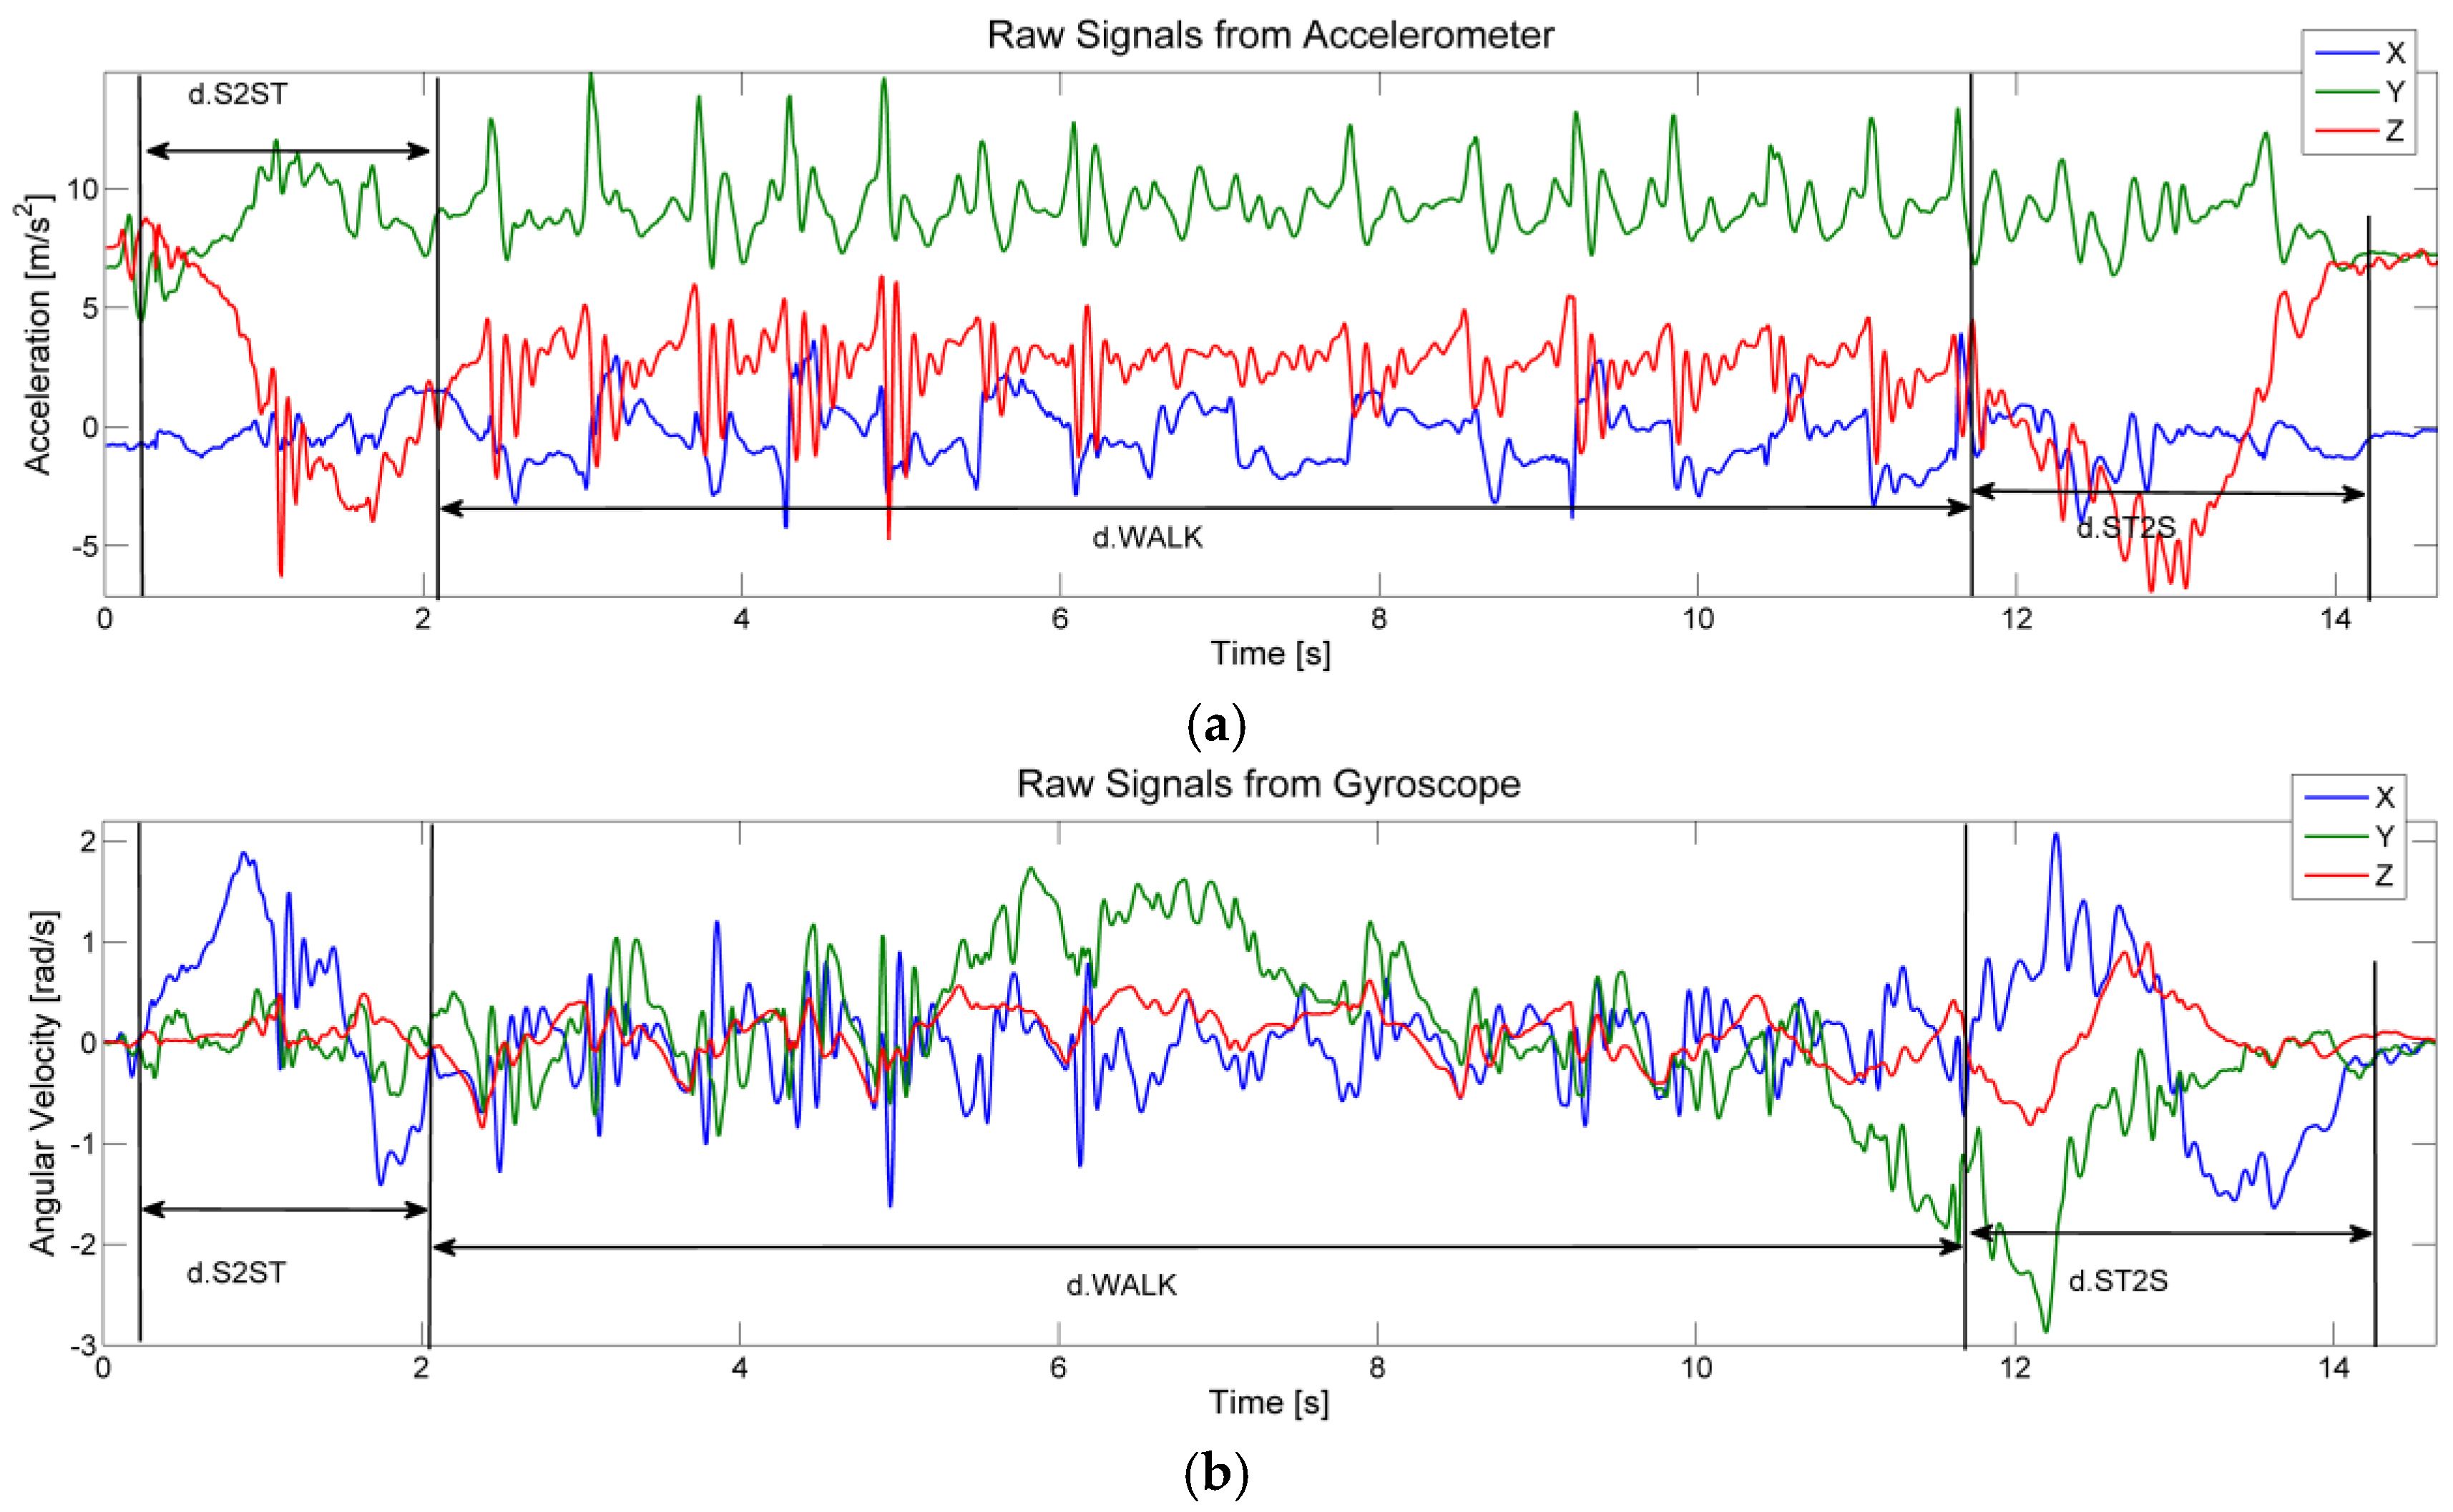
3. Smart Timed Up and Go (sTUG Doctor) Application
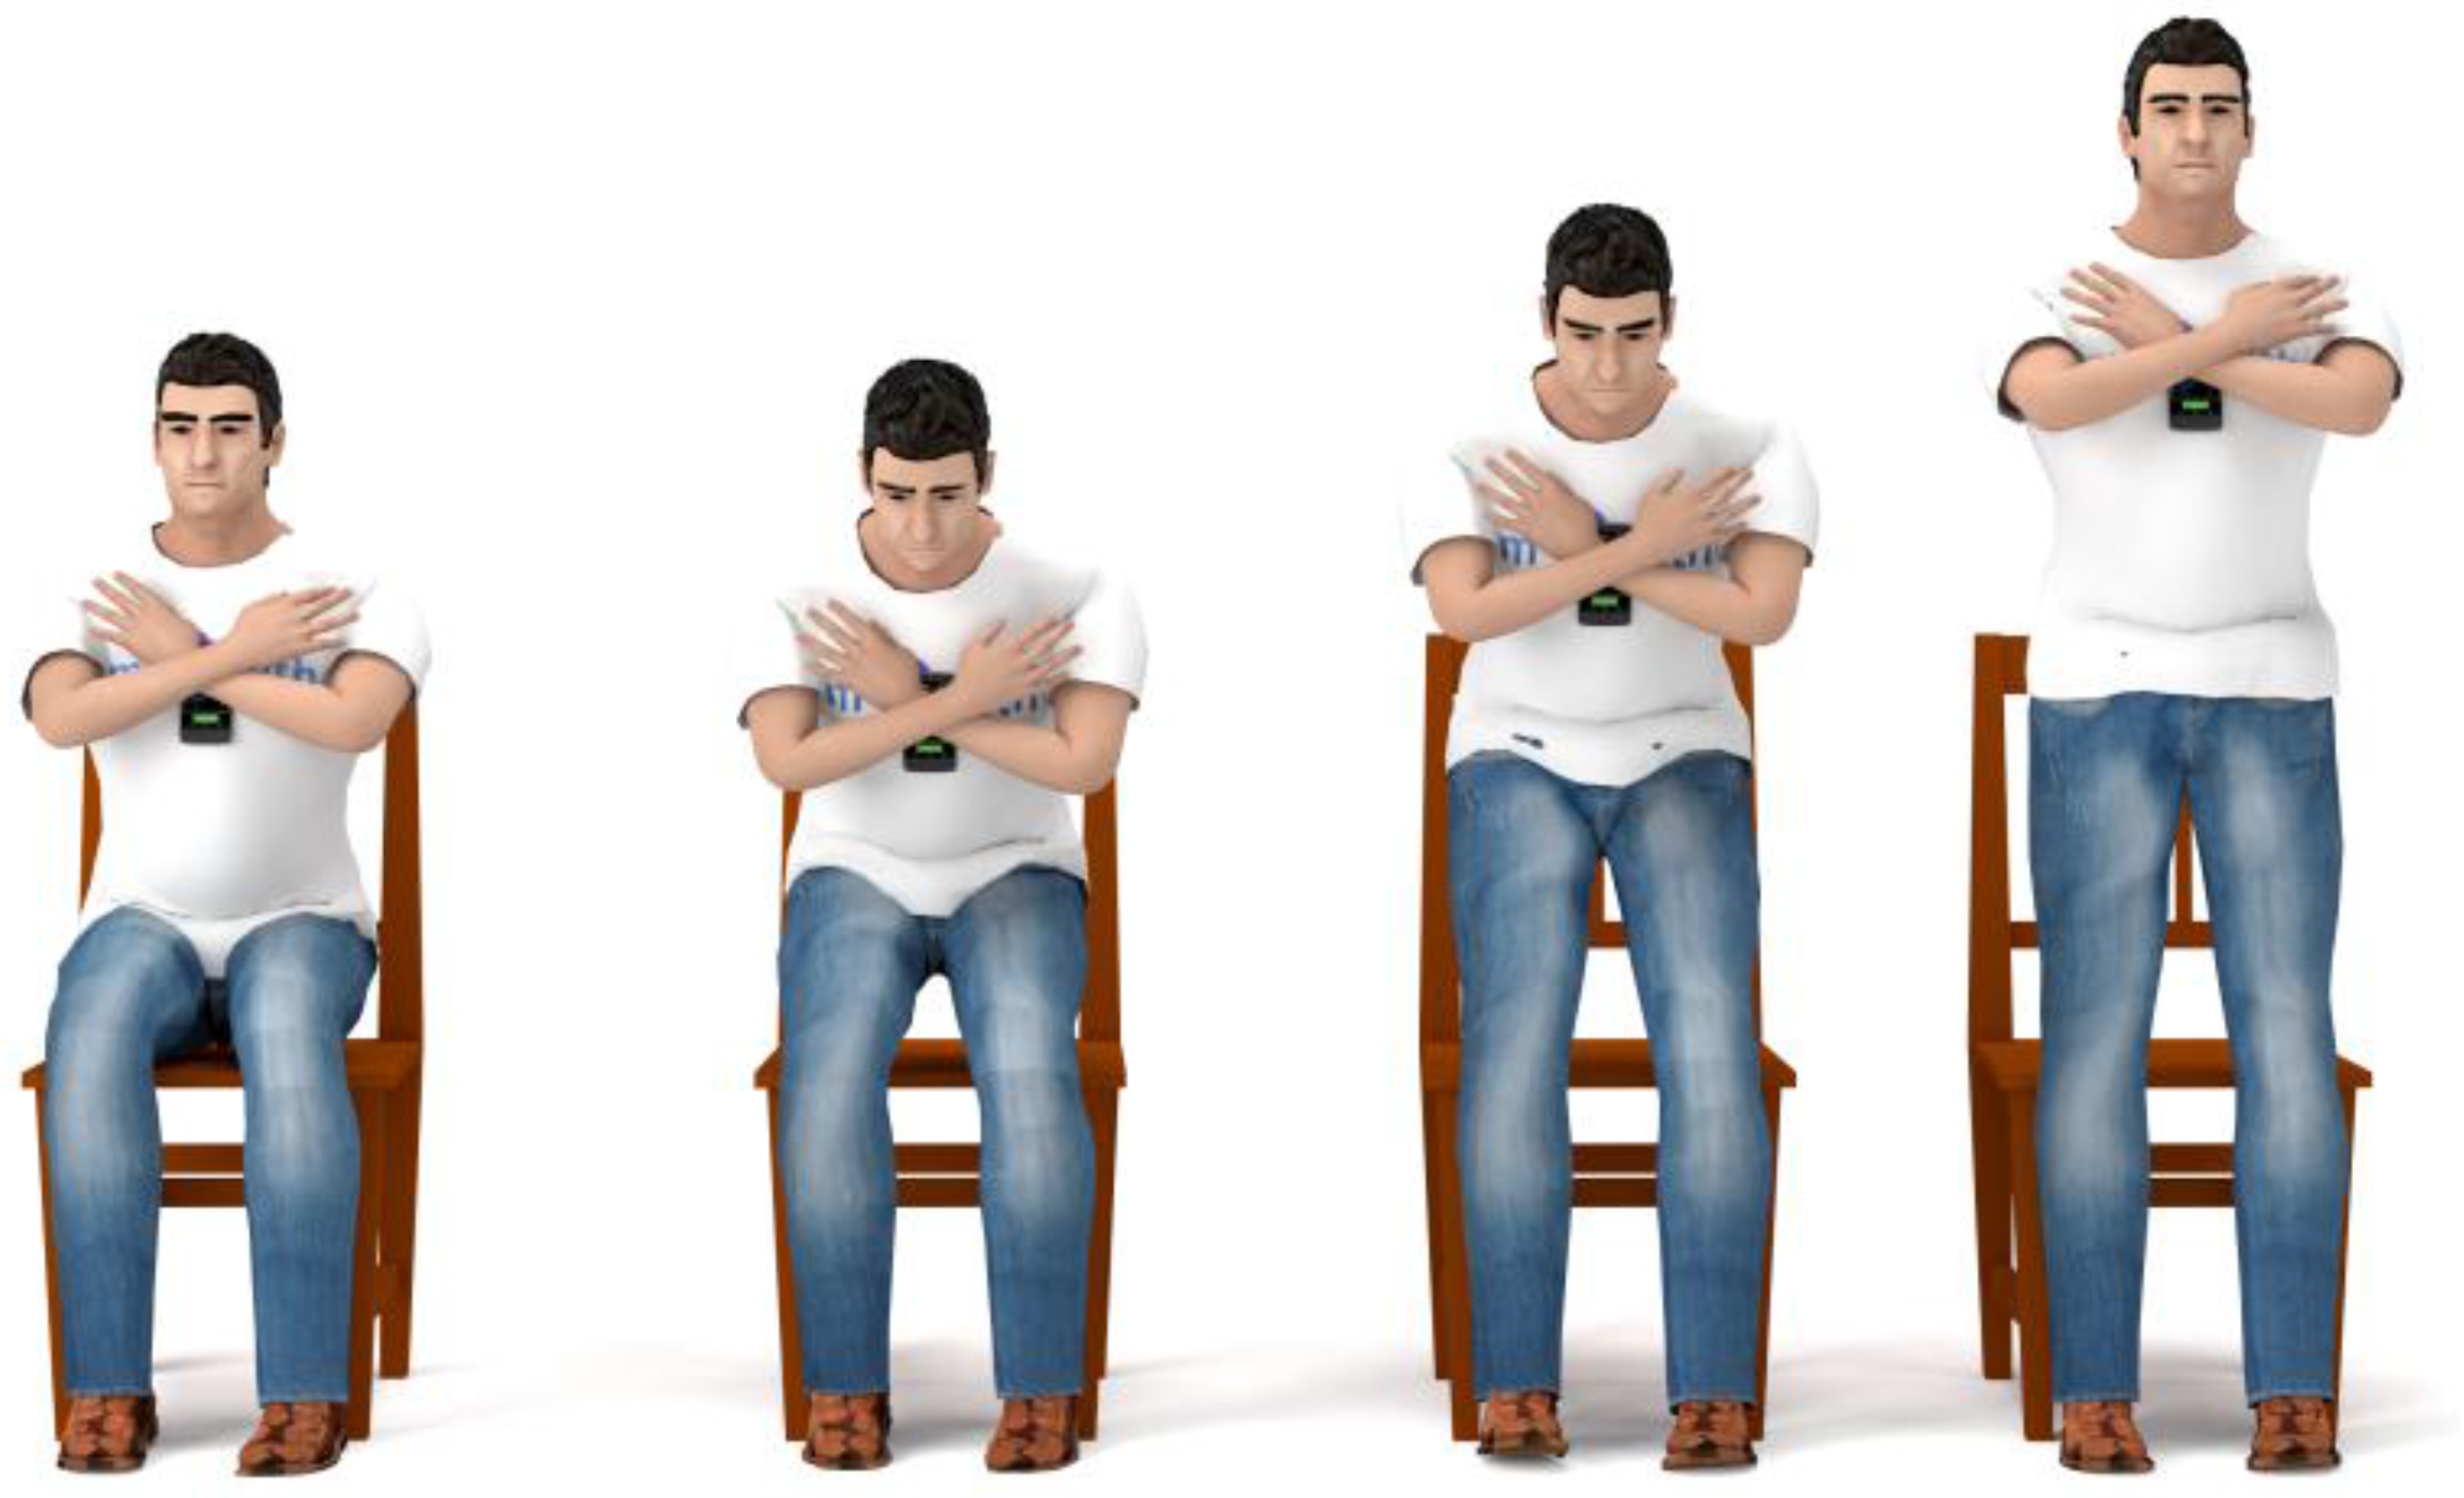
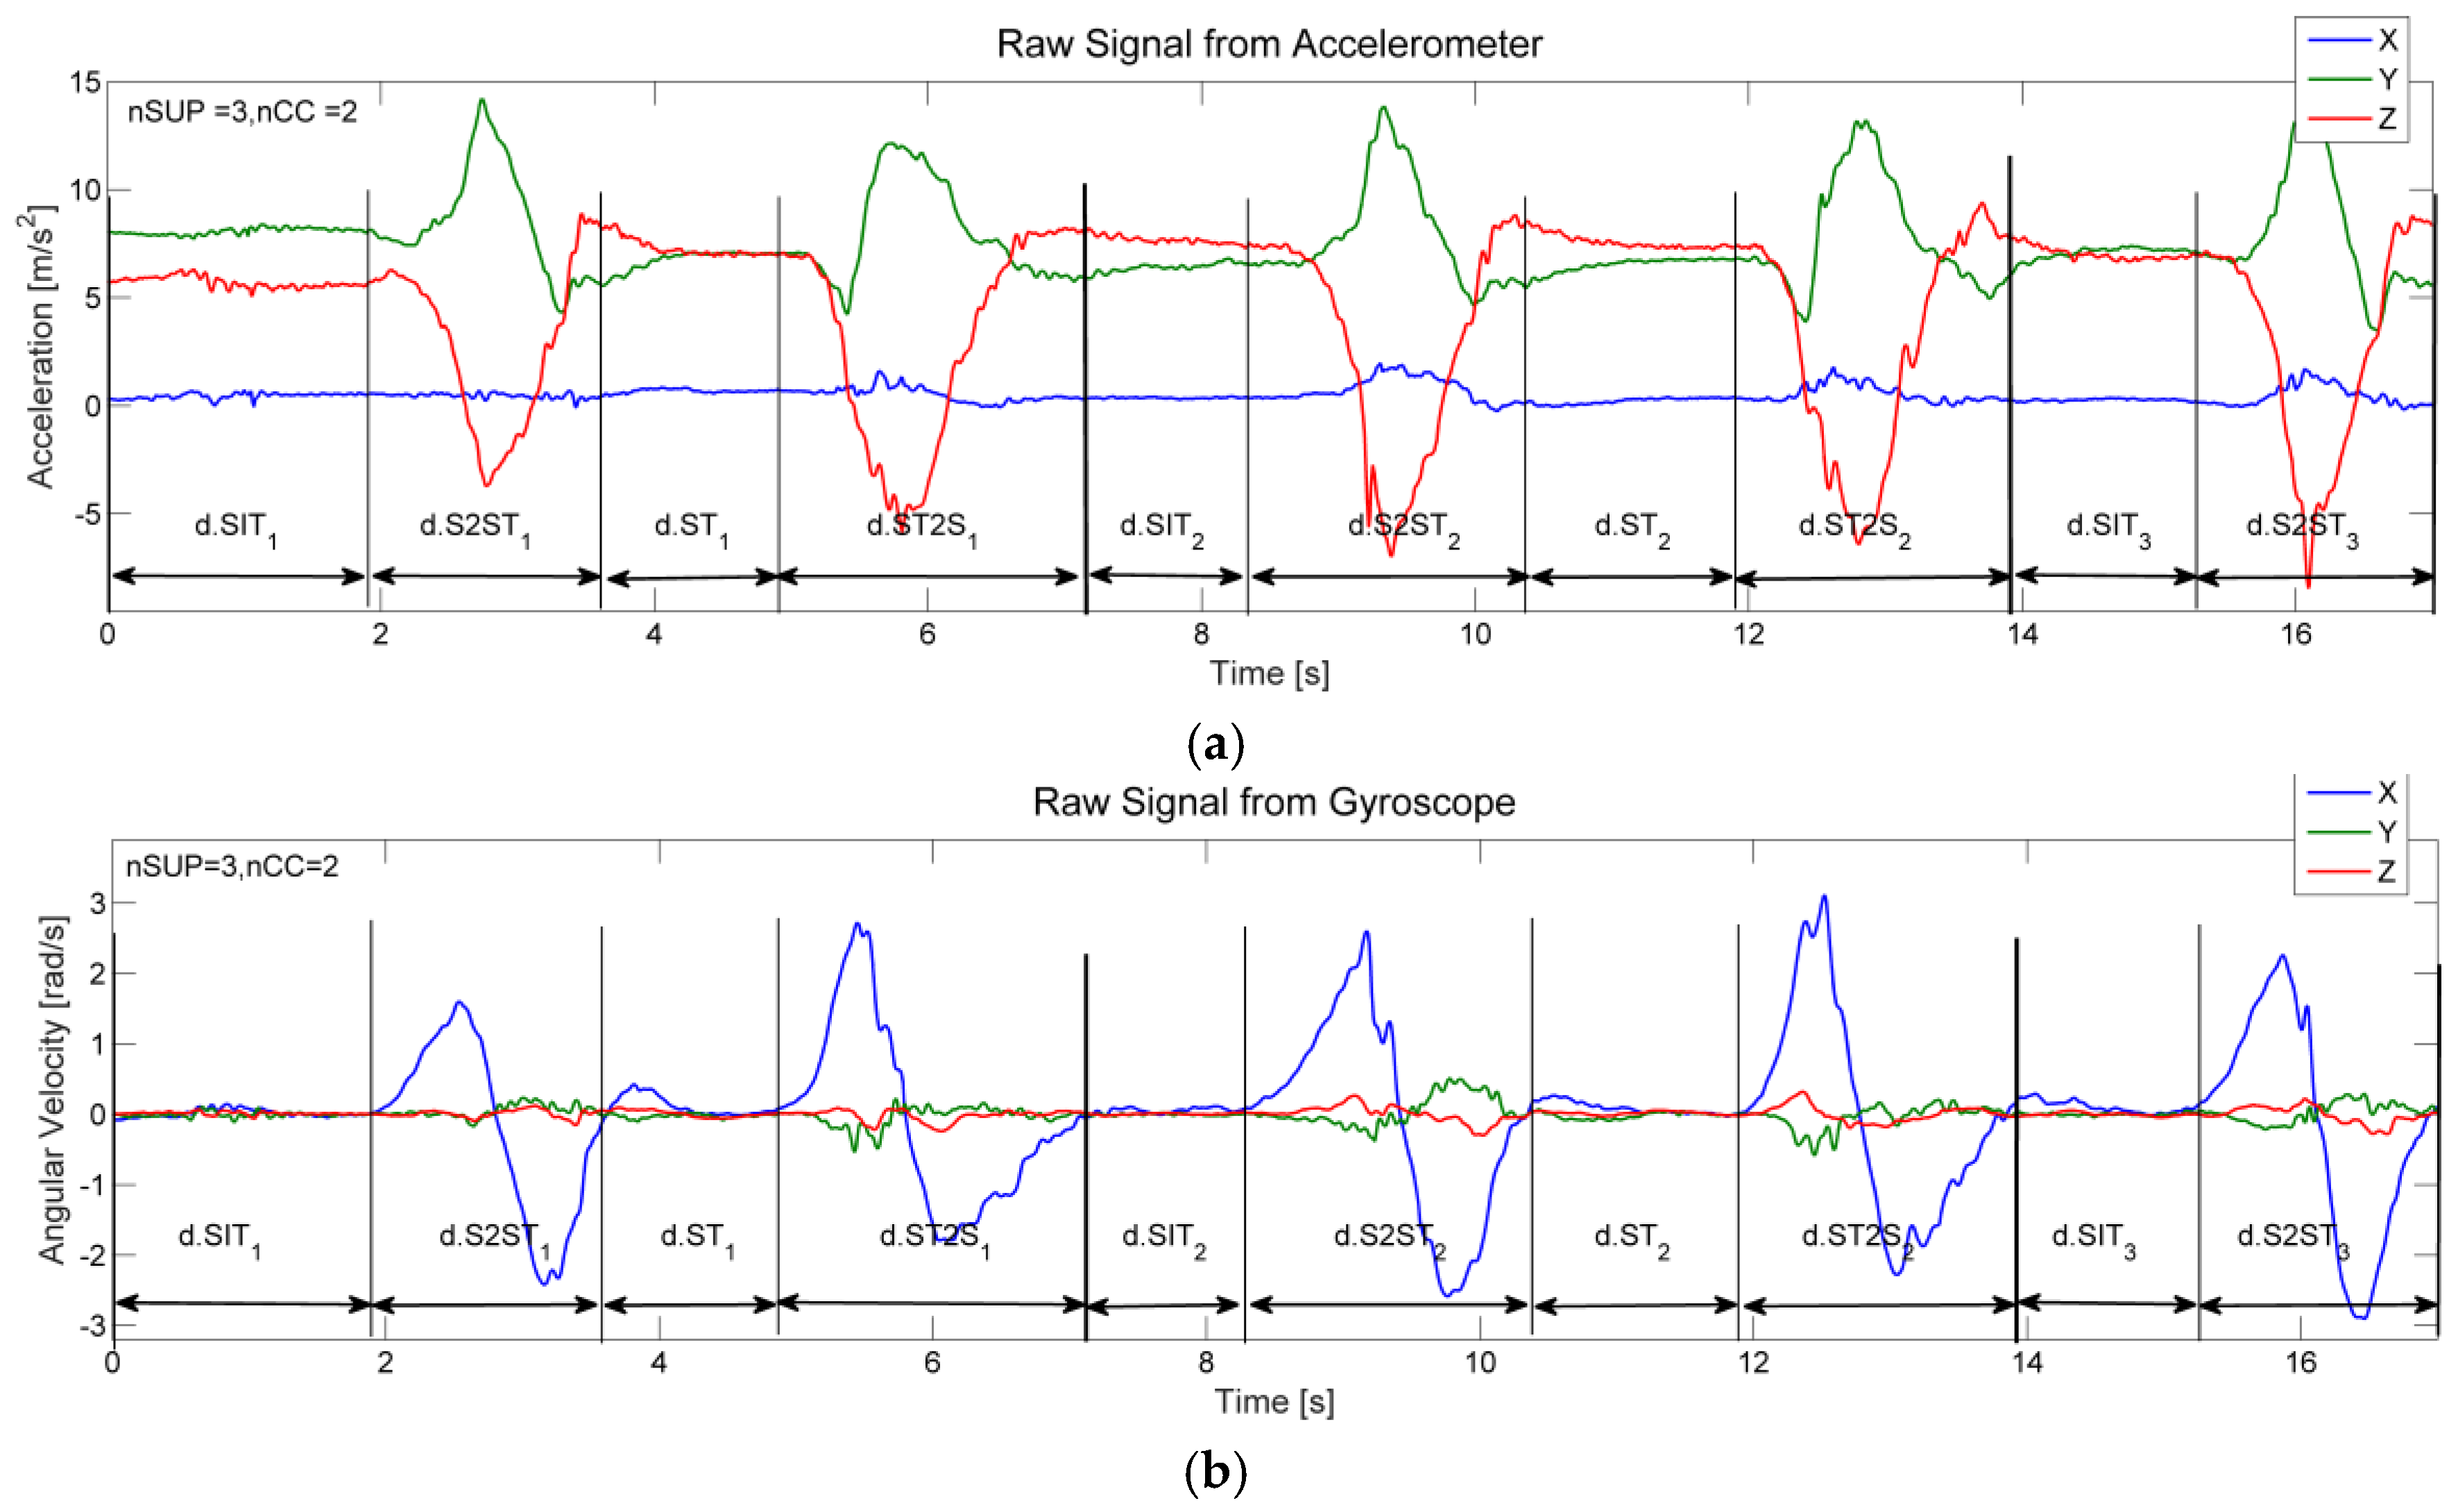
4. The 30-Second Chair Stand (30SCS) Application
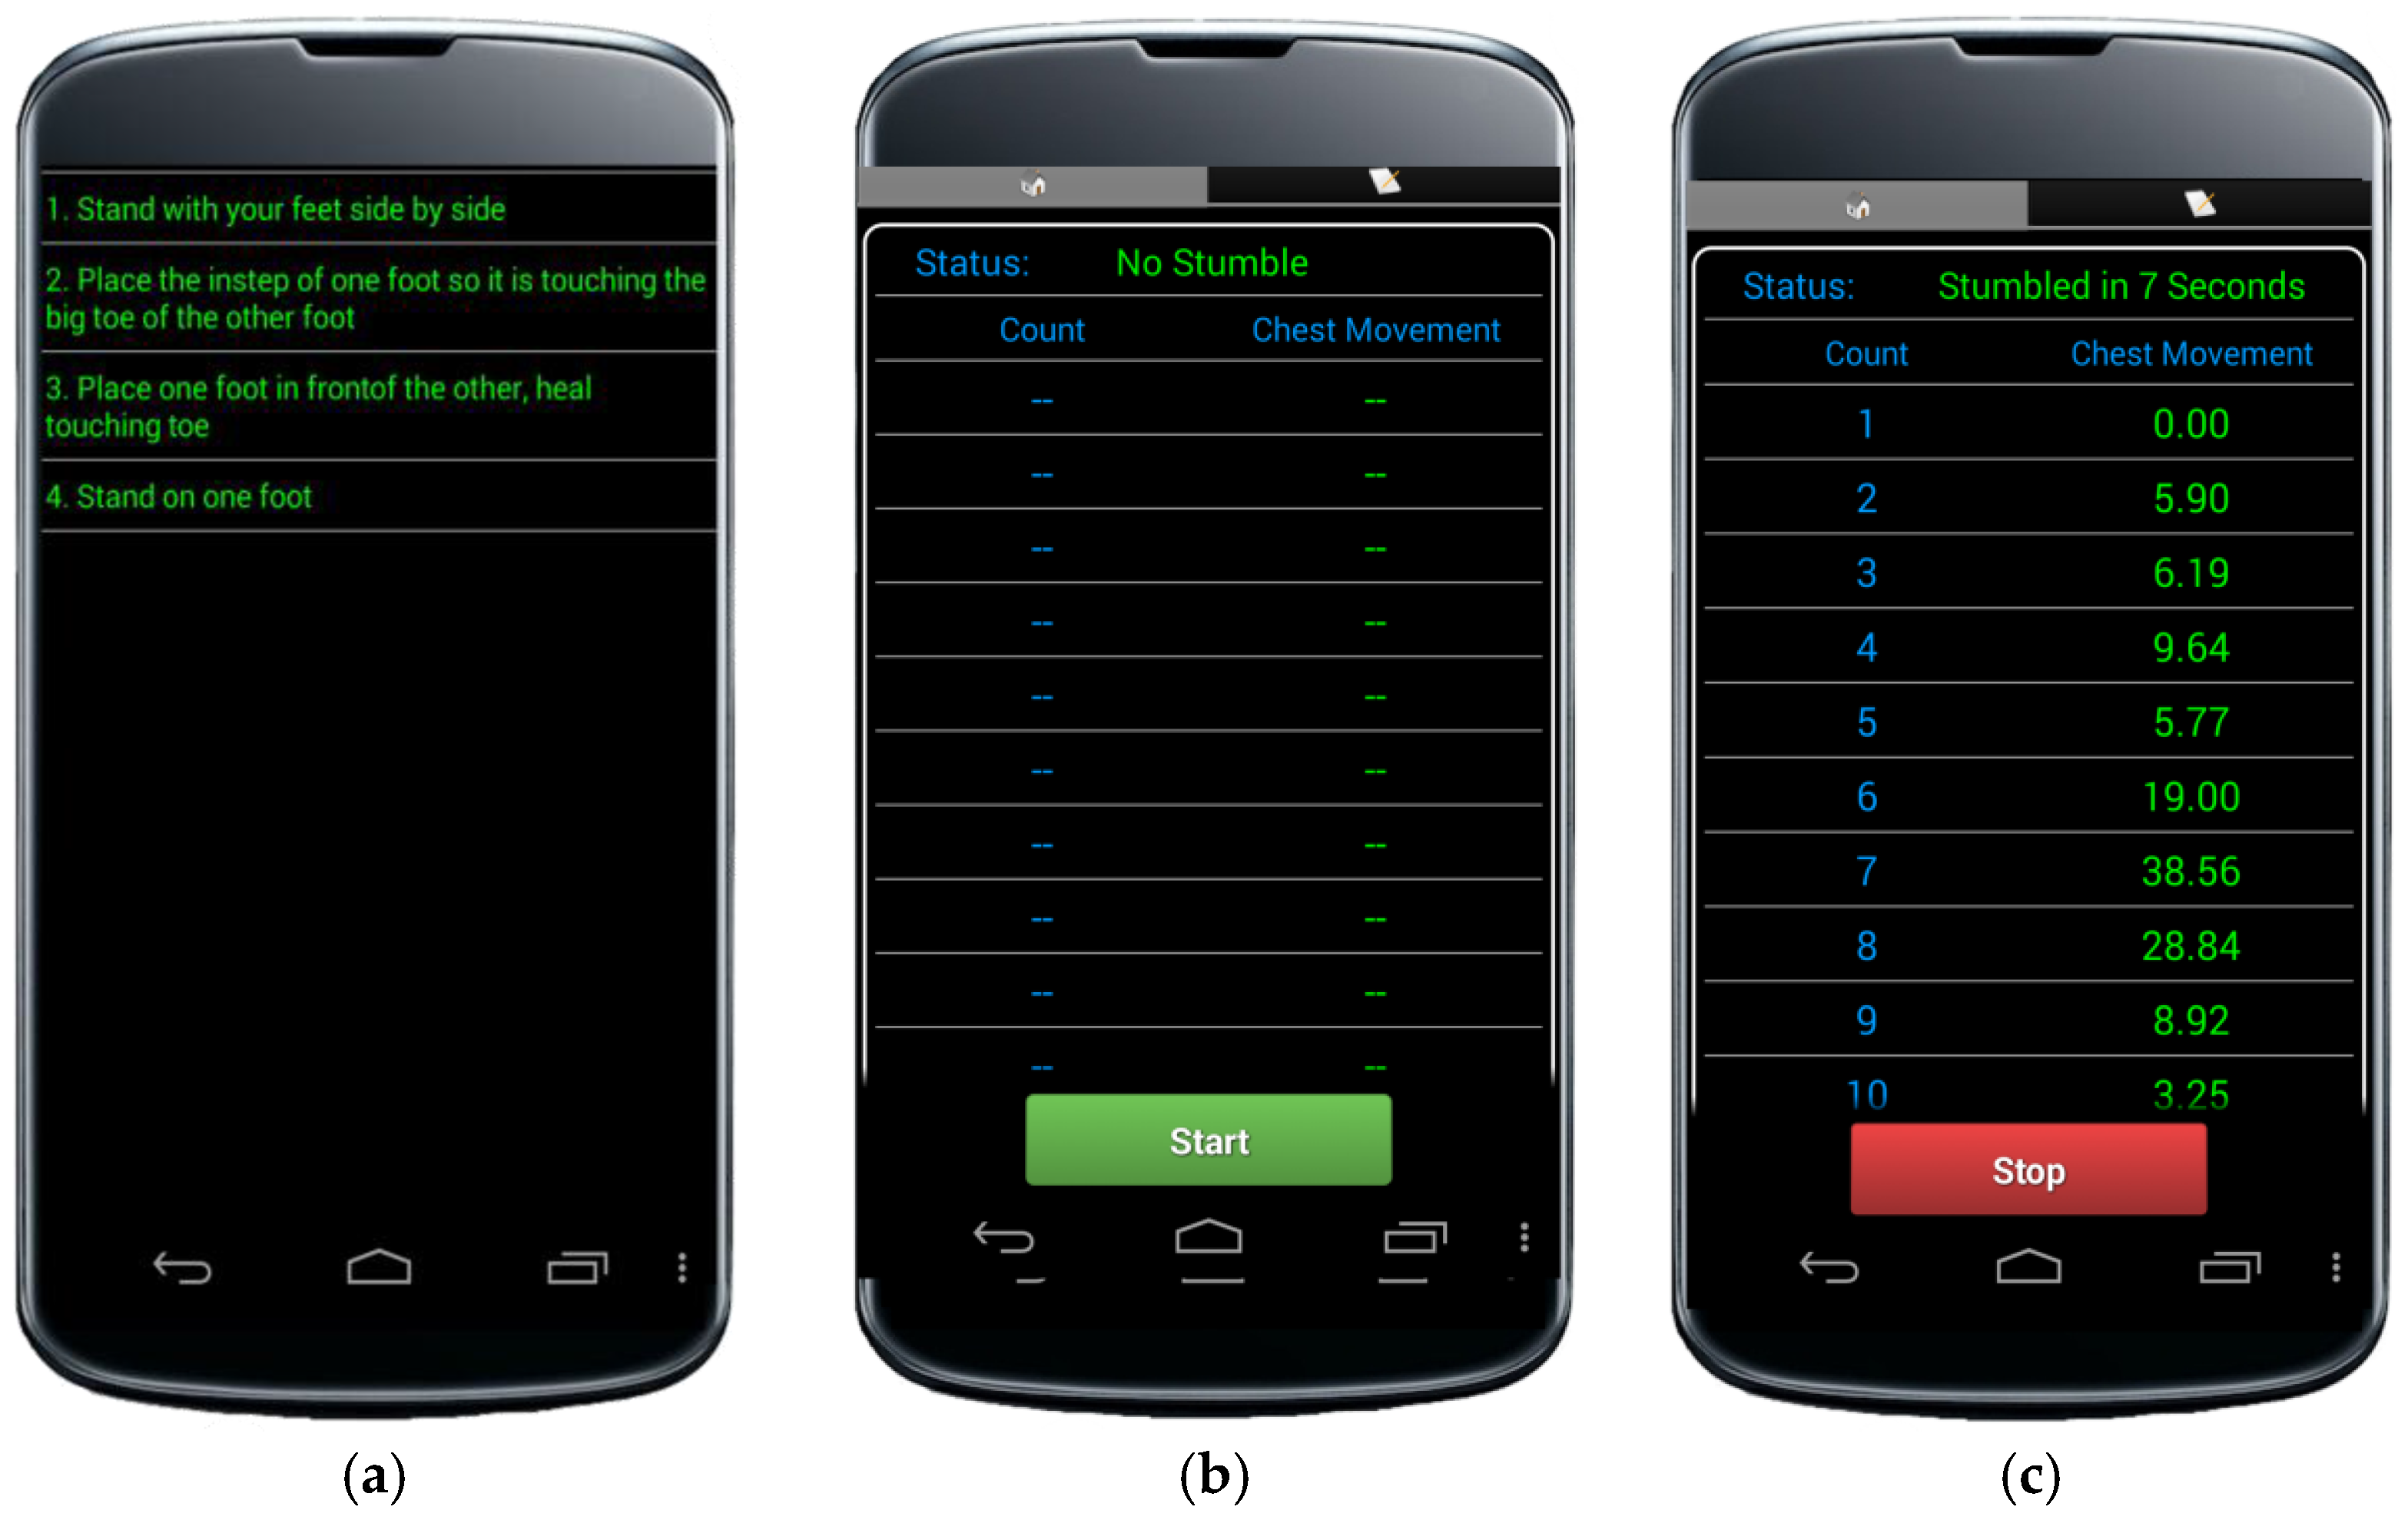
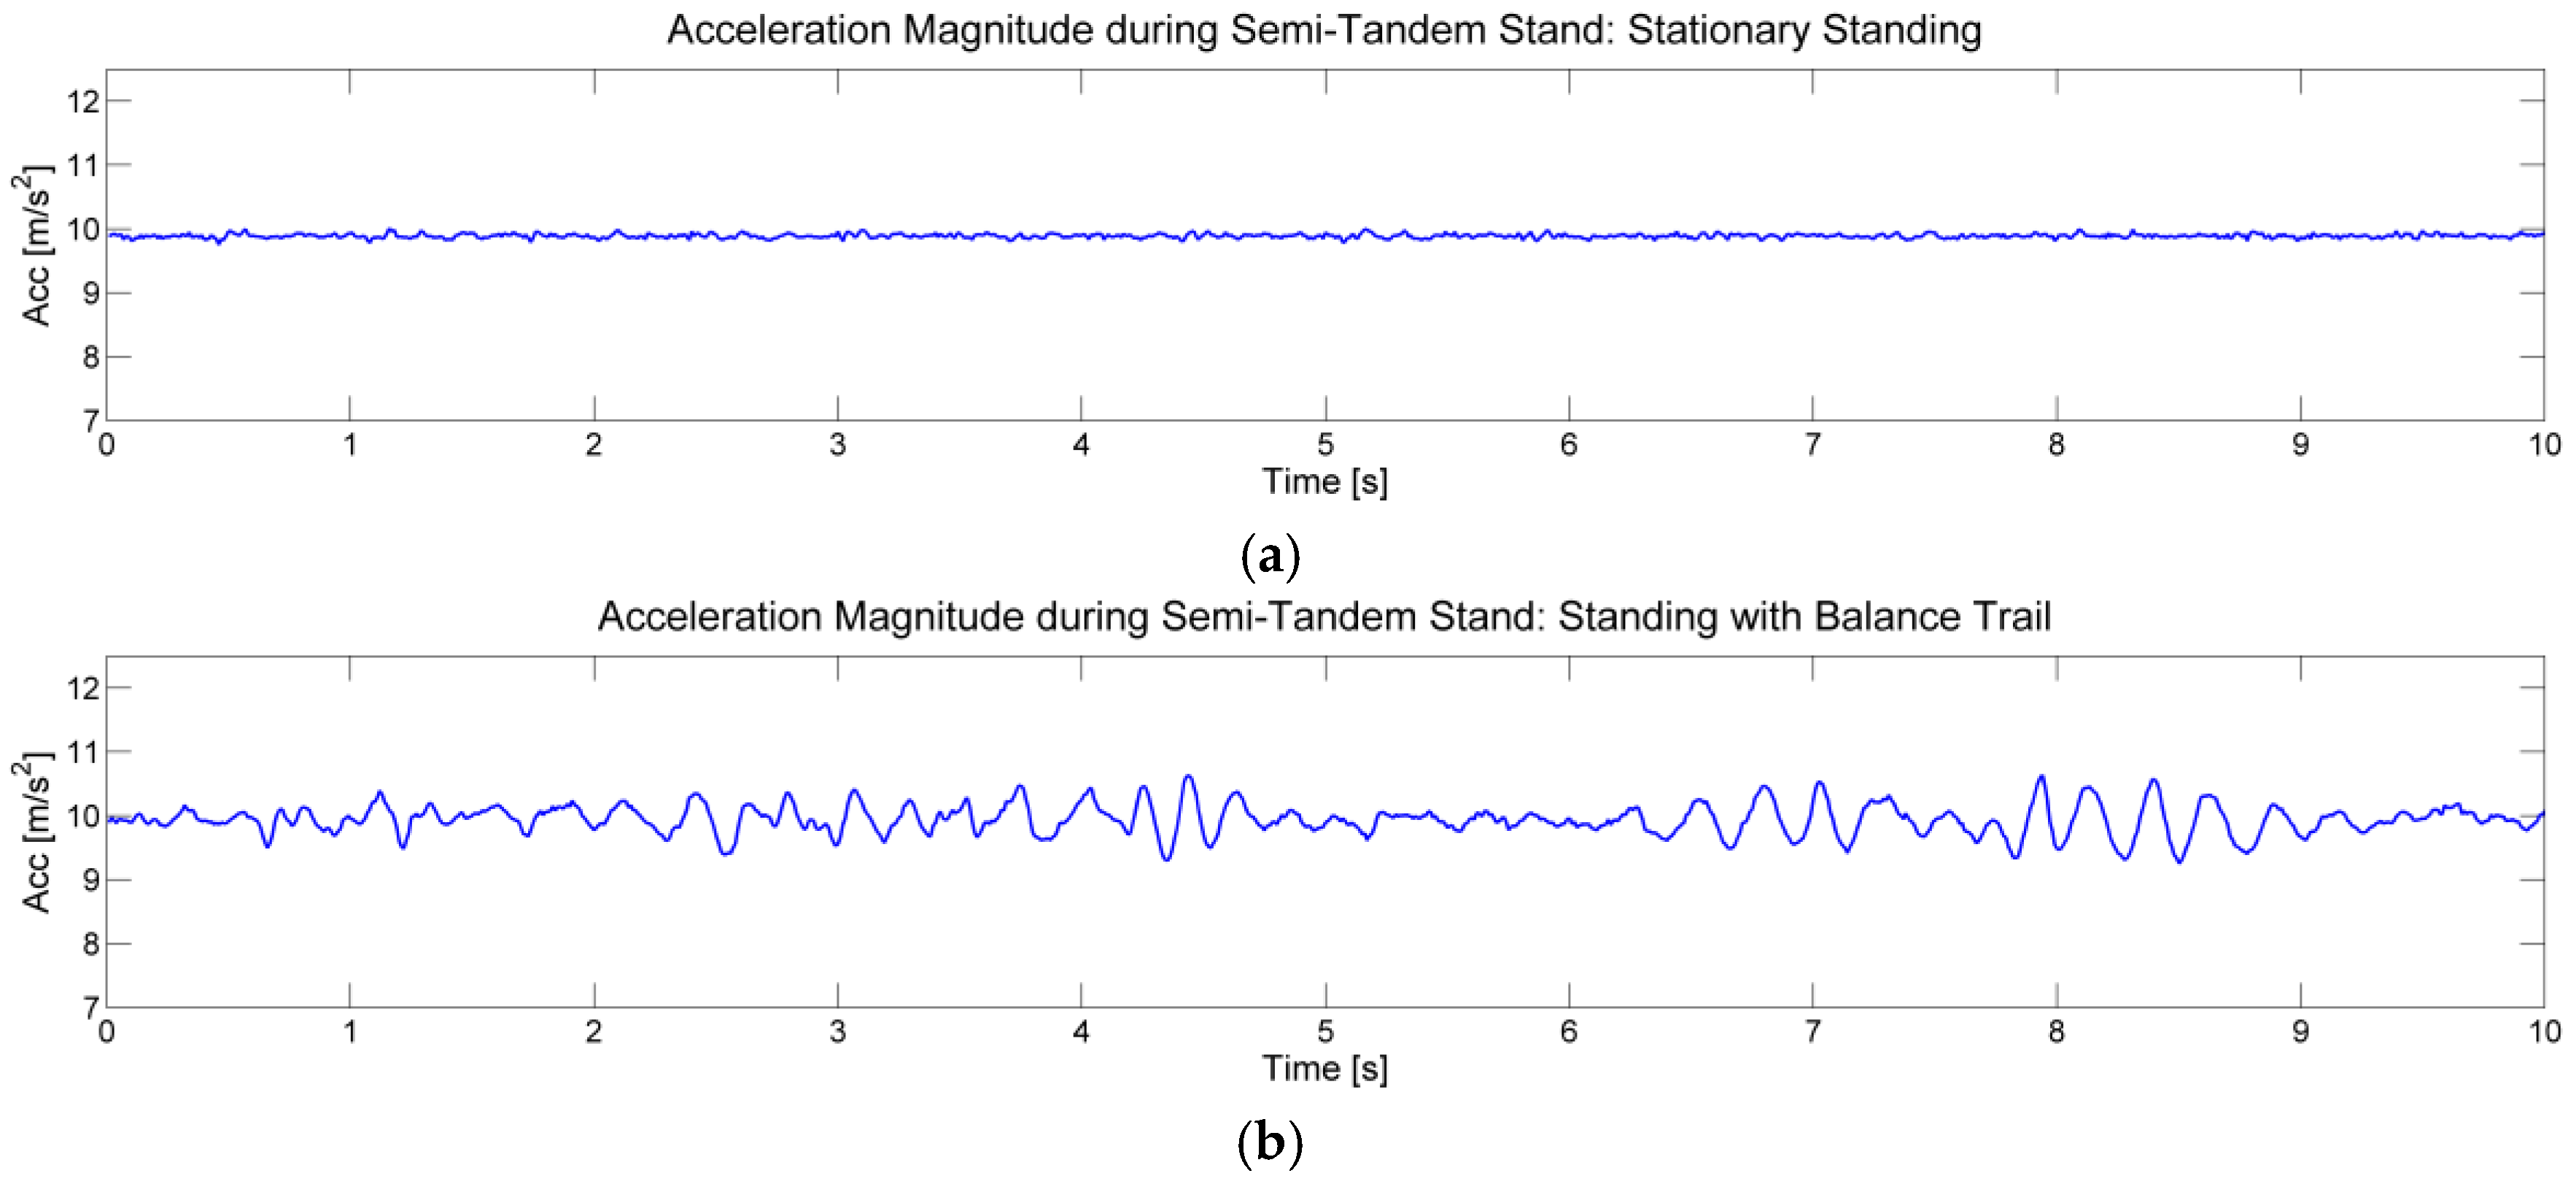
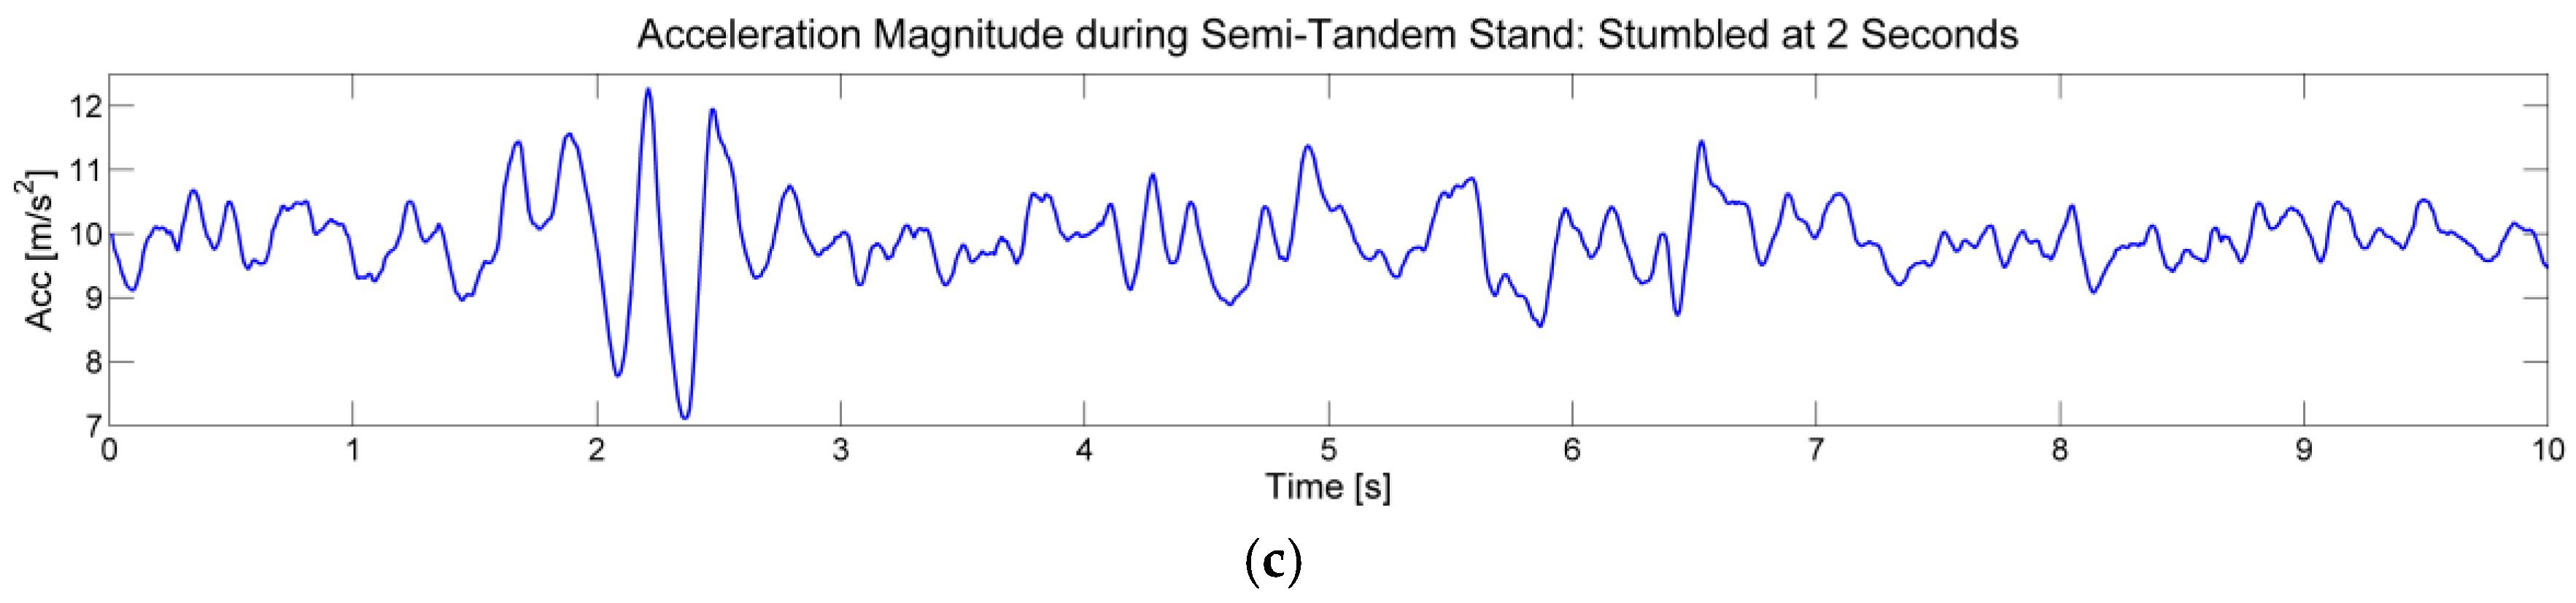
5. The 4-Stage Balance Test (4SBT) Application
6. Application Suite Verification and Validation
7. Results
8. Conclusions
Acknowledgments
Author Contributions
Conflicts of Interest
References
- Gibson, M.J.; Andres, R.O.; Isaacs, B.; Radebaugh, T.; Wormpetersen, J. The prevention of falls in later life. A report of the Kellogg International Work Group on the Prevention of Falls by the Elderly. Dan. Med. Bull. 1987, 34 (Suppl. 4), 1–24. [Google Scholar]
- Hsu, C.L.; Nagamatsu, L.S.; Davis, J.C.; Liu-Ambrose, T. Examining the relationship between specific cognitive processes and falls risk in older adults: A systematic review. Osteoporos. Int. J. Establ. Result Coop. Eur. Found. Osteoporos. Natl. Osteoporos. Found. USA 2012, 23, 2409–2424. [Google Scholar] [CrossRef] [PubMed]
- Hamacher, D.; Singh, N.B.; Van Dieën, J.H.; Heller, M.O.; Taylor, W.R. Kinematic measures for assessing gait stability in elderly individuals: A systematic review. J. R. Soc. Interface R. Soc. 2011, 8, 1682–1698. [Google Scholar] [CrossRef] [PubMed]
- Vincent, G.K.; Velkoff, V.A. The Next Four Decades: The Older Population in the United States: 2010 to 2050; U.S. Department of Commerce; Economics and Statistics Administration, U.S. Census Bureau: Suitland, MD, USA, 2010.
- Alexander, B.H.; Rivara, F.P.; Wolf, M.E. The cost and frequency of hospitalization for fall-related injuries in older adults. Am. J. Public Health 1992, 82, 1020–1023. [Google Scholar] [CrossRef] [PubMed]
- Habib, M.A.; Mohktar, M.S.; Kamaruzzaman, S.B.; Lim, K.S.; Pin, T.M.; Ibrahim, F. Smartphone-Based Solutions for Fall Detection and Prevention: Challenges and Open Issues. Sensors 2014, 14, 7181–7208. [Google Scholar] [CrossRef] [PubMed]
- Schneider, D.L. Preventing Falls: Time for Action. Available online: http://www.todaysgeriatricmedicine.com/archive/110113p34.shtml (accessed on 31 January 2016).
- Thrane, G.; Joakimsen, R.M.; Thornquist, E. The association between timed up and go test and history of falls: The Tromsø study. BMC Geriatr. 2007, 7, 1. [Google Scholar] [CrossRef] [PubMed] [Green Version]
- Millor, N.; Lecumberri, P.; Gómez, M.; Martínez-Ramírez, A.; Izquierdo, M. An evaluation of the 30-s chair stand test in older adults: Frailty detection based on kinematic parameters from a single inertial unit. J. NeuroEng. Rehabil. 2013, 10, 86. [Google Scholar] [CrossRef] [PubMed]
- CDC The 4-Stage Balance Test. Available online: http://www.cdc.gov/steadi/pdf/4-stage_balance_test-a.pdf (accessed on 31 January 2016).
- Zampieri, C.; Salarian, A.; Carlson-Kuhta, P.; Nutt, J.G.; Horak, F.B. Assessing mobility at home in people with early Parkinson’s disease using an instrumented Timed Up and Go test. Parkinsonism Relat. Disord. 2011, 17, 277–280. [Google Scholar] [CrossRef] [PubMed]
- Milenković, A.; Otto, C.; Jovanov, E. Wireless sensor networks for personal health monitoring: Issues and an implementation. Comput. Commun. 2006, 29, 2521–2533. [Google Scholar] [CrossRef]
- Jovanov, E.; Poon, C.; Yang, G.-Z.; Zhang, Y.T. Guest Editorial Body Sensor Networks: From Theory to Emerging Applications. IEEE Trans. Inf. Technol. Biomed. 2009, 13, 859–863. [Google Scholar] [CrossRef] [PubMed]
- Jovanov, E.; Milenkovic, A. Body area networks for ubiquitous healthcare applications: Opportunities and Challenges. J. Med. Syst. 2011, 35, 1245–1254. [Google Scholar] [CrossRef] [PubMed]
- Bosch, S.; Marin-Perianu, M.; Marin-Perianu, R.; Havinga, P.; Hermens, H. Keep on moving! Activity monitoring and Stimulation using wireless sensor networks. In Smart Sensing and Context, Proceedings of the 4th European Conference on Smart Sensing and Context (EuroSSC’09), Guildford, UK, 16–18 September 2009; Lecture Notes in Computer Science. Springer-Verlag: Berlin, Germany; Heidelberg, Germany, 2009; Volume 5741, pp. 11–23. [Google Scholar]
- Pitta, F.; Troosters, T.; Probst, V.S.; Spruit, M.A.; Decramer, M.; Gosselink, R. Quantifying physical activity in daily life with questionnaires and motion sensors in COPD. Eur. Respir. J. 2006, 27, 1040–1055. [Google Scholar] [CrossRef] [PubMed]
- Madhushri, P.; Ahmed, B.; Penzel, T.; Jovanov, E. Periodic leg movement (PLM) monitoring using a distributed body sensor network. Conf. Proc. IEEE Eng. Med. Biol. Soc. (EMBC) 2015, 2015, 1837–1840. [Google Scholar]
- Al-Jawad, A.; Adame, M.R.; Romanovas, M.; Hobert, M.; Maetzler, W.; Traechtler, M.; Moeller, K.; Manoli, Y. Using multi-dimensional dynamic time warping for TUG test instrumentation with inertial sensors. In Proceedings of the 2012 IEEE Conference on Multisensor Fusion and Integration for Intelligent Systems (MFI), Hamburg, Germany, 13–15 September 2012; pp. 212–218.
- Zijlstra, A.; Mancini, M.; Lindemann, U.; Chiari, L.; Zijlstra, W. Sit-stand and stand-sit transitions in older adults and patients with Parkinson’s disease: Event detection based on motion sensors versus force plates. J. NeuroEng. Rehabil. 2012, 9, 75. [Google Scholar] [CrossRef] [PubMed]
- Tacconi, C.; Mellone, S.; Chiari, L. Smartphone-Based Applications for Investigating Falls and Mobility. In Proceedings of the 2011 5th International Conference on Pervasive Computing Technologies for Healthcare (PervasiveHealth) and Workshops, Dublin, Ireland, 23–26 May 2011.
- Wongpatikaseree, K.; Lim, A.O.; Tan, Y.; Kanai, H. Range-based algorithm for posture classification and fall-down detection in smart homecare system. In Proceedings of the 1st IEEE Global Conference on Consumer Electronics, Tokyo, Japan, 2–5 October 2012; pp. 243–247.
- Jovanov, E.; Milenkovic, A.; Otto, C.; de Groen, P.C. A wireless body area network of intelligent motion sensors for computer assisted physical rehabilitation. J. NeuroEng. Rehabil. 2005, 2, 6. [Google Scholar] [CrossRef] [PubMed] [Green Version]
- Santhiranayagam, B.K.; Lai, D.T.H.; Jiang, C.; Shilton, A.; Begg, R. Automatic detection of different walking conditions using inertial sensor data. In Proceedings of the 2012 International Joint Conference on Neural Networks (IJCNN), Brisbane, Australia, 10–15 June 2012; pp. 1–6.
- Weiss, A.; Herman, T.; Plotnik, M.; Brozgol, M.; Maidan, I.; Giladi, N.; Gurevich, T.; Hausdorff, J.M. Can an accelerometer enhance the utility of the Timed up & Go Test when evaluating patients with Parkinson’s disease? Med. Eng. Phys. 2010, 32, 119–125. [Google Scholar] [PubMed]
- Zampieri, C.; Salarian, A.; Carlson-Kuhta, P.; Aminian, K.; Nutt, J.G.; Horak, F.B. The instrumented timed up and go test: Potential outcome measure for disease modifying therapies in Parkinson’s disease. J. Neurol. Neurosurg. Psychiatry 2010, 81, 171–176. [Google Scholar] [CrossRef] [PubMed]
- Marschollek, M.; Nemitz, G.; Gietzelt, M.; Wolf, K.H.; Meyer Zu Schwabedissen, H.; Haux, R. Predicting in-patient falls in a geriatric clinic: A clinical study combining assessment data and simple sensory gait measurements. Z. Gerontol. Geriatr. 2009, 42, 317–321. [Google Scholar] [CrossRef] [PubMed]
- Bao, L.; Intille, S.S. Activity Recognition from User-Annotated Acceleration Data. In Pervasive Computing; Ferscha, A., Mattern, F., Eds.; Lecture Notes in Computer Science; Springer: Berlin, Germany; Heidelberg, Germany, 2004. [Google Scholar]
- Ghasemzadeh, H.; Loseu, V.; Jafari, R. Structural action recognition in body sensor networks: Distributed classification based on string matching. IEEE Trans. Inf. Technol. Biomed. 2010, 14, 425–435. [Google Scholar] [CrossRef] [PubMed]
- Lester, J.; Choudhury, T.; Borriello, G. A practical approach to recognizing physical activities. In Pervasive Computing, Proceedings of the 4th International Conference on Pervasive Computing (PERVASIVE’06), Dublin, Ireland, 7–10 May 2006; Lecture Notes in Computer Science. Springer: Berlin, Germany; Heidelberg, Germany, 2006; Volume 3968, pp. 1–16. [Google Scholar]
- Aminian, K.; Najafi, B. Body Movement Monitoring System and Method. U.S. Patent 7141026 B2, 1 October 2001. [Google Scholar]
- Florentino-Liano, B.; O’Mahony, N.; Artes-Rodriguez, A. Human activity recognition using inertial sensors with invariance to sensor orientation. In Proceedings of the 2012 3rd International Workshop on Cognitive Information Processing (CIP), Baiona, Spain, 28–30 May 2012.
- Fuentes, D.; Gonzalez-Abril, L.; Angulo, C.; Ortega, J.A. Online motion recognition using an accelerometer in a mobile device. Expert Syst. Appl. 2012, 39, 2461–2465. [Google Scholar] [CrossRef] [Green Version]
- Godfrey, A.; Bourke, A.K.; Ólaighin, G.M.; van de Ven, P.; Nelson, J. Activity classification using a single chest mounted tri-axial accelerometer. Med. Eng. Phys. 2011, 33, 1127–1135. [Google Scholar] [CrossRef] [PubMed]
- Milosevic, M.; Milenkovic, A.; Jovanov, E. mHealth @ UAH: Computing Infrastructure for Mobile Health and Wellness Monitoring. XRDS 2013, 20, 43–49. [Google Scholar] [CrossRef]
- Podsiadlo, D.; Richardson, S. The timed “Up & Go”: A test of basic functional mobility for frail elderly persons. J. Am. Geriatr. Soc. 1991, 39, 142–148. [Google Scholar] [PubMed]
- CDC The Timed Up and Go (TUG) Test. Available online: http://www.cdc.gov/steadi/pdf/tug_test-a.pdf (accessed on 31 January 2016).
- Milosevic, M.; Jovanov, E.; Milenkovic, A. Quantifying Timed-Up-and-Go test: A smartphone implementation. In Proceedings of the 2013 IEEE International Conference on Body Sensor Networks (BSN), Cambridge, MA, USA, 6–9 May 2013.
- Csuka, M.; McCarty, D.J. Simple method for measurement of lower extremity muscle strength. Am. J. Med. 1985, 78, 77–81. [Google Scholar] [CrossRef]
- Lord, S.R.; Murray, S.M.; Chapman, K.; Munro, B.; Tiedemann, A. Sit-to-Stand Performance Depends on Sensation, Speed, Balance, and Psychological Status in Addition to Strength in Older People. J. Gerontol. A Biol. Sci. Med. Sci. 2002, 57, M539–M543. [Google Scholar] [CrossRef] [PubMed]
- Whitney, S.L.; Wrisley, D.M.; Marchetti, G.F.; Gee, M.A.; Redfern, M.S.; Furman, J.M. Clinical measurement of sit-to-stand performance in people with balance disorders: Validity of data for the Five-Times-Sit-to-Stand Test. Phys. Ther. 2005, 85, 1034–1045. [Google Scholar] [PubMed]
- Buatois, S.; Miljkovic, D.; Manckoundia, P.; Gueguen, R.; Miget, P.; Vançon, G.; Perrin, P.; Benetos, A. Five times sit to stand test is a predictor of recurrent falls in healthy community-living subjects aged 65 and older. J. Am. Geriatr. Soc. 2008, 56, 1575–1577. [Google Scholar] [CrossRef] [PubMed]
- CDC 30-Second Chair Stand Test. Available online: http://www.cdc.gov/steadi/pdf/30_second_chair_stand_test-a.pdf (accessed on 31 January 2016).


| Parameter | Description | Units |
|---|---|---|
| d.TUG | Total duration of the TUG test (from “Go” to the completion of the test) | s |
| d.S2ST | Total duration of the sit-to-stand transition; d.S2ST = d.LF + d.LT | s |
| d.LF | Duration of the lean forward phase in the sit-to-stand transition | s |
| d.LT | Duration of the lift up phase in the sit-to-stand transition | s |
| d.WALK | Total time of walk | s |
| d.ST2S | Duration of the stand-to-sit transition; d.ST2S = d.PS + d.SD | s |
| d.PS | Duration of the prepare-to-sit phase in the stand-to-sit transition | s |
| d.SD | Duration of the sit-down phase in the stand-to-sit transition | s |
| a.S2ST | Maximum change of the trunk angle in the lean forward phase | degrees |
| v.LF | Maximum angular velocity during the lean forward phase | degrees/s |
| v.LT | Maximum angular velocity during the lift up phase | degrees/s |
| n.STEP | Total number of steps during walking phase | steps |
| n.SBT | Total number of steps before turn | steps |
| Age | Men | Women | ||||
|---|---|---|---|---|---|---|
| Below Avg. | Average | Above Avg. | Below Avg. | Average | Above Avg. | |
| 60–64 | <14 | 14–19 | >19 | <12 | 12–17 | >17 |
| 65–69 | <12 | 12–18 | >18 | <11 | 11–16 | >16 |
| 70–74 | <12 | 12–17 | >17 | <10 | 10–15 | >15 |
| 75–79 | <11 | 11–17 | >17 | <10 | 10–15 | >15 |
| 80–84 | <10 | 10–15 | >15 | <9 | 9–14 | >14 |
| 85–89 | <8 | 8–14 | >14 | <8 | 8–13 | >13 |
| 90–94 | <7 | 7–12 | >12 | <4 | 4–11 | >11 |
| Parameter | Description | Units |
|---|---|---|
| n.SUP | Total number of stand-ups in 30 s | - |
| n.CC | Total number of complete cycles | - |
| d.CC | Total duration of all complete cycles | s |
| d.CYCLi | Duration of each cycle (d.CYCLi = d.S2STi + d.ST2Si + d.STi + d.SIT) | s |
| d.S2STi | Total duration of the ith sit-to-stand transition: d.S2STi = d.LFi + d.LTi | s |
| d.LFi | Duration of the lean forward phase in the sit-to-stand transition | s |
| d.LTi | Duration of the lift up phase in the sit-to-stand transition | s |
| d.ST2Si | Duration of the stand-to-sit transition; d.ST2Si = d.PSi + d.SDi | s |
| d.PSi | Duration of the prepare-to-sit phase in the stand-to-sit transition | s |
| d.SDi | Duration of the sit-down phase in the stand-to-sit transition | s |
| d.STi | Total duration of standing phase | s |
| d.SIT | Total duration of sitting phase | s |
| a.S2STi | Maximum change of the trunk angle in the lean forward phase | degrees |
| v.LFi | Maximum angular velocity during the lean forward phase | degrees/s |
| v.LTi | Maximum angular velocity during the lift up phase | degrees/s |
| Parameter | Description | Units |
|---|---|---|
| s.FTSi | Relative displacement of the chest every second in the feet together stand | cm |
| s.STSi | Relative displacement of the chest every second in the semi-tandem stand | cm |
| s.TSi | Relative displacement of the chest every second in the tandem stand | cm |
| s.OLi | Relative displacement of the chest every second in the one leg stand | cm |
| - | - | Test#1 | Test#2 | Test#3 |
|---|---|---|---|---|
| S#1 (Female, 28) | sTUG (s) | 10.6 | 9.84 | 9.54 |
| Video (s) | 10.2 | 9.69 | 9.59 | |
| Error (%) | 3.92 | 1.55 | 0.52 | |
| S#2 (Male, 47) | sTUG (s) | 10.5 | 10.5 | 9.8 |
| Video (s) | 10.38 | 10.54 | 9.76 | |
| Error (%) | 1.16 | 0.38 | 0.41 | |
| S#3 (Male, 55) | sTUG (s) | 8.79 | 8.61 | 8.48 |
| Video (s) | 8.57 | 8.47 | 8.64 | |
| Error (%) | 2.57 | 1.65 | 1.85 |
| S#1 (Female, 28) | - | #1 | #2 | #3 | #4 | #5 | #6 | #7 | #8 | #9 | #10 | #11 | #12 |
|---|---|---|---|---|---|---|---|---|---|---|---|---|---|
| Test #1 | 30SCS (s) | 1.37 | 0.76 | 0.77 | 0.78 | 0.77 | 0.8 | 0.84 | 0.79 | 0.83 | 0.83 | 0.84 | 0.84 |
| Video (s) | 1.5 | 0.75 | 0.75 | 0.75 | 0.75 | 0.8 | 0.83 | 0.78 | 0.85 | 0.8 | 0.83 | 0.83 | |
| Error (%) | 14.38 | 1.33 | 2.67 | 4.00 | 2.67 | 0.00 | 1.20 | 1.28 | 2.35 | 3.75 | 1.20 | 1.20 | |
| Test #2 | 30SCS (s) | 1.18 | 0.92 | 0.95 | 1 | 0.92 | 0.98 | 0.91 | 0.99 | 1 | - | - | - |
| Video (s) | 1.25 | 0.9 | 0.9 | 1.02 | 0.9 | 0.95 | 0.9 | 0.93 | 1.02 | - | - | - | |
| Error (%) | 5.60 | 2.22 | 5.56 | 1.96 | 2.22 | 3.16 | 1.11 | 6.45 | 1.96 | - | - | - | |
| S#2 (Male, 47) | - | #1 | #2 | #3 | #4 | #5 | #6 | #7 | #8 | #9 | #10 | #11 | - |
| Test #1 | 30SCS (s) | 1.46 | 1.06 | 1.09 | 1.07 | 1.04 | 1.02 | 1.04 | 1.05 | 1.04 | 1.05 | 1.06 | - |
| Video (s) | 1.48 | 1.08 | 1.05 | 1.11 | 1.06 | 1.04 | 1.05 | 1.09 | 1.03 | 1.02 | 1.01 | - | |
| Error (%) | 1.35 | 1.85 | 3.81 | 3.60 | 1.89 | 1.92 | 0.95 | 3.67 | 0.97 | 2.94 | 4.95 | - | |
| Test #2 | 30SCS (s) | 0.98 | 1.2 | 1.54 | 1.54 | 1.3 | 1.22 | 1.42 | - | - | - | - | - |
| Video (s) | 1.01 | 1.2 | 1.54 | 1.57 | 1.26 | 1.21 | 1.44 | - | - | - | - | - | |
| Error (%) | 2.97 | 0.00 | 0.00 | 1.91 | 3.17 | 0.83 | 1.39 | - | - | - | - | - | |
| S#3 (Male, 28) | - | #1 | #2 | #3 | #4 | #5 | #6 | #7 | #8 | #9 | #10 | - | - |
| Test #1 | 30SCS (s) | 1.61 | 1.03 | 1.19 | 1.2 | 1.19 | 1.22 | 1.23 | 1.27 | 1.2 | 1.24 | - | - |
| Video (s) | 1.6 | 0.98 | 1.22 | 1.24 | 1.18 | 1.2 | 1.28 | 1.26 | 1.18 | 1.2 | - | - | |
| Error (%) | 0.63 | 5.10 | 2.46 | 3.23 | 0.85 | 1.67 | 3.91 | 0.79 | 1.69 | 3.33 | - | - | |
| Test #2 | 30SCS (s) | 2.34 | 1.06 | 1.02 | 1.07 | 1.2 | 1.12 | 1.34 | 1.22 | 1.29 | - | - | - |
| Video (s) | 2.32 | 1.06 | 1.01 | 1.1 | 1.23 | 1.11 | 1.33 | 1.18 | 1.27 | - | - | - | |
| Error (%) | 0.86 | 0.00 | 0.99 | 2.73 | 2.44 | 0.90 | 0.75 | 3.39 | 1.57 | - | - | - |
| P#1 (Female, Age 79) | P#2 (Female, Age 80) | P#3 (Female, Age 87) | ||||||||||
|---|---|---|---|---|---|---|---|---|---|---|---|---|
| Parameter | 12 Feb | 02 Apr | 12 May | % Change | 12 Feb | 02 Apr | 21 May | % Change | 13 Feb | 27 Mar | 11 May | % Change |
| d.TUG | 16.59 | 13.34 | 10.92 | −34 | 15.11 | 11.12 | 10.46 | −31 | 20.96 | 16.62 | 15.03 | −28 |
| d.S2ST | 1.29 | 1.23 | 0.94 | −27 | 0.84 | 0.62 | 0.64 | −24 | 1.19 | 1.85 | 0.95 | −20 |
| d.LF | 0.9 | 0.71 | 0.42 | −53 | 0.73 | 0.49 | 0.47 | −36 | 0.79 | 1.34 | 0.72 | −9 |
| d.LT | 0.39 | 0.52 | 0.52 | 33 | 0.11 | 0.13 | 0.17 | 55 | 0.4 | 0.51 | 0.23 | −43 |
| d.WK | 13.79 | 9.88 | 8.76 | −36 | 12.59 | 9.91 | 8.06 | −36 | 18.29 | 12.02 | 12.53 | −31 |
| d.ST2S | 1.51 | 2.23 | 1.22 | −19 | 1.68 | 0.59 | 1.76 | 5 | 1.48 | 2.75 | 1.55 | 5 |
| d.PS | 0.32 | 0.58 | 0.39 | 22 | 0.43 | 0.31 | 0.33 | −23 | 0.26 | 0.58 | 0.48 | 85 |
| d.SD | 1.19 | 1.65 | 0.83 | −30 | 1.25 | 0.28 | 1.43 | 14 | 1.22 | 2.17 | 1.07 | −12 |
| a.S2ST | 61.75 | 42.22 | 42.51 | −31 | 47.76 | 49.89 | 51.88 | 9 | 45.37 | 65.8 | 39.39 | −13 |
| v.LF | 256.0 | 178.9 | 209.5 | −18 | 161.5 | 231.5 | 213.5 | 32 | 124.5 | 100.2 | 72.08 | −42 |
| v.LT | −8.35 | 0 | −6.8 | −19 | −36 | −22.9 | −33.1 | −8 | −1.86 | −13.9 | −1.82 | −2 |
| n.STP | 34 | 25 | 15 | −56 | 35 | 19 | 13 | −63 | 38 | 19 | 25 | −34 |
| n.SBT | 15 | 12 | 7 | −53 | 17 | 10 | 7 | −59 | 20 | 10 | 12 | −40 |
| Parameter | P#1 (Male, Age 32) | P#2 (Male, Age 47) | P#3 (Male, Age 29) | P#4 (Female, Age 24) | P#5 (Female, Age 28) |
|---|---|---|---|---|---|
| n.SUP | 12 | 12 | 11 | 13 | 16 |
| n.CC | 12 | 12 | 10 | 12 | 15 |
| d.CC | 29.02 | 29.80 | 28.71 | 28.60 | 28.90 |
| d.S2STi | 1.0 ± 0.17 | 1.0 ± 0.25 | 0.96 ± 0.2 | 1.0 ± 0.17 | 0.7 ± 0.15 |
| d.LFi | 0.44 ± 0.16 | 0.42 ± 0.2 | 0.3 ± 0.16 | 0.5 ± 0.15 | 0.31 ± 0.2 |
| d.LTi | 0.57 ± 0.04 | 0.6 ± 0.04 | 0.6 ± 0.14 | 0.6 ± 0.03 | 0.4 ± 0.02 |
| d.ST2Si | 1.2 ± 0.2 | 1.1 ± 0.17 | 0.9 ± 0.35 | 1.4 ± 0.04 | 0.8 ± 0.22 |
| d.PSi | 0.45 ± 0.21 | 0.5 ± 0.15 | 0.5 ± 0.23 | 0.6 ± 0.03 | 0.41 ± 0.1 |
| d.SDi | 0.76 ± 0.04 | 0.6 ± 0.05 | 0.5 ± 0.14 | 0.8 ± 0.03 | 0.44 ± 0.1 |
| d.STi | 0.29 ± 0.25 | 0.1 ± 0.17 | 0.4 ± 0.30 | 0.1 ± 0.06 | 0.13 ± 0.1 |
| d.SITi | 0.30 ± 0.11 | 0.2 ± 0.03 | 0.54 ± 0.8 | 0.4 ± 0.12 | 0.35 ± 0.1 |
| a.S2STi | 44 ± 5.7 | 48 ± 22.2 | 57.9 ± 10 | 40.3 ± 5.2 | 29.6 ± 3.0 |
| v.LFi | 186 ± 26 | 172 ± 47 | 268 ± 19 | 144 ± 18 | 192 ± 28 |
| v.LTi | 5.3 ± 5.2 | 12.7 ± 19 | 2.74 ± 8.2 | 7.59 ± 7.4 | 31.6 ± 28 |
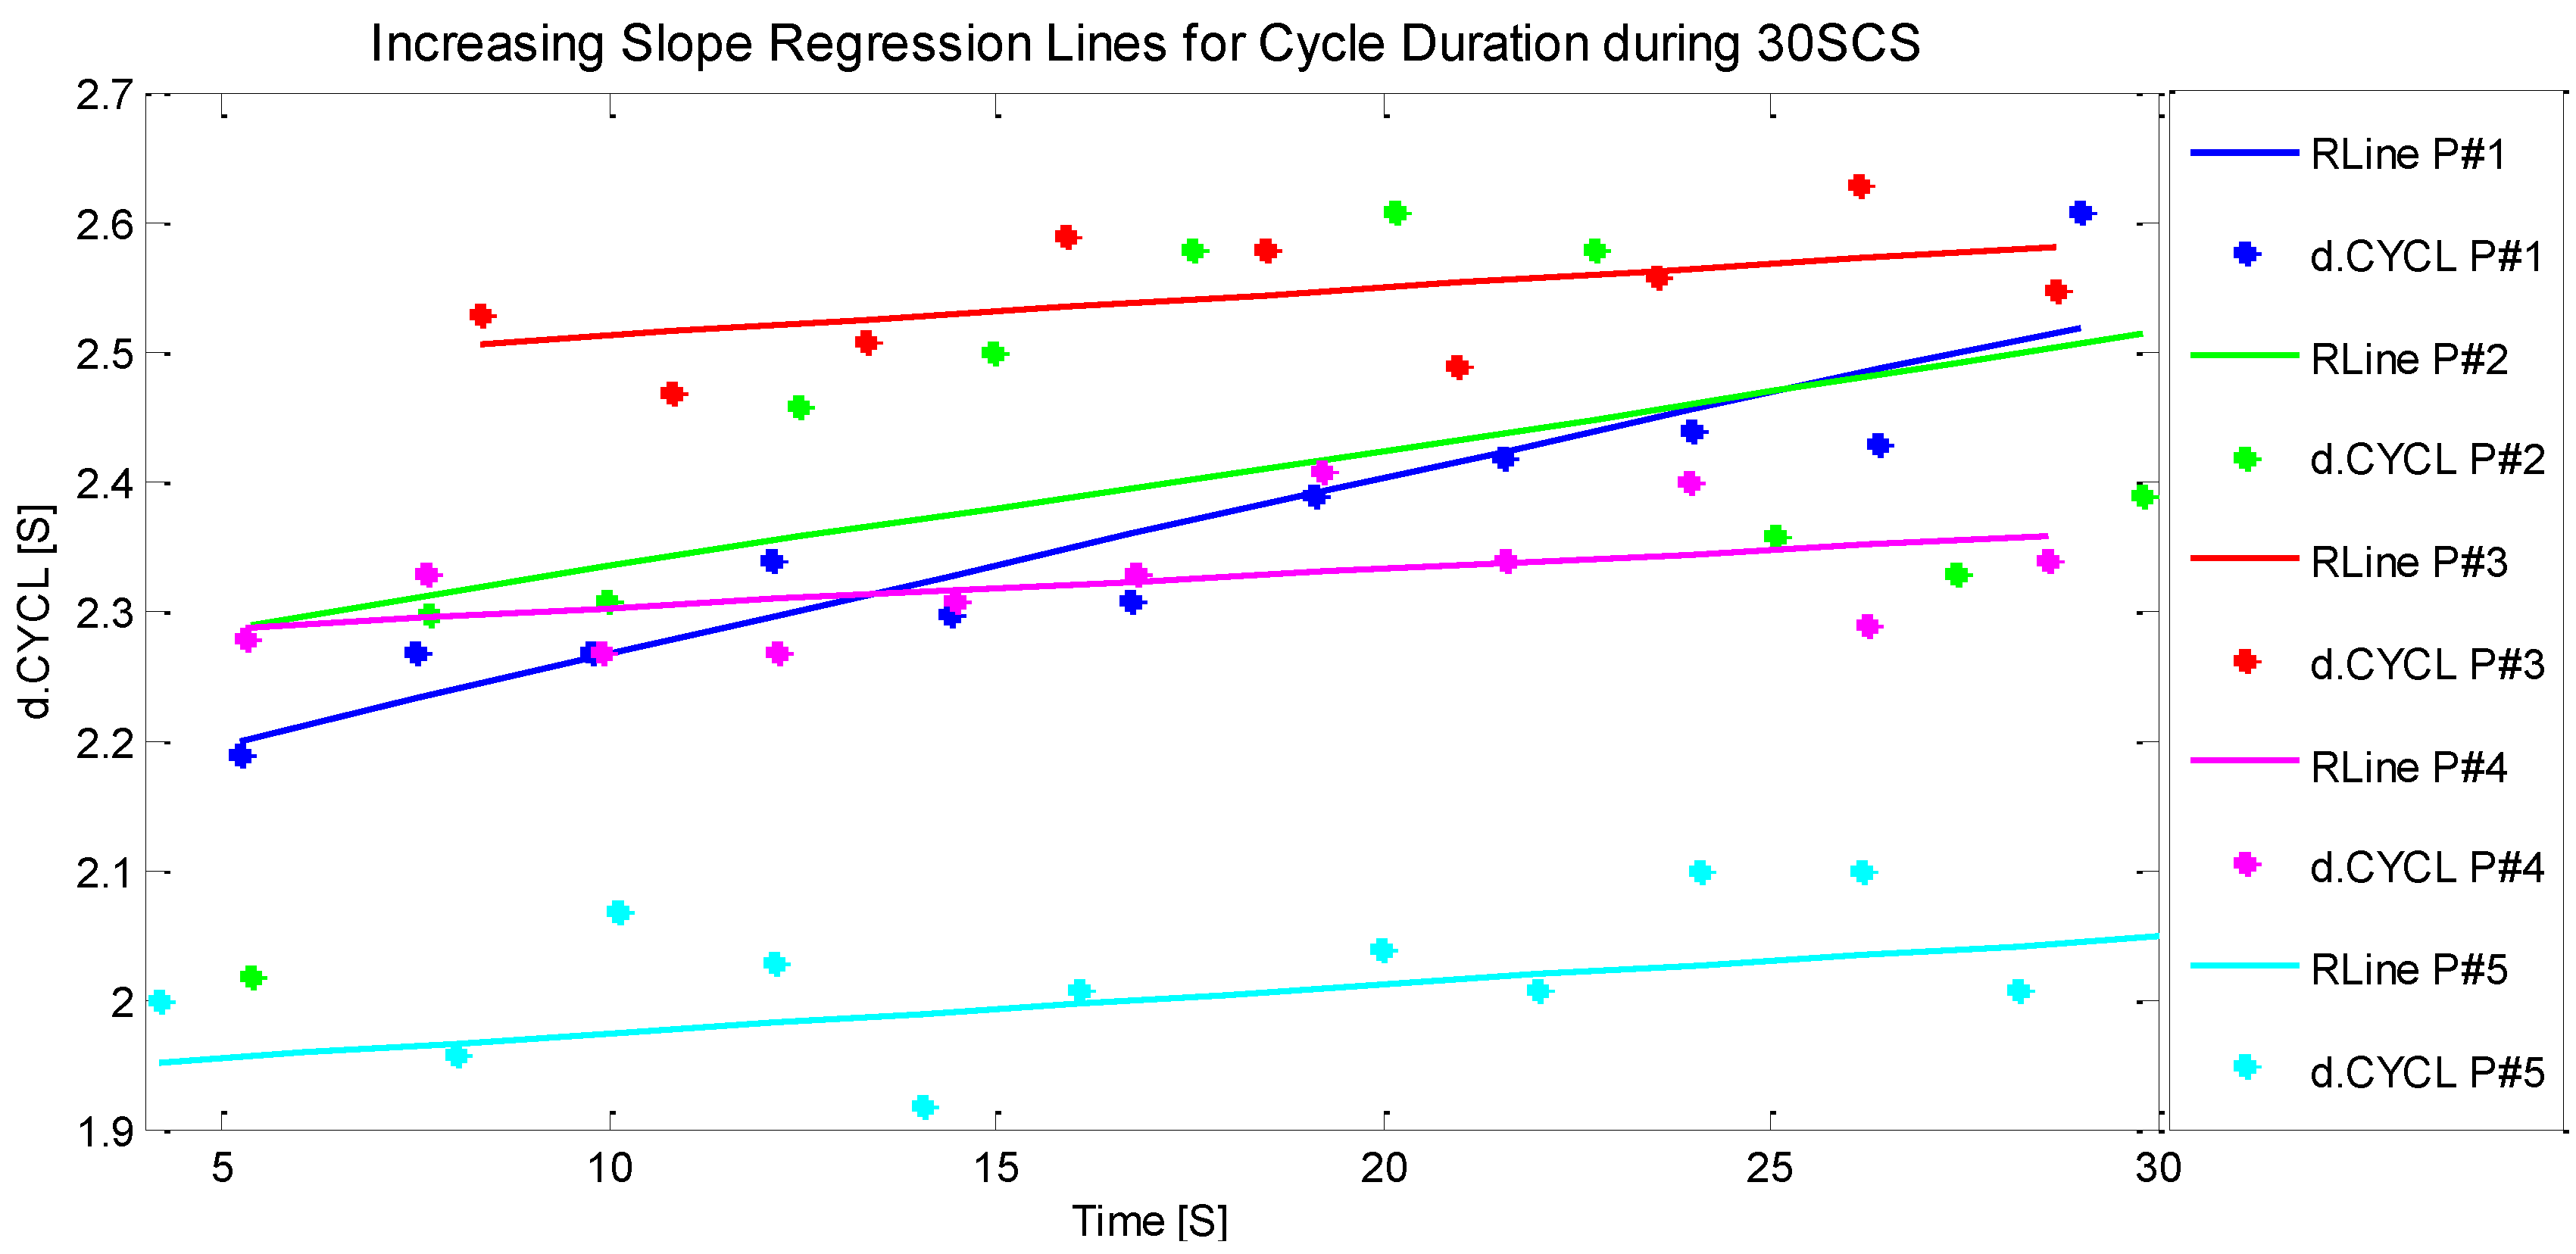
| d.CYCLi | 2.4 ± 0.21 | 2.5 ± 0.3 | 2.7 ± 1.09 | 2.38 ± 0.2 | 1.9 ± 0.25 |
| Slope | 1.14 | 1.09 | 1.03 | 1.03 | 1.05 |
| Standing Stationary | Standing with Balance Trial | Standing with Stumble | ||||||||||
|---|---|---|---|---|---|---|---|---|---|---|---|---|
| s.FTS | s.STS | s.TS | s.OL | s.FTS | s.STS | s.TS | s.OL | s.FTS | s.STS | s.TS | s.OL | |
| 1 | 0.02 | 0.12 | 0.05 | 0.2 | 0.75 | 1.6 | 0.89 | 0.1 | 5.6 | 0.65 | 0.51 | 8.21 |
| 2 | 0.19 | 0.28 | 0.1 | 0.35 | 1.6 | 11.88 | 1.09 | 0.21 | 13.78 | 1.17 | 0.88 | 12.29 |
| 3 | 0.59 | 0.18 | 0.06 | 0.19 | 0.48 | 1.94 | 9.05 | 0.3 | 3.23 | 2.07 | 8.43 | 34.66 |
| 4 | 0.6 | 0.72 | 0.71 | 1.03 | 0.21 | 8.27 | 3.02 | 13.79 | 18.11 | 24.8 | 0.7 | 18.93 |
| 5 | 1.63 | 0.41 | 1 | 0.75 | 1.99 | 8.65 | 12.88 | 2.3 | 9.3 | 12 | 2.67 | 12.21 |
| 6 | 0.21 | 0.41 | 1.5 | 0.91 | 1.48 | 0.38 | 2.75 | 10.4 | 7.77 | 7.46 | 0.9 | 12.34 |
| 7 | 0.67 | 0.02 | 0.21 | 0.86 | 2.99 | 2.14 | 1.94 | 15.82 | 16.22 | 12.28 | 1.75 | 13.84 |
| 8 | 0.43 | 0.24 | 1.88 | 2.24 | 0.3 | 0.49 | 1.73 | 3.66 | 16.86 | 10.35 | 3.54 | 11.05 |
| 9 | 0.02 | 0.71 | 2.36 | 0.73 | 0.76 | 5.33 | 5.75 | 7.89 | 27.93 | 5.95 | 1.85 | 13.99 |
| 10 | 0.08 | 0.82 | 0.47 | 2.60 | 5.64 | 3.66 | 8.29 | 12.83 | 14.64 | 15.14 | 2.81 | 12.71 |
| M | 0.44 | 0.39 | 0.83 | 1.0 | 1.62 | 4.43 | 4.74 | 6.73 | 13.34 | 16.40 | 2.4 | 15.02 |
| SD | 0.45 | 0.26 | 0.79 | 0.77 | 1.57 | 3.75 | 3.87 | 5.84 | 6.83 | 10.4 | 2.22 | 7.02 |
© 2016 by the authors; licensee MDPI, Basel, Switzerland. This article is an open access article distributed under the terms and conditions of the Creative Commons Attribution (CC-BY) license (http://creativecommons.org/licenses/by/4.0/).
Share and Cite
Madhushri, P.; Dzhagaryan, A.; Jovanov, E.; Milenkovic, A. An mHealth Tool Suite for Mobility Assessment. Information 2016, 7, 47. https://doi.org/10.3390/info7030047
Madhushri P, Dzhagaryan A, Jovanov E, Milenkovic A. An mHealth Tool Suite for Mobility Assessment. Information. 2016; 7(3):47. https://doi.org/10.3390/info7030047
Chicago/Turabian StyleMadhushri, Priyanka, Armen Dzhagaryan, Emil Jovanov, and Aleksandar Milenkovic. 2016. "An mHealth Tool Suite for Mobility Assessment" Information 7, no. 3: 47. https://doi.org/10.3390/info7030047
APA StyleMadhushri, P., Dzhagaryan, A., Jovanov, E., & Milenkovic, A. (2016). An mHealth Tool Suite for Mobility Assessment. Information, 7(3), 47. https://doi.org/10.3390/info7030047