Article

Effective Image Retrieval Using Texture Elements and Color Fuzzy Correlogram

College of Computer Science and Technology, Chongqing University of Posts and Telecommunications, Chongqing 400065, China
*
Author to whom correspondence should be addressed.
Information 2017, 8(1), 27; https://doi.org/10.3390/info8010027
Submission received: 30 November 2016 / Revised: 20 February 2017 / Accepted: 23 February 2017 / Published: 25 February 2017
(This article belongs to the Section Information Processes)

Abstract

:
Image low-level information, such as color, texture, and shape, were generally dealt with separately and combined together gruffly. Their image-describing effect in image retrieval was weakened. This paper determines and extracts one group of texture elements from images to mainly express the image texture information and, during this procedure, the quantized HSV color information is added to develop the feature, Color Layer-Based Texture Elements Histogram (CLBTEH). Furthermore, Color Fuzzy Correlogram (CFC) is put forward and employed for further extraction of color features. The performance of the proposed approach is evaluated on different image databases, including Corel-1k, Corel-10k, and USPTex1.0, and it was found that the experimental results of the proposed approach are encouraging in comparison with similar algorithms.

1. Introduction

By attracting more and more researchers, content-based image retrieval (CBIR) has become a popular area in computer vision. Therefore, ever-increasing image low-level feature extraction methods are available to the public. Color, texture, and shape are the common information currently used in CBIR. Color is the most intuitive physical characteristic and it has nice robustness for some basic image operations, such as rotation, scaling, and translation, etc. Thus, it became one of the most popular features. There are four main methods describing color feature—color histogram [1], color correlogram [2], color moment [3] and color coherence vectors [4]. Texture is one of the most important image features and it essentially depicts the spatial distribution law of a neighborhood’s gray information of pixels. The texture feature description approaches can be divided into four categories, including statistical approaches (e.g., gray level co-occurrence matrix [5]), structural texture analysis methods [5], modeling (e.g., multi-resolution simultaneous autoregressive [6]), and frequency-spectrum methods (e.g., Gabor transform [7] and wavelet transform [8]). Shape is an essential feature of objects in images. The existing shape feature extraction approaches can be basically classified as edge-based [9] and region-based [10]. Simple features can hardly index images exactly, so later researchers mostly paid attention to multi-feature fusion. Wang et al. [11] extracted color features of images by Zernike color-distributed moments and computed texture features with a contourlet transform. Then, these two features were combined together to conduct image retrieval. With the combination of all of the low-level features, Ekta et al. [12] designed a novel framework for color image retrieval. They utilized Angular Radial Transform (ART) and the modified Color Difference Histogram (CDH) to extract color, texture, and shape information of images. Guo et al. [13] adopted ordered-dither block truncation coding (ODBTC) to compress images into data streams and the color and texture features were separately derived from the data streams for image retrieval. For the equal status of color and texture information in image retrieval, Lin et al. [14] proposed a Global Correlation Descriptor (GCD) to extract color and texture feature, respectively. All of these feature extraction algorithms took more than one kind of image content into consideration and achieved satisfactory experimental results. However, all of these features were extracted independently, leading to their poor image-indexing.
This paper designs one group of texture elements to mainly express the texture information embodied in images. To integrate the image low-level information better, the color layer information are added into these texture elements and the resulting features represent images more exactly. Additionally, a color fuzzy correlogram is introduced here for the further extraction of color features.

2. Related Work

A color correlogram [2] was proved to be superior to a color histogram in image retrieval. It described image information through the distribution of any color pair over distance. Therefore, a color correlogram includes not only the statistical information, but also the spatial correlation of colors, while a color histogram contains merely the statistical information. In addition, a color correlogram has easy calculation, simple features, and better effect. In order to reduce the cost of computation, people usually employed a color auto-correlogram, considering only the correlation between the same colors. Moghaddam et al. [15] combined multi-resolution image decomposition and a color correlogram to obtain a new algorithm for image indexing and retrieval. In their new method, one-directional auto-correlograms of the wavelet coefficients were computed to be the image index vectors. An optimal simplified color correlogram (SCC) was used as an object representation for object tracking in [16] and yielded success. Malviya et al. [17] applied a color auto-correlogram for the detection of forgery in blind image forensics. In this paper, we come up with the concept of a color fuzzy correlogram. It retains the relevance between different color values in a color correlogram and inherits the advantage of low space complexity in a color auto-correlogram.
Structural texture analysis methods supposed that image texture was comprised of regular permutations and combinations of certain texture elements. Hence, the key problems became the determination and extraction of texture elements and the discovery of their statistical and spatial relationship. Carlucci [18] suggested a texture model using primitives of line segments, open polygons, and closed polygons. The placement rules in this model were given syntactically in a graph-like language. Lu et al. [19] gave a tree grammar syntactic approach for texture. They divided a texture up into small square windows (9 × 9). The spatial structure of the resolution cells in the window was expressed as a tree. Liu et al. [20,21,22] proposed three structure-based image feature extraction methods successively. They expressed the spatial correlation of textons through their statistical information in [20]. In this process, the original images were quantized into 256 colors and the color gradient was computed from the RGB vector space. Multi-texton histogram (MTH), based on Julesz’s textons theory, was presented in [21]. The MTH integrated the advantages of a co-occurrence matrix and a histogram and could be used as a shape or color texture descriptor for image retrieval. In [22], the authors introduced a new image feature detector and descriptor, micro-structure descriptor (MSD), based on the underlying colors in micro-structures with similar edge orientation. The MSD integrated color, texture, shape, and color layout information to extracted features by simulating human early visual processing. Wang et al. [23] came up with structure elements’ descriptor (SED) to describe image color and texture features. A histogram of the structure elements was captured based on the HSV color space to represent the spatial correlation of color and texture. In our work, we propose a group of texture elements and integrate them with the quantized HSV color layers to describe the statistical and spatial features of image color and texture.

3. The Proposed Feature Extraction Methods

This section elaborates the proposed feature extraction methods in detail. Our approaches are operated based on the HSV color space because it is the most suitable color space to mimic the human visual system. The color space will be quantized because human eyes cannot distinguish large numbers of colors at the same time. The quantization formulas [24] are as follows:
H = { 0 ,   i f   h [ 0 , 24 ] [ 345 , 360 ] 1 ,   i f   h [ 25 , 49 ] 2 ,   i f   h [ 50 , 79 ] 3 ,   i f   h [ 80 , 159 ] 4 ,   i f   h [ 160 , 194 ] 5 ,   i f   h [ 195 , 264 ] 6 ,   i f   h [ 265 , 284 ] 7 ,   i f   h [ 285 , 344 ]
S = { 0 ,   i f   s [ 0 , 0.15 ] 1 ,   i f   s ( 0.15 , 0.8 ] 2 ,   i f   s ( 0.8 , 1 ]
V = { 0 ,   i f   v [ 0 , 0.15 ] 1 ,   i f   v ( 0.15 , 0.8 ] 2 ,   i f   v ( 0.8 , 1 ]
That is, we divide the components of hue, saturation, and value into 8, 3, and 3 parts, separately, and take them as 14 color layers including H 0 ,   H 1 ,   H 2 ,   H 3 ,   H 4 ,   H 5 ,   H 6 ,   H 7 ,   S 0 ,   S 1 ,   S 2 ,   V 0 ,   V 1 ,   V 2 .

3.1. Color Layer-Based Texture Elements Histogram

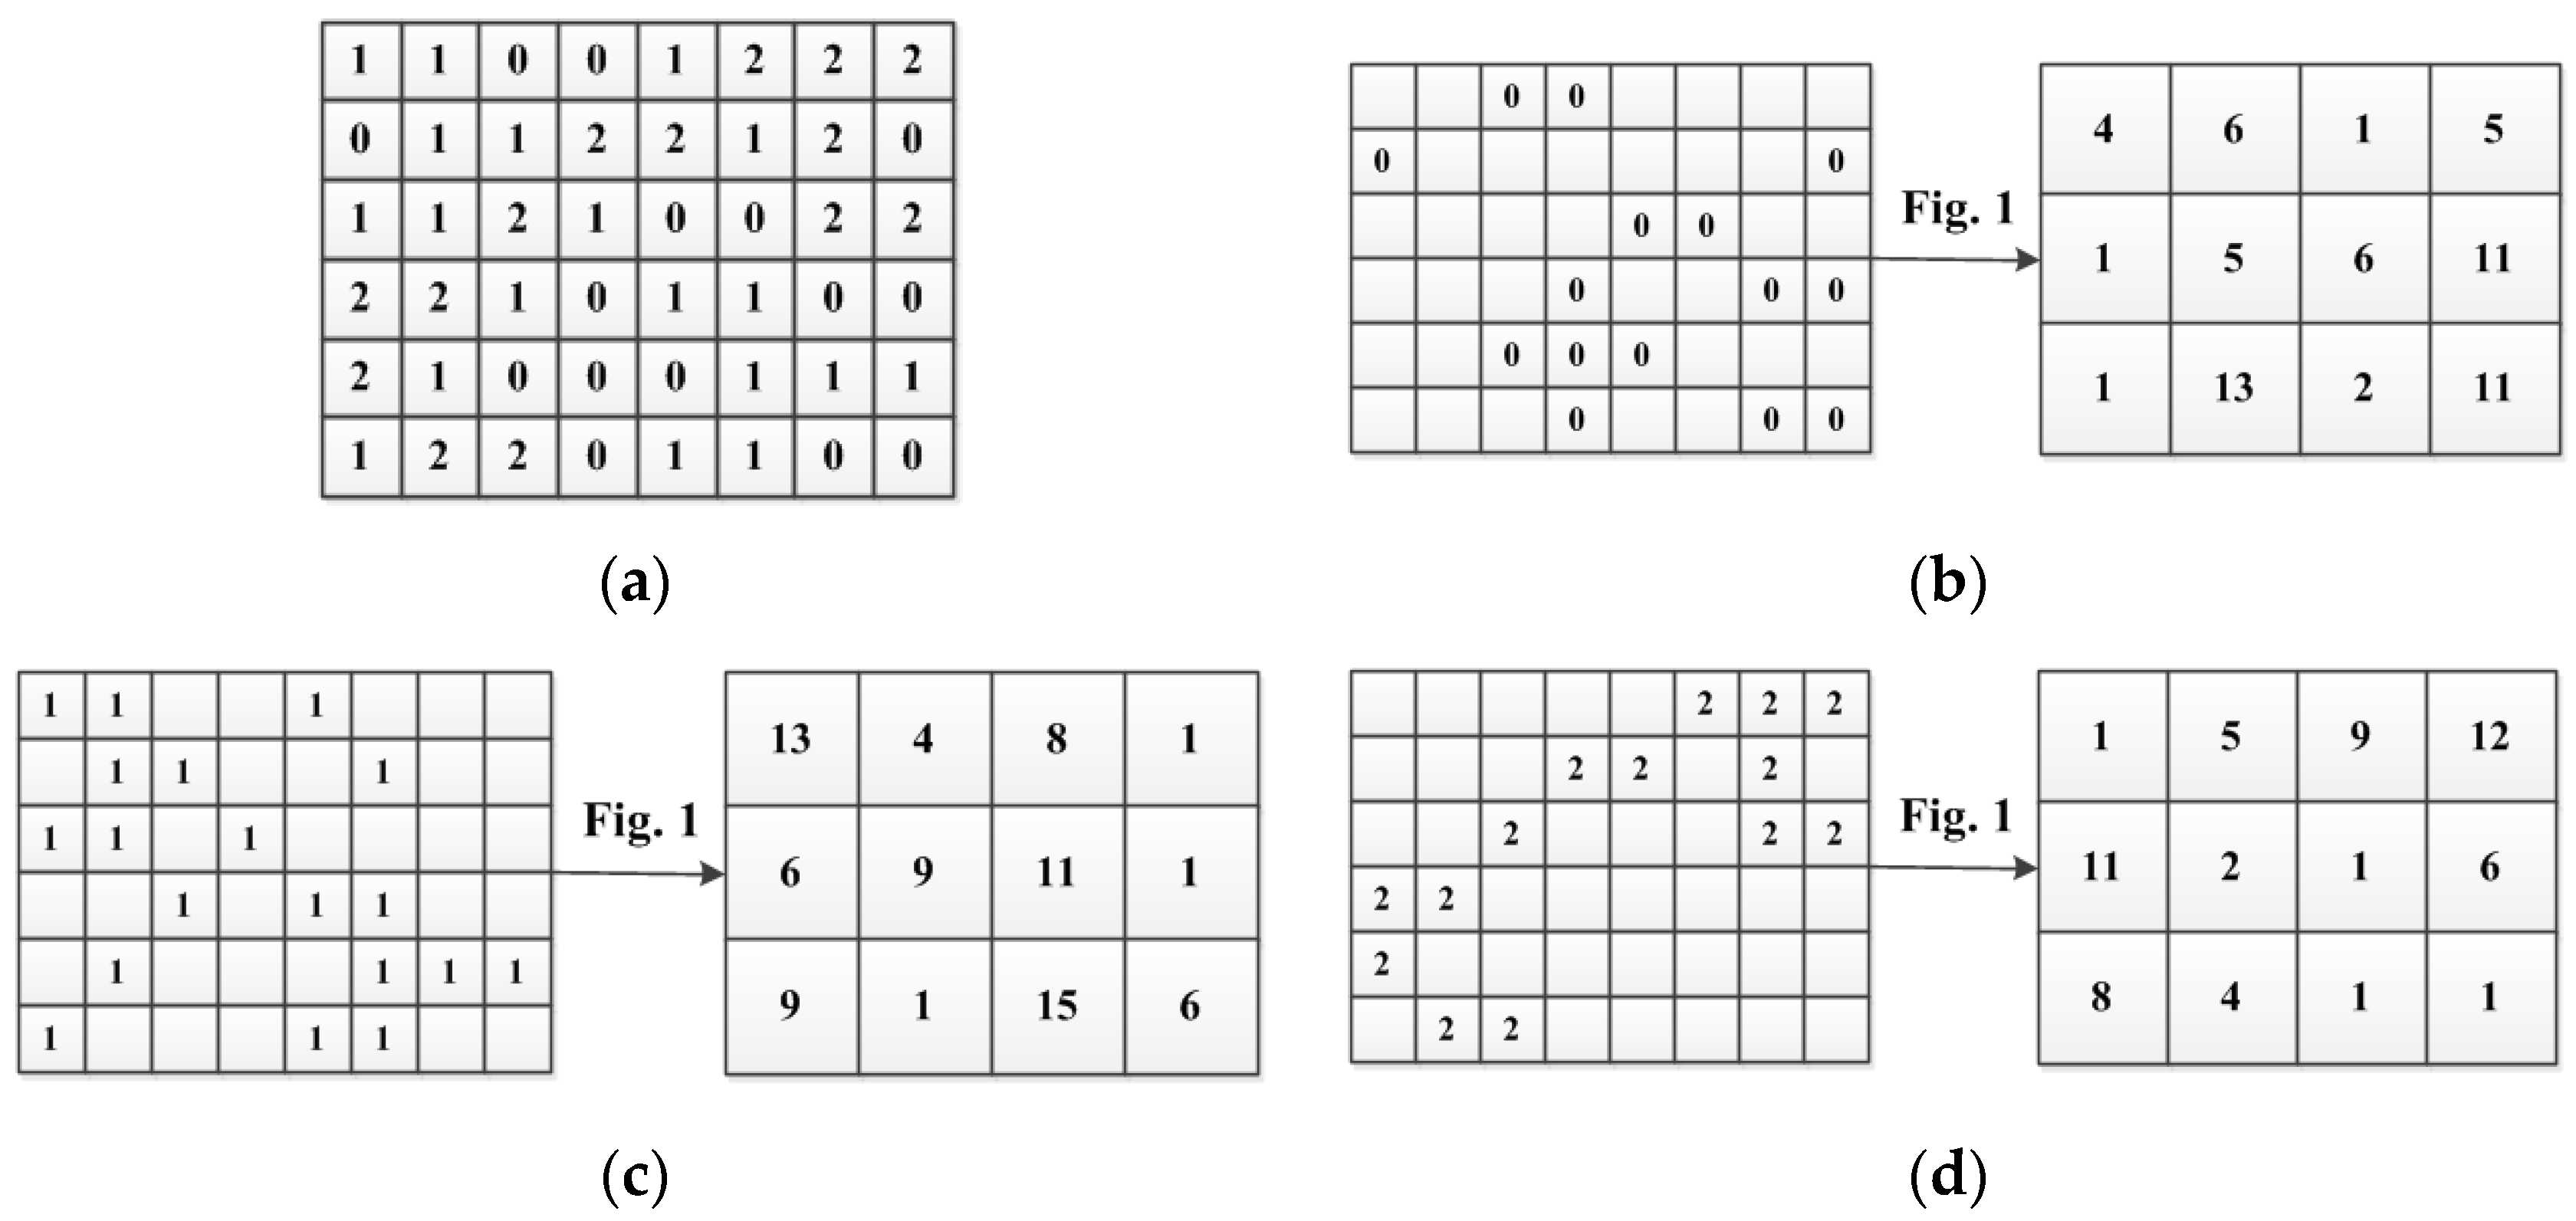
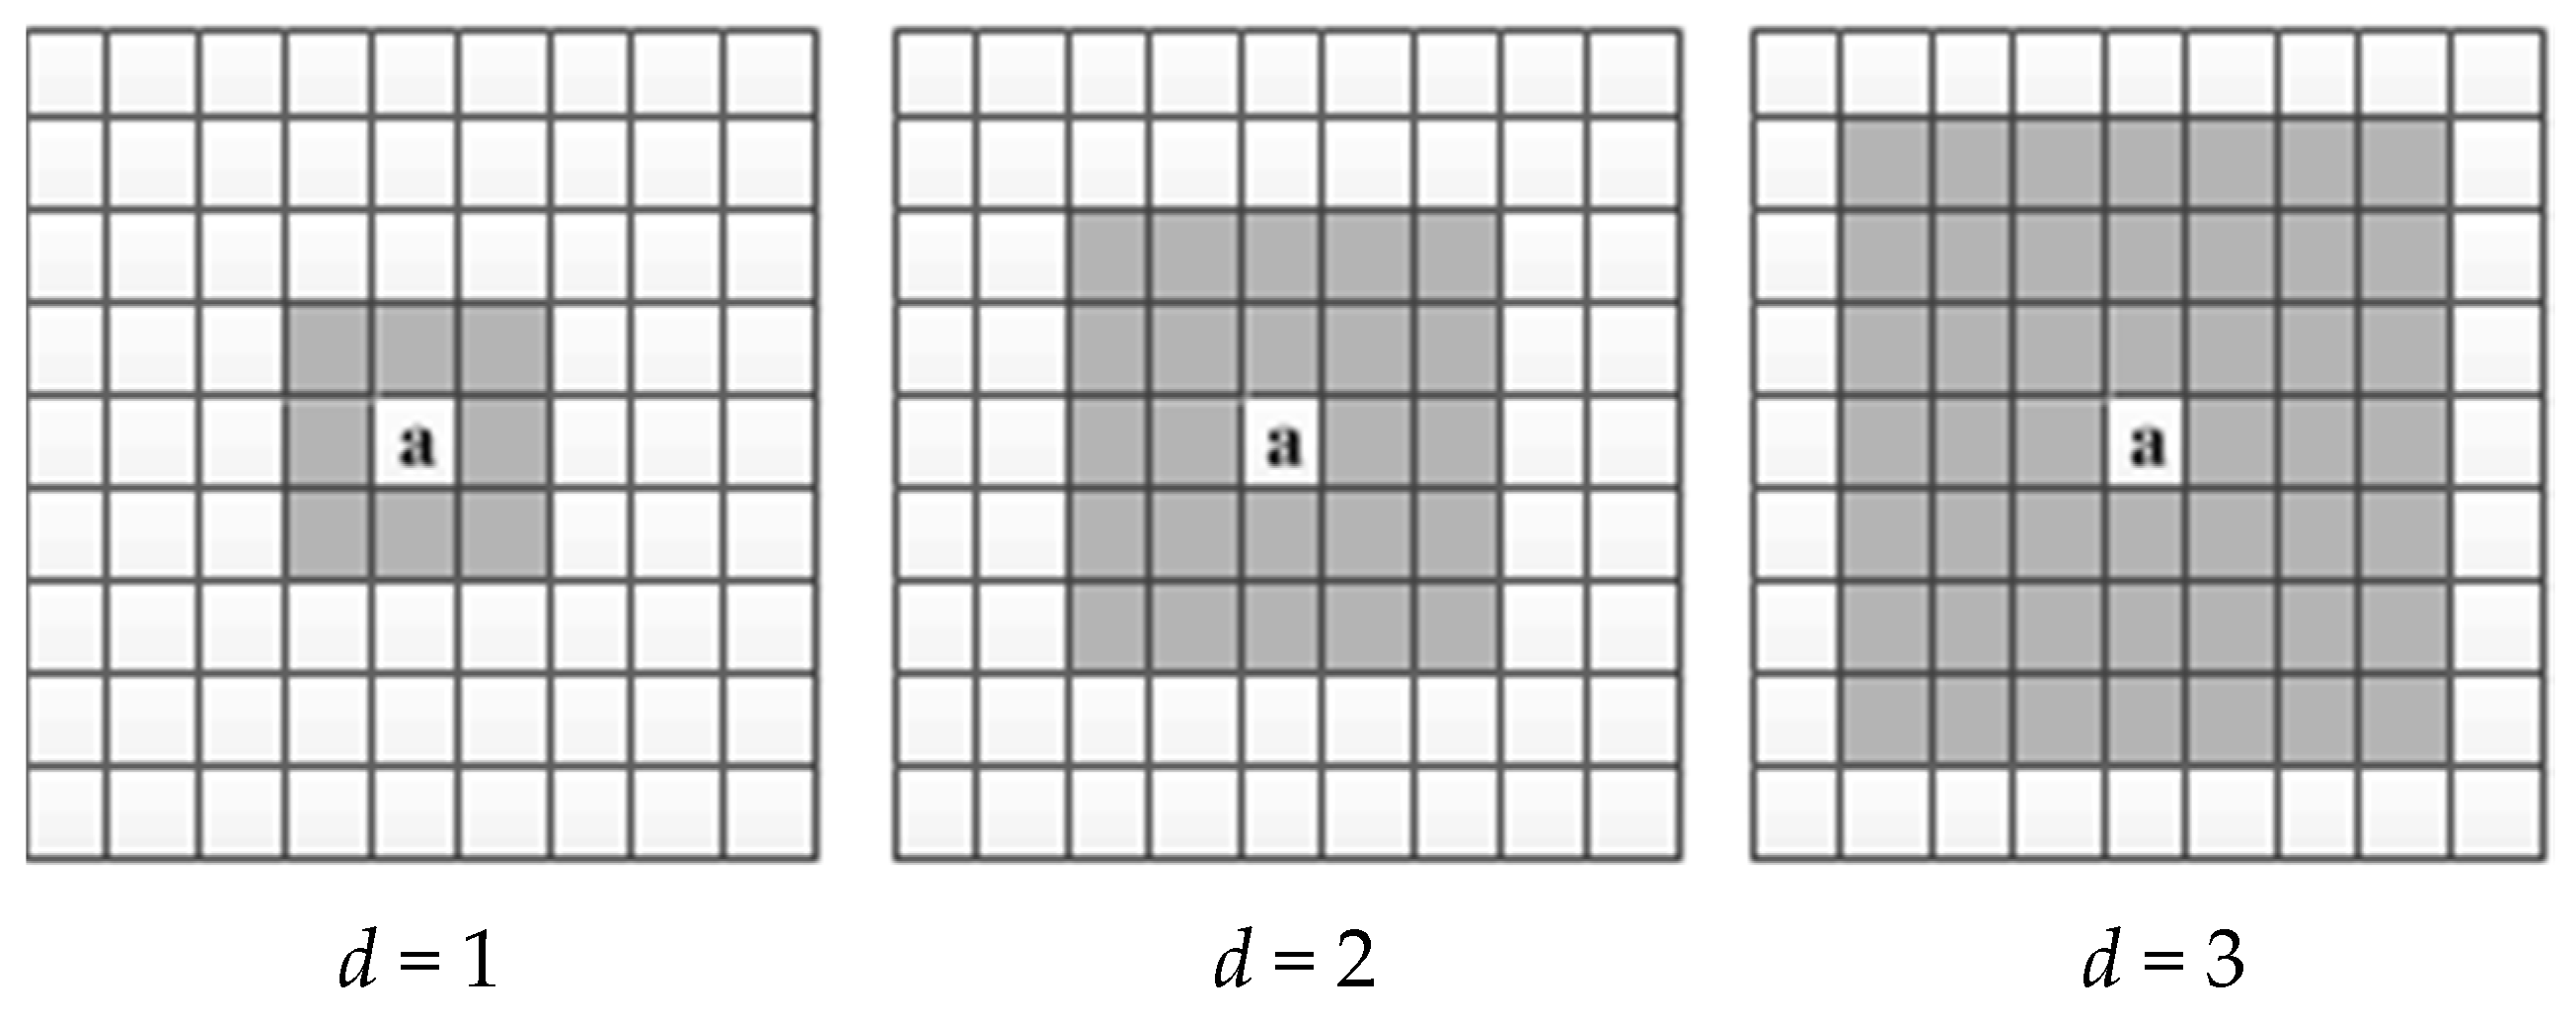
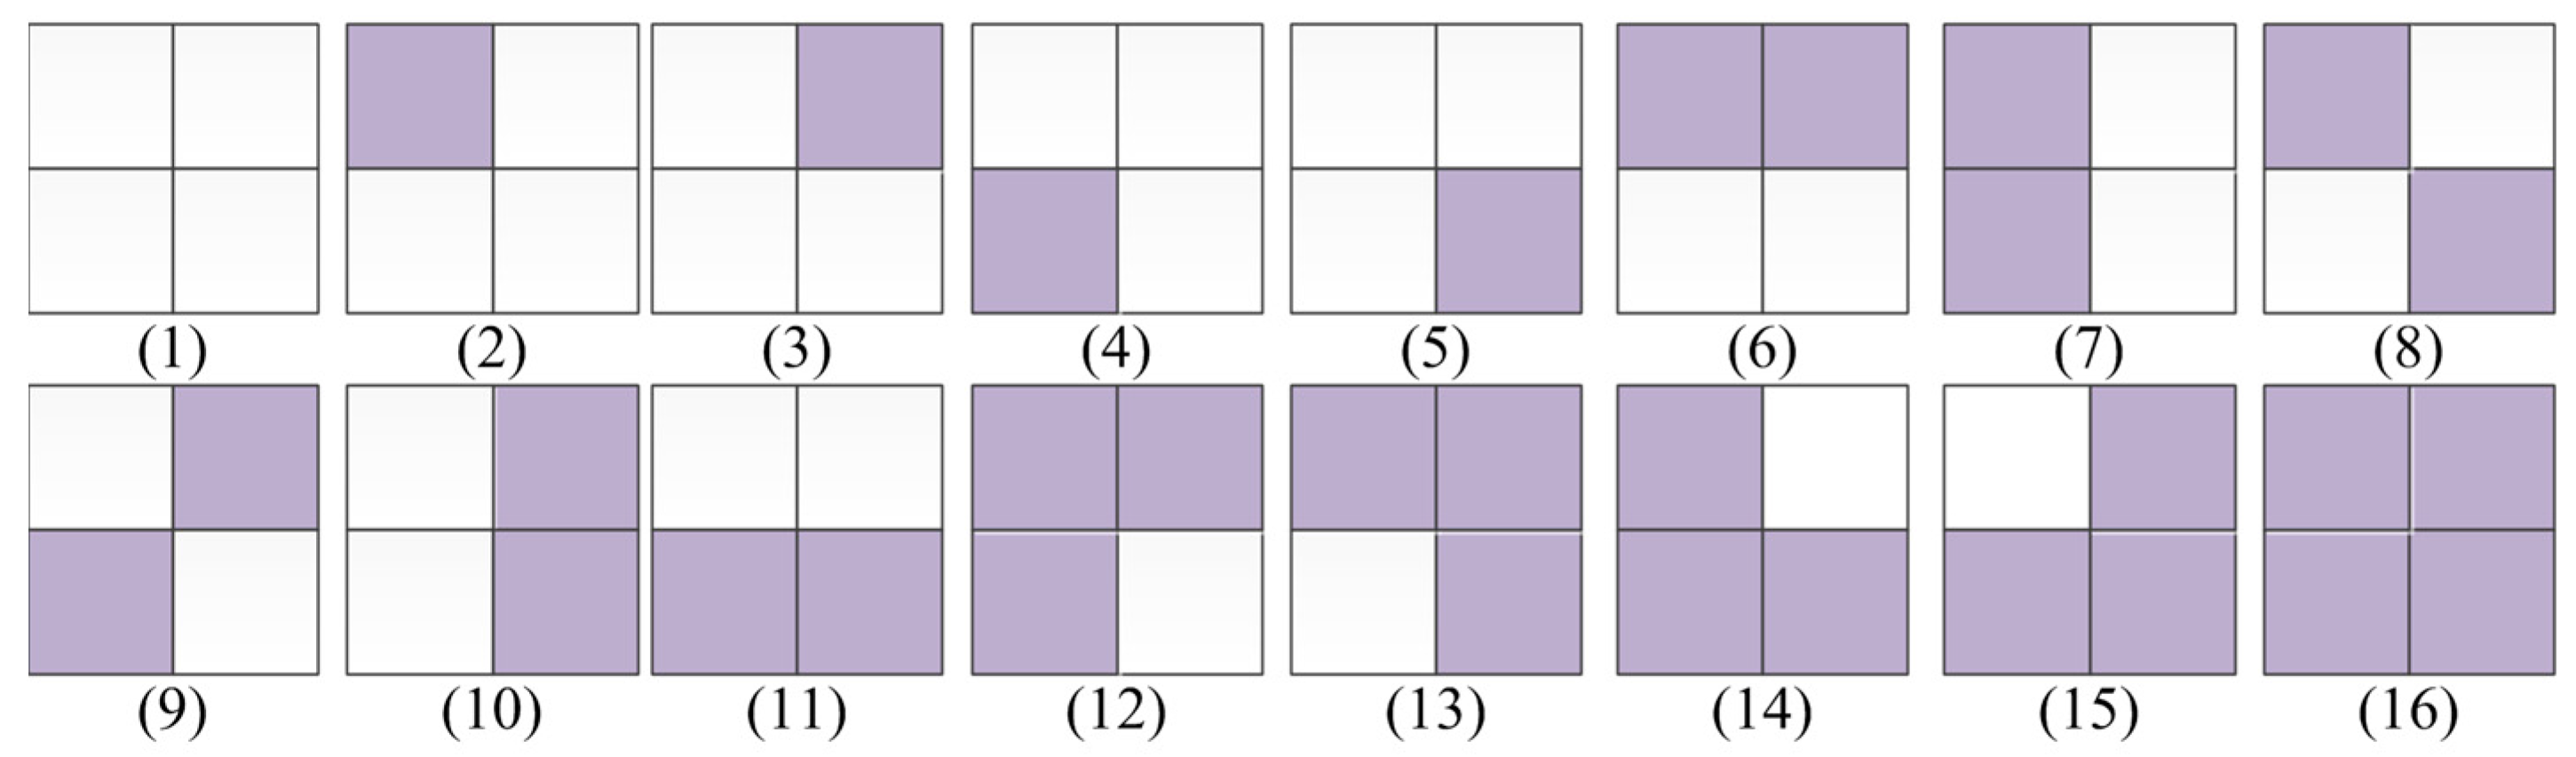
3.1.1. Texture Elements Definition

The texture of an image can be considered as a set of small units. The category number of these units is limited when they are small enough, and they can be permutated and combined to present textures of any image. These units, defined as texture elements, reflect the texture structure of images. The same kinds of images usually have similar texture, i.e., the permutation and combination of texture elements embodied in them should also be similar. In this paper, one group of texture elements are defined in Figure 1 based on a binary image. There are 16 different units of size 2 × 2. Here, the colored section is “1” and the blank section is “0”.

3.1.2. Feature Extraction

The first feature, color layer based texture elements histogram, integrates image color and texture information and it is obtained with the following steps:
Step 1. Convert the original RGB image to the corresponding HSV image and quantize it using Equations (1)–(3).
Step 2. Traverse every color layer using the texture elements in Figure 1 according to the order of top to bottom and left to right. The moving step length is 2 pixels. An example is given in Figure 2, taking the three color layers quantized from the component saturation.
Step 3. For every color layer, count the number of each kind of texture element to obtain a 16-dimensional statistical histogram, and normalize it using the following equation:
t l i = T l i i = 1 16 T l i
where T l i and t l i denote the number of texture element i in color layer l and the corresponding normalized result in the histogram, separately.
Herein, i = 1 , 2 , , 16 , l = H 0 ,   H 1 ,   H 2 ,   H 3 ,   H 4 ,   H 5 ,   H 6 ,   H 7 ,   S 0 ,   S 1 ,   S 2 ,   V 0 ,   V 1 ,   V 2 .
Step 4. Reassemble the histograms of all of the color layers to obtain the required feature vector. The final feature vector of the example in Figure 2 is:
( 0.25 , 0.08 , 0 , 0.08 , 0.17 , 0.17 , 0 , 0 , 0 , 0 , 0.17 , 0 , 0.08 , 0 , 0 , 0 , 0.25 , 0 , 0 , 0.08 , 0 , 0.17 , 0 , 0.08 , 0.17 , 0 , 0.08 , 0 , 0.08 , 0 , 0.08 , 0 , 0.33 , 0.08 , 0 , 0.08 , 0.08 , 0.08 , 0 , 0.08 , 0.08 , 0 , 0.08 , 0.08 , 0 , 0 , 0 , 0 )
and it has 48 (16 × 3) dimensions. Similarly, the feature vector is 224-dimentional when there are 14 color layers.

3.2. Color Fuzzy Correlogram

In this section, we introduce the theory of a color fuzzy correlogram on the basis of a color correlogram and color auto-correlogram. A color auto-correlogram was proposed to reduce the massive computation of the color correlogram, but it neglects the correlation between different colors. By integrating the advantages of these two existing methods, we construct a color fuzzy correlogram. It reflects the relevance between any two colors and has low time and space complexity.

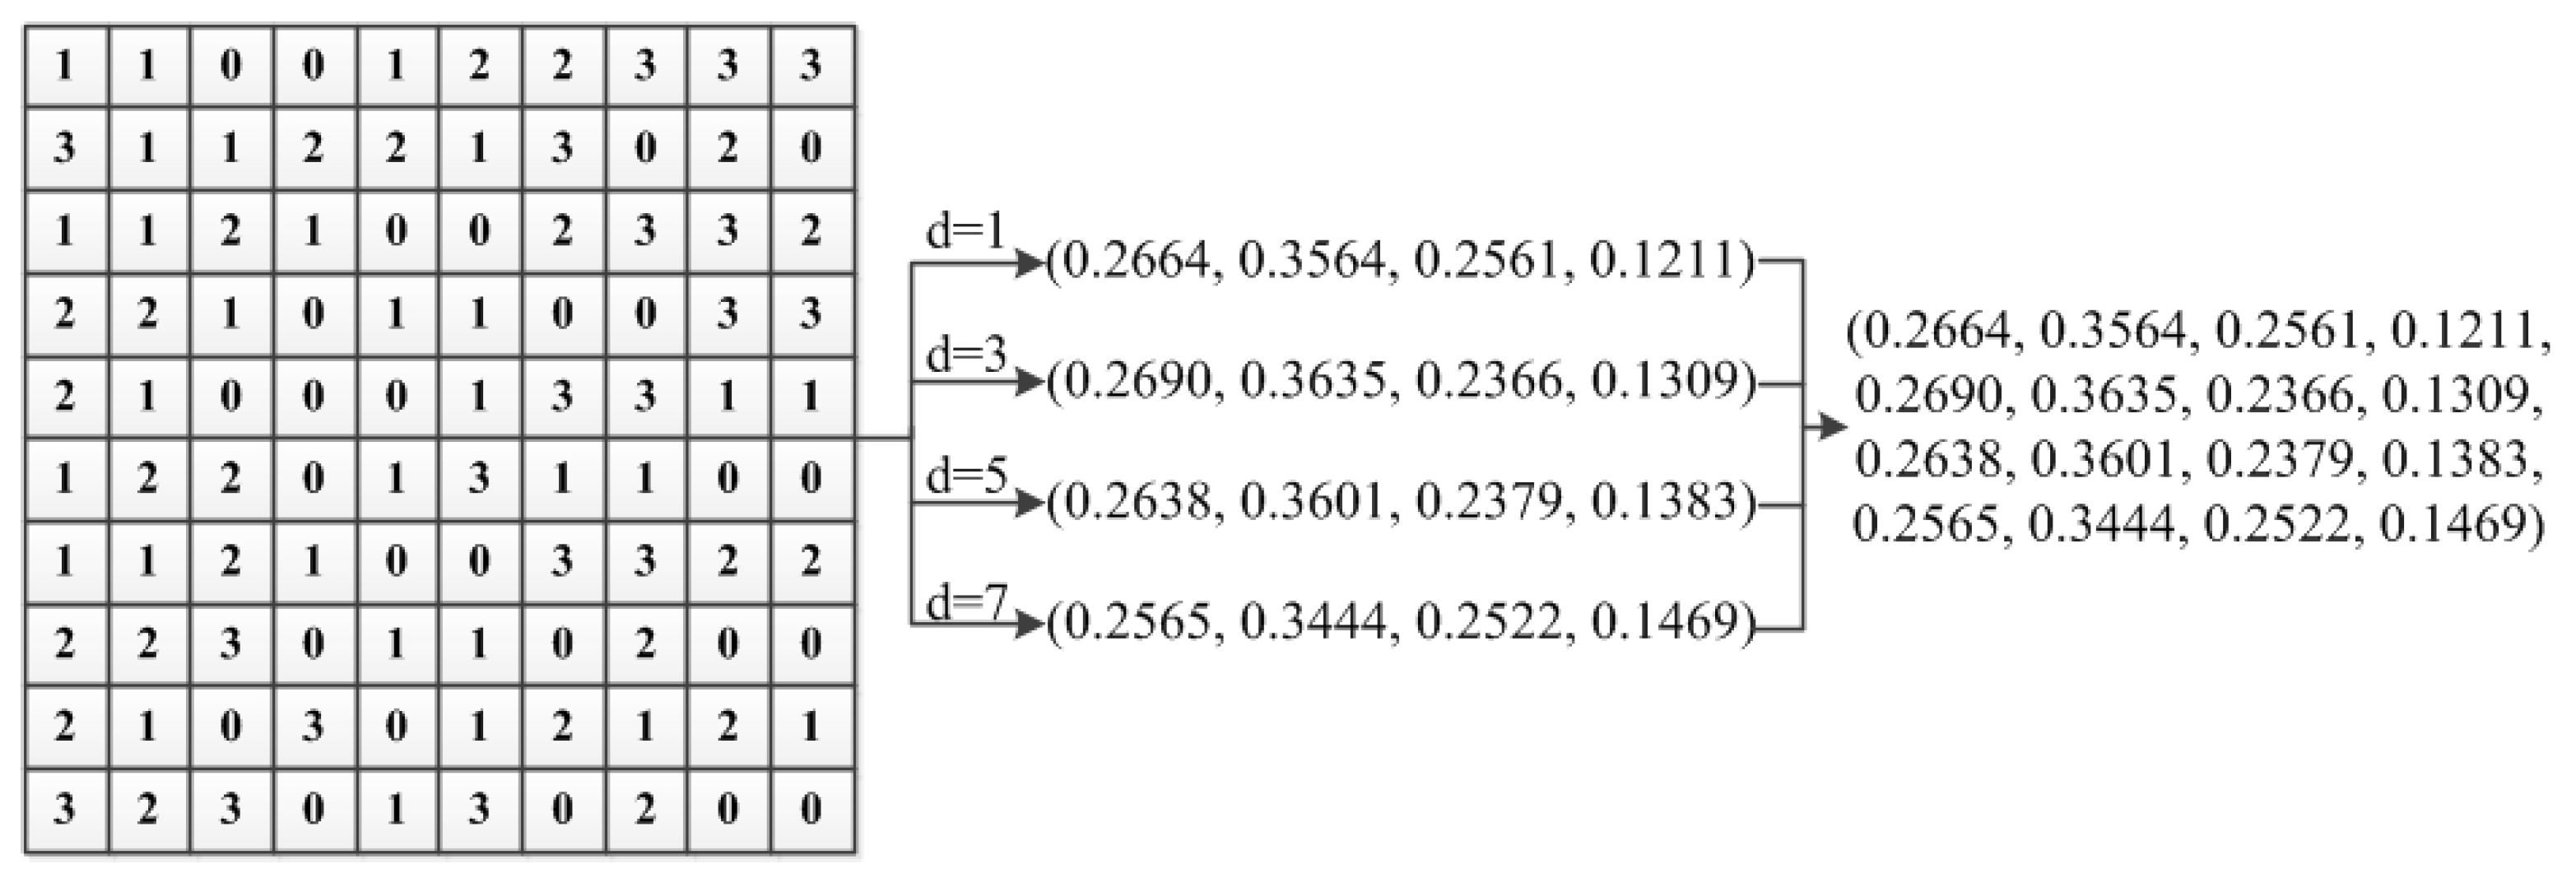
3.2.1. The Calculation of Color Fuzzy Correlogram

The calculation process of the color fuzzy correlogram is as follows.
Step 1. Quantify the given image I into the range of [ I min , I max ] . Take any pixel a as the central pixel. x is a surrounding pixel of a and it is not more than d pixels away from a . Figure 3 shows how to determine the surrounding pixels of a given pixel a for different distance d . Here, the colored pixels are the surrounding pixels x . The fuzziness ϕ d ( a , x ) between a and x can be computed as:
ϕ d ( a , x ) = F u z z y ( p ( a ) , p ( x ) )
where p ( a ) and p ( x ) denote the color value of a and x , respectively. F u z z y ( ) , the ambiguity function, is defined as:
F u z z y ( p ( a ) , p ( x ) ) = { 1 , i f   p ( a ) = p ( x ) I max ( I max + 1 ) × | p ( a ) p ( x ) | , i f   p ( a ) p ( x )
Calculate the fuzziness between a and all of the satisfied surrounding pixels, x .
Step 2. Add all of the fuzziness ϕ d ( a , x ) together to get the fuzzy correlation value of the central pixel a . The fuzzy correlation value ψ d ( a ) can be easily computed as:
ψ d ( a ) = i = 1 n x ϕ d ( a , x i )
where n x denotes the number of the satisfied surrounding pixels. Take all of the pixels in image I successively as the central pixel and calculate their fuzzy correlation value.
Step 3. For pixels with the same color value, add up their fuzzy correlation values as follows:
ψ d ( Ε ) = j = 0 n Ε ψ d ( a ) ,   p ( a ) = Ε
where ψ d ( Ε ) denotes the fuzzy correlation value of color value Ε . The symbol n E indicates the number of pixels whose color value is Ε in image I. Considering the situation that some values among [ I min , I max ] may not appear in image I, we set the initial fuzzy correlation values as zero.
Step 4. Express the color fuzzy correlogram of image I C F C d ( I ) , as follows:
C F C d ( I ) = [ ψ d ( I min ) ,   ψ d ( I min + 1 ) , , ψ d ( I max ) ]
herein, ψ d ( i ) denotes the color fuzzy correlation value of color value i , and i = I min , I min + 1 , , I max .

3.2.2. Color Feature Extraction

We employ the color fuzzy correlogram as the complementary color feature in our study. The procedure of color feature extraction is as the following steps:
For an original HSV image I whose size is M × N :
Step 1. Divide I into multiple non-overlapping image blocks of size m × n . Let Β = { b ( i , j ) |   i = 1 , 2 , , Μ m ;   j = 1 , 2 , , Ν n } be the set of all of these image blocks.
Step 2. Replace image block b ( i , j ) with a pixel p max ( i , j ) which is defined as :
p max ( i , j ) = [ max k , l   b k , l H u e ( i , j ) ,   max k , l   b k , l S a t u r a t i o n ( i , j ) ,   max k , l   b k , l V a l u e ( i , j ) ]
for all i = 1 , 2 , , Μ m , j = 1 , 2 , , Ν n , k = 1 , 2 , 3 , , m , and l = 1 , 2 , 3 , n . Herein, pixel p max ( i , j ) denotes the maximum values, respectively, over hue, saturation, and value channels on the corresponding image block b ( i , j ) . By replacing all the blocks in collection Β with pixel p max ( i , j ) , an image called max-image are generated.
Step 3. Replace image block b ( i , j ) with a pixel p min ( i , j ) , which is defined as:
p min ( i , j ) = [ min k , l   b k , l H u e ( i , j ) ,   min k , l   b k , l S a t u r a t i o n ( i , j ) ,   min k , l   b k , l V a l u e ( i , j ) ]
for all i = 1 , 2 , , Μ m , j = 1 , 2 , , Ν n , k = 1 , 2 , 3 , , m , and l = 1 , 2 , 3 , n . Herein, pixel p min ( i , j ) denotes the minimum values, respectively, over Hue, Saturation and Value channels on the corresponding image block b ( i , j ) . By replacing all the blocks in collection Β with pixel p min ( i , j ) , an image called min-image are generated.
Step 4. Quantize the two shrunken images max-image and min-image to 72 bins using Equations (12) and (13) based on Equations (1)–(3):
P = Q S Q V H + Q V S + V
where P , Q S , Q V denote the final quantization result, and the number of parts of saturation and value being divided into, respectively. Herein, Q S = 3 ,   Q V = 3 and insert this equation into Equation (12) to obtain:
P = 9 H + 3 S + V
where H { 0 , 1 , , 7 } , S { 0 , 1 , 2 } , V { 0 , 1 , 2 } , P { 0 , 1 , , 71 } .
Step 5. Set up distance d in Chapter 3.2.1 successively as the values in set D = { 1 , 3 , 5 , 7 } . Since the image was quantized to 72 bins, for each value in D, we can obtain a 72-dimensional color fuzzy correlogram vector. Perform normalization on it using the following formula:
c i = ψ d ( i 1 ) i = 1 72 ψ d ( i 1 )
where ψ d ( i 1 ) and c i denote the color fuzzy correlation value of color value i 1 and its normalization result in the vector. Herein, i = 1 ,   2 ,   ,   72 . Reassemble the obtained four color fuzzy correlogram vectors to obtian a 288-dimensional vector. An example is given in Figure 4 (suppose the HSV color space was quantized to 4 colors).
Step 6. Apply Step 5 to max-image and min-image separately to obtain two 288-dimensional vectors. Integrate them into the 576-dimensional final color feature descriptor.

4. Experiments

In this section, we prove the effectiveness of the proposed feature extraction methods by applying them to CBIR.

4.1. Similarity Measurement between Images

The relative distance measure is employed in this study to do the distance measurement between two features as:
d i s t ( f e a t u r e q u e r y , f e a t u r e t arg e t ) = j = 1 n dim | f e a t u r e q u e r y ( j ) f e a t u r e t arg e t ( j ) | f e a t u r e q u e r y ( j ) + f e a t u r e t arg e t ( j ) + δ
where d i s t denotes the distance between the query image feature f e a t u r e q u e r y and the target image feature f e a t u r e t arg e t . n dim indicates the dimension of these two feature vectors. δ is an extremely small positive number to avoid the denominator being zero. We calculate and store the distances between all target image features and the query image feature; the min-max normalization method is employed here to normalize these distances as:
d i s t = d i s t min max min
where min , max denote the minimum and maximum among the distances, respectively. The symbols d i s t and d i s t denote the normalization-before and normalization-after distance, separately. The similarity distance between the query image and the target image is then computed as:
D i s t ( q u e r y , t arg e t ) = j = 1 n f λ j d i s t ( f e a t u r e j q u e r y ,   f e a t u r e j t arg e t )
where D i s t denotes the similarity distance between the query image q u e r y and the target image t arg e t , and the smaller D i s t is, the more similar images are. n f is the number of features of each image. λ j indicates the similarity weighting constant, representing the percentage contributions of f e a t u r e j in the image retrieval system.

4.2. Performance Evaluation

The average precision rate Pr e c i s i o n ( q ) and average recall rate Re c a l l ( q ) employed here to judge the retrieval effect are defined in [25] as:
Pr e c i s i o n ( q ) = 1 N × L i = 1 N N q ( L ) × 100 % , Re c a l l ( q ) = 1 N × N c i = 1 N N q ( L ) × 100 % .
where q , N , N c denote the query image, the number of all the images in the database, and the number of relevant images on each class among N , respectively. L and N q ( L ) denote the number of the retrieved images and the number of correctly retrieved images among L , separately. Higher Pr e c i s i o n ( q ) and Re c a l l ( q ) means better retrieval results.

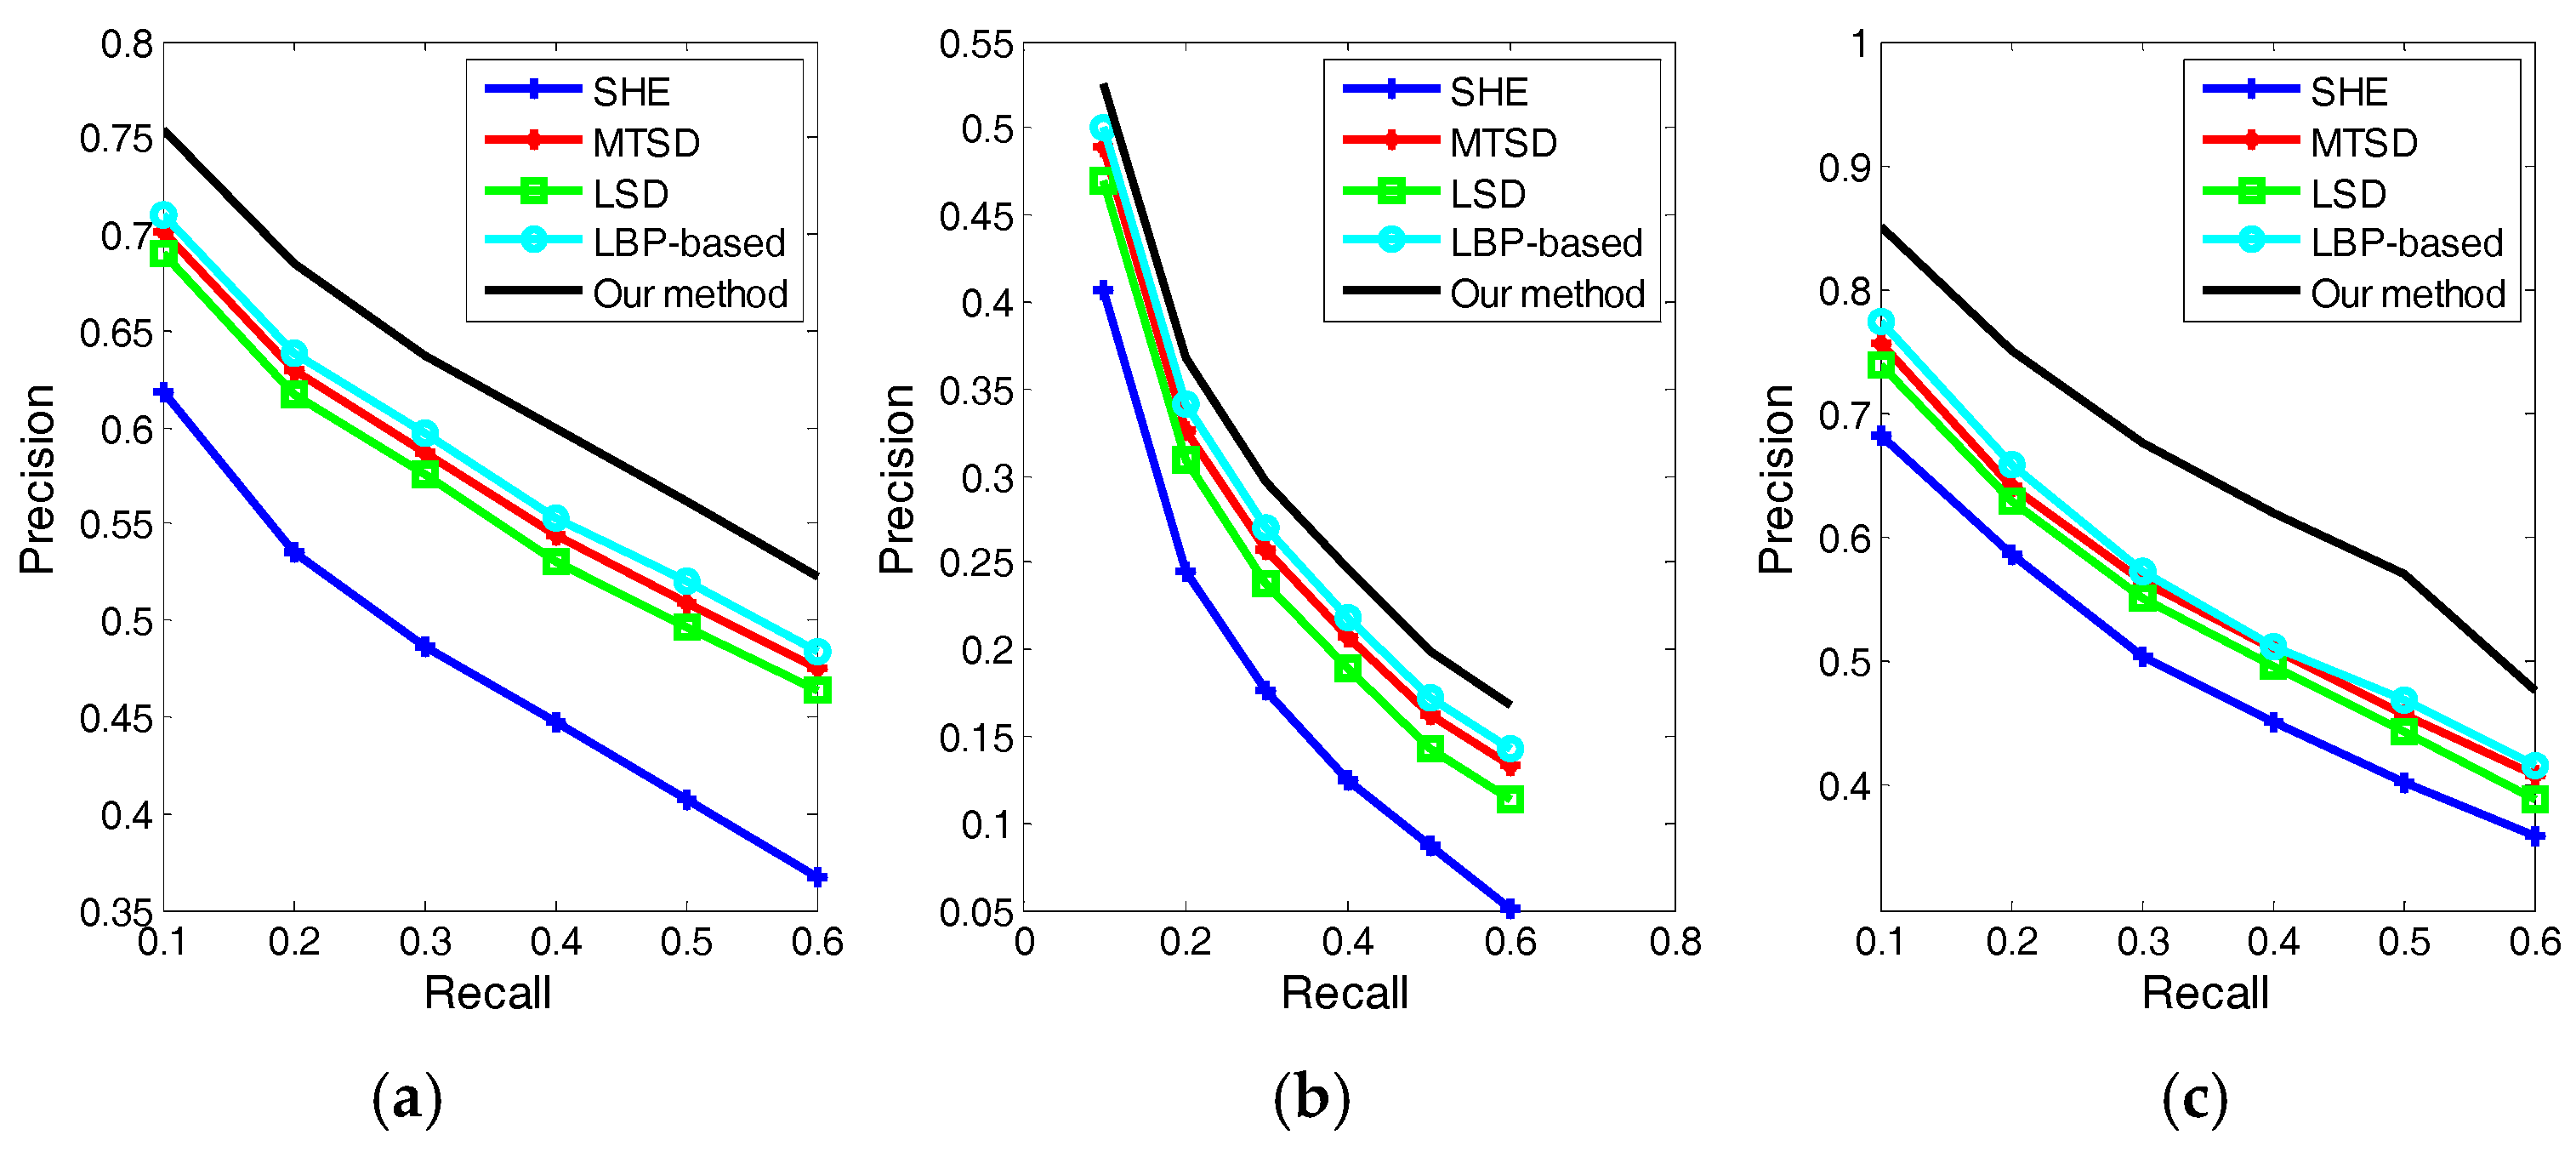
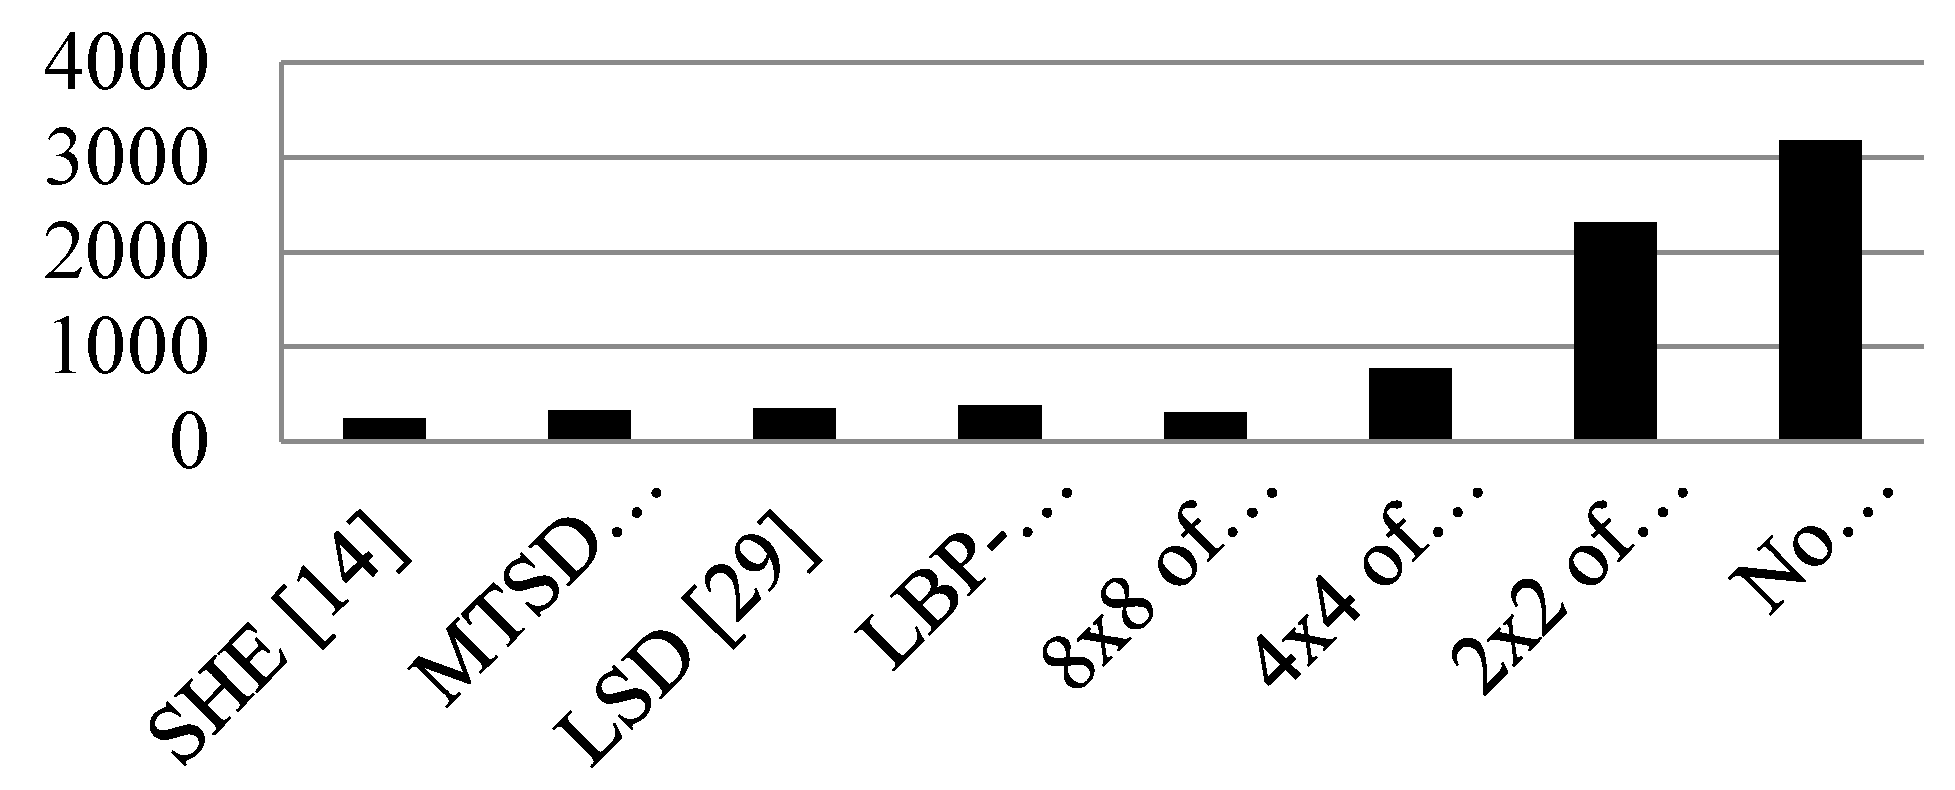
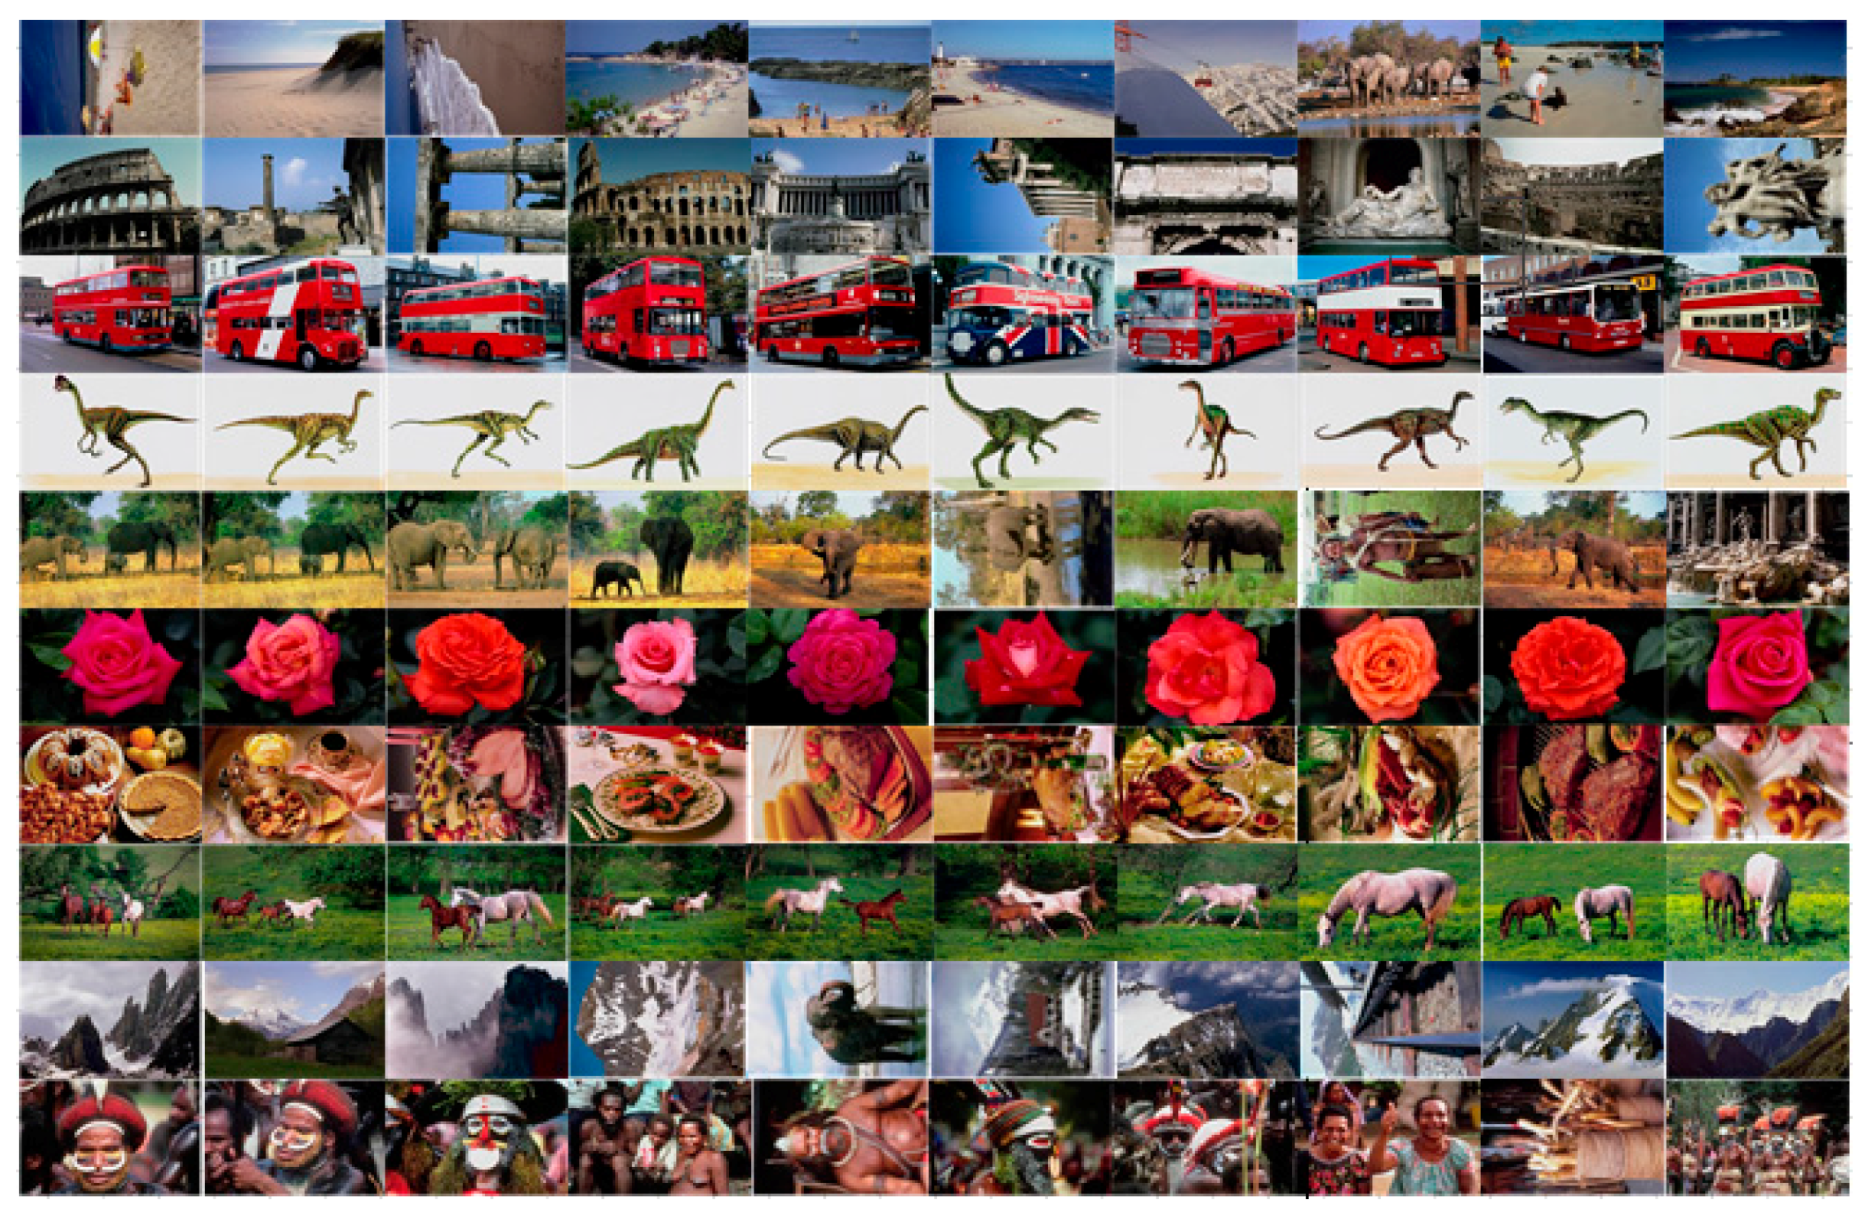
4.3. Experimental Results

Several commonly used image databases, including Corel-1k [26], Corel-10k [26], and USPTex1.0 [27], are employed in the experiment. The Corel-1k database consists of 1000 natural images grouped into 10 classes, in which each class contains 100 images. These 1000 images are clustered into several semantic categories, such as beach, building, bus, dinosaurs, elephants, flowers, horses, mountains, foods, and Africa. The Corel-10k database includes 10,000 natural images which are clustered into 100 categories such as beach, fish, sunset, bridge, airplane, etc. The USPTex1.0 database contains 2292 various textural images grouped into 191 classes and each class has 12 similar images.
A series of experimental results are offered to report the validity of the proposed methods. For every image database, all of the images in it will be taken as the query image to perform the retrieval and then compute their average precision rate when the recall rate is 10%, 20%, 30%, 40%, 50%, and 60%, successively. For the image division block in the procedure of color feature extraction, various image block sizes, such as 2 × 2, 4 × 4, 8 × 8, and the non-division situation, are taken into consideration. The parameter δ in the Equation (15) is set as δ = 10 16 . Since there are two feature vectors in the proposed methods, the similarity weighting constants in Equation (17) will be successively set to { λ 1 = 1 ,   λ 2 = 0 } , { λ 1 = 0 ,   λ 2 = 1 } , and { λ 1 = 1 ,   λ 2 = 1 } , corresponding to the situations that only color feature, only texture feature, and their combination are respectively used for retrieval. In addition, several other image retrieval algorithms proposed in recent years are used in comparison, including image structure elements’ histogram [23] (SEH), multi-trend structure descriptor [28] (MTSD), local structure descriptor [29] (LSD), and integrated LBP-based approach [30].
Table 1, Table 2 and Table 3 show the experimental results of the proposed methods on Corel-1k with { λ 1 = 1 ,   λ 2 = 0 } , { λ 1 = 0 ,   λ 2 = 1 } , and { λ 1 = 1 ,   λ 2 = 1 } , respectively. The precision-recall curves in Figure 5 present the comparison result between the several employed algorithms and our methods based on the databases Corel-1k, Corel-10k, and USPTex1.0. Furthermore, the time consumption of each algorithm on a complete retrieval procedure on Corel-1k is given in Figure 6.
From Table 1 and Table 3, we can see that the performance of block sizes of 2 × 2 and 4 × 4 are better than others and they are basically very close. However, according to Figure 6, a block size of 2 × 2 costs far much more time than 4 × 4. Therefore, overall, the 4 × 4 scheme is the best choice of the proposed methods. Additionally, with the aid of all of these experimental results, it is easy to conclude that although our scheme has higher time complexity, its retrieval accuracy is outstanding among all of these achievements, and its time complexity is acceptable.
Figure 7 presents partial retrieval examples of the proposed methods on Corel-1k with the combination of color and texture features applied in the image retrieval. The images on the first column are query images randomly drawn from each class, and the subsequent images from left to right are a set of returned images corresponding to the query image.

5. Conclusions

In this paper, we extract a group of texture elements to represent the texture content embodied in images. To integrate image color and texture information more effectively, we construct texture element histograms on every quantized HSV color layer. Experimental results illustrate the exciting effect of the color layer-based texture elements histogram (CLBTEH) in image retrieval. In addition, to further make use of the color information, a color fuzzy correlogram (CFC) is proposed to be a complementary descriptor to join up with the CLBTEH. We prove that our methods have better performance compared with several similar algorithms through very large experiments.
For further studies, the high dimension of the features in the proposed method needs to be improved. Additionally, feedback mechanisms and the popular deep learning may be employed in the future work.

Acknowledgments

This research is supported by the Scientific and Technological Research Program of Chongqing Municipal Education Commission (No. KJ130532).

Author Contributions

F.Y. proposed the feature extraction methods. M.H. designed and performed the experiments, analyzed the data, and wrote the paper.

Conflicts of Interest

The authors declare no conflict of interest.

References

  1. Swain, M.J.; Ballard, D.H. Color indexing. Int. J. Comput. Vis. 1991, 7, 11–32. [Google Scholar] [CrossRef]
  2. Huang, J.; Kumar, R.; Mitra, M.; Zhu, W.; Zabih, R. Image indexing using color correlograms. In Proceedings of the IEEE Computer Society Conference on Computer Vision and Pattern Recognition, San Juan, Puerto Rico, 17–19 June 1997; pp. 762–768.
  3. Stricker, M.; Orengo, M. Similarity of color images. In Proceedings of the SPIE Storage and Retrieval for Image and Video Databases, San Jose, CA, USA, 5 February 1995; Volume 2420, pp. 381–392.
  4. Pass, G.; Zabih, R.; Miller, J. Comparing images using color coherence vectors. In Proceedings of the fourth ACM international conference on Multimedia, Boston, MA, USA, 18–22 November 1996; pp. 65–73.
  5. Haralick, R.M. Statistical and structural approaches to texture. Proc. IEEE 1979, 67, 786–804. [Google Scholar] [CrossRef]
  6. Mao, J.; KJain, A. Texture classification and segmentation using multiresolution simultaneous autoregressive models. Pattern Recognit. 1992, 25, 173–188. [Google Scholar] [CrossRef]
  7. Manjunath, B.; Ma, W. Texture features for browsing and retrieval of image data. IEEE Trans. Pattern Anal. Mach. Intell. 1996, 18, 837–842. [Google Scholar] [CrossRef]
  8. Diaz, M.; Manian, V.; Vásquez, R. Wavelet features for color image classification. In Proceedings of the Imaging and Geospatial Information Society Annual Conference, Orlando, FL, USA, 25 April 2000.
  9. Bres, S.; Schettini, R. Detection of interest points for image indexation. In Proceedings of the International Conference on Advances in Visual Information Systems, Amsterdam, The Netherlands, 2–4 June 1999; pp. 427–435.
  10. Jain, A.K.; Zhong, Y.; Lakshmanan, S. Object matching using deformable templates. IEEE Trans. Pattern Anal. Mach. Intell. 1996, 18, 267–278. [Google Scholar] [CrossRef]
  11. Wang, X.Y.; Yang, H.Y.; Li, D.M. A new content-based image retrieval technique using color and texture information. Comput. Electr. Eng. 2013, 39, 746–761. [Google Scholar] [CrossRef]
  12. Walia, E.; Pal, A. Fusion framework for effective color image retrieval. J. Vis. Commun. Image R 2014, 25, 1335–1348. [Google Scholar] [CrossRef]
  13. Guo, J.-M.; Prasetyo, H. Content-based image retrieval using features extracted from halftoning-based block truncation coding. IEEE Trans. Image Process. 2015, 24, 1010–1024. [Google Scholar] [PubMed]
  14. Feng, L.; Wu, J.; Liu, S.; Zhang, H. Global correlation descriptor: A novel image representation for image retrieval. J. Vis. Commun. Image Represent. 2015, 33, 104–114. [Google Scholar] [CrossRef]
  15. Moghaddam, H.A.; Khajoie, T.T.; Rouhi, A.H.; Tarzjan, M.S. Wavelet correlogram: A new approach for image indexing and retrieval. Pattern Recognit. 2005, 38, 2506–2518. [Google Scholar] [CrossRef]
  16. Zhao, Q.; Tao, H. A motion observable representation using color correlogram and its applications to tracking. Comput. Vis. Image Underst. 2009, 113, 273–290. [Google Scholar] [CrossRef]
  17. Malviya, A.V.; Ladhake, S.A. Pixel based image forensic technique for copy-move forgery detection using auto color correlogram. Procedia Comput. Sci. 2016, 79, 383–390. [Google Scholar] [CrossRef]
  18. Carlucci, L. A formal system for texture languages. Pattern Recognit. 1972, 4, 53–72. [Google Scholar] [CrossRef]
  19. Lu, S.Y.; Fu, K.S. A syntactic approach to texture analysis. Comput. Graph. Image Process. 1978, 7, 303–330. [Google Scholar] [CrossRef]
  20. Liu, G.H.; Yang, J.Y. Image retrieval based on the texton co-occurrence matrix. Pattern Recognit. 2008, 41, 3521–3527. [Google Scholar] [CrossRef]
  21. Liu, G.H.; Zhang, L.; Hou, Y.K.; Li, Z.Y.; Yang, J.Y. Image retrieval based on multi-texton histogram. Pattern Recognit. 2010, 43, 2380–2389. [Google Scholar] [CrossRef]
  22. Liu, G.H.; Li, Z.Y.; Zhang, L.; Xu, Y. Image retrieval based on micro-structure descriptor. Pattern Recognit. 2011, 44, 2123–2133. [Google Scholar] [CrossRef]
  23. Wang, X.Y.; Wang, Z.Y. A novel method for image retrieval based on structure elements descriptor. J. Vis. Commun. Image Represent. 2013, 24, 63–74. [Google Scholar] [CrossRef]
  24. Liu, J.L.; Zhao, H.W.; Kong, D.G.; Chen, C.X. Image retrieval based on weighted blocks and color feature. In Proceedings of the 2011 International Conference on Mechatronic Science, Electric Engineering and Computer (MEC), Jilin, China, 19–22 August 2011; pp. 921–924.
  25. Lasmar, N.E.; Berthoumieu, Y. Gaussian copula multivariate modeling for texture image retrieval using wavelet transforms. IEEE Trans. Image Process. 2014, 23, 2246–2261. [Google Scholar] [CrossRef] [PubMed]
  26. Li, J.; James, Z.W. Automatic linguistic indexing of pictures by a statistical modeling approach. IEEE Trans. Pattern Anal. Mach. Intell. 2003, 25, 1075–1088. [Google Scholar]
  27. Backes, A.R.; Casanova, D.; Bruno, O.M. Color texture analysis based on fractal descriptors. Pattern Recognit. 2012, 45, 1984–1992. [Google Scholar] [CrossRef] [Green Version]
  28. Zhao, M.; Zhang, H.; Sun, J. A novel image retrieval method based on multi-trend structure descriptor. J. Vis. Commun. Image Represent. 2016, 38, 73–88. [Google Scholar] [CrossRef]
  29. Zeng, Z.Y. A novel local structure descriptor for color image retrieval. Information 2016, 7, 9. [Google Scholar] [CrossRef]
  30. Shrivastava, N.; Tyagi, V. An integrated approach for image retrieval using local binary pattern. Multimedia Tools Appl. 2016, 75, 6569–6583. [Google Scholar] [CrossRef]
Figure 1. The proposed texture elements.
Information 08 00027 g001
Figure 2. Example of traversing color layers with the proposed texture elements. (a) Quantized saturation in the image; (b), (c), and (d) are traversing the color layer of quantized values 0, 1, and 2, respectively.
Information 08 00027 g002
Figure 3. Determination of surrounding pixels x for a given pixel a when d is set as d = 1, d = 2, and d = 3, separately.
Information 08 00027 g003
Figure 4. Example of multi-distance color fuzzy correlogram vector computation.
Information 08 00027 g004
Figure 5. The comparison of average retrieval performance of different algorithms on different image databases: (a) Corel-1k; (b) Corel-10k; and (c) USPTex1.0.
Information 08 00027 g005
Figure 6. Time consumption of each algorithm to perform a complete retrieval procedure on Corel-1k.
Information 08 00027 g006
Figure 7. Examples of the top 10 retrieved images for each class in Corel-1k with { λ 1 = 1 ,   λ 2 = 1 } .
Information 08 00027 g007
Table 1. Retrieval precision of different block sizes on the database Corel-1k with { λ 1 = 1 ,   λ 2 = 0 } .
Different Block SizesRecall Rates
0.10.20.30.40.50.6
No block0.65050.56940.51620.47010.43120.3850
2 × 20.69220.60750.55350.50880.46550.4202
4 × 40.69120.60700.55290.51090.47080.4306
8 × 80.66100.57500.52190.47770.43800.3997
Table 2. Retrieval precision on the database Corel-1k with { λ 1 = 0 ,   λ 2 = 1 } .
Recall Rates0.10.20.30.40.50.6
Precision Rates 0.69490.63130.58910.55100.51430.4795
Table 3. Retrieval precision of different block sizes on the database Corel-1k with { λ 1 = 1 ,   λ 2 = 1 } .
Different Block SizesRecall Rates
0.10.20.30.40.50.6
No block0.74040.66830.62290.58170.54200.5041
2 × 20.75120.68340.63590.60050.56430.5250
4 × 40.75390.68480.63730.59930.56120.5228
8 × 80.74220.67260.62630.58540.54730.5084

