Article

Investigating the Statistical Distribution of Learning Coverage in MOOCs

1
Graduate School at Shenzhen, Tsinghua University, Shenzhen 518055, China
2
Department of Computer Science and Technology, Tsinghua University, Beijing 100084, China
3
School of Computing and Information Sciences, Florida International University, Miami, FL 33199, USA
4
Institute of Education, Tsinghua University, Beijing 100084, China
5
School of Education, Tianjin University, Tianjin 300350, China
*
Author to whom correspondence should be addressed.
Information 2017, 8(4), 150; https://doi.org/10.3390/info8040150
Submission received: 30 September 2017 / Revised: 17 November 2017 / Accepted: 17 November 2017 / Published: 20 November 2017
(This article belongs to the Special Issue Supporting Technologies and Enablers for Big Data)

Abstract

:
Learners participating in Massive Open Online Courses (MOOC) have a wide range of backgrounds and motivations. Many MOOC learners enroll in the courses to take a brief look; only a few go through the entire content, and even fewer are able to eventually obtain a certificate. We discovered this phenomenon after having examined 92 courses on both xuetangX and edX platforms. More specifically, we found that the learning coverage in many courses—one of the metrics used to estimate the learners’ active engagement with the online courses—observes a Zipf distribution. We apply the maximum likelihood estimation method to fit the Zipf’s law and test our hypothesis using a chi-square test. In the xuetangX dataset, the learning coverage in 53 of 76 courses fits Zipf’s law, but in all of 16 courses on the edX platform, the learning coverage rejects the Zipf’s law. The result from our study is expected to bring insight to the unique learning behavior on MOOC.

1. Introduction

The Massive Open Online Courses (MOOCs) have gained tremendous popularity since 2008 [1]. Thus far, many MOOC platforms, such as Coursera, edX, and Udacity (the three pioneer platforms), have seen tremendous growth and success, especially in recent years [2]. Around the world, many other platforms have also been developed, such as Khan Academy in North America, Miriada and Spanish MOOC in Spain, Iversity in German, FutureLearn in England, Open2Study in Australia, Fun in France, Veduca in Brazil, Schoo in Japan, and xuetangX in China [3]. Various universities, including many prestigious ones, nowadays develop and offer MOOCs on these platforms. In doing so, MOOCs have transformed education beyond the boundary of university campuses.
MOOCs have also brought unparalleled opportunities for studying learning behavior, both for online education in general and for courses on MOOC in particular, for example, how students learn and how new technologies can be incorporated to transform teaching and learning. Online learning platforms maintain rich records on the students demographics and enrollment history, as well as online activities when interacting with the learning platforms. The latter includes browsing behavior, click stream, downloads, video streaming, and so on. Being able to access this data, albeit sanitized and anonymized, provides us the opportunity to analyze learning behavior with unprecedented scale and detail. Earlier we explored this opportunity and studied Zipf’s law in MOOC learning behavior [4].
Many researchers have become interested in studying the learning behavior of MOOC participants. One of the most highlighted issues is how to measure the effectiveness of MOOCs in general, given that the student completion rate (the proportion of students obtaining MOOC certificates) is substantially less than traditional online education courses [5]. The release of data on enrollment and certification from MOOC points out a very low certification rate with an average less 15%. This problem has generated quite significant research efforts in studying the cause of low certification rates and thereby providing suggestion to improvement strategies (e.g., [6,7]). The general belief is that certification is considered as a poor indicator to measure learning. MOOCs have a large and diverse learner body with different backgrounds and with different intentions and motivations [8]. Many students engage with the courses and yet choose not to complete the assessments for credits. Consequently, the certification rate cannot be used as a reliable indicator for learning [9].
Another highlighted issue in studying learning behavior is on the difference in the engagement patterns of learners as they interact with the learning platforms. Many researchers use the data collected by the MOOC platforms to define and extract prominent features to describe different learning behaviors and use them to identify different engagement patterns (e.g., [10,11,12,13]). The focus there is to classify learners into different categories by the engagement patterns and analyze their relationship with performance attributes, student demographics, social activities, and so on.
In this paper, we focus on the statistical distribution of “learning coverage”. We define “learning coverage” as the amount of course materials accessed by the students. We found that the statistical distribution of learning coverage among students enrolled in online courses has an pronounced long-tail feature. In particular, we found that, like many types of natural and man-made events, the learning coverage in MOOCs observes the Zipf’s law and can thus be approximated with a Zipf distribution.
In our study, we analyzed two datasets from different MOOC platforms. One is provided by the xuetangX platform, containing over 40 million entries of event logs in 76 courses. The courses cover a wide range of disciplines, including mathematics, computer science, engineering, physics, chemistry, philosophy, history, business and so on. The results show that in 47 courses the students’ learning coverage in the xuetangX dataset follows a Zipf distribution with only slight differences between the courses (in the exponent parameter), which we believe can be attributed to the inherent features of specific courses, such as their level of difficulty and popularity. The other dataset is a public one from edX, containing user’s statistics in 16 courses held by Havard and MIT. In these courses, learning coverage also shows an explicit long-tail feature but doesn’t fit Zipf mathematically. The dataset and major source code can be found at: https://github.com/SophieMEN/learning_coverage_distribution.
By investigating the statistical distribution of the learning coverage, we want to answer questions like “how much do students learn from a MOOC” or “how deep do students engage with a MOOC”. We found that the distribution of the learning coverage shows a clear long-tail feature and fits the Zipf’s Law in over half courses. This results suggest that the learning coverage is quite diverse and most students only learn a little. Our study can be considered as an attempt to recognize engagement pattern in a more quantitative and statistical direction. Our study is a first of its kind in that we explore and derive the statistical distribution of students’ learning behavior by analyzing large datasets from MOOCs. We are the first to show the existence of a Zipf distribution in the student engagement patterns. Our study can yield further insight and more profound knowledge of the unique learning behaviors associated with MOOCs and thus help both MOOC developers and course providers improve the effectiveness of the learning platforms as well as the design of the courses.

2. Related Work

2.1. MOOC Learning Behavior

Multidimensional data composed of user profiles and learning activities has been made available for researchers in education and data science fields. There have been studies attempting to establish relationships between students’ background, motivation, and performance (e.g., [14,15]).
Many researchers classify students and activities according to the level of engagement with the online courses. For example, Perna et al. [16] define “starters” as those who register for a course no later than one week after its start date. Ho et al. [17] divide students into three types: “registrant” as any registered user, “participant” as a registrant who has accessed the content of a course, and “explorer” as a participant who has accessed more than half of a course’s content. Anderson et al. [12] classify users into five categories based on their accomplishment in the assignments: “viewers”, “all-rounders”, “solvers”, “collectors” and “bystanders”. Here, the collectors refer to those who primarily download lectures, while the bystanders refer to those with very low level of activities. Similarly, Kizilcec, Piech, and Schneider [10] define four types of learning patterns: “on track”, “auditing”, “behind”, and “out”. Evan et al. [13] define three types of activities: “engagement” refers to any activity such as downloading materials or watching lecture; “persistence” refers to engagement for a prolonged duration; and “completion” refers to persistence to the end of the course.
Our study is also focused on student engagement. Our definition of learning coverage is a quantitative measure of student engagement in a particular course. We discuss learning coverage in detail in Section 3.2.

2.2. Zipf’s Law

Zipf’s law builds on a fundamental premise that the occurrences of many types of natural and man-made events can be approximated with a Zipf distribution. Initially, Zipf’s law was applied in the context of language studies. It states that given some corpus of natural language utterances, the frequency of any word is inversely proportional to its rank in the frequency table. Mathmatically, this is P n 1 / n α , where P n is the frequency of a word ranked nth. This means the second word occurs approximately 1/2 as often as the first, and the third word 1/3 as often as the first, and so on. Zipf’s law reveals that while only a few words are used very often, many or most are used rarely. Thereafter, Zipf’s law has been proven applicable to similar phenomena in various areas, such as population in cities, company size, science article citations, as well as in many other natural and physical phenomena [18]. Especially on the Internet, Zipf’s Law governs many features and has strong implications on the design and function of the Internet. The connectivity of Internet routers influences the robustness of the network while the distribution in the number of email contacts affects the spread of email viruses. Even web caching strategies are formulated to account for a Zipf distribution in the number of requests for webpages [19].
A Zipf distribution can be defined more concretely as f ( r ) = C r α , where C = ( r = 1 k r α ) 1 , and  α is the exponent parameter with a positive value. In the classic version of a Zipf distribution, the exponent α is 1. If we plot the Zipf distribution, frequency versus rank, in log-log scale, the result is a line and the slope of the line is α . Because of this, most of the authors that claim the Zipf’s law patterns (e.g., [18,19,20,21,22,23]) use linear regression to examine the linearity between log ( frequency ) and log ( rank ) . The better the linearity can be shown, the closer it is to a Zipf distribution.
This procedure, however, considers the intercept as a nuisance parameter, omitting the fact that it is related to α . More precisely, the intercept should be equal to log ( C ) . Moreover, linear regression through ordinary least squares is inefficient in this case, given that r is an integer [24]. A better method to fit the Zipf’s law for empirical data is to use the maximum likelihood estimation (MLE), which has been proven effective in practice for similar distributions, such as Zipf-Mandelbrot law [25] and power law [26]. In our study, we also use MLE to estimate the exponent parameter in the Zipf distribution and check the goodness of fit by performing a chi-square test.

3. Dataset and Methods
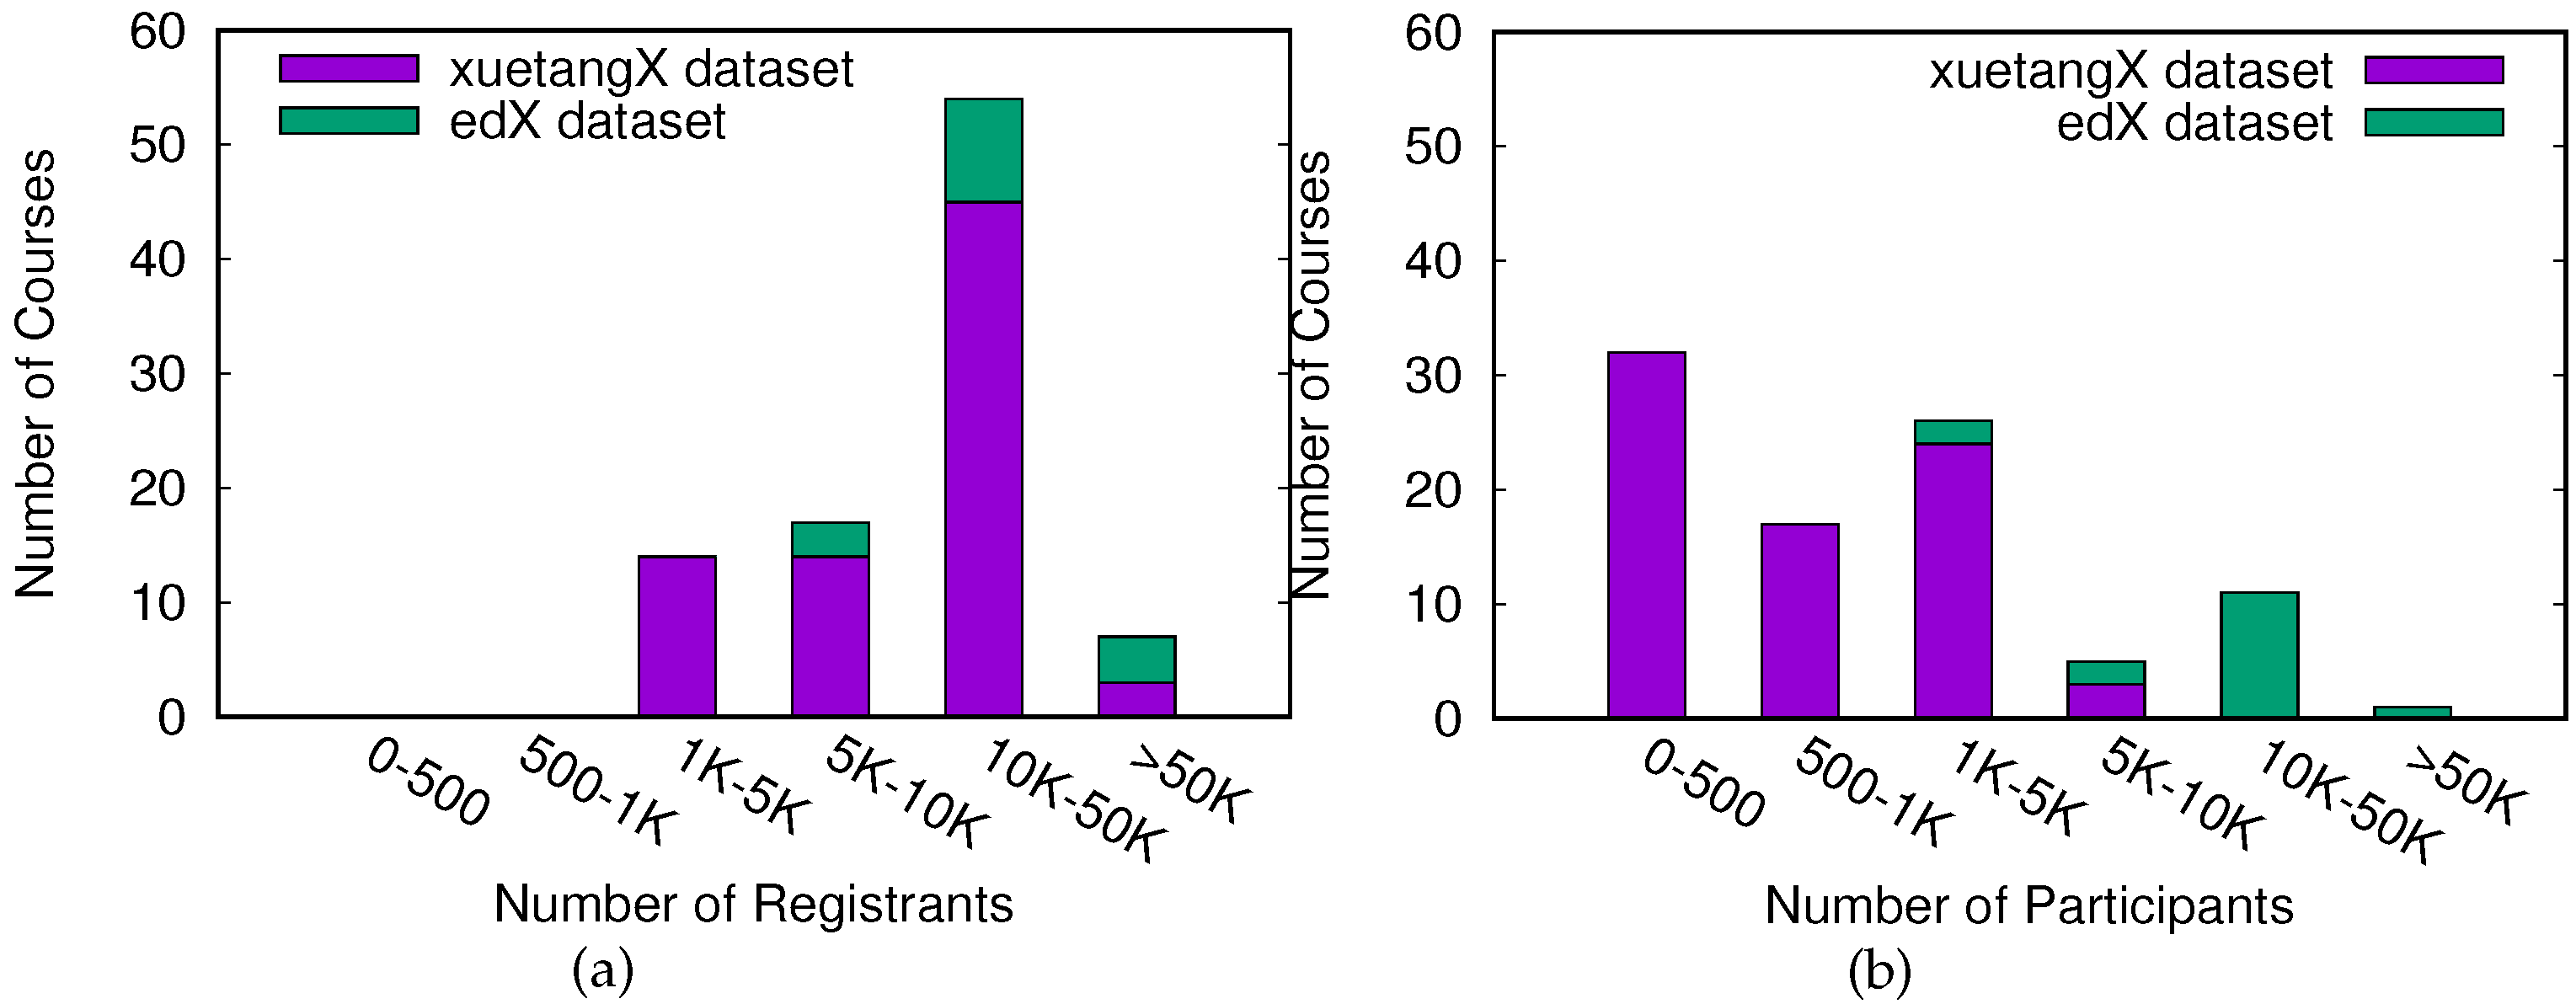
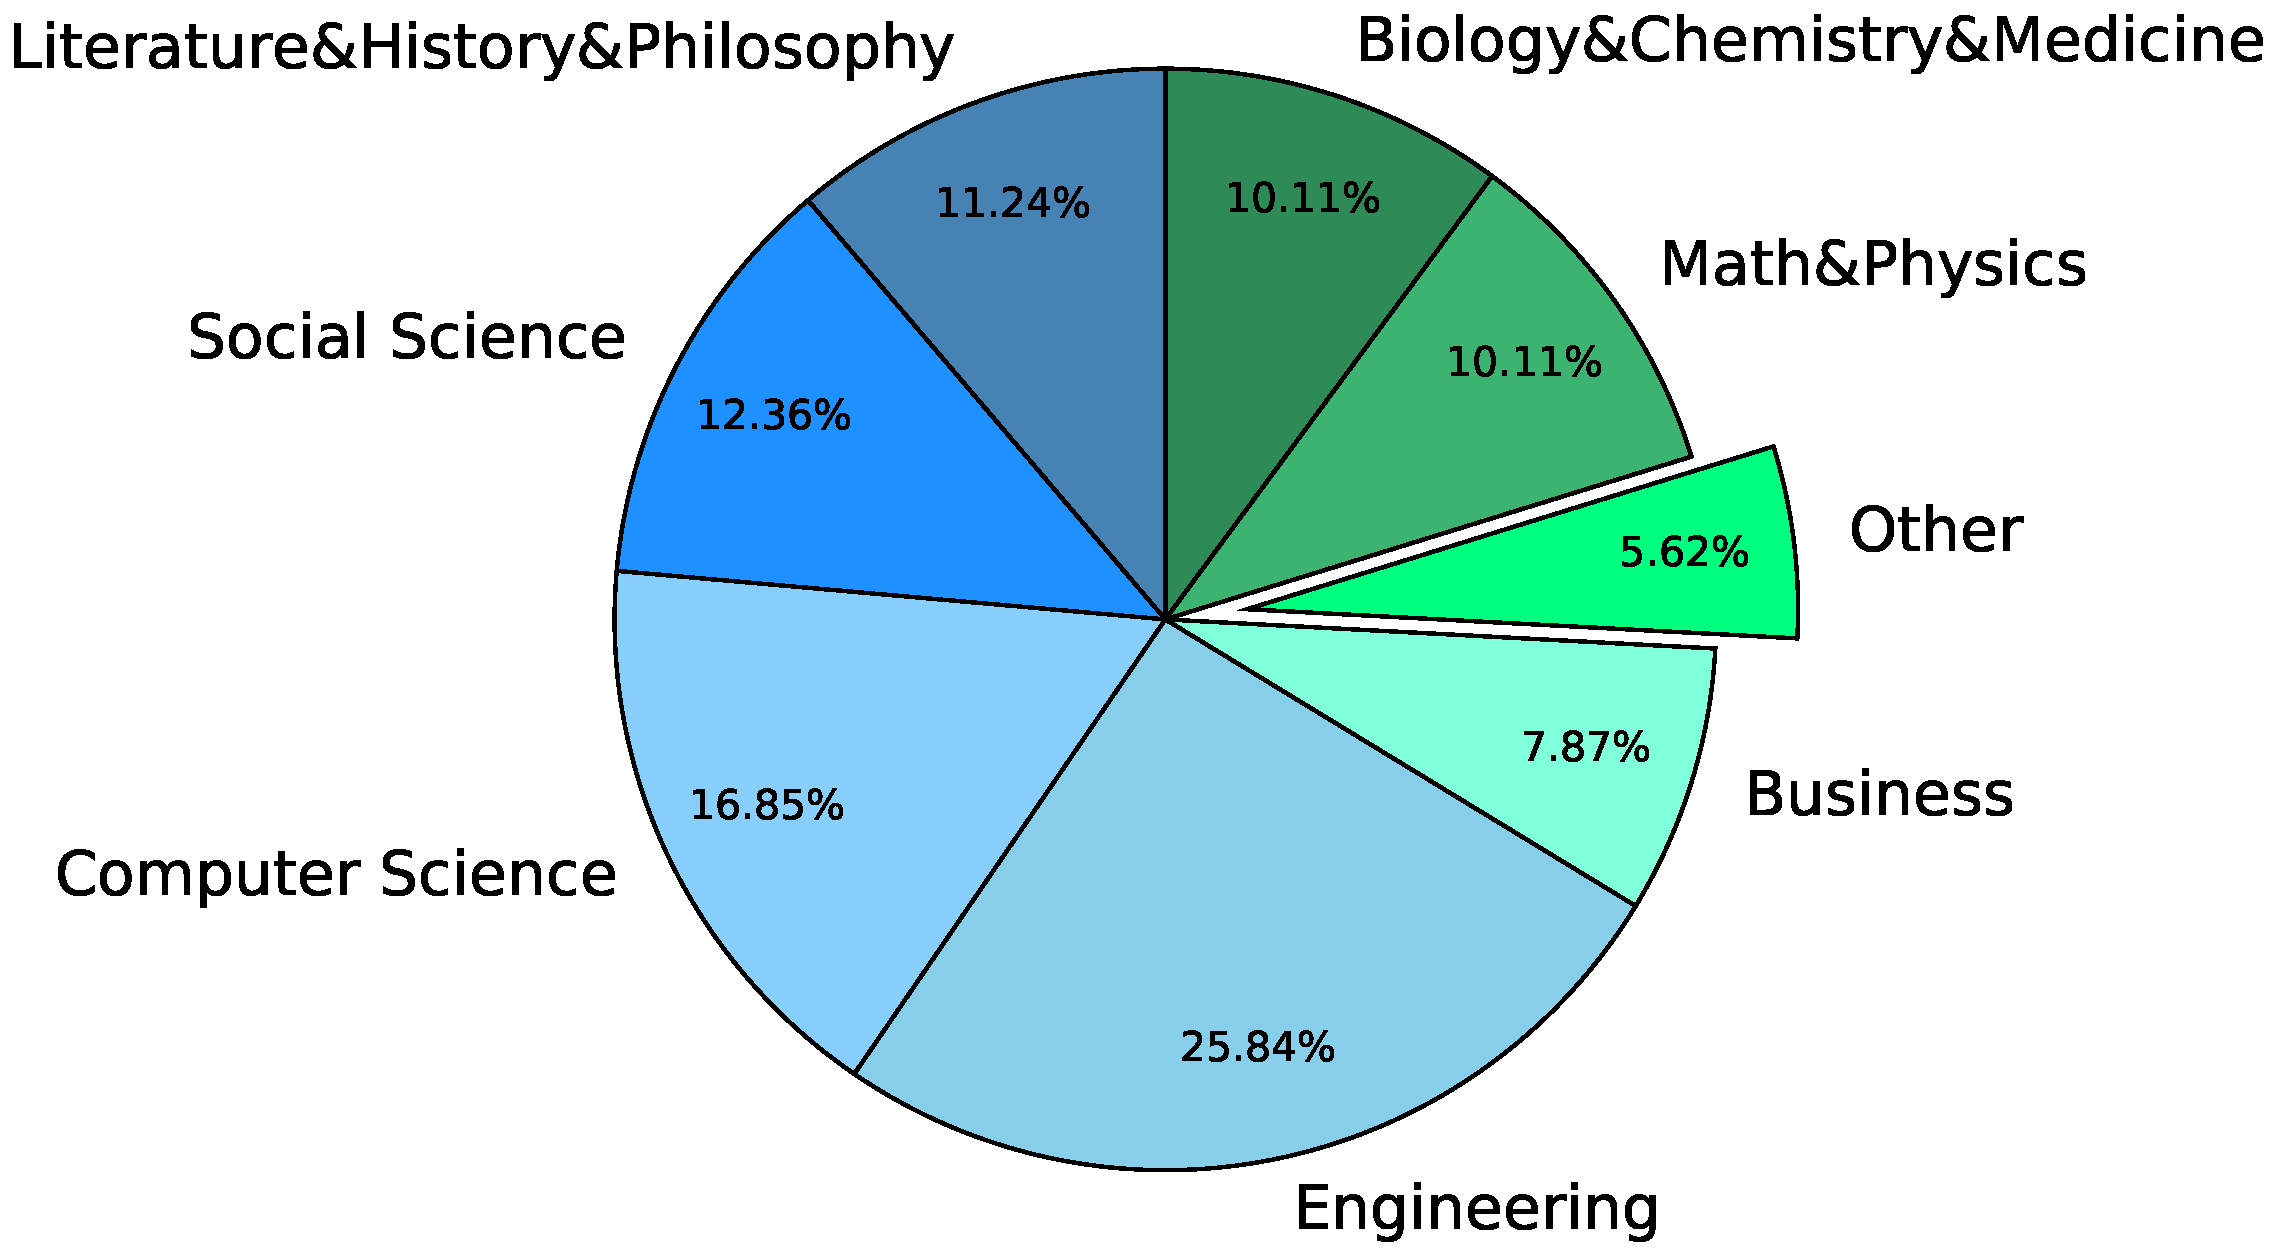
3.1. Dataset

In this study, we use two MOOCs datasets. The first dataset is provided by xuetangX (www.xuetangx.com) and contains information of 76 courses held by Tsinghua University in year 2014 and 2015. The dataset contains information on individual users and courses, as well as the event logs of all users’ online activities. The information for each course contains the course’s name, level, and subject area. Each event log entry consists of the user ID, the IP address, the course ID, the chapter ID, the section ID, the event type, the event time, and other information depending on the specific event type. There are more than 4 million event log entries in the dataset.
The second dataset is Person-Course Dataset AY2013 (http://dx.doi.org/10.7910/DVN/26147) and contains 16 courses held by MIT and Harvard on edX in year 2012 and 2013. This dataset does not have detailed event logs; however, it contains important information of each student enrolled in the courses, which includes an anonymized user ID, the course ID, the number of chapters accessed, and other statistics on the user’s activities, including the number of active days, the number of video play events, the number of posts to forums, etc.
Figure 1 respectively shows the distribution of the number of registrants and the number of participants in the courses. Here, registrants refer to the users who have been enrolled in the course and participants refer to the registrants who have accessed the course content [17]. The minimum number of registrants for all 92 courses is 1490, while the minimum number of participants is 139, both from the xuetangX dataset, whose courses are smaller in size compared to the edX dataset. Most courses in the edX dataset have over 10,000 registrants and 5000 participants. The difference between the numbers of registrants and participants indicates that many users were simply enrolled in a course but did not get to access any course materials.
Figure 2 shows the distribution of courses in various disciplines. Courses in the xuetangX dataset are already labeled as part of the course’s summary information. Courses in the edX dataset do not have such labels and we added them manually. As we can see, engineering, which is a mix of many subjects including electronic engineering, mechanical engineering, civil engineering, and so on, has the largest number of courses (25.84%).

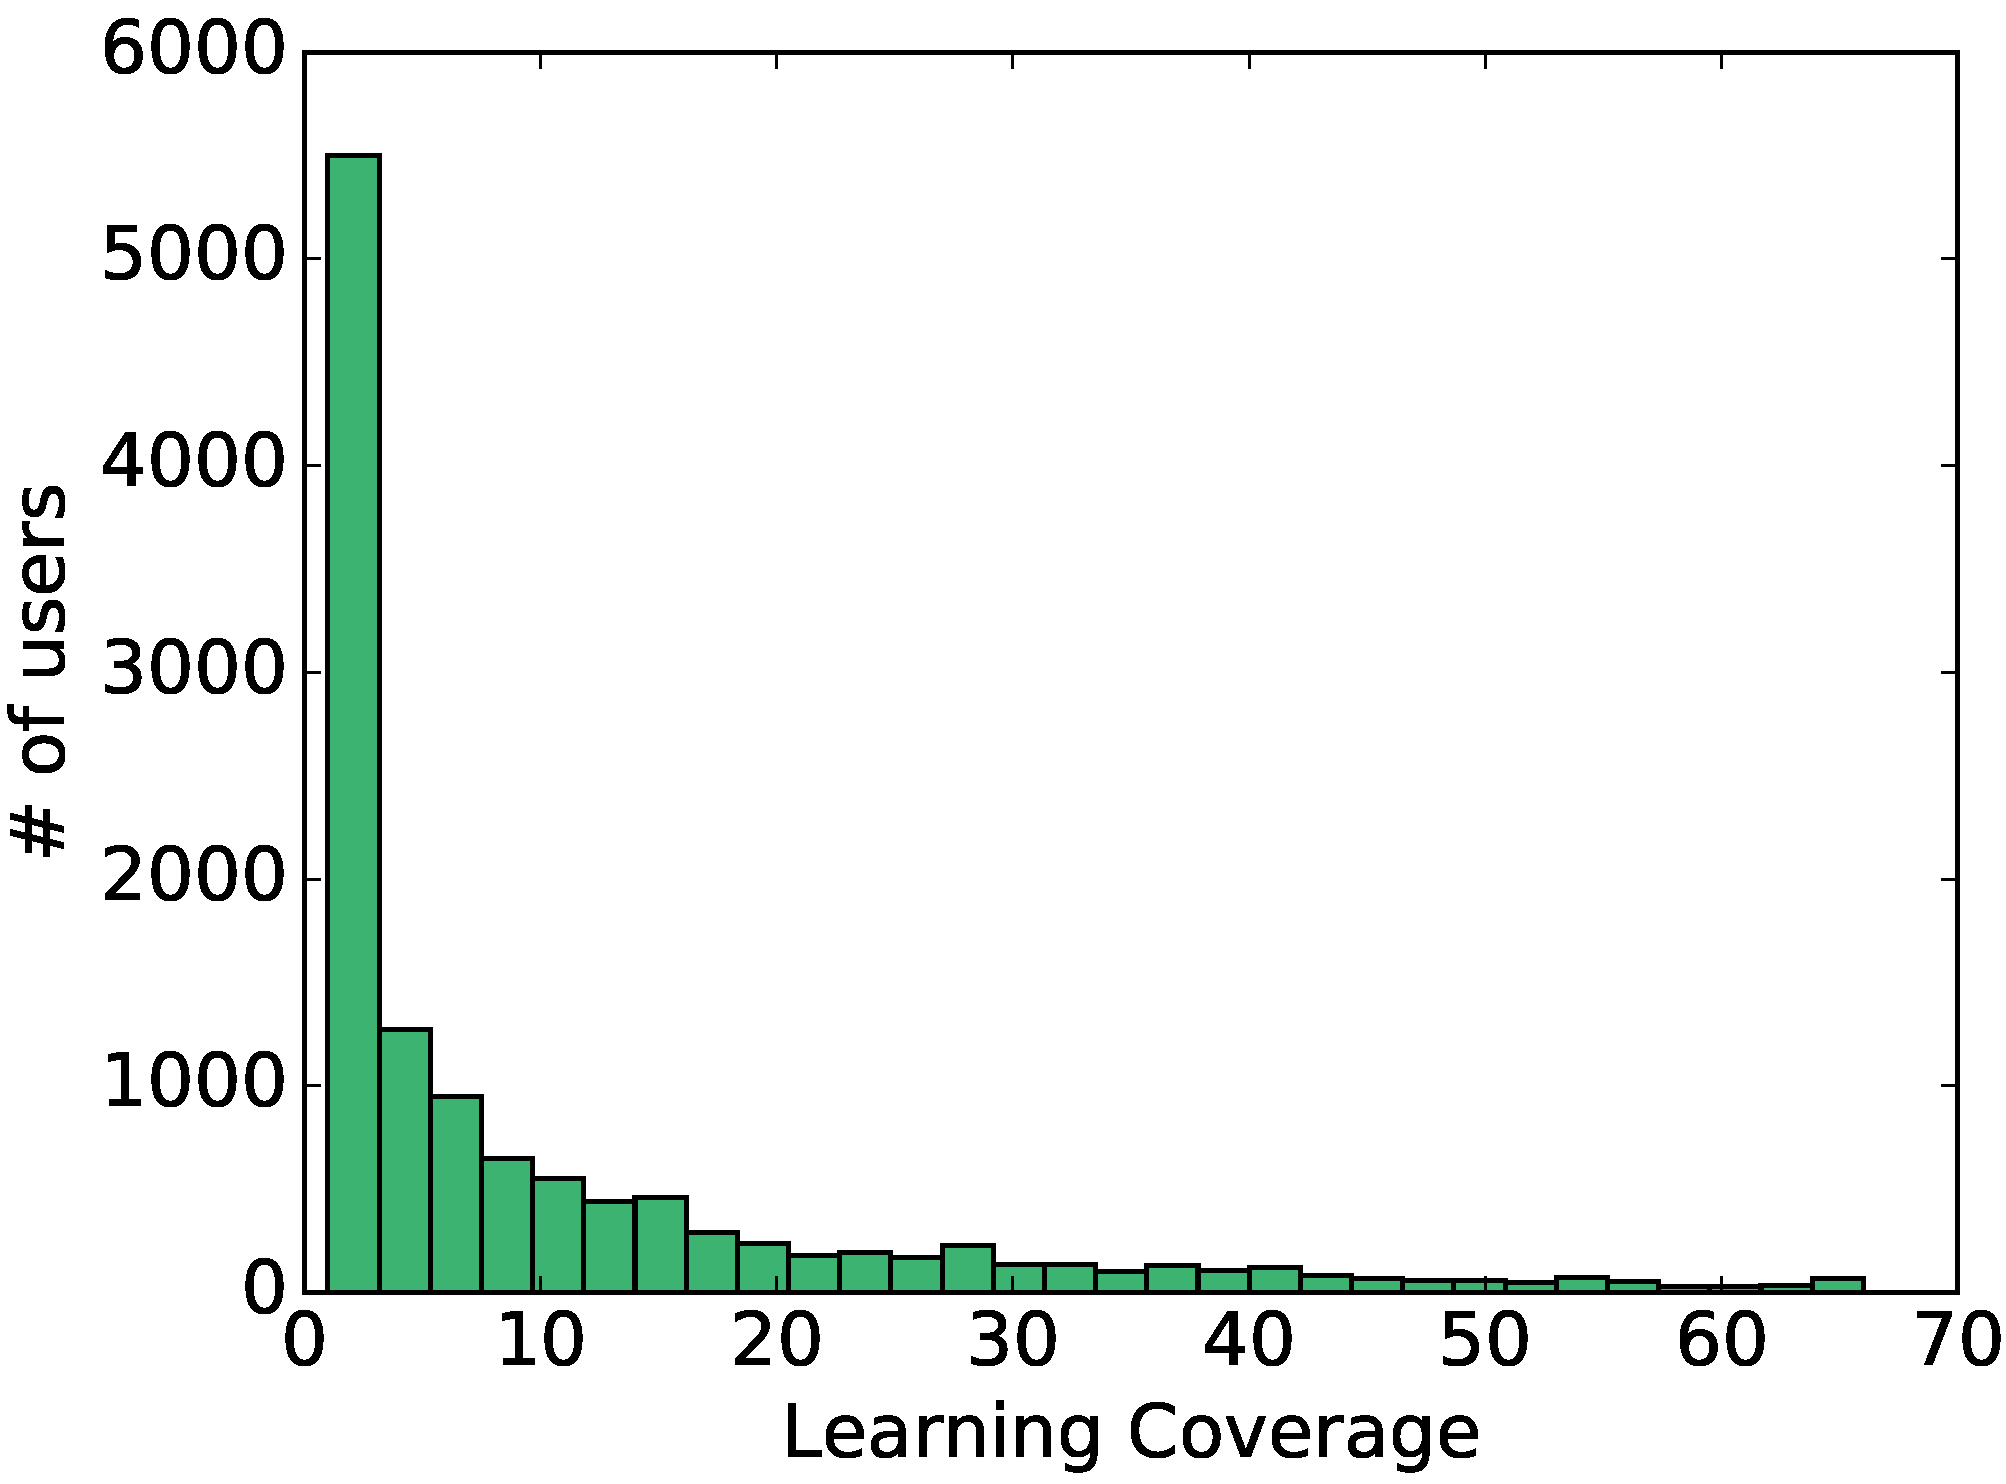
3.2. Learning Coverage

We define learning coverage as the amount of course content a learner has accessed. On MOOCs, the course content is usually organized as a multi-level tree: each course contains several chapters, a chapter contains several sections, and a section contains various materials, including texts, videos, assignments and quizzes. Conceptually, one can calculate the learning coverage at different granularities (chapter, section, or specific content within a section).
The xuetangX dataset contains event logs that record users’ online activities with the learning platform. Using the event logs we can locate the specific section for each event. This enables us to count how many sections a learner has been able to access. The edX dataset does not come with an event log, but it has the information on the the number of chapters a learner has accessed. In this case, it is sufficient to calculate the learning coverage at the chapter level, but we do not have access to more fine-grained information.
As a typical example, Figure 3 shows the histogram of learning coverage for the course, Financial Analysis and Decision Making, on xuetangX. Other courses would show similar distributions. A long-tail feature of the distribution can be speculated. In the histogram, the high “head” tells that a great amount of students learned quite little in MOOC, and the long “tail” tells that students who learn a lot have really diverse learning coverage. While paying attention to details of Figure 3, we can see that as the learning coverage increases, the number of students corresponding to the learning coverage generally decreases with some fluctuation. Using methods presented in [26], we test the learning coverage for power law. However, the null hypothesis that the learning coverage fits power law is rejected in all 92 courses. We believe that the absence of monotonicity is a major cause for the rejection.
Consequently, we test the learning coverage for the Zipf’s law, which describes the relationship between frequency and rank. We sort the frequency of each learning coverage in descending order, and then conduct linear regression to the frequency versus the rank in log-log scale as a pre-experiment. The results show that the learning coverage fits well with the Zipf distribution consistently. Figure 4 shows the scatter plots of the frequency versus the ranking of the learning coverage in log-log scale for six courses from different disciplines. The curves fit well with a straight line. Other courses produce similar plots.
The coefficient for the linear regression on frequency versus rank in log-log scale is the negative of the exponent parameter α in Zipf’s Law. The distribution of α is shown in Figure 5a, for the xuetangX courses and the edX courses, respectively. Overall, α ranges from 1.0018 to 2.2503. In fact, there are only three courses with α bigger than 2.0.
Figure 5b shows the R-squared values for the two sets of courses. For all 92 courses, R-squared values range from 0.6780 to 0.9893. Only five courses, three from the xuetangX dataset and two from the edX dataset, get a value lower than 0.9. For the other 87 courses, the R-squared value is larger than 90 % , indicating a high goodness-of-fit. The result is encouraging that we decide to use the maximum likelihood method for a more effective and accurate estimation of the Zipf’s law.

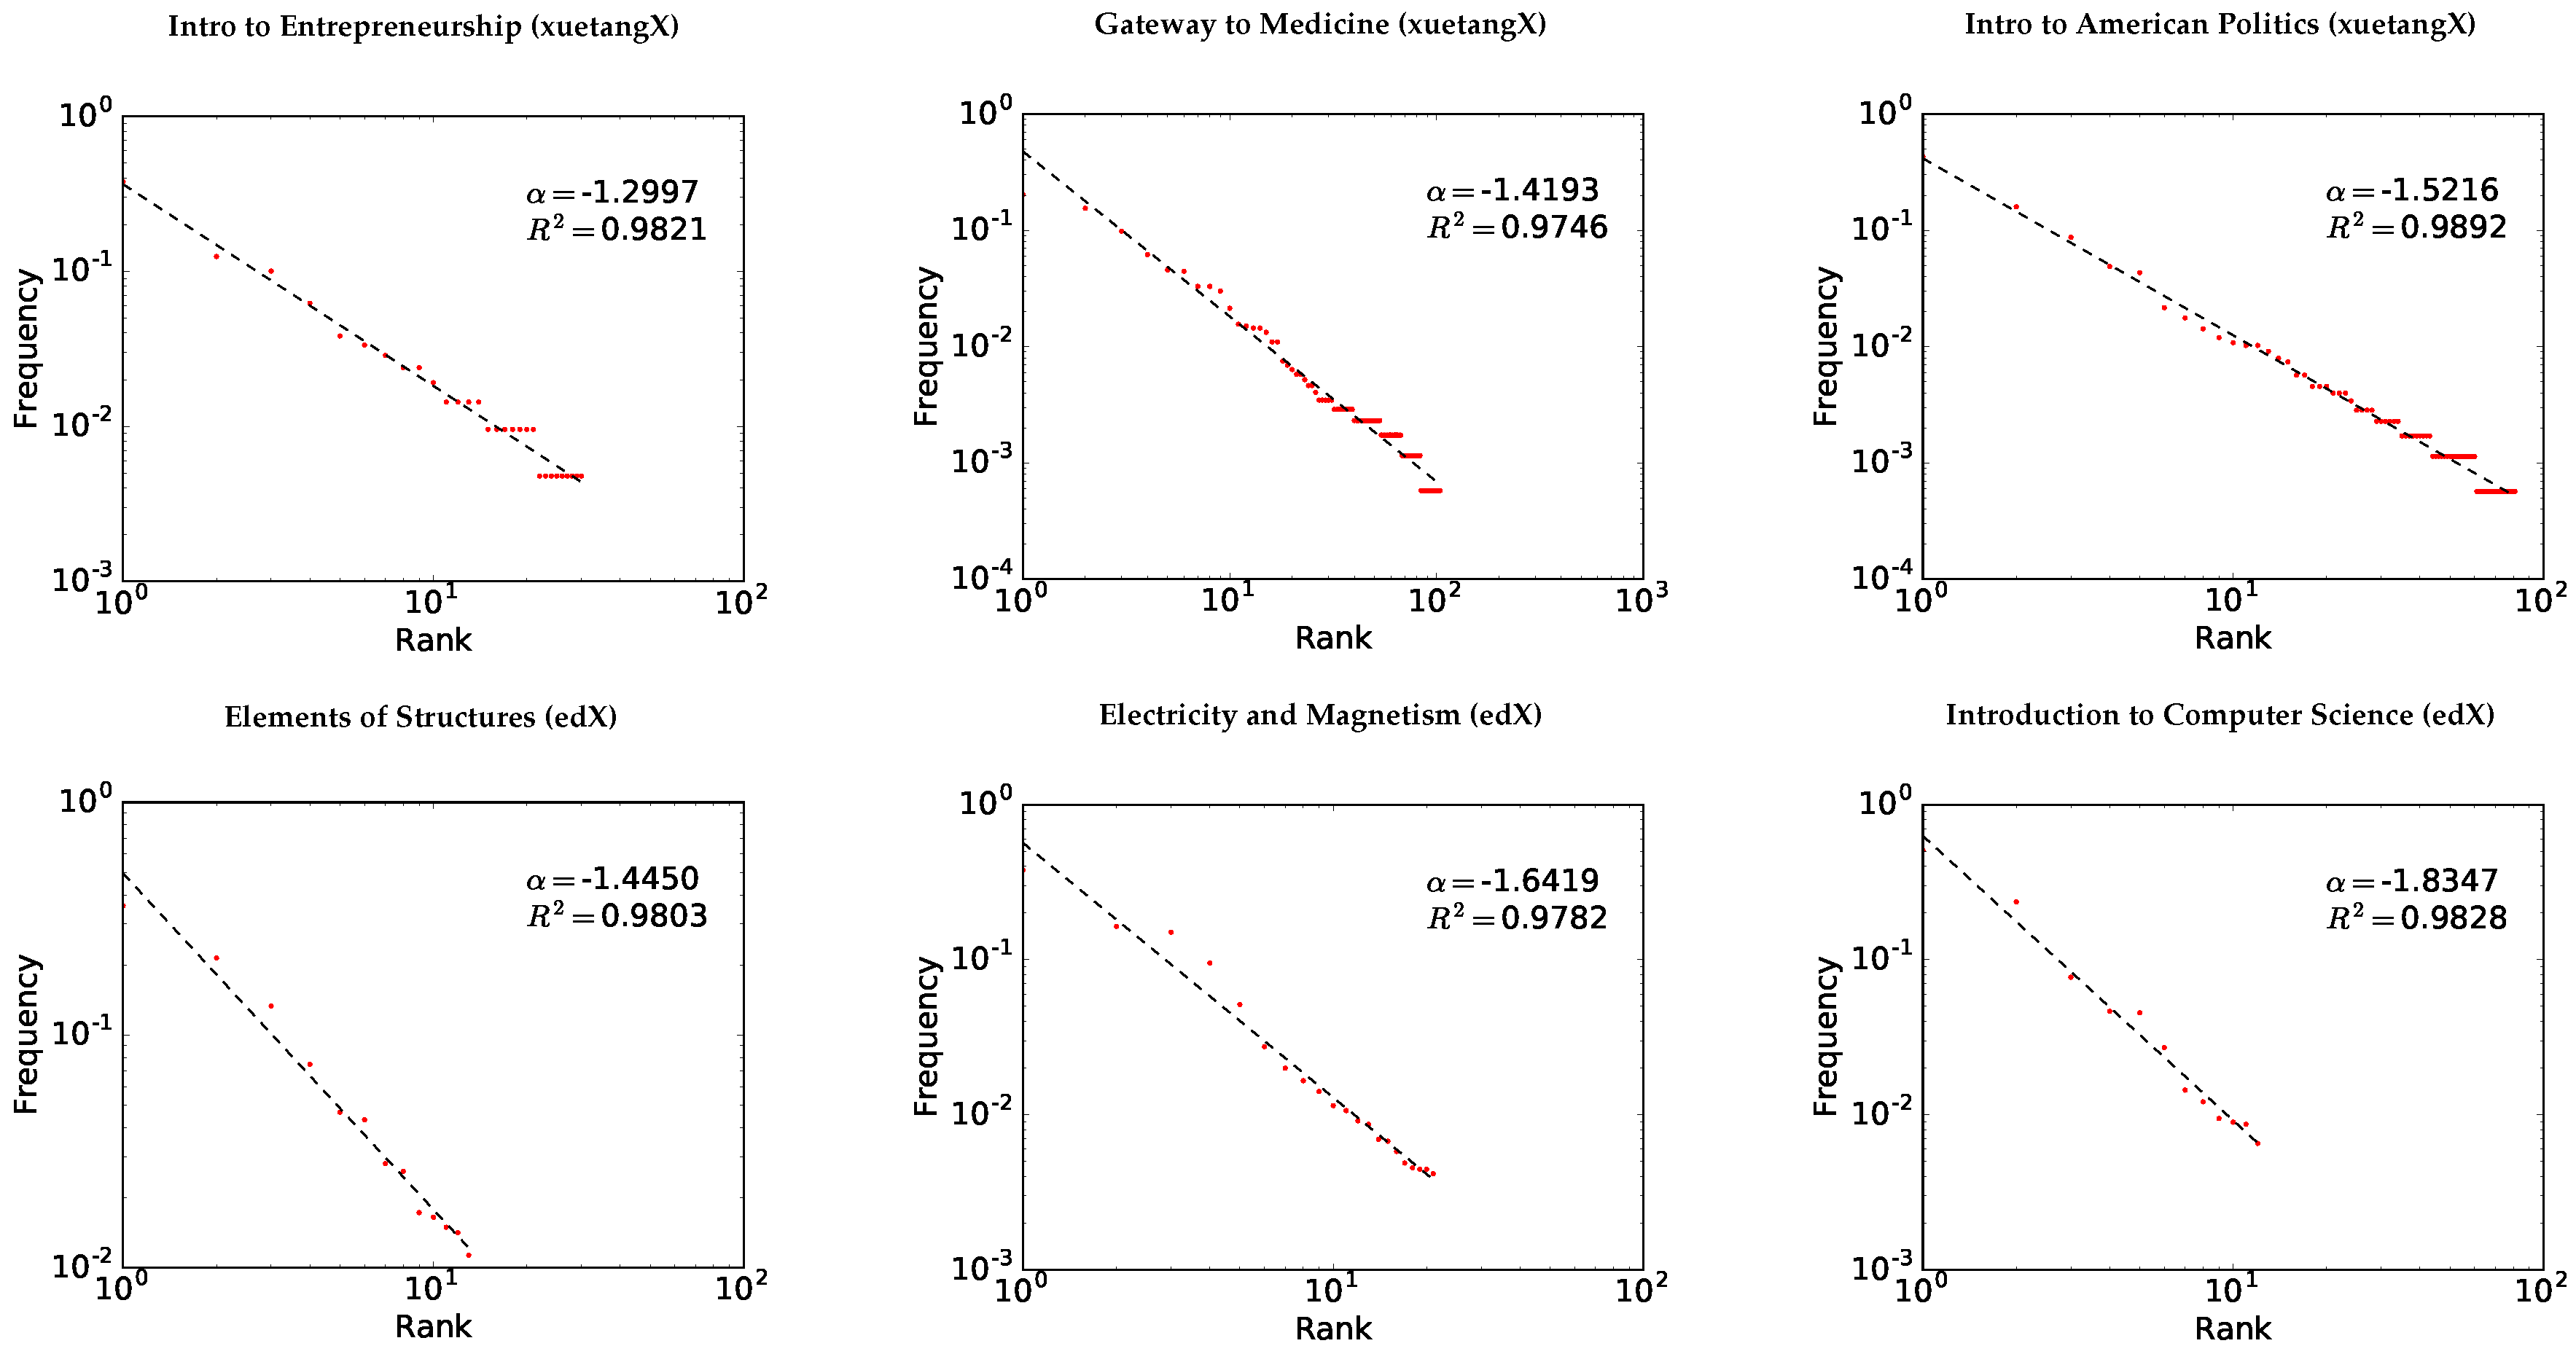
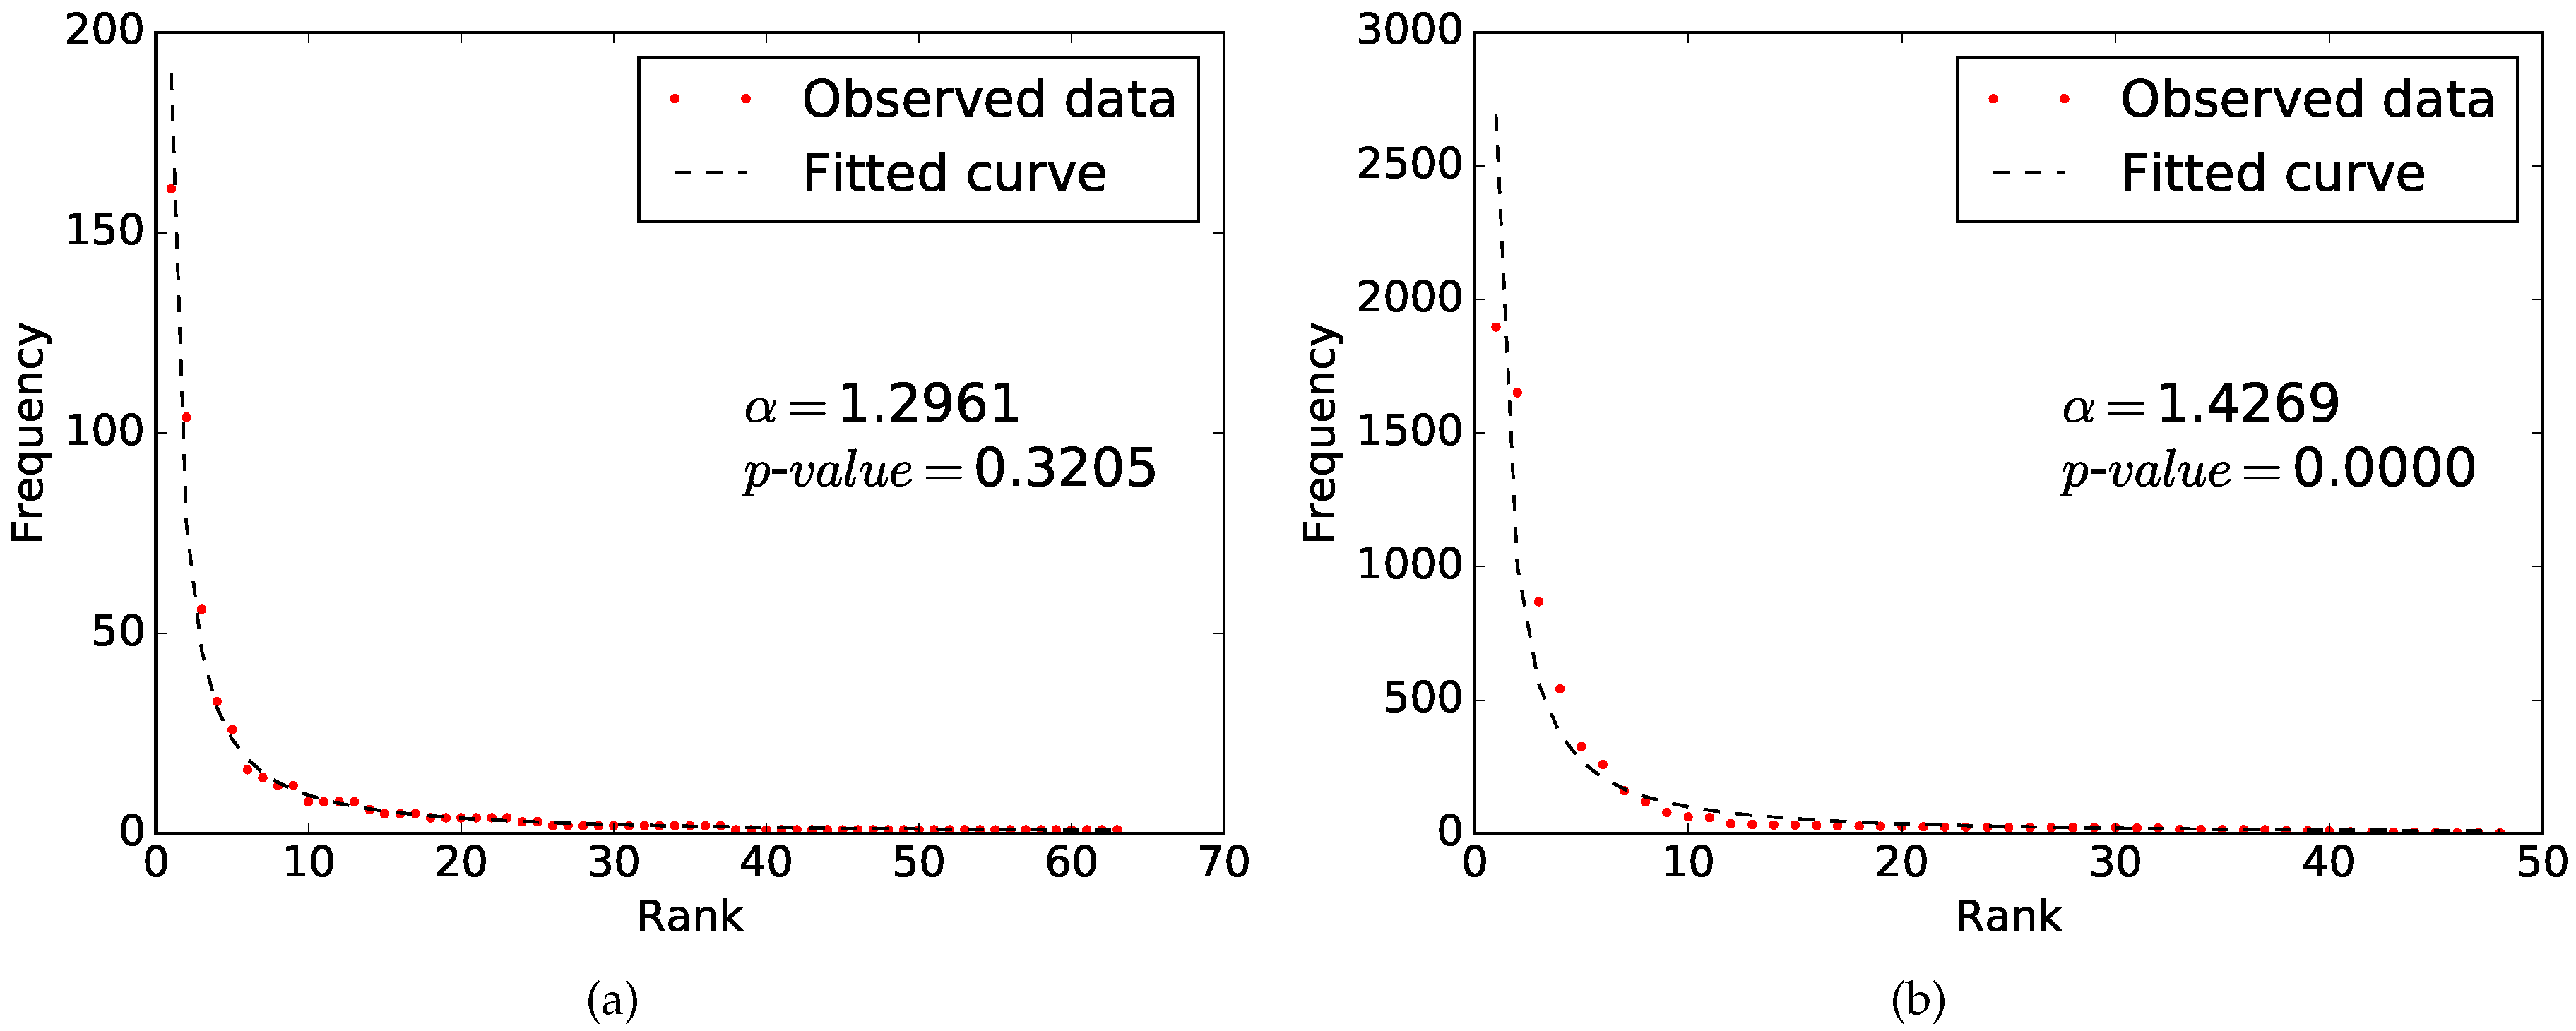
3.3. Fitting Zipf’s Law

Formally, a random variable X is Zipf distributed with parameter α ( X Zipf α ), if for a given α R ,
p α , r = P ( X = x r ) = C r α , r { 1 , 2 , , k } ,
where x r is the rth frequent element, and C is the normalization factor: C = ( r = 1 k r α ) 1 .
Consider the observed sample x = ( n 1 , n 2 , , n k ) from a course, with n i being the frequency of the ith learning coverage. n 1 n 2 n k . Let n = i = 1 k n i . We obtain the likelihood function for sample x as follows:
l α ( x ) = n ! n 1 ! n 2 ! n k ! i = 1 k ( p α , i ) n i ,
which gives the probability of the observed sample supposedly from a Zipf distribution with parameter  α .
The method of MLE estimates α by finding a value of α that maximizes l α ( x ) . For ease of calculation, we maximize log-likelihood function, which is
ln ( l α ( x ) ) = n ln ( i = 1 k i α ) i = 1 k α n i ln ( i ) + i = 1 n ln ( i ) i = 1 k j = 1 n i ln ( j ) .
the gradient with respect to α of log-likelihood function is:
ln ( l α ( x ) ) α = i = 1 k n i ln ( i ) + n ( i = 1 k i α ) 1 i = 1 k i α ln ( i ) .
We can use gradient descent to obtain the optimal parameter, α ^ , which maximizes the log-likelihood function.

3.4. Goodness-of-fit Test

The method described above allows us to fit a Zipf distribution to a given data set and provide an estimate of α ^ . Now we need to determine whether the sample data are consistent with the hypothesized distribution, in this case, a Zipf distribution with the parameter α ^ . For this, we use the chi-square goodness-of-fit test [27]. The null hypothesis for the test is as follows:
H 0 : The data of learning coverage is consistent
with a Zipf distribution with parameter α ^ .
We calculate chi-square statistic as:
χ 2 = i = 1 k ( n i n p α ^ , i ) 2 n p α ^ , i .
We can get a p-value with k 1 degree of freedom. The p-value is the probability that a chi-square statistic is more extreme than the calculated value (from Equation (5)). We set the significance level to be 0.01. That is, if p-value < 0.01 , we reject the null hypothesis that the data of learning coverage is Zipf distributed with the parameter α ^ ; otherwise, the null hypothesis is not rejected.

4. Results

We calculate the maximum likelihood estimation of α based on the log-likelihood function (Equation (3)) and its gradient (Equation (4)). For finding the optimal value of α that maximizes log-likelihood function, we use the MATLAB built-in function, called fminunc, as the optimization solver with the initial α set to be 1.5. After obtaining α ^ , we conduct a chi-square test to determine whether the observed data fit with the Zipf’s law. The procedure above is conducted for all 92 courses.
The results of α ^ and p-value for two datasets are respectively summarized in Table 1. In the xuetangX dataset, α ^ ranges from 0.8915 to 1.9751; While in the edX dataset, α ^ ranges from 1.2352 to 1.6860, which has a significantly higher minimum. Figure 6 shows the results of parameter estimation together with the observed data in two courses whose α ^ is close to the mean of the respective dataset.
In xuetangX dataset, the learning coverage of 47 courses is likely to fit with the Zipf’s law, which accounts for 61.84%. The results also show that over 25% of the courses have a p-value approximate to zero, leading to a definite rejection of the null hypothesis. Figure 7 compares the difference in the number of participants between the courses fitting a Zipf distribution and those not. We observe that the courses with more than 3000 participants all reject the Zipf’s law. On the other hand, most courses with less than 1000 participants are likely to fit with the Zipf’s law. We have attempted to focus on other differences (e.g., disciplines, semesters) between the courses that report different conclusions, but so far no meaningful conclusions have been found. In the edX dataset, the null hypothesis is rejected in all 16 courses. This means that even though the learning coverage in the courses looks like Zipf, it does not necessarily fit Zipf mathematically. This may be caused by the large number of samples in these courses, just like what we have observed from the rejected courses in the xuetangX dataset. A previous study that uses a similar method for testing the Zipf-Mandelbrot model [25] claimed that the size of dataset should not be larger than 3000 for the maximum likelihood method. The rejection of the null hypothesis may be caused by the limitation of the method. Another possible reason of no acceptance is relatively lower degree of freedom. In the edX dataset, we calculate the learning coverage at the chapter level due to the limitations in the data granularity, so the learning coverage has shallower range compared to those calculated at the section level. Shallower range of the learning coverage means k is smaller, which directly leads to a lower degree of freedom in the chi-square test (referring to Section 3.4).
The learning coverage is intrinsically related to how students perceive and carry on with the courses. In particular, the exponent parameter α can be regarded as an indicator of the student retention in the course. Higher α means that more students are either dropping out from the course early or simply taking in less content overall. That is, students are less engaged with an online course with a higher α than that of a lower α . It would be interesting to correlate this α parameter with course’s content quality and alternative teaching methods (for example, more forum activities) to evaluate potential improvements in student retention. We leave the investigation for future work.

5. Discussion

In this study, inspired by preliminary data analysis, we investigated the statistical distribution of the learning coverage and tried to identify the existence of the Zipf’s Law. A long-tail feature has been observed clearly across 92 courses on two MOOC platforms and in 61.84% courses on the xuetangX platform the learning coverage fits the Zipf’s Law mathematically. The results show that a great portion of students only learn a little. The statistical distribution can be considered as characteristic of engagement pattern, which is a general feature of students population that one needs take into consideration while designing and running MOOCs.
Our study can be improved in several ways. First, further work is needed to examine whether section-level learning coverage fits Zipf’s law in courses on other MOOC platforms and learning context. This requires fine-grained data. Second, we also need to explore current fitting and goodness-of-fit test methods and study the limitation of the methods. Then we can be more cerntain whether the rejection is indeed caused by the defect of method. Third, we define learning coverage as the amount of content a learner has accessed, which can be sometimes misleading because accessing content does not equal to learning. To be more rigorous, we can set a threshold in terms of the number of events, which means that we can define the learning coverage as the amount of content a learner has accessed more than a certain number of times. Some MOOC platforms organize learning materials with a requirement that a learner must complete certain sections before moving to the next ones. In these MOOC platforms we can assume that the learning coverage can be defined more precisely.
More in-depth studies on discovering knowledge behind the data are warranted. Not only will they provide us with methods for evaluating the effectiveness of learning on MOOCs, but also they will provide the educators and MOOC providers with the basis for further improving the teaching methods and the learning platforms. In future work, we would like to investigate other methods that can capture the learning behavior of the students in more aspects, and therefore more accurately represent the overall learning behavior of the students.

6. Conclusions

To measure learner engagement in MOOCs, we introduce a new metric, called the learning coverage, to estimate the amount of course content (the number of sections or the number of chapters) accessed by the learners. It is a measure on how far a learner has advanced into the course. By analyzing the datasets provided by the MOOC platforms, xuetangX and edX, we calculate the learning coverage for 92 courses of various disciplines either at the section level or at the chapter level. We discover that the learning coverage distribution observes a clear long-tail feature and shows good linearity in double log plot. To confirm the observation, we apply the MLE method to fit the Zipf’s law and conduct the chi-square goodness-of-fit test. The exponent parameter for the Zipf distribution can be used as an inherent feature of the course, representing in some degree the student retention in the course, and therefore a reflection of the course’s difficulty and popularity. The results show that the learning coverage is likely to fit with a Zipf distribution mathematically in 61.84% courses on the xuetangX platform, but in no course on the edX platform. Rejection in all edX courses may be caused by the limitation of the MLE method or the relatively small degree of freedom in the chi-square test. The prevalent existence of Zipf’s Law in the learning coverage can be considered as an engagement pattern, a general feature of students population to be taken into account when designing and running MOOCs.

Acknowledgments

This research is supported in part by MOE research center for online education foundation (No. 2016ZD302), the National Key Research and Development Program of China (Nos. 2016YFB1000602, 2017YFB0701501), National Natural Science Foundation of China (Nos. 61440057, 61272087, 61363019, 61073008 and 11690023), and Shenzhen Science and Technology Project (Nos. JCYJ 20151117173236192 and CXZZ 20140902110505864).

Author Contributions

Xiu Li designed the framework of research and experiment. Chang Men processed the data and performed the experiment. Zhihui Du and Jason Liu contributed analysis and discussion. Manli Li and Xiaolei Zhang offered background knowledge and part of literature review.

Conflicts of Interest

The authors declare no conflict of interest.

References

  1. Liyanagunawardena, T.R.; Adams, A.A.; Williams, S.A. MOOCs: A systematic study of the published literature 2008-2012. Int. Rev. Res. Open Distrib. Learning 2013, 14, 202–227. [Google Scholar] [CrossRef]
  2. Seaton, D.T.; Bergner, Y.; Chuang, I.; Mitros, P.; Pritchard, D.E. Who does what in a massive open online course? Commun. ACM 2014, 57, 58–65. [Google Scholar] [CrossRef]
  3. Qiu, J.; Tang, J.; Liu, T.X.; Gong, J.; Zhang, C.; Zhang, Q.; Xue, Y. Modeling and predicting learning behavior in MOOCs. In Proceedings of the 9th ACM International Conference on Web Search and Data Mining, San Francisco, CA, USA, 22–25 February 2016; pp. 93–102. [Google Scholar]
  4. Men, C.; Li, X.; Du, Z.; Liu, J.; Li, M.; Zhang, X. Zipf’s Law in MOOC Learning Behavior. In Proceedings of the 2017 IEEE 2nd International Conference on Big Data Analysis (ICBDA), Beijing, China, 10–12 March 2017. [Google Scholar]
  5. Saadatdoost, R.; Sim, A.T.H.; Jafarkarimi, H.; Mei Hee, J. Exploring MOOC from education and Information Systems perspectives: A short literature review. Educ. Rev. 2015, 67, 505–518. [Google Scholar] [CrossRef]
  6. Khalil, H.; Ebner, M. MOOCs completion rates and possible methods to improve retention—A literature review. In Proceedings of the World Conference on Educational Multimedia, Hypermedia and Telecommunications, Tampere, Finland, 23–27 June 2014; Number 1. pp. 1305–1313. [Google Scholar]
  7. Gaebel, M. MOOCs: Massive Open Online Courses; EUA: Brussels, Belgium, 2014. [Google Scholar]
  8. Breslow, L.; Pritchard, D.E.; DeBoer, J.; Stump, G.S.; Ho, A.D.; Seaton, D.T. Studying learning in the worldwide classroom: Research into edX’s first MOOC. Res. Pract. Assess. 2013, 8, 13–25. [Google Scholar]
  9. Ho, A.D.; Reich, J.; Nesterko, S.O.; Seaton, D.T.; Mullaney, T.; Waldo, J.; Chuang, I. HarvardX and MITx: The first year of open online courses, fall 2012-summer 2013. In Ho, AD, Reich, J., Nesterko, S., Seaton, DT, Mullaney, T., Waldo, J., & Chuang, I. (2014). HarvardX and MITx: The first year of open online courses (HarvardX and MITx Working Paper No. 1); MIT Office of Digital Learning; HarvardX Research Committee: Cambridge, MA, USA, 2014. [Google Scholar]
  10. Kizilcec, R.F.; Piech, C.; Schneider, E. Deconstructing disengagement: analyzing learner subpopulations in massive open online courses. In Proceedings of the 3rd International Conference on Learning Analytics and Knowledge, Leuven, Belgium, 8–12 April 2013; pp. 170–179. [Google Scholar]
  11. Phan, T.; McNeil, S.G.; Robin, B.R. Students’ patterns of engagement and course performance in a Massive Open Online Course. Comput. Educ. 2016, 95, 36–44. [Google Scholar] [CrossRef]
  12. Anderson, A.; Huttenlocher, D.; Kleinberg, J.; Leskovec, J. Engaging with Massive Online Courses. In Proceedings of the 23rd International Conference on World Wide Web, Seoul, Korea, 7–11 April 2014; pp. 687–698. [Google Scholar]
  13. Evans, B.J.; Baker, R.B.; Dee, T.S. Persistence patterns in Massive Open Online Courses (MOOCs). J. Higher Educ. 2016, 87, 206–242. [Google Scholar] [CrossRef]
  14. Liu, M.; Kang, J.; Mckelroy, E. Examining learners’ perspective of taking a MOOC: reasons, excitement, and perception of usefulness. Educ. Media Int. 2015, 52, 129–146. [Google Scholar] [CrossRef]
  15. Hood, N.; Littlejohn, A.; Milligan, C. Context counts: How learners’ contexts influence learning in a MOOC. Comput. Educ. 2015, 91, 83–91. [Google Scholar] [CrossRef]
  16. Perna, L.W.; Ruby, A.; Boruch, R.F.; Wang, N.; Scull, J.; Ahmad, S.; Evans, C. Moving through MOOCs: understanding the progression of users in Massive Open Online Courses. Educ. Res. 2014, 43, 421–423. [Google Scholar] [CrossRef]
  17. Ho, A.D.; Chuang, I.; Reich, J.; Coleman, C.A.; Whitehill, J.; Northcutt, C.G.; Williams, J.J.; Hansen, J.D.; Lopez, G.; Petersen, R. Harvardx and MITx: Two years of open online courses fall 2012-summer 2014. In Ho, AD, Reich, J., Nesterko, S., Seaton, DT, Mullaney, T., Waldo, J., & Chuang, I. (2014). HarvardX and MITx: The first year of open online courses (HarvardX and MITx Working Paper No. 1); MIT Office of Digital Learning; HarvardX Research Committee: Cambridge, MA, USA, 2015. [Google Scholar]
  18. Li, W. Zipf’s law everywhere. Glottometrics 2002, 5, 14–21. [Google Scholar]
  19. Adamic, L.A.; Huberman, B.A. Zipf’s law and the Internet. Glottometrics 2002, 3, 143–150. [Google Scholar]
  20. Gabaix, X. Zipf’s law for cities: An explanation. Q. J. Econ. 1999, 114, 739–767. [Google Scholar] [CrossRef]
  21. Fujiwara, Y. Zipf law in firms bankruptcy. Phys. A Stat. Mech. Its Appl. 2004, 337, 219–230. [Google Scholar] [CrossRef]
  22. Okuyama, K.; Takayasu, M.; Takayasu, H. Zipf’s law in income distribution of companies. Phys. A Stat. Mech. Its Appl. 1999, 269, 125–131. [Google Scholar] [CrossRef]
  23. Yamakami, T. A Zipf-like distribution of popularity and hits in the mobile web pages with short life time. In Proceedings of the 2006 Seventh International Conference on Parallel and Distributed Computing, Applications and Technologies (PDCAT’06), Taipei, Taiwan, 4–7 December 2006; pp. 240–243. [Google Scholar]
  24. Urzúa, C.M. Testing for Zipf’s law: A common pitfall. Econ. Lett. 2011, 112, 254–255. [Google Scholar] [CrossRef]
  25. Izsák, F. Maximum likelihood estimation for constrained parameters of multinomial distributions—Application to Zipf–Mandelbrot models. Comput. Stat. Data Anal. 2006, 51, 1575–1583. [Google Scholar] [CrossRef]
  26. Clauset, A.; Shalizi, C.R.; Newman, M.E. Power-law distributions in empirical data. SIAM Rev. 2009, 51, 661–703. [Google Scholar] [CrossRef]
  27. Chernoff, H.; Lehmann, E.L. The use of maximum likelihood estimates in χ2 tests for goodness of fit. Ann. Math. Stat. 1954, 25, 579–586. [Google Scholar] [CrossRef]
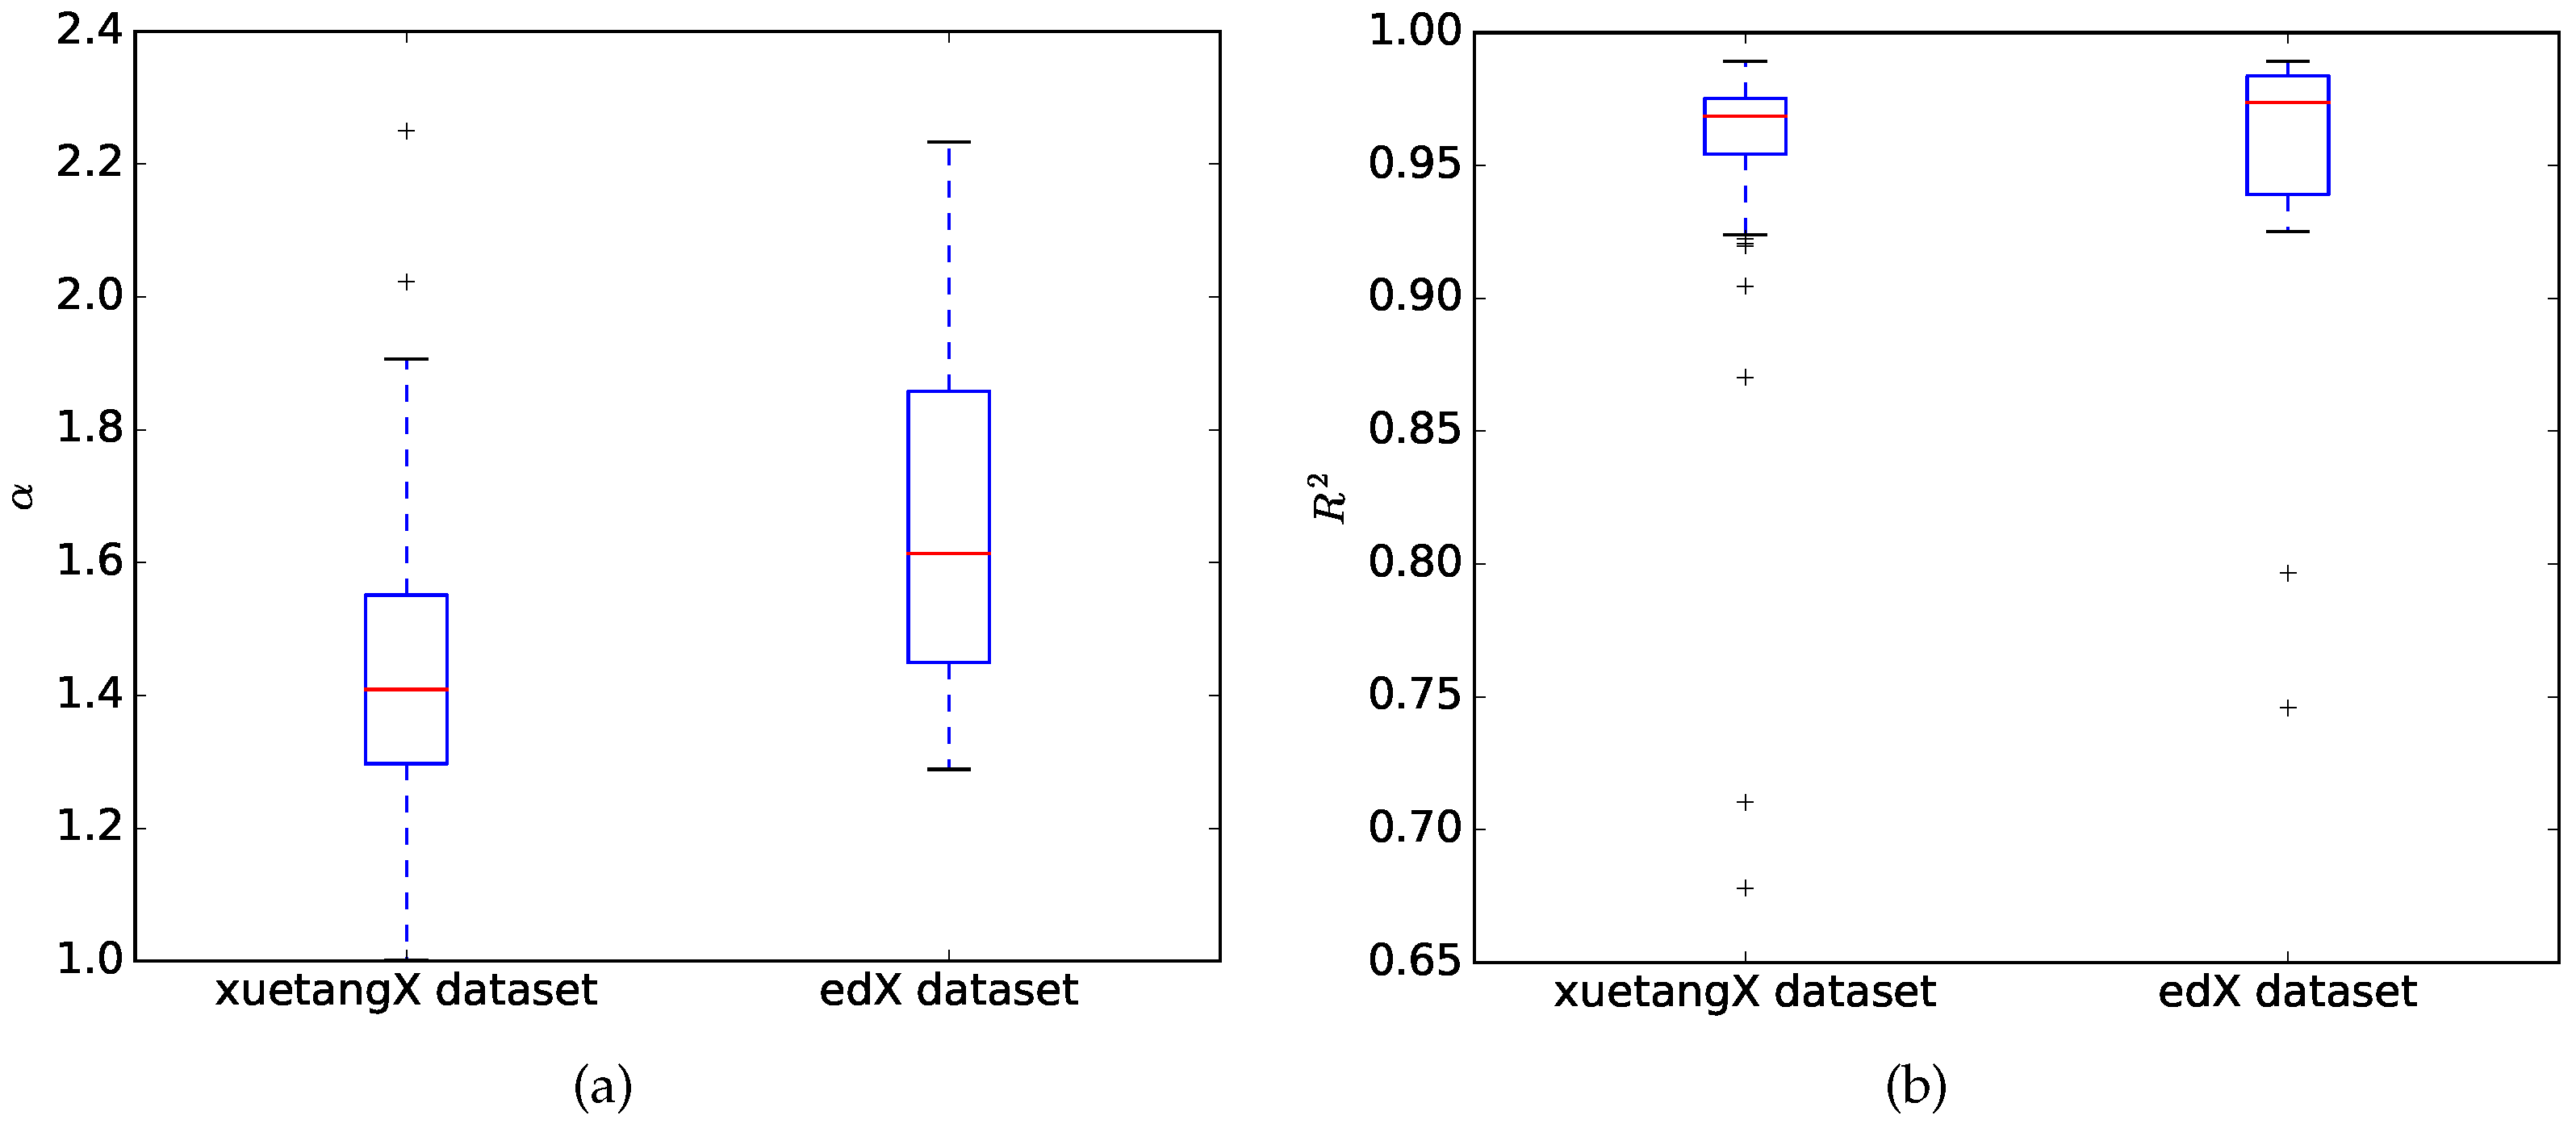
Figure 1. Registrants and participants distribution: (a) Registrants distribution; (b) Participants distribution.
Information 08 00150 g001
Figure 2. Courses across disciplines.
Information 08 00150 g002
Figure 3. Histogram of the learning coverage of a course.
Information 08 00150 g003
Figure 4. Linear regression results of six courses.
Information 08 00150 g004
Figure 5. Linear regression results: (a) The exponent parameter α ; (b) The R-squared values.
Information 08 00150 g005
Figure 6. Maximum likelihood estimation (MLE) fitting results. (a) Medical Parasitology in the xuetangX dataset; (b) Mechanics Review in the edX dataset.
Information 08 00150 g006
Figure 7. Number of participants for courses fitting and rejecting Zipf in the xuetangX dataset.
Information 08 00150 g007
Table 1. Statistics of α and p-value of the two datasets.
StatisticsxuetangX DatasetedX Dataset
α p-Value α p-Value
Mean1.30680.37071.42680.0000
Min.0.89150.00001.23520.0000
1Q1.21070.00001.28980.0000
Median1.29980.18631.42220.0000
3Q1.37090.84201.52960.0000
Max.1.97511.00001.68600.0000

