Smart Card Data Mining of Public Transport Destination: A Literature Review

1
School of Automobile and Traffic Engineering, Jiangsu University, Jiangsu 212013, China
2
School of Transportation and Logistics Engineering, Shandong Jiaotong University, Jinan 264209, China
3
College of Engineering, Texas A&M University, Kingsville, TX 77843-0100, USA
4
School of Vehicle Engineering, Xi’an Aeronautical University, Xi’an 710077, China
*
Author to whom correspondence should be addressed.
Information 2018, 9(1), 18; https://doi.org/10.3390/info9010018
Submission received: 30 November 2017
/
Revised: 5 January 2018
/
Accepted: 10 January 2018
/
Published: 13 January 2018
(This article belongs to the Section Review)
Abstract
:Smart card data is increasingly used to investigate passenger behavior and the demand characteristics of public transport. The destination estimation of public transport is one of the major concerns for the implementation of smart card data. In recent years, numerous studies concerning destination estimation have been carried out—most automatic fare collection (AFC) systems only record boarding information but not passenger alighting information. This study provides a comprehensive review of the practice of using smart card data for destination estimation. The results show that the land use factor is not discussed in more than three quarters of papers and sensitivity analysis is not applied in two thirds of papers. In addition, the results are not validated in half the relevant studies. In the future, more research should be done to improve the current model, such as considering additional factors or making sensitivity analysis of parameters as well as validating the results with multi-source data and new methods.
1. Introduction
Automated fare collection (AFC) systems are exploited by many public transit agencies [1]. Although the main purpose is to make charging and management more convenient [2], massive and continuous smart card data also can be recorded and served, which can provide lots of precious opportunities for researchers. The data can be used in various fields such as analysis of transit riders’ travel patterns [3,4,5], behavior analysis [6,7,8,9], performance assessment of bus transport reform [10,11,12,13] and planning of the public transportation system [14,15,16,17]. In the study of smart card data, the spatio-temporal information on boarding and alighting is very important [18,19,20]. Only with these records can the above analysis be more accurate and the utilization of AFC system be more efficient [21,22].
However, many AFC systems only record boarding time and boarding location [2], as most of them just need users swiping smart card at the beginning of the travel, which is called entry-only system [23]. For example, AFC system of New York City, America [24], AFC system of Chicago, America [5], public transport system of Santiago, Chile [25], AFC system of Guangzhou, China [26]. Only several AFC systems belong to entry-exit system, which need users swiping smart card both at the beginning and the end of travel, just like AFC system of South East Queensland, Australia [4], AFC system of Seoul [27]. Hence many researchers devoted themselves to inferring missing destination information for entry-only AFC systems [2,5,21,24,28,29,30]. However, these scholars used various methods and obtained different matching rate. Thus, this review focuses on the assessment of existing destination estimation research and intends to summarize the main estimation method. Then analysis the influence factors, data quality, sensitivity and validation. Specifically, this paper has three objectives: (1) Identifying the related literature by search method (2) Evaluating the quality of literature from four perspectives, that’s the comprehensiveness of factors, the perspective of sample size, matching rate and validating samples. (3) Helping researchers choose the suitable method to mining smart card data correlation about destination inferring. To our best knowledge, this is the first review about public traffic destination estimation using smart card data.
The rest of this paper covers the following sections: Section 2 provides the literature search method; Section 3 presents the search results and related analysis; Section 4 describes the quality of reviewed studies; And discussion of this paper presented in Section 5. Finally, Section 6 draws conclusions and makes suggestions for future work.
2. Methods
2.1. Search Strategy
ScienceDirect and Web of Science are the most influential and comprehensive databases in the world, and the American Society of Civil Engineers (ASCE) and Springerlink also contain work from a variety of disciplines including civil engineering, so we chose these four databases for our literature search. Three groups of search terms were used: (1) smart card, IC card, public transit fare card; (2) Automated Fare Collection, AFC, Automated Data Collection Systems; and (3) OD matrix, destination estimation, travel trajectory. To match the feature of different databases, these keywords must be combined differently. Also, the references of the literature should be reviewed.
2.2. Inclusion and Exclusion Criteria
To plug the eligible articles, the paper must meet the following conditions: (1) Be published in English. (2) Use the smart card data as its data source. (3) Related to estimation of passengers’ destination.
Subject to language restrictions, this paper mainly refers to literature published in English. In addition, most excellent research present the fruit in English. So, we set the first condition. There are lots of studies estimate public traffic destination using mobile phone signaling data or video data, while this paper focus on smart card data, so we set the second condition. For many researchers have analyzed the transit riders’ travel patterns, travel behavior or performance of bus transport reform, this review mainly considers the estimation of passengers’ destination, so we set the third condition.
2.3. Data Extraction
In order to standardize the literature information, this paper adopts matrix method to extract key factors. Main projects include studying characteristics (e.g., author, institution of the writer, journals, year, keywords), models (e.g., trip-chain model, attraction rate model, deep-learning model), factors (e.g., boarding time and location, land use, walking distance), matching rate, validated samples, results and analysis.
2.4. Quality Assessment
In order to evaluate the quality of references, this paper selects four dimensions and ten indexes to assess, that is: (1) Accessing comprehensiveness of factors; (2) Assessing data collecting methodological quality; (3) Assessing method application; (4) Assessing model validation. Quality assessment form is shown in Table 1.
Regarding the factors that affect the passengers to select the alighting stops, main elements mentioned in recent studies including network density, bus stops density, the convenience of transfer, the land use characteristics of alighting stops, ridership, travel times, walking distance and activity duration. This paper divides these factors into three categories, concretely, transfer information (including the convenience of transfer, ridership, travel times, walking distance and activity duration), public transport network (including network density and bus stops density) and land use.
There are many errors (e.g., system error, user error, device error) which may generate in the data collection process [31], therefore it’s vital to assess smart collection data quality. Three indicators are taken into consideration, namely, sample size, whether data cleaning and data description is done. We choose these indicators for the reason that sample size is one of the major issues affecting the accuracy of the estimation, data cleaning is another influence factor and description of matching data can reflect the utilization of the data.
In order to appraise the methodological quality, the assessment checklist comprises two standards: detail level about algorithm description and matching rate. The matching rate reflects the suitability of the model and high matching rate means the model can infer most of the destination, while low matching rate means that the model need to be improved.
If the paper has a sensitive analysis of the key factors (e.g., walking distance or transfer time), maybe he can choose an appropriate parameter. Thus, the sensitivity analysis is included in the model assessment. Finally, using the survey data or real alighting data to validate the model is very necessary.
3. Result
The literature search and selection process are shown in Figure 1. The papers searched from databases are 2445 (ScienceDirect), 2037 (Web of Science), 1184 (Springer), 367 (ASCE). After stripping out the repeated literature, a total of 984 papers are left, then after browsing the titles and abstracts, 231 papers are left. There are three reasons for removing ineligible papers: irrelevant to destination estimation main data source is not smart card data but GPS data or AVL data, different titles with the same content. Thus, 17 publications are extracted. After reading the reference list of related reviews, potential papers are identified. Eventually, 20 published paper are included in this review, which is shown in Table 2.
3.1. Features of Reviewed Studies
The main selected information extracted from 20 papers are shown in Table 2. From the view of the geographical region of the studies, the research is mainly distributed within 9 countries including China (n = 4), America (n = 6), Australia (n = 2), Canada (n = 1), Chile (n = 2), England (n = 1), Korea (n = 1), Netherlands (n = 1) and Portugal (n = 1).
From the application of the method, trip chaining model is widely used, especially in China, America and England, because in these countries most AFC systems are entry-only systems. While research in Korea, Australia, Chile and Netherlands is focused on the validation of the trip-chaining model, because these countries have entry-exit AFC systems. In addition, the probability model is mainly used in China. Deep learning model is used in China and Korea.
3.2. Main Destination Estimation Model Description
3.2.1. Trip Chaining Model
Trip chaining model was first applied by Barry et al. [24] to infer the origin and destination trip tables, which is based on two key assumptions: the alighting station of the current subway trip is the aboard station of next subway trip and most riders end their last journey of the day at the station where they begin their first trip of the day.
Two years later, J Zhao [5] improved the theory by putting forward three hypotheses. Firstly, there is no other mode of transportation (e.g., car, motorcycle, bicycle, etc.) between two consecutive trips. Secondly, travelers will not walk a long distance when transferring. Thirdly, travelers will end their last trip of the day at the station where they begin their first trip of the day.
These three basic assumptions especially the latter two hypotheses are widely used in research including bus-bus, bus-rail and rail-rail trips. Such as J Zhao et al. [5], Cui [33], Trepanier et al. [2], Barry et al. [23], Nassir et al. [34], Daming Li et al. [21], Munizaga and Palma [25,28], António A. Nunes et al. [35] and Alsger Azalden et al [30]. In the process of model application, many researchers continue to revise these assumptions in order to obtain better inferring performance.
As to the first hypothesis, there is still no improvement. Because if someone chooses private transportation instead of taking the public transport system, his travel tracks cannot be tracked by smart card. However, due to the popularity of the public bicycles, especially in China, this assumption may be extended by relaxing the condition of the second hypothesis. For example, if a passenger rides public bicycle to next bus stop after getting off the bus, the distance between the first alighting station and the next aboard station may be more longer than walking distance.
For the second hypothesis, there are two commonly parameters, walking distance and walking time. The maximum walking distance is various in different papers. Zhao et al. [5] set the acceptable walking distance as 1320 feet, that’s 402 m. The tolerance distance Trépanier et al. [2] selected is 2000 m, while Cui [33] uses 1100 m. Wei Wang et al. [36] and Marcela Munizaga et al. [25,28] both applied 1000 m as the upper limit. Azalden Alsger et al. [35] set 800 m and António A. Nunes et al. [1] set 640 m. Azalden Alsger et al. [30] accesses the matching rate under different walking time. Table 3 shows the maximum walking distance applied in current research.
As for the third assumption, some researchers also made improvement, because the third assumption cannot infer the destination of single trip, which may lead to lower matching rate. Trépanier et al. [2] carry out that when dealing with the single trip, we need pair them with history data to obtain more personal travel potential information. According to the hypothesis, the time of a day is 0:00 to 23:59 but Munizaga et al. [28] find that many activities in the midnight are a continuation of the previous day, thus the time of a day should be from 4:00 to 3:59 of next day.
3.2.2. Probability Model
This model is first applied by Dou Huili et al. [37] to estimate passengers’ OD matrix. The main idea of the model is to calculate the alighting probability of the rest station, considering travel distance and passenger number. More importantly, this paper finds an interesting regularity, that passengers’ travel distance is in according with the Poisson Distribution.
This model was cited by Rong-Zhen Wu et al. [38], Yang W et al. [39]. Zhang M et al. [40] improved this model by adding factors of station transfer capacity and land use level around the station. The station transfer capacity can be computations through the number of bus routes. The land use level around the station can be computed by boarding number.
3.2.3. Deep Learning Model
With the successful application of Artificial Intelligence (AI) in various fields, many researchers use AI (Deep learning is one branch of the AI family) to solve traffic problems, such as travel mode choice predication [41], short-term traffic flow prediction [42] and destination forecast of bus passengers [29,43].
In China, Yu Jie [43] first applied a modified BP artificial neural network to estimate the bus OD matrix. The input variable of the model is boarding number and the output variable is alighting number. Then this paper uses the investigated bus OD data to train the model. But one deficiency of this paper is that the training data only has six groups, although the result is ideal, this model needs a big dataset to train the test set. Another insufficient is that only one variety cannot explain the complex public travel behavior.
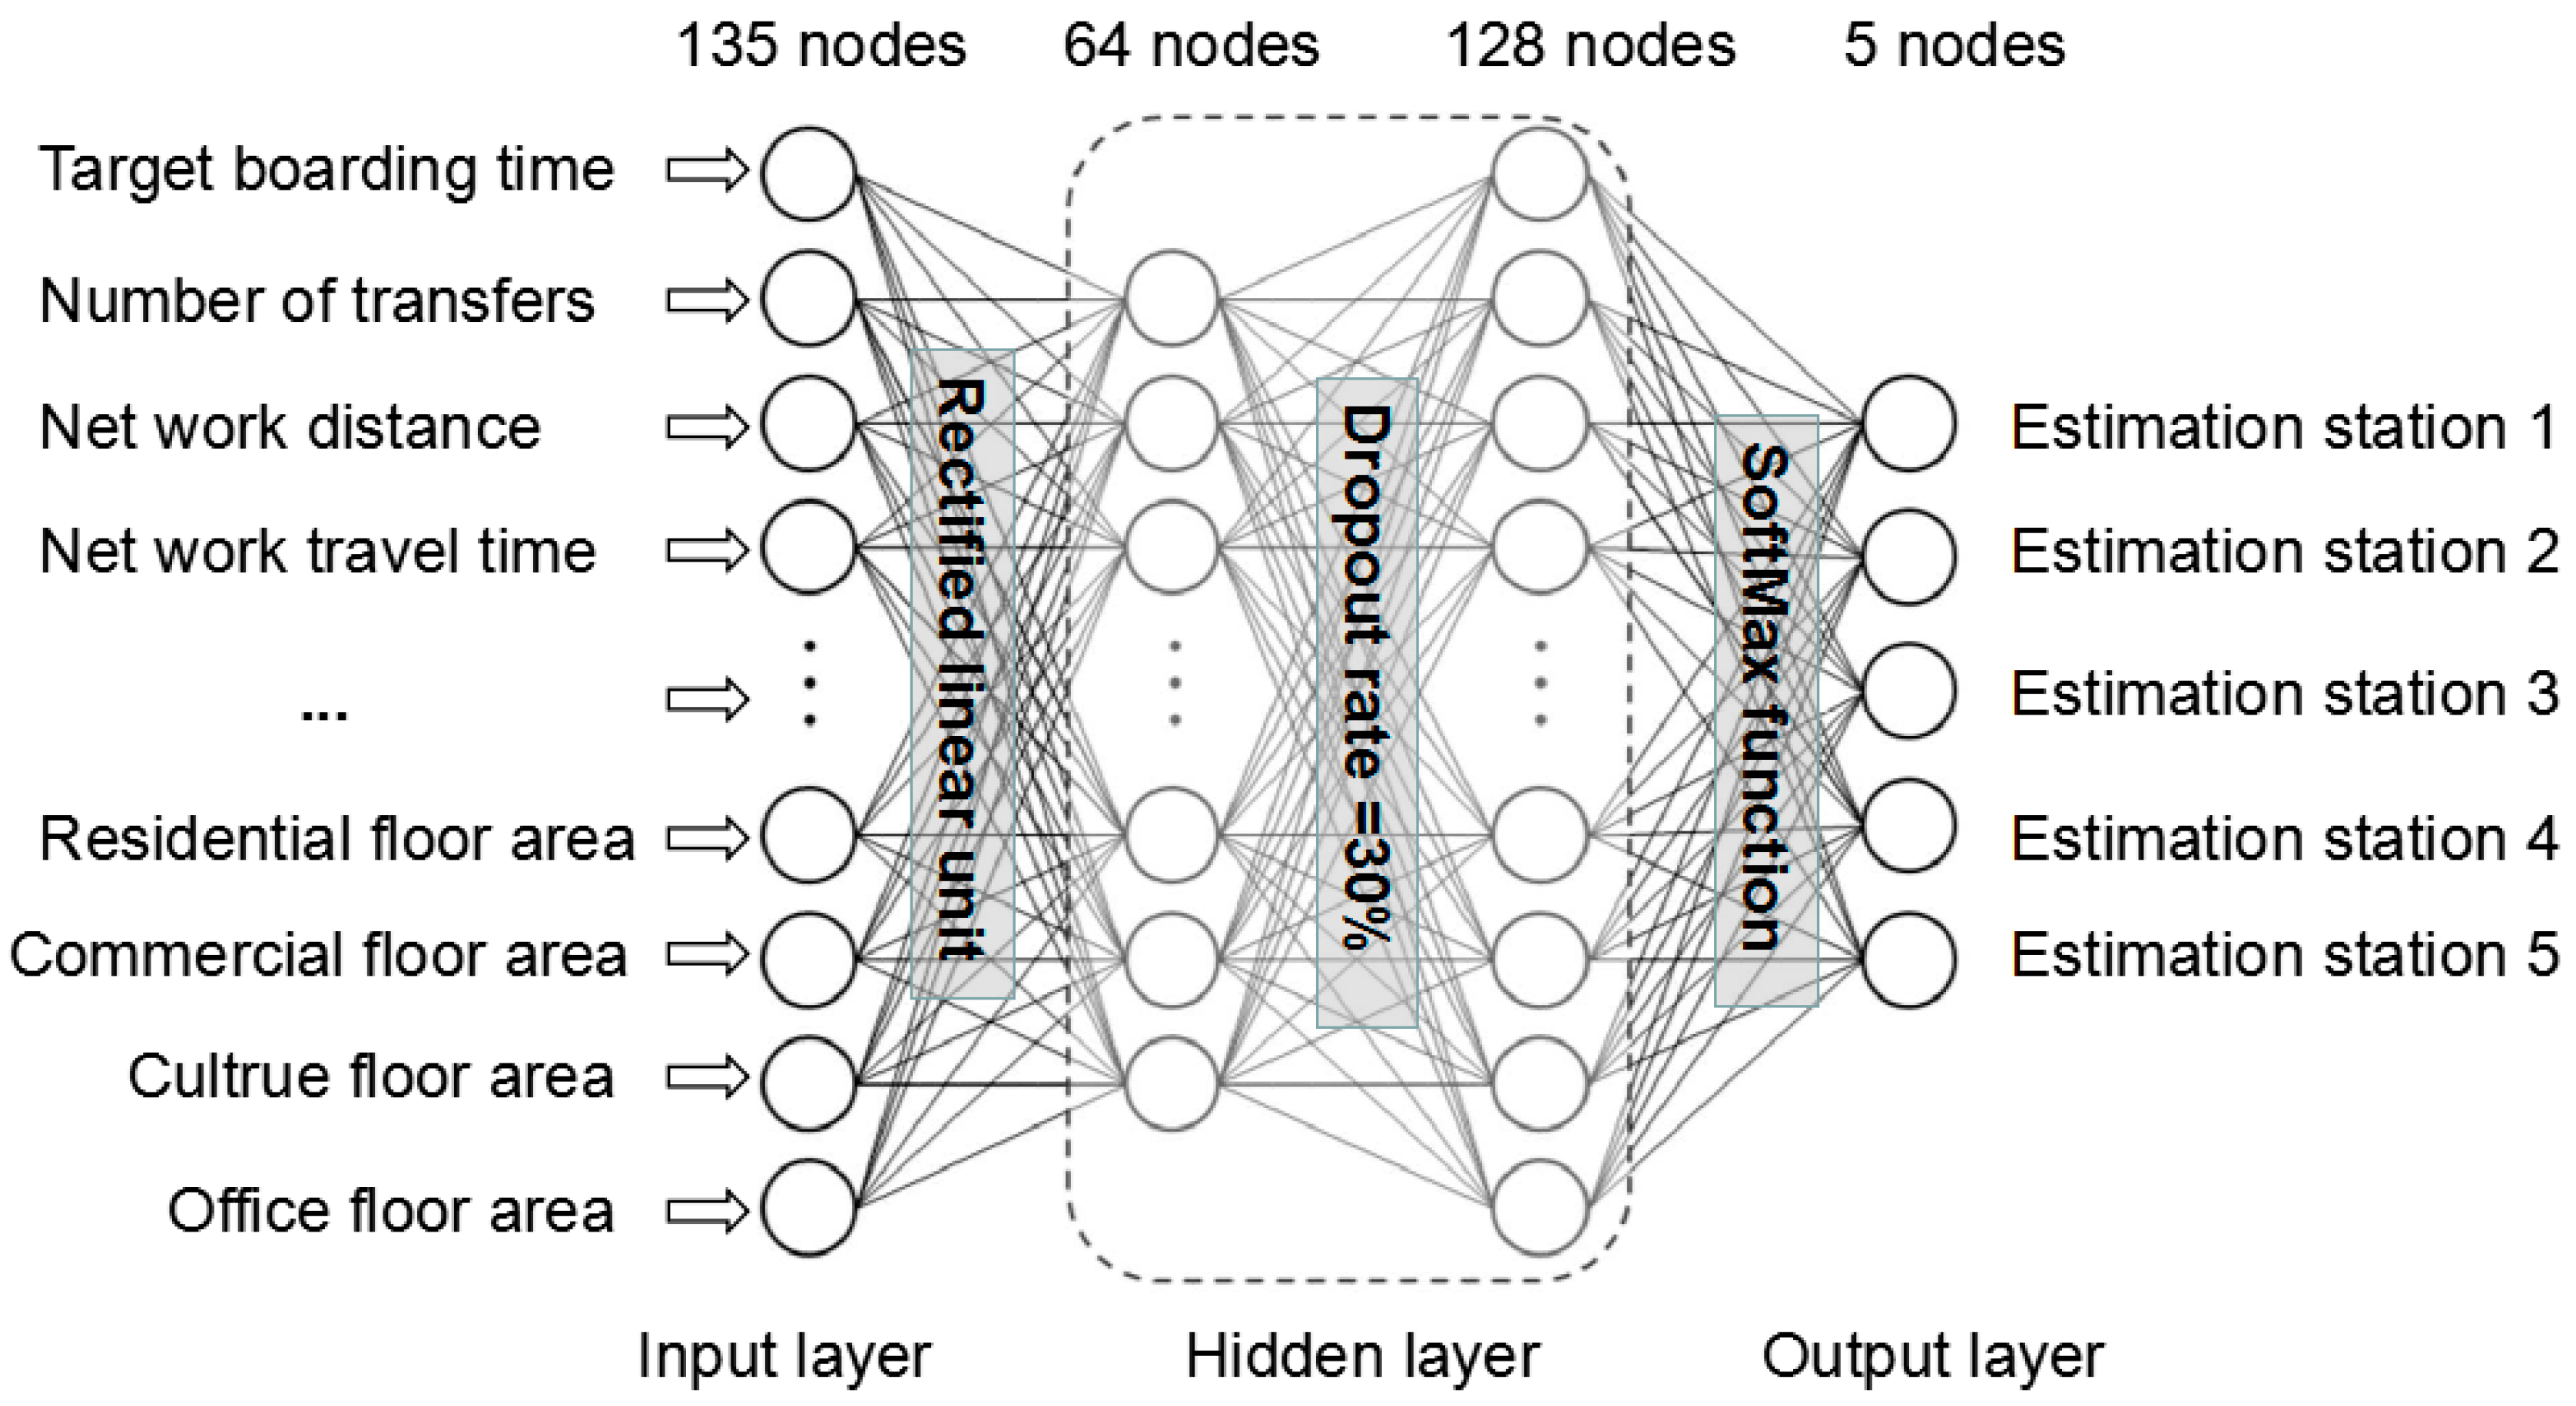
In Korea, Jaeyoung Jung et al. [29] developed a deep-learning model to estimate the alighting number utilizing smart-card data and land-use data. This research constructs a model architecture with four layers, including one input layer, one output layer and two hidden layers. The total nodes of input layer are as many as 135, containing transaction variable (e.g., target boarding time, number of transfers, network travel times, generalized travel times) and land-use variable (e.g., residential floor area, commercial floor area, cultural floor area). The two hidden layers respectively contain 64 nodes and 128 nodes and it is activated by input layer through rectified linear unit. In addition, the dropout rate which set to prevent over fitting is 30%. For classification, a softmax function is applied in the output layer. The deep learning model is presented in Figure 2, which is drown based on the original literature, for an overview of the deep learning model.
3.2.4. Comparison of Three Models
Through the above analysis, the advantages and disadvantages of the three methods are shown in Table 4. The main advantage of trip chaining model is that it just requires smart card data and the algorithm is relatively simple compared with probability model and deep learning model. Forecast the destination of each passenger is another advantage of this model. But it’s difficult to validate the model. The merit of probability model is that it takes into account more comprehensive factors. But this model can only infer the total on-off passenger number. As to the deep learning model, the considerations are very comprehensive and it can infer the alight station of each passenger, in addition, it can be validated by real travel data. But this model can only be used in entry-exit AFC systems and it need abundant data, which is hard to obtain.
3.3. Analysis of Influence Factors
When inferring the destination of alighting station using smart card, researchers considered different factors, to some extent, these factors affected the quality and performance of the model. The main factors and the range of matching rate in previous studies are compared in Table 5. This paper will analyze the influence factors from two sides, one is the analysis of different studies under the same model, another is analysis of different models.
Firstly, the comparison of influence factors considered by different authors under the same model is shown in Table 5. Obviously, Jung et al. [29] considered the most comprehensive factors, not only containing transactions variable (e.g., boarding locations and time, alighting locations and time) and transport network variable (e.g., bus stop /line density) but also including the land use variable. Neural network algorithm was also used by Y Jie [43], who only applied two factors but not fully utilized the advantage of algorithm.
M Zhang [40] took the boarding locations /time, boarding passengers numbers and land use into account, however H L Dou [37] did not assess the effect of land use. The matching rate of two research is only one percent different.
As to the trip-chaining model, the main consideration is boarding locations/time and walking time/distance. AA Nunes [1] also took the travel zone into consideration to have an endogenous validation for improving matching accuracy. Most inferred result ranges from 65.9 to 95.4%. Despite the additional validation rules set by AA Nunes [1] the result of 62.4% is lower than the overall level. In addition, LF Zhang [44] chose the Doubly-constrained Growth Factors Method including faction of travel zone and boarding passengers to estimate the OD matrix, while this paper did not give the result.
Secondly, comparing the variable of different models, it is clear that the deep learning model is more comprehensive than the trip chaining and probability models. The key factors of probability involve boarding number and network travel distance. Boarding locations/time and walking time are the critical points of trip chaining model.
Just from the matching rate, this paper cannot infer which factor made an outstanding contribution. Despite four factors, ‘boarding locations/time,’ ‘numbers of boarding passenger,’ ‘network travel time/distance’ and ‘land use,’ which were employed by probability model worked well, it is still impossible to say that’s the key factors, for there are many other hidden obstacles that may affect the outcome, such as sample size or data cleaning.
3.4. Date Quality Analysis
This section focuses on the analysis of data quality from three aspects, namely; sample size, data cleaning and results discussion.
3.4.1. Sample Size
Because the sample size is one of critical issues affecting the performance of destination estimation [45], this paper makes a comparison of sample size and matching rate based on present studies, which is shown in Table 6. The sample size of recent studies ranges from 396 records to 38,000,000 records. The matching rate of 396 records is 88.74%, while, the matching rate of 38,000,000 records is 83.01% and matching rate of 6,000,000 records is 90%. So just from the sample size in different studies, it is hard to say how large the sample size is suitable, due to the different AFC systems, data quality and matching rule.
3.4.2. Data Preparation
Evidence showed that the AFC system transaction data often has some potential problems during data collecting, which may be caused by software, erroneous data, faulty hardware or the users [31]. The main existing data defections and processing methods are shown in Table 7. Three types of problem with the data are shown in Table 7: missing data (containing entries or alighting data, whole transaction, next boarding information or direction of travel), illogical values and duplicate transactions. Removing incomplete data was the main approach. While, the absent information may be filled by matching history data, instead of deleting the data directly [46]. As to the data which can be repaired through analysis or comparison, maybe it’s the best way. Summary of problems with data from smart card is provided in Table 7.
3.5. Sensitivity Analysis
To select more suitable parameters to improve the model accurate, sever authors have made some sensitivity analysis which is shown in Table 8.
AA Nunes et al. [9] and A Alsger et al. [30] both made a sensitivity analysis of walking distance. It’s interesting that according to the first research, the walking distance is 1000 m while the matching rate is highest. In the second study, walking distance of 400 m corresponds to the maximum number of estimated O-D trips. Besides walking distance, A Alsger et al. [45] pointed that simple size also had a significant impact on destination inferring results, especially the small sample size. Beyond the above-mentioned analysis, Jung et al. [29] still did a sensitivity analysis of matching criteria, which shows that when relaxing the criterion, the result was improved.
3.6. Validation
It is only after verification that the quality of algorithm can be ensured and then be generalized. While, in the current study, half of the papers validated their derived results, the rest were not. Among the validated methods, the sample data source and size are various too. Some of the date comes from artificial investigation, such as M Munizaga et al. (2014) [28], M M Zhang et al. (2014) [40], JJ Barry (2008, 2002) [23,24], J YU et al. (2006) [43], the AFC systems of those papers belong to entry-only system and the sample size is relatively small. But several validation utilized alighting data of entry-exit systems, like Jung et al. (2017) [29], A Alsger et al. (2016) [35], N Nassir et al. (2011) [34], whose sample size is enormous too. The comparison of recent study is shown in Table 9.
3.7. Possible Problems in Inferring Destination
The analysis of the possible problems in present method can provide better advice for the future algorithm improvement. Problems may be generated at all stage of destination inferring.
One of the errors arises from data collecting, which may be caused by software bug, erroneous data, faulty hardware or the faulty operation [1,25,47,48]. In order to prevent this problem from happening, cleaning the data according different rules is essential. This is mentioned in Section 3.4.2.
The other possible problem is that many trips cannot be matched successfully [1,25,49]. One of the reasons is that the maximum walking distance is not appropriate. If the walking distance is too long, two different trips may be inferred to one trip. If it is too short, many transfer trips may cannot be captured. Therefore, a distance sensitivity analysis may be a solution. The other possible situation is that it might be the next day when the passenger ends his trip since he sets off from the previous day. As to these transactions, the time of a day can be floated according the travel characters [28]. Moreover, some transactions may take other tools to continue the next trip, such as car, taxi or bicycle, by which individual tracks cannot be tracked through smart card. In this case, history transaction data can be used [2]. In addition, the next boarding station may not be the nearest to the alighting stop of previous trip, especially near the shopping area, so the matching rule” Travel will not walk a long distance when transferring.” needs improving considering the land use.
Another possible problem is that passenger may not return to the origin station at the last travel, so the matching rule “Travelers will end their last trip of the day at the station where they began their first trip of the day.” also needs to be enriched. Possible problems in existing studies are provided in Table 10.
4. Quality of Reviewed Studies
The quality of papers is shown in Table 11 According to Table 8, all studies including the transfer information, such as the convenience of transfer, ridership, travel times, walking distance, activity duration, for these factors are necessary. As to the public transport network, only 6 (30%) studies take it into account, however, the passengers are also influenced when they choose the alighting station. In selected papers, just three authors (15%) analyze the land using around station, actually, different land using features have various attraction rate and production rate, such as commercial zone may attract more people especially during the holidays. Obviously, the destination inferring model also needs to include this variable.
In terms of smart card data collection’s quality, the sample size of 4 papers (22%) is no more than 10,000 transactions, 5 studies(25%) use sample size between 10,000 and 100,000, 9 studies (55%) use more than 100,000 transactions, there are also 2 studies(10%) not mentioning their sample size. Moreover, 13 studies (65%) describe the process of data preprocessing, 7 studies (35%) do not mention it. In addition, 3 studies (15%) have a detailed matching date description and 17 studies (85%) do not describe the data in detail.
In view of method application, most research (17 studies, 85%) give an explicit algorithm flow, however, several studies (3 studies, 15%) just have a brief description, from which later researchers could not get enough information. As to the matching rate, results of 5 studies (25%) are no more than 70%, results of 8 studies (40%) are between 70% and 90%, only 4 studies’ (20%) matching rate are higher than 90%.
While, the matching rate is not the only criterion to judge the method quality, only by sensitivity analysis and validation, the destination infer model can be more convincing. As shown in Table 11, 5 studies (25%) make a sensitivity analysis, such as walking distance sensitivity analysis but most studies (15 papers, 75%) do not contain sensitivity analysis of parameters, unfortunately, those researchers may not choose the most appropriate parameters’ value. For the verification of the conclusion, 9 papers (45%) have been verified, while 11 papers (55%) did not. However, no verification, no final conclusion.
5. Discussion
The smart card data conquers a significant space in public traffic. In the application of smart card date, origin-destination estimation of public transport plays a key role. Recently plenty of researchers are interested in deducing public transport destination by using smart card data. This review mainly focuses on the inferring process and papers’ quality of various scholars. The detail discussions are as follows.
(1) Discussion of destination estimation model
There are three main models to inferring the travel destination: trip chaining model, probability model and deep learning model.
In earlier studies, the researchers mainly use trip chaining model in their papers, which is based on two basic assumptions. The first assumption is that the most likely alighting station of a passenger is the boarding station of next journey. The second is that, the last alighting station is most likely the same with the original boarding station of a day. However, with the appearance of shared bikes, the allowed maximum walking time and walking distance between two continuous public travel stations as well as the final station and the original station in a day need to be confirmed through sensitivity analysis. In addition, the time ranges of ‘a day’ also need to be redefinition according to the trip characteristics.
In the later study, probability model and deep learning model are also used to infer the alighting station. Only the total number of passengers can be estimated through probability model. The individual travel characteristics had been ignored in this model. while taking the factors of public traffic network and land use into consideration were the highlights of this model.
Deep learning was commonly successfully applied to big data analytics. Initially, scholars used BP artificial neural network to infer the destination but this paper did not give its’ total sample size, so the accuracy of the model were not explained in detail. In fact, due to the limitations of the current network learning rules, the calculated connection weight matrix may converge to the local optimal value rather than the global optimal value. Recently, a deep learning model was trained by using both boarding data and alighting data. The superiority of the model was very significant. Firstly, the variables containing trips’ temporal and spatial information. Secondly, the entry-exit AFC system gives the study a precious opportunity to verify the model, because the alighting data is available. Just like other models, this model also has some obstacles. Such as a great amount of alighting data should be provided to train the model, however it is difficult to obtain in the entry-only AFC systems.
(2) Discussion on influence factors, date quality and sensitivity analysis
In existing studies, the factors considered in the model are mainly divided into three categories, that’s the public transport network, operation (e.g., network distance, density of bus route, density of station, time table), travel information (e.g., boarding time, boarding station, travel time, walking distance ) and land use (e.g., residential floor area, commercial floor area, cultural floor area). Trip chaining model focuses on travel information, especially, boarding time, boarding station and walking distance. But it ignores the factors of land use and public transport network. Both the probability model and the deep learning model take into account three factors; however, the factors of the deep learning model are more comprehensive. But from the matching results, it is hard to say which factors play a key role in the calculation.
The sample size of recently studies range from 396 records to 38,000,000 records. The matching rate of 396 records is 88.74%, while, the matching rate of 38,000,000 records is 83.01% and matching rate of 6,000,000 records is 90%. So just from the sample size in different studies, it is hard to say how large the sample size is suitable, for the AFC systems, data quality, matching rule are different. But in one study, validation have a significant impact on alight station estimation, especially in small sample size.
(3) Discussion on validation and possible problems
Many researchers have delved into inferring the alighting station, however such effort is hard to validate on a large scale. In the early studies, some authors have validated the algorithm with survey data. Those studies are in entry-only AFC systems. In later studies, many researchers use actual alighting data to modify the model. Those data come from entry-exit AFC systems. For entry only AFC systems, in addition to manual survey data, the bus video data and mobile MAC data can also be used to validate the model, for these data can be obtained by technical means. In all research that has been validated, J J. Barry (2002) [24] obtained the highest matching rate, mainly because the metro network is simpler than the bus network.
The possible problems in the calculation process can be divided into two categories. Firstly, it is the errors produced in the data collection due to equipment failure, system malfunction or operates miss. Secondly, it is the errors that appear in data matching. For the first question, equipment inspection and data cleaning are required. Such as, check the ticket machine, eliminate or repair the missing data. For the second question, suitable matching rules, such as maximum walking distance, maximum walking time or maximum travel time, need to be set.
6. Conclusion and Future Works
In this paper, we not only threw some light on current research but also made a systematical and comprehensive review on destination estimation process. This review makes three contributions. Firstly, this review has provided a detailed discussion of estimation model, influence factors, data quality, sensitivity analysis and validation, which can provide a brief and clear glance to later scholars. The second contribution relates to evaluation of existing studies. Unfortunately, most studies did not carry out sensitivity analysis and result verification, which were necessary in the research. Thirdly, this paper provides an opportunity to improve the recent model. Although there is no modification of the algorithm in this paper, through the detailed analysis of inferring process, later researchers can improve the model base on this paper.
In the near future, the following research field may be the potential challenges for public transport destination estimation:
- Estimation model improvement: most trip chaining model mainly considers factors of boarding time, boarding station and walking distance but the land use and public traffic network information also need to be added to the model. As to the deep learning model, different function and dropout rates need to be applied when activating the node values.
- Journey validation: Even through present studies use survey data or actual transaction data to validate their model, survey data is hard to obtain. Better validation algorithms will be developed to validate the alighting matching rate.
- Diversification of data source: with the development of technological improvement, more types of data can be used to estimate the alight station, such as GPS date or AVL (Automatic Vehicle Location) date, mobile phone MAC (Media Access Control) data, public transport video data. Therefore, new algorithms based on these multi-source data will be needed.
Acknowledgments
The work in this paper was supported by Outstanding young scientists Research Award Fund Project of Shandong Province (BS2014DX011).
Author Contributions
Tian Li wrote the paper, Kaixi Yang sorted out the literature, Peng Jing and Dazhi Sun were responsible for the combing and revising the article. All authors have read and approved the final manuscript.
Conflicts of Interest
The authors declare no conflict of interest.
References
- Nunes, A.A.; Dias, T.G.; Cunha, J.F.E. Passenger Journey Destination Estimation from Automated Fare Collection System Data Using Spatial Validation. IEEE Trans. Intell. Transp. Syst. 2015, 17, 133–142. [Google Scholar] [CrossRef]
- Trepanier, M. Destination Estimation from Public Transport Smartcard Data. IFAC Proc. Vol. 2006, 39, 393–398. [Google Scholar] [CrossRef]
- Ma, X. Smart Card Data Mining and Inference for Transit System Optimization and Performance Improvement; University of Washington: Seattle, WA, USA, 2013. [Google Scholar]
- Kieu, L.M.; Bhaskar, A.; Chung, E. A Modified Density-based Scanning Algorithm with Noise for Spatial Travel Pattern Analysis from Smart Card AFC Data. Transp. Res. Part C Emerg. Technol. 2015, 58, 193–207. [Google Scholar] [CrossRef]
- Zhao, J.; Qu, Q.; Zhang, F.; Xu, C.; Liu, S. Spatio-temporal Analysis of Passenger Travel Patterns in Massive Smart Card Data. IEEE Trans. Intell. Transp. Syst. 2017, 18, 3135–3146. [Google Scholar] [CrossRef]
- Kusakabe, T.; Asakura, Y. Behavioural Data Mining of Transit Smart Card Data: A Data Fusion Approach. Transp. Res. Part C Emerg. Technol. 2014, 46, 179–191. [Google Scholar] [CrossRef]
- Blythe, P.; Bryan, H. Understanding Behaviour through Smartcard Data Analysis. Transport 2007, 160, 173–177. [Google Scholar]
- Ali, A.; Kim, J.; Lee, S. Travel Behavior Analysis Using Smart Card Data. KSCE J. Civ. Eng. 2016, 20, 1532–1539. [Google Scholar] [CrossRef]
- Briand, A.S.; Côme, E.; Trépanier, M.; Oukhellou, L. Analyzing Year-to-year Changes in Public Transport Passenger Behaviour Using Smart Card Data. Transp. Res. Part C Emerg. Technol. 2017, 79, 274–289. [Google Scholar] [CrossRef]
- Kim, K.S.; Cheon, S.H.; Lim, S.J. Performance Assessment of Bus Transport Reform in Seoul. Transportation 2011, 38, 719–735. [Google Scholar] [CrossRef]
- Pau, S.A. Using Smart Card Technologies to Measure Public Transport Performance: Data Capture and Analysis; Universitat Politècnica De Catalunya: Barcelona, Spain, 2014. [Google Scholar]
- Jin, K.E.; Ji, Y.S.; Moon, D.S. Analysis of Public Transit Service Performance Using Transit Smart Card Data in Seoul. KSCE J. Civ. Eng. 2015, 19, 1530–1537. [Google Scholar]
- Smart, M.; Miller, M.A.; Taylor, B.D. Transit Stops and Stations: Transit Managers’ Perspectives on Evaluating Performance. J. Public Transp. 2009, 12, 59–78. [Google Scholar] [CrossRef]
- Audouin, M.; Razaghi, M.; Finger, M. How Seoul Used the ‘t-money’ Smart Transportation Card to Re-plan the Public Transportation System of the City; Implications for Governance of Innovation in Urban Public Transportation Systems. In Proceedings of the 8th TransIST Symposium, Istanbul, Turkey, 17–18 December 2015. [Google Scholar]
- Gschwender, A.; Munizaga, M.; Simonetti, C. Using Smart Card and GPS Data for Policy and Planning: The Case of Transantiago. Res. Transp. Econ. 2016, 59, 242–249. [Google Scholar] [CrossRef]
- Yap, M.; Nijënstein, S.; Vanoort, N. Improving Predictions of the Impact of Disturbances on Public Transport Usage Based on Smart Card Data. In Proceedings of the 96th TRB Annual Meeting, Washington, DC, USA, 8–12 January 2017. [Google Scholar]
- Utsunomiya, M.; Attanucci, J.; Wilson, N.H. Potential Uses of Transit Smart Card Registration and Transaction Data to Improve Transit Planning. Transp. Res. Rec. J. Transp. Res. Board 2006, 1971, 119–126. [Google Scholar] [CrossRef]
- Bagchi, M.; White, P.R. The Potential of Public Transport Smart Card Data. Transp. Policy 2005, 12, 464–474. [Google Scholar] [CrossRef]
- Zhang, F.; Yuan, N.J.; Wang, Y.; Xie, X. Reconstructing Individual Mobility from Smart Card Transactions: A Collaborative Space Alignment Approach. Knowl. Inf. Syst. 2015, 44, 299–323. [Google Scholar] [CrossRef]
- Bagchi, M.; White, P.R. What Role for Smart-card Data from Bus Systems? Munic. Eng. 2004, 157, 39–46. [Google Scholar] [CrossRef]
- Li, D.; Lin, Y.; Zhao, X.; Song, H.; Zou, N. Estimating a Transit Passenger Trip Origin-destination Matrix Using Automatic Fare Collection System. In Proceedings of the 16th International Conference on Database Systems for Advanced Applications, Hong Kong, China, 22–25 April 2011. [Google Scholar]
- Karsten, N. Mifare—Little Security Despite Obscurity. In Proceedings of the 24th Congress of the Chaos Computer Club, Berlin, Germany, 27–30 December 2007. [Google Scholar]
- Barry, J.J.; Freimer, R.; Slavin, H.L. Use of Entry-only Automatic Fare Collection Data to Estimate Linked Transit Trips in New York City. Transp. Res. Rec. J. Transp. Res. Board 2009, 2112, 53–61. [Google Scholar] [CrossRef]
- Barry, J.J.; Newhouser, R.; Rahbee, A.; Sayeda, S. Origin and Destination Estimation in New York City with Automated Fare System Data. Transp. Res. Rec. J. Transp. Res. Board 2002, 1817, 183–187. [Google Scholar] [CrossRef]
- Munizaga, M.A.; Palma, C. Estimation of a Disaggregate Multimodal Public Transport Origin-Destination Matrix from Passive Smartcard Data from Santiago, Chile. Transp. Res. Part C Emerg. Technol. 2012, 24, 9–18. [Google Scholar] [CrossRef]
- Yu, C.; He, Z.C. Analysing the Spatial-temporal Characteristics of Bus Travel Demand Using the Heat Map. J. Transp. Geogr. 2017, 58, 247–255. [Google Scholar] [CrossRef]
- Han, G.; Sohn, K. Activity Imputation for Trip-chains Elicited From Smart-card Data Using a Continuous Hidden Markov Model. Transp. Res. Part B 2016, 83, 121–135. [Google Scholar] [CrossRef]
- Munizaga, M.; Devillaine, F.; Navarrete, C.; Silva, D. Validating Travel Behavior Estimated from Smartcard Data. Transp. Res. Part C Emerg. Technol. 2014, 44, 70–79. [Google Scholar] [CrossRef]
- Jung, J.; Sohn, K. Deep-learning Architecture to Forecast Destinations of Bus Passengers from Entry-only Smart-card Data. IET Intell. Transp. Syst. 2017, 11, 334–339. [Google Scholar] [CrossRef]
- Alsger, A.; Assemi, B.; Mesbah, M.; Ferreira, L. Validating and Improving Public Transport Origin-Destination Estimation Algorithm Using Smart Card Fare Data. Transp. Res. Part C Emerg. Technol. 2016, 68, 490–506. [Google Scholar] [CrossRef]
- Robinson, S.; Narayanan, B.; Toh, N.; Pereira, F. Methods for Pre-processing Smartcard Data to Improve Data Quality. Transp. Res. Part C Emerg. Technol. 2014, 49, 43–58. [Google Scholar] [CrossRef]
- Kuhlman, W. The Construction of Purpose-Specific OD Matrices Using Public Transport Smart Card Data. 2015. Available online: https://repository.tudelft.nl/islandora/object/uuid:7190712e-0913-4849-89ae-d1a1a88e66d2/datastream/OBJ (accessed on 13 January 2018).
- Cui, A. Bus Passenger Origin-Destination Matrix Estimation Using Automated Data Collection Systems; Massachusetts Institute of Technology: Cambridge, MA, USA, 2007. [Google Scholar]
- Nassir, N.; Khani, A.; Sang, G.L.; Hickman, M. Transit Stop-level Origin-destination Estimation through Use of Transit Schedule and Automated Data Collection System. Transp. Res. Rec. J. Transp. Res. Board 2011, 2263, 140–150. [Google Scholar] [CrossRef]
- Alsger, A.A.; Mesbah, M.; Ferreira, L.; Safi, H. Use of Smart Card Fare Data to Estimate Public Transport Origin-Destination Matrix. Transp. Res. Rec. J. Transp. Res. Board 2015, 2535, 88–96. [Google Scholar] [CrossRef]
- Wang, W.; Attanucci, J.; Wilson, N. Bus Passenger Origin-destination Estimation and Related Analyses Using Automated Data Collection Systems. J. Public Transp. 2011, 14, 131–150. [Google Scholar] [CrossRef]
- Dou, H.; Liu, H.; Yang, X. OD Matrix Estimation Method of Public Transportation Flow Based on Passenger Boarding and Alighting. Comput. Commun. 2007, 25, 79–82. [Google Scholar]
- Zhou, X.; Yang, X.; Wu, X. Origin-destination matrix estimation method of public transportaion flow based on data from bus integrated-circuit cards. J. Tongji Univ. 2012, 40, 1027–1030. [Google Scholar]
- Yang, W.; Wang, H.; Ye, X.; Xu, C.; Jiang, D. OD Matrix Inference for Urban Public Transportation Trip Based on GPS and IC Card Data. J. Chongqing Jiaotong Univ. 2015, 34, 117–121. [Google Scholar]
- Zhang, M.; Guo, Y.; Ma, Y. A Probability Model of Transit OD Distribution Based on the Allure of Bus Station. J. Transp. Inf. Saf. 2014, 32, 57–61. [Google Scholar]
- Nam, D.; Kim, H.; Cho, J.; Jayakrishnan, R. A Model Based on Deep Learning for Predicting Travel Mode Choice. In Proceedings of the Transportation Research Board 96th Annual Meeting Transportation Research Board, Washington, DC, USA, 8–12 January 2017. [Google Scholar]
- Polson, N.G.; Sokolov, V.O. Deep Learning for Short-term Traffic Flow Prediction. Transp. Res. Part C Emerg. Technol. 2017, 79, 1–17. [Google Scholar] [CrossRef]
- Jie, Y.U.; Yang, X.G. Estimation a Transit Route OD Matrix Using On/off Data: An Application of Modified BP Artificial Neural Network. Syst. Eng. 2006, 24, 89–92. [Google Scholar]
- Zhang, L.; Zhao, S.; Zhu, Y.; Zhu, Z. Study on the Method of Constructing Bus Stops OD Matrix Based on IC Card Data. In Proceedings of the International Conference on Wireless Communications, Networking and Mobile Computing, Shanghai, China, 21–25 September 2007. [Google Scholar]
- Alsger, A.; Tavassoli, A.; Mesbah, M.; Ferreira, L. Evaluation of Effects from Sample-Size Origin-Destination Estimation Using Smart Card Fare Data; American Society of Civil Engineers: Reston, VA, USA, 2017. [Google Scholar]
- Nagy, V. Theoretical Method for Building OD Matrix from AFC Data. Transp. Res. Procedia 2016, 14, 1802–1808. [Google Scholar] [CrossRef]
- Ma, X.; Wu, Y.J.; Wang, Y.; Chen, F.; Liu, J. Mining Smart Card Data for Transit Riders’ Travel Patterns. Transp. Res. Part C Emerg. Technol. 2013, 36, 1–12. [Google Scholar] [CrossRef]
- Robinson, S.; Manela, M. Automatic Identification of Vehicles with Faulty Automatic Vehicle Location and Control Units in London Buses’ IBUS System. Transp. Res. Rec. J. Transp. Res. Board 2012, 2277, 21–28. [Google Scholar] [CrossRef]
- Zhao, J.; Rahbee, A.; Wilson, N.H.M. Estimating a Rail Passenger Trip Origin-destination Matrix Using Automatic Data Collection Systems. Comput.-Aided Civ. Infrastruct. Eng. 2007, 22, 376–387. [Google Scholar] [CrossRef]
Figure 1.
The literature search and selection process.

Figure 2.
Overall structure of deep learning model.


Table 1.
Checklist for evaluating studies’ quality.
| Criterion | Description | Score |
|---|---|---|
| Accessing comprehensiveness of factors | 0–3 | |
| Transfer information | Include | 1 |
| Not Include | 0 | |
| Public transport network | Include | 1 |
| Not Include | 0 | |
| Land use | Include | 1 |
| Not Include | 0 | |
| Assessing smart card data collection quality | 1–5 | |
| Sample size | Small (<10,000) | 1 |
| Medium (10,000–100,000) | 2 | |
| Large (>100,000) | 3 | |
| Data cleaning | Include | 1 |
| Not Include | 0 | |
| Matching data description | Include | 1 |
| Not Include | 0 | |
| Assessing method application | 1–4 | |
| Algorithm description | Include | 1 |
| Not Include | 0 | |
| Matching rate | Low (<70%) | 1 |
| Medium (70–90%) | 2 | |
| High (>90%) | 3 | |
| Assessing model validation | 0–2 | |
| Sensitivity analysis | Include | 1 |
| Not Include | 0 | |
| Validation | Include | 1 |
| Not Include | 0 | |
Table 2.
Summary of studies included in this review.
| Reference | Pub. Year | Country | Journal | AFC Systems | Model | Tools | Data Source | Transit Model | Reference |
|---|---|---|---|---|---|---|---|---|---|
| Jung | 2017 | Korea | IET Intelligent Transport Systems | Entry-exit | Deep Learning Architecture | Python | Seoul metropolitan government | Bus | [21] |
| Azalden Alsger | 2016 | Australia | Transport Research Part C | Entry-only | Trip-Chaining Model | / | TransLink | Bus, Metro, Ferry | [28] |
| António A. Nunes | 2015 | Portugal | IEEE Transactions on Intelligent Transportation Systems | Entry-only | Trip-Chaining Model | / | STCP | Bus | [21] |
| Azalden Alsger | 2015 | Australia | Transportation Research Record | Entry-exit | Trip-Chaining Model | TransLink | Bus, Metro, Ferry | [21] | |
| Marcela Munizaga | 2014 | Chile | / | Entry-exit | Trip-Chaining Model | / | Transantiago | Bus-Metro Metro-Bus | [5] |
| Mengmeng Zhang | 2014 | China | Transport Information and Safety | Entry-only | Probability Model | SQL C/C++ | Bus company of Jinan | Bus | [11] |
| W. Kuhlman | 2014 | Netherlands | Delft University of Technology | Entry-exit | / | Biogeme | Bus, Tram and Metro | [32] | |
| Marcela Munizaga | 2012 | Chile | 12th WCTR | Entry-exit | Trip-Chaining Model | / | Transantiago | Bus and Metro | [10] |
| Daming Li | 2011 | China | Database Systems for Advanced Applications | Entry-only | Trip-Chaining Model | MYSQL C++ | Bus Company of Jinan | Bus | [10] |
| Wei Wang | 2011 | England | Public Transportation | Entry-only | Trip-Chaining Model | SQL | TfL (Transport For London) | Bus and Rail | [11] |
| Neema Nassir | 2011 | America | Transportation Research Record: | Entry-only | Trip-Chaining Model | SQL | Metro Transit | bus | [14] |
| A Reddy | 2009 | America | Transportation Research Record | Entry-only | Trip-Chaining Model | / | NYCT | Bus and Rail | [11] |
| JJ Barry | 2008 | America | Transportation Research Record | Entry-only | Trip-Chaining Model | / | NYCT | Subway, bus, ferry and tram | [7] |
| Jinhua Zhao | 2007 | America | Computer-Aided Civil and Infrastructure Engineering | Entry-only | Trip-Chaining Model | SQL C/C++ | CTA | Bus and Rail | [30] |
| Zhang Lianfu | 2007 | China | International Conference on Wireless Communications | Entry-only | Doubly-constrained Growth Factors Method | / | Bus Company of Changchun | Bus | [5] |
| Huili Dou | 2007 | China | Transport Information and Safety | Entry-only | Probability Model | / | Bus company of the City | Bus | [8] |
| Martin TRÉPANIER | 2006 | Canada | IFAC | Entry-only | Trip-Chaining Model | VB/SQL | STO | Bus | [15] |
| Jie YU | 2006 | China | Systems Engineering | Entry-only | BP Artificial Neural Network | / | Bus Company of Suzhou | Bus | [5] |
| Cui | 2006 | America | Massachusetts Institute of Technology | Entry-only | Trip-Chaining Mode | SQL | CTA | Bus and Rail | [26] |
| James J. Barry | 2002 | America | Transportation Research Record | Entry-only | Trip-Chaining Model | / | NYCT | Metro | / |
Table 3.
Maximum walking distance used by the literature.
| Maximum Walking Distance | 402 m | 640 m | 800 m | 1000 m | 1100 m | 2000 m |
|---|---|---|---|---|---|---|
| Zhao et al. (2004) | √ | |||||
| Trépanier et al. (2006) | √ | |||||
| Cui (2006) | √ | |||||
| Wei Wang et al. (2011) | √ | |||||
| Marcela Munizaga et al. (2012, 2014) | √ | |||||
| António A. Nunes et al. (2015) | √ | |||||
| Azalden Alsger et al. (2015) | √ | |||||
| Azalden Alsger et al. (2016) | √ | √ | √ |
Table 4.
Overall structure of deep learning model.
| Destination Estimation Model | Advantage | Disadvantage |
|---|---|---|
| Trip Chaining Model |
|
|
| Probability Model |
|
|
| Deep learning model |
|
|
Table 5.
Comparison of influence factors in recent studies.
| Models and Influence Factors Researchers | Jung et al. (2017) | Y Jie (2006) | M Zhang (2014) | H L Dou (2007) | A Alsger (2016, 2015); M Munizaga (2014, 2012); D Li (2011); W Wang (2011); A Reddy (2009); JJ Barry (2008); JH Zhao (2007); M Trépanier (2006); Cui (2006); James J. Barry (2002); N Nassir (2011) | AA Nunes (2015) | LF Zhang (2007) |
|---|---|---|---|---|---|---|---|
| Destination Estimation Model | Deep Learning Architecture | BP Artificial Neural Network | Probability Model | Probability Model | Trip-Chaining Model | Trip-Chaining Model | Doubly-constrained Growth Factors Method |
| Boarding locations and time | √ | √ | √ | √ | √ | ||
| Alighting locations and times | √ | ||||||
| Boarding passenger numbers | √ | √ | √ | √ | √ | ||
| Alighting passenger numbers | √ | ||||||
| Network travel times/distance | √ | √ | √ | ||||
| Number of transfers | √ | ||||||
| Walking time/distance between consecutive transactions | √ | √ | |||||
| Bus stop/line density | √ | ||||||
| Bus schedule | |||||||
| Travel zone | √ | √ | |||||
| Land use | √ | √ | |||||
| Matching rate | 60% of tight criterion 87% of relaxing criterion | 30 persons day | 90% | 89% | 65–95.4% | 62.40% | / |
Table 6.
Comparison of sample size and matching results.
| Author | Sample Size | Matching Results |
|---|---|---|
| Jung et al. (2017) | 124,513 records | 60% of tight criterion 87% of relaxing criterion |
| A Alsger et al. (2016) | 161,446 records | 76–84% |
| A A Nunes et al. (2015) | whole month of April 2010 | 62.4% |
| M Munizaga et al. (2014) | 715 records | 84.2% |
| M M Zhang et al. (2014) | NO.83 Bus of Jinan | 90% |
| M Munizaga et al. (2012) | 36,000,000 records | 80.77% |
| 38,000,000 records | 83.01% | |
| D Li et al. (2011) | Route 115 of Jinan city | 75% peak hours, 85% |
| W Wang et al. (2011) | 7386 records | 66% Northbound 65% Southbound |
| N Nassir et al. (2011) | 84,413 records | 95.4% |
| W Wang et al. (2010) | 8585 records | 62.80% |
| 12,074 records | 64.10% | |
| 24,245 records | 57.50% | |
| 10,057 records | 69.30% | |
| 17,496 records | 78.50% | |
| JM Farzin et al. (2008) | 658,000 records | 76.7% |
| JJ Barry et al. (2008, 2002) | 6,000,000 records | 90% |
| J H Zhao et al. (2007) | 2,500,000 records | 71% |
| LF Zhang et al. (2007) | Changchun morning rush hour 6:00~7:00 and evening hour 16:30~17:30 | / |
| HL Dou et al. (2007) | 396 records | 88.74% |
| M TRÉPANIER (2006) | 378,260 trips in July 2003 771,239 trips in October 2003 | 66% of all data 80% at peak hours |
| J YU et al. (2006) | Bus of NO. 41 | 30 persons-day |
| Cui (2006) | 2,736,454 records | 79% |
Table 7.
Summary of problems with data from smart card.
| Main Problems of Transaction | Processing Method | Studies |
|---|---|---|
| Missing entries/exit | Eliminated | Kusakabe T et al. (2013) N Nassir et al. (2011) A Alsger et al. (2015) A Alsger et al. (2016) |
| Missing one whole transaction in the set of a person’s travel data | Eliminated | Kusakabe T et al.(2013) N Nassir et al. (2011) A Alsger et al. (2015) |
| No next boarding information | Eliminated | Kusakabe T et al. (2013) |
| Illogical values across two attributes | Thorough analysis and subsequent pre-processing of data | A A. Nunes et al. (2015) |
| Missing the direction of travel attribute value | Checking travel direction of other transaction records with same trip, then mitigated it | A A. Nunes et al. (2015) |
| Duplicate transactions | Eliminated | A Alsger et al. (2015) |
Table 8.
Sensitivity analysis list of recent research.
| Parameter | Authors | Detailed Parameter | Main Conclusion |
|---|---|---|---|
| Walking distance | A A. Nunes et al. (2015) | 400 m 640 m 1000 m | If the allowable walking distance selected short, the risk of rejecting true positives is greater. If the allowable walking distance selected longer, the opportunity of accepting false positives will be bigger. |
| Walking distance | A Alsger et al. (2016) | 400 m 800 m 1000 m 1100 m | When the tolerable distance set 400 m, the matching rate is highest. While, when the distance drop to 800 m to 1100 m, the result not so good. If the walking distance beyond 800 m, the result has no significant difference. |
| Simple size | A Alsger et al. (2017) | Sample size from 1% to 100% of selected transactions | Sample size has a high impact of inferring error. Sample size affect the accuracy of OD matrix, especially the small sample size. |
| Matching criterion | Jung et al. (2017) | Tight criterion Relax criterion | Relaxing the criterion is in line with the biased behavior of bus users and applies to the high-density bus network of Seoul. |
Table 9.
Comparison of previous studies.
| Literature | Validation Data | Data Source | Validated Sample Size Invalidated Sample Size (*) | Validated Accuracy Invalidated Matching Rate (*) | Transit Mode |
|---|---|---|---|---|---|
| Jung et al. (2017) | AFC data | Seoul metropolitan government | 124,513 transactions | 60% of tight criterion 87% of relaxing criterion | Bus |
| A Alsger et al. (2016) | GoCard data | TransLink | 161,446 transactions | 76–84% | Bus, Metro, Ferry |
| A A. Nunes et al. (2015) | No validation | STCP | / | 62.4% (*) | Bus |
| A Alsger et al. (2015) | AFC data | TransLink | 473,525 transactions | 88% | Bus, Metro, Ferry |
| M Munizaga et al. (2014) | OD Metro surveys data | OD Metro surveys | 715 transactions (*) | 84.20% | Bus-Metro Metro-Bus |
| M M Zhang et al. (2014) | Bus surveys data | Bus surveys | Bus NO. 83 | 90% (*) | Bus |
| M Munizaga et al. (2012) | No validation | Transantiago | 36 million March 2009 (*) 38 million June 2010 (*) | 80.77% March 2009 (*) 83.01% June 2010(*) | Bus and Metro |
| D Li et al. (2011) | No validation | Bus Company of Jinan | Bus NO. 115 of Jinan (*) | 75% (*) | Bus |
| W Wang et al. (2011) | manually-surveyed bus trips | TfL | 7386 transaction (*) | 66%Northbound (*) 65%Southbound (*) | Bus and Rail |
| N Nassir et al. (2011) | No validation | Metro Transit | 84,413 transaction (*) | 60.74% (*) | Bus |
| AFC-APC-VL data | Metro Transit | 10,886 transactions | 95.4% (*) | ||
| A Reddy (2009) | No validation | / | / | / | Metro |
| JJ Barry (2008) | Bus: ride check data Metro:purchased Metrocard and ten predetermined tours | NYCT | / | / | Metro, buses, ferry, tramway |
| Jinhua Zhao(2007) | No validation | CTA rail system | 2,500,000 transaction (*) | 71.2% (*) | Bus and Rail |
| Zhang Lianfu(2007) | No validation | Bus Company of Changchun | / | / | Bus |
| HL Dou et al. (2007) | Bus surveys data | Bus company of the derived City | 396 transaction | 88.74% | Bus |
| Martin TRÉPANIER(2006) | No validation | Smart card system of the Société de transport del’Outaouais (STO) | 378,260 trips made in July 2003 771,239 trips made in October 2003 | 66% of all data 80% at peak hours | Bus |
| J YU et al. (2006) | Bus surveys data | Bus Company of Suzhou | / | 30 person-time/day | Bus |
| Cui (2006) | No validation | CTA (Chicago Transit Authority) | 2,736,454 trips (*) | 79% | Bus and Rail |
| J J. Barry et al. (2002) | Travel diary survey | NYCT and NYMTC | Group 1–100 residents with two trips, total 200 trips Group 2–200 residents more than two trips, total 590 trips | 90% | Metro |
Table 10.
Possible problems in existing studies.
| Authors | Walking Distance Exceeded Maximum Distance | The Transaction Is Single | Data Error (Duplicate Transaction Records, Missing or Illogical Data) | Passenger Does Not Return the Origin Station at the Last Travel | Mixed Transportation Modes | Wrong Estimate | The Next Boarding Station May Not Nearest to the Alighting Stop of Previous Trip |
|---|---|---|---|---|---|---|---|
| M Munizaga et al. (2012) | √ | √ | √ | √ | |||
| D Li et al. (2011) | √ | √ | √ | √ | |||
| A A. Nunes et al. (2015) | √ | √ | √ | ||||
| J H Zhao et al. (2007) | √ | √ | |||||
| W Wang et al. (2011) | √ |
Table 11.
Quality distribution of reviewed studies.
| Criterion | Description | Score | Number of Studies | Percentage |
|---|---|---|---|---|
| Accessing comprehensiveness of factors | 0–3 | |||
| Transfer information | Include | 1 | 20 | 100% |
| Not Include | 0 | 0 | 0% | |
| Public transport network | Include | 1 | 6 | 30% |
| Not Include | 0 | 14 | 70% | |
| Land use | Include | 1 | 3 | 15% |
| Not Include | 0 | 17 | 85% | |
| Assessing smart card data collection quality | 1–5 | |||
| Sample size | Small (<10,000) | 1 | 4 | 20% |
| Medium (10,000—100,000) | 2 | 5 | 25% | |
| Large (>100,000) | 3 | 9 | 45% | |
| Data cleaning | Include | 1 | 13 | 65% |
| Not Include | 0 | 7 | 35% | |
| Matching data description | Include | 1 | 3 | 15% |
| Not Include | 0 | 17 | 85% | |
| Assessing method application | 1–4 | |||
| Algorithm description | Include | 1 | 17 | 85% |
| Not Include | 0 | 3 | 15% | |
| Matching rate | Low (<70%) | 1 | 5 | 25% |
| Medium (70–90%) | 2 | 8 | 40% | |
| High (>90%) | 3 | 4 | 20% | |
| Assessing model validation | 0–2 | |||
| Sensitivity analysis | Include | 1 | 5 | 25% |
| Not Include | 0 | 15 | 75% | |
| Validation | Include | 1 | 9 | 45% |
| Not Include | 0 | 11 | 55% | |
© 2018 by the authors. Licensee MDPI, Basel, Switzerland. This article is an open access article distributed under the terms and conditions of the Creative Commons Attribution (CC BY) license (http://creativecommons.org/licenses/by/4.0/).
Share and Cite
MDPI and ACS Style
Li, T.; Sun, D.; Jing, P.; Yang, K. Smart Card Data Mining of Public Transport Destination: A Literature Review. Information 2018, 9, 18. https://doi.org/10.3390/info9010018
AMA Style
Li T, Sun D, Jing P, Yang K. Smart Card Data Mining of Public Transport Destination: A Literature Review. Information. 2018; 9(1):18. https://doi.org/10.3390/info9010018
Chicago/Turabian StyleLi, Tian, Dazhi Sun, Peng Jing, and Kaixi Yang. 2018. "Smart Card Data Mining of Public Transport Destination: A Literature Review" Information 9, no. 1: 18. https://doi.org/10.3390/info9010018
Note that from the first issue of 2016, this journal uses article numbers instead of page numbers. See further details here.